Behavioral/Cognitive
BOLD Subjective Value Signals Exhibit Robust RangeAdaptation
X Karin M. Cox and Joseph W. KableDepartment of Psychology, University of Pennsylvania, Philadelphia, Pennsylvania 19104
Many theories of decision making assume that choice options are assessed along a common subjective value (SV) scale. The neuralcorrelates of SV are widespread and reliable, despite the wide variation in the range of values over which decisions are made (e.g., betweengoods worth a few dollars, in some cases, or hundreds of dollars, in others). According to adaptive coding theories (Barlow, 1961), anefficient value signal should exhibit range adaptation, such that neural activity maintains a fixed dynamic range, and the slope of the valueresponse varies inversely with the range of values within the local context. Although monkey data have demonstrated range adaptation insingle-unit correlates of value (Padoa-Schioppa, 2009; Kobayashi et al., 2010), whether BOLD value signals exhibit similar range adapta-tion is unknown. To test for this possibility, we presented human participants with choices between a fixed immediate and variabledelayed payment options. Across two conditions, the delayed options’ SVs spanned either a narrow or wide range. SV-tracking activityemerged in the posterior cingulate, ventral striatum, anterior cingulate, and ventromedial prefrontal cortex. Throughout this network,we observed evidence consistent with the predictions of range adaptation: the SV response slope increased in the narrow versus widerange, with statistically significant slope changes confirmed for the posterior cingulate and ventral striatum. No regions exhibited areliably increased BOLD activity range in the wide versus narrow condition. Our observations of range adaptation present implicationsfor the interpretation of BOLD SV responses that are measured across different contexts or individuals.
Key words: adaptive coding; decision making; fMRI; value
IntroductionMany theories of decision making assume that choice options areassessed along a common subjective value (SV) scale (Kable andGlimcher, 2009). In line with this assumption, neural evidencehas shown that value modulates activity across several corticaland subcortical regions. In monkeys, value modulates single-unitspike rates in the orbitofrontal cortex (OFC), anterior cingulatecortex (ACC), and the striatum (for review, see Rushworth et al.,2011; Bissonette et al., 2014). In humans, value modulates BOLDsignals in the likely anatomical homologues of these regions, andalso in the ventromedial prefrontal cortex (VMPFC) and poste-rior cingulate cortex (PCC; Levy and Glimcher, 2012; Bartra etal., 2013; Clithero and Rangel, 2014).
Both monkey and human studies report an approximatelylinear relationship between value and neural activity (Padoa-Schioppa and Assad, 2006; Kable and Glimcher, 2007). This re-lationship is maintained across highly variable scales of value. InfMRI tasks, values may span a few cents (Valentin et al., 2007) or
hundreds of dollars (Kable and Glimcher, 2007). Real-world set-tings exhibit even greater variability in the possible range ofvalues.
How can a potentially infinite range of values be encodedwithin a finite range of neural activity? The efficient coding hy-pothesis states that the neural code should adapt to the presentcontext, so that a neuron exploits its entire dynamic range withinthat context (Barlow, 1961; Wark et al., 2007). In the case ofvalue, efficient coding implies that the neural code should adaptto fluctuations in the decision context, such that the range ofpossible spike rates precisely spans the anticipated range of val-ues. Therefore, optimal range adaptation implies that the slope ofthe value response function should decrease in direct proportionto increases in value range (Padoa-Schioppa, 2009).
A limited number of monkey electrophysiological studieshave investigated whether single-unit value signals exhibit rangeadaptation. These studies found the expected inverse relationshipbetween value range and neural sensitivity in the OFC and ACC(Padoa-Schioppa, 2009; Kobayashi et al., 2010; Cai and Padoa-Schioppa, 2012), although nonadapting subpopulations of OFCneurons have also been reported (Kobayashi et al., 2010).
Whether human BOLD value correlates exhibit similar rangeadaptation is unknown. Although a recent fMRI study demon-strated adaptive coding of reward prediction errors (Park et al.,2012), no imaging studies have investigated range adaptation inthe value signals evoked during decision making. fMRI evidenceof range adaptation would confirm an additional dimension ofcorrespondence between single-unit and BOLD value signals,
Received Sept. 21, 2014; revised Oct. 28, 2014; accepted Oct. 30, 2014.Author contributions: K.M.C. and J.W.K. designed research; K.M.C. performed research; K.M.C. analyzed data;
K.M.C. and J.W.K. wrote the paper.This work was supported by National Institutes of Health/National Institute on Drug Abuse Grant R01 DA029149.
We thank Nicole Cooper for providing task materials, and the MRI technologists at the Hospital of the University ofPennsylvania for their assistance.
The authors declare no competing financial interests.Correspondence should be addressed to Joseph W. Kable, Department of Psychology, University of Pennsylvania,
Philadelphia, PA 19104. E-mail: [email protected]:10.1523/JNEUROSCI.3927-14.2014
Copyright © 2014 the authors 0270-6474/14/3316533-11$15.00/0
The Journal of Neuroscience, December 3, 2014 • 34(49):16533–16543 • 16533
and would indicate that possible changes in the range of valuescould figure importantly into the interpretation of changes inBOLD value sensitivity observed across different decisionsettings.
Here, we examine the range sensitivity of BOLD value signalsin an intertemporal choice paradigm (Kable and Glimcher,2007). Analyses compared the value signals evoked by delayedpayment options that spanned either a narrow or wide valuerange. Throughout the valuation circuitry, we observed trendsconsistent with adaptive coding, and statistically significant rangeadaptation emerged in the ventral striatum (vStr) and PCC.
Materials and MethodsHealthy, right-handed young adults (18 –30 years old) were recruitedfrom the University of Pennsylvania and surrounding community. Allparticipants provided written informed consent, and study procedureswere approved by the Institutional Review Board of the University ofPennsylvania. Thirty-nine participants (13 males, 26 females) completedan initial prescan behavioral screening session. Eligible individuals (n �27; see Screening session for eligibility criteria) were invited to participatein a subsequent fMRI session. Seven of these participants are not in-cluded in our reported dataset, due to either excessive in-scanner headmovement (n � 2; see FMRI data preprocessing), fMRI task behaviorthat did not meet study criteria (n � 3; see Scan session), sleeping in thescanner (n � 1), or cancellation of the scheduled fMRI session (n � 1).The final dataset includes 20 participants (9 males, 11 females; meanage � SD, 22.1 � 2.69 years; range, 19 –28 years). All analyses of fMRIBOLD data (see fMRI data analysis) and fMRI session behavioral data(see Behavioral analyses) were restricted to this reduced dataset.
Protocol overviewWe examined the range sensitivity of value signals in the context ofintertemporal decision making. Participants completed three intertem-poral choice tasks over the course of one screening and one fMRI session.During the screening session, two tasks (1) allowed estimation of eachindividual’s discount rate, (2) provided prescan exposure to a shiftingrange of delayed option SVs, and (3) confirmed choice stability in thepresence of this shift. The fMRI task used a similar range manipulation aswas used for the screening session. For the 20 reported participants, theintersession delay varied from 2 to 14 d (mean � SD, 6.65 � 3.91 d).
Screening sessionAt the outset, participants were instructed regarding the general nature ofthe screening tasks, the incentive scheme, and the methods of payment(see descriptions below). All participants completed the first screeningtask, with presentation of the second screening task contingent upon thebehavior observed during the first. Both the screening and fMRI taskswere presented using E-Prime 2.0 software (Psychology Software Tools).
Screening Task #1 (stable range). During the first screening task, eachtrial began with the display of a central fixation dot (500 ms), which wassubsequently flanked by a pair of immediate and delayed payment op-tions (e.g., “$40 now” vs “$62 in 15 days”; position of the immediateoption randomized across trials). The participant could choose the left orright option by pressing the 1 or 0 key, respectively, within a responsetime (RT) limit of 6 s. A valid response triggered the feedback display(500 ms), which consisted of a single checkmark indicating the side of thechosen option. Following a missed trial (expired RT limit), feedbackconsisted of a centrally presented question mark. The feedback displaywas followed by a blank intertrial interval (ITI) screen of variable dura-tion (6 s minus recorded RT). The adaptive ITI was intended to discour-age participants from responding rapidly in an attempt to complete thetask quickly. Before starting the task, participants answered a series ofcomprehension questions and completed three practice trials.
The screening task presented 57 unique option pairs. For each pair,one of three possible immediate amounts ($35, $40, $45) was coupledwith a variable delayed amount (range, $44 –$97) and delay (range,1–359 d). Amounts and delays were selected so that each option pairapproximated a point of indifference for a specific discount rate, with
these rates evenly sampled across the range of study-eligible discountrates.
Discount rates were estimated through optimization routines imple-mented in Matlab (Mathworks). Temporal discounting was modeledaccording to the hyperbolic function, SV � A/(1 � kD), where SV de-notes an option’s estimated SV, A and D represent the option amountand delay, and k represents the individual’s estimated discount rate (Ma-zur, 1987). Choices were predicted with the logistic function, p(delayed) �1/(1 � �e (now � SV)), where SV denotes the delayed option’s SV, “now”represents the immediate offer, � models the slope of the logistic curve,and p(delayed) returns the probability of delayed option choice. The opti-mization process converged upon the pair of k and � values associatedwith the maximum log likelihood of observing the actual choices that theparticipant made. Since discount rates are not normally distributed, theestimated k values were log transformed before submission to statisticalanalysis.
An estimated log(k) value in the range of �2.7 to �0.9 (k of 0.002–0.136) was required for a participant to proceed to the second screeningtask. This requirement was necessary to ensure the practicality of pre-senting a wide SV range to all participants, since the wide range wasdesigned to include delayed options with very high SVs (leading to im-practically large delayed amounts for high discounters) and with very lowSVs (leading to impractically long delays for low discounters). Eightparticipants’ discount rates fell outside of the required range. These par-ticipants were dismissed and provided with both a $10 base compensa-tion payment and an added incentive payment.
The incentive payment corresponded to the option chosen on a singletrial, which was randomly selected through a series of participant-executed dice rolls. If a missed trial was selected, then the participantreceived no incentive payment. As in previous studies (Kable and Glim-cher, 2007, 2010), all incentive payments were provided through debitcards to which the funds could be remotely loaded on the appropriatedate.
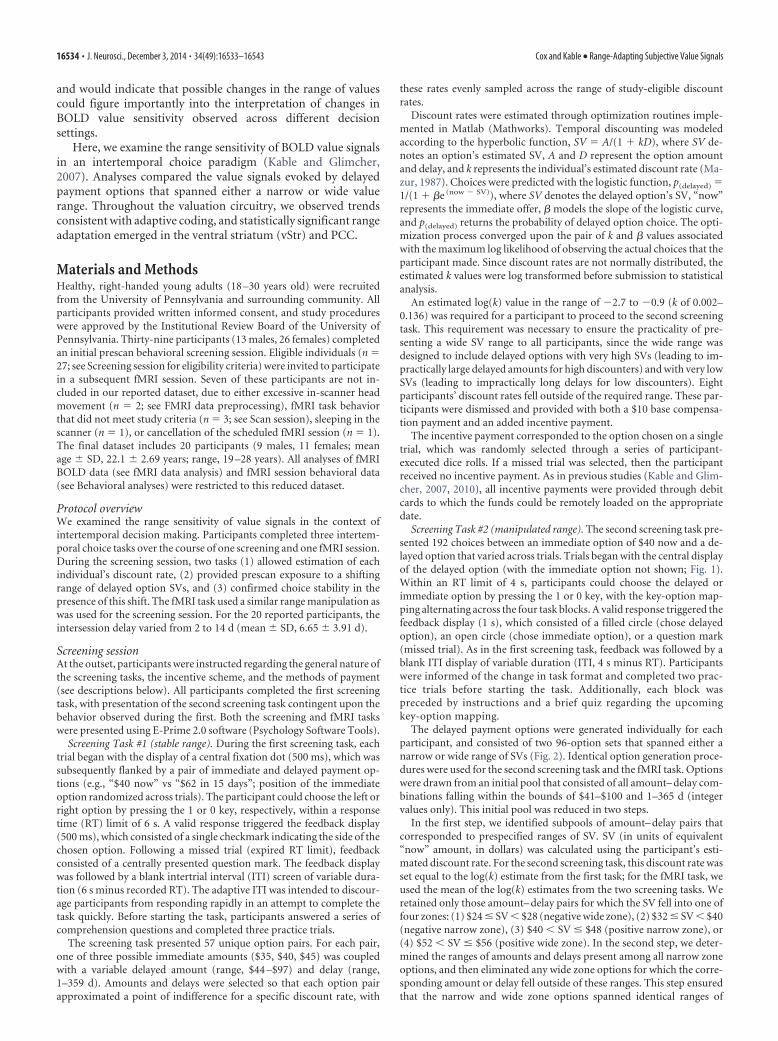
Screening Task #2 (manipulated range). The second screening task pre-sented 192 choices between an immediate option of $40 now and a de-layed option that varied across trials. Trials began with the central displayof the delayed option (with the immediate option not shown; Fig. 1).Within an RT limit of 4 s, participants could choose the delayed orimmediate option by pressing the 1 or 0 key, with the key-option map-ping alternating across the four task blocks. A valid response triggered thefeedback display (1 s), which consisted of a filled circle (chose delayedoption), an open circle (chose immediate option), or a question mark(missed trial). As in the first screening task, feedback was followed by ablank ITI display of variable duration (ITI, 4 s minus RT). Participantswere informed of the change in task format and completed two prac-tice trials before starting the task. Additionally, each block waspreceded by instructions and a brief quiz regarding the upcomingkey-option mapping.
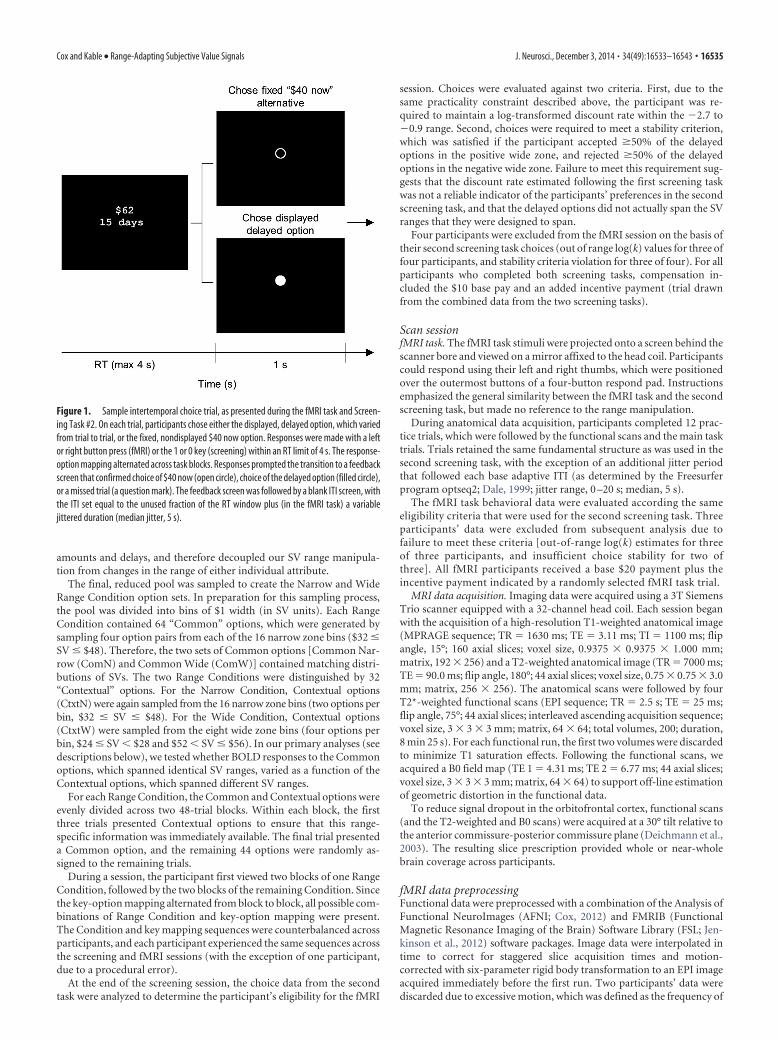
The delayed payment options were generated individually for eachparticipant, and consisted of two 96-option sets that spanned either anarrow or wide range of SVs (Fig. 2). Identical option generation proce-dures were used for the second screening task and the fMRI task. Optionswere drawn from an initial pool that consisted of all amount– delay com-binations falling within the bounds of $41–$100 and 1–365 d (integervalues only). This initial pool was reduced in two steps.
In the first step, we identified subpools of amount– delay pairs thatcorresponded to prespecified ranges of SV. SV (in units of equivalent“now” amount, in dollars) was calculated using the participant’s esti-mated discount rate. For the second screening task, this discount rate wasset equal to the log(k) estimate from the first task; for the fMRI task, weused the mean of the log(k) estimates from the two screening tasks. Weretained only those amount– delay pairs for which the SV fell into one offour zones: (1) $24 � SV � $28 (negative wide zone), (2) $32 � SV � $40(negative narrow zone), (3) $40 � SV � $48 (positive narrow zone), or(4) $52 � SV � $56 (positive wide zone). In the second step, we deter-mined the ranges of amounts and delays present among all narrow zoneoptions, and then eliminated any wide zone options for which the corre-sponding amount or delay fell outside of these ranges. This step ensuredthat the narrow and wide zone options spanned identical ranges of
16534 • J. Neurosci., December 3, 2014 • 34(49):16533–16543 Cox and Kable • Range-Adapting Subjective Value Signals
amounts and delays, and therefore decoupled our SV range manipula-tion from changes in the range of either individual attribute.
The final, reduced pool was sampled to create the Narrow and WideRange Condition option sets. In preparation for this sampling process,the pool was divided into bins of $1 width (in SV units). Each RangeCondition contained 64 “Common” options, which were generated bysampling four option pairs from each of the 16 narrow zone bins ($32 �SV � $48). Therefore, the two sets of Common options [Common Nar-row (ComN) and Common Wide (ComW)] contained matching distri-butions of SVs. The two Range Conditions were distinguished by 32“Contextual” options. For the Narrow Condition, Contextual options(CtxtN) were again sampled from the 16 narrow zone bins (two options perbin, $32 � SV � $48). For the Wide Condition, Contextual options(CtxtW) were sampled from the eight wide zone bins (four options perbin, $24 � SV � $28 and $52 � SV � $56). In our primary analyses (seedescriptions below), we tested whether BOLD responses to the Commonoptions, which spanned identical SV ranges, varied as a function of theContextual options, which spanned different SV ranges.
For each Range Condition, the Common and Contextual options wereevenly divided across two 48-trial blocks. Within each block, the firstthree trials presented Contextual options to ensure that this range-specific information was immediately available. The final trial presenteda Common option, and the remaining 44 options were randomly as-signed to the remaining trials.
During a session, the participant first viewed two blocks of one RangeCondition, followed by the two blocks of the remaining Condition. Sincethe key-option mapping alternated from block to block, all possible com-binations of Range Condition and key-option mapping were present.The Condition and key mapping sequences were counterbalanced acrossparticipants, and each participant experienced the same sequences acrossthe screening and fMRI sessions (with the exception of one participant,due to a procedural error).
At the end of the screening session, the choice data from the secondtask were analyzed to determine the participant’s eligibility for the fMRI
session. Choices were evaluated against two criteria. First, due to thesame practicality constraint described above, the participant was re-quired to maintain a log-transformed discount rate within the �2.7 to�0.9 range. Second, choices were required to meet a stability criterion,which was satisfied if the participant accepted �50% of the delayedoptions in the positive wide zone, and rejected �50% of the delayedoptions in the negative wide zone. Failure to meet this requirement sug-gests that the discount rate estimated following the first screening taskwas not a reliable indicator of the participants’ preferences in the secondscreening task, and that the delayed options did not actually span the SVranges that they were designed to span.
Four participants were excluded from the fMRI session on the basis oftheir second screening task choices (out of range log(k) values for three offour participants, and stability criteria violation for three of four). For allparticipants who completed both screening tasks, compensation in-cluded the $10 base pay and an added incentive payment (trial drawnfrom the combined data from the two screening tasks).
Scan sessionfMRI task. The fMRI task stimuli were projected onto a screen behind thescanner bore and viewed on a mirror affixed to the head coil. Participantscould respond using their left and right thumbs, which were positionedover the outermost buttons of a four-button respond pad. Instructionsemphasized the general similarity between the fMRI task and the secondscreening task, but made no reference to the range manipulation.
During anatomical data acquisition, participants completed 12 prac-tice trials, which were followed by the functional scans and the main tasktrials. Trials retained the same fundamental structure as was used in thesecond screening task, with the exception of an additional jitter periodthat followed each base adaptive ITI (as determined by the Freesurferprogram optseq2; Dale, 1999; jitter range, 0 –20 s; median, 5 s).
The fMRI task behavioral data were evaluated according the sameeligibility criteria that were used for the second screening task. Threeparticipants’ data were excluded from subsequent analysis due tofailure to meet these criteria [out-of-range log(k) estimates for threeof three participants, and insufficient choice stability for two ofthree]. All fMRI participants received a base $20 payment plus theincentive payment indicated by a randomly selected fMRI task trial.
MRI data acquisition. Imaging data were acquired using a 3T SiemensTrio scanner equipped with a 32-channel head coil. Each session beganwith the acquisition of a high-resolution T1-weighted anatomical image(MPRAGE sequence; TR � 1630 ms; TE � 3.11 ms; TI � 1100 ms; flipangle, 15°; 160 axial slices; voxel size, 0.9375 � 0.9375 � 1.000 mm;matrix, 192 � 256) and a T2-weighted anatomical image (TR � 7000 ms;TE � 90.0 ms; flip angle, 180°; 44 axial slices; voxel size, 0.75 � 0.75 � 3.0mm; matrix, 256 � 256). The anatomical scans were followed by fourT2*-weighted functional scans (EPI sequence; TR � 2.5 s; TE � 25 ms;flip angle, 75°; 44 axial slices; interleaved ascending acquisition sequence;voxel size, 3 � 3 � 3 mm; matrix, 64 � 64; total volumes, 200; duration,8 min 25 s). For each functional run, the first two volumes were discardedto minimize T1 saturation effects. Following the functional scans, weacquired a B0 field map (TE 1 � 4.31 ms; TE 2 � 6.77 ms; 44 axial slices;voxel size, 3 � 3 � 3 mm; matrix, 64 � 64) to support off-line estimationof geometric distortion in the functional data.
To reduce signal dropout in the orbitofrontal cortex, functional scans(and the T2-weighted and B0 scans) were acquired at a 30° tilt relative tothe anterior commissure-posterior commissure plane (Deichmann et al.,2003). The resulting slice prescription provided whole or near-wholebrain coverage across participants.
fMRI data preprocessingFunctional data were preprocessed with a combination of the Analysis ofFunctional NeuroImages (AFNI; Cox, 2012) and FMRIB (FunctionalMagnetic Resonance Imaging of the Brain) Software Library (FSL; Jen-kinson et al., 2012) software packages. Image data were interpolated intime to correct for staggered slice acquisition times and motion-corrected with six-parameter rigid body transformation to an EPI imageacquired immediately before the first run. Two participants’ data werediscarded due to excessive motion, which was defined as the frequency of
Figure 1. Sample intertemporal choice trial, as presented during the fMRI task and Screen-ing Task #2. On each trial, participants chose either the displayed, delayed option, which variedfrom trial to trial, or the fixed, nondisplayed $40 now option. Responses were made with a leftor right button press (fMRI) or the 1 or 0 key (screening) within an RT limit of 4 s. The response-option mapping alternated across task blocks. Responses prompted the transition to a feedbackscreen that confirmed choice of $40 now (open circle), choice of the delayed option (filled circle),or a missed trial (a question mark). The feedback screen was followed by a blank ITI screen, withthe ITI set equal to the unused fraction of the RT window plus (in the fMRI task) a variablejittered duration (median jitter, 5 s).
Cox and Kable • Range-Adapting Subjective Value Signals J. Neurosci., December 3, 2014 • 34(49):16533–16543 • 16535
sudden large head displacements (i.e., the rate of single TR displacements�0.5, in units of the six parameter estimates’ Euclidean norm; for dis-carded participants, rates were 4.8 and 7.0%, vs mean � SD rates of0.19 � 0.38% in the 20 reported participants).
Motion-corrected functional data were coregistered to the partici-pant’s anatomy and to the MNI template. The single, completefunctional-to-MNI warp consisted of (1) geometric distortion correc-tion, (2) alignment to the T2 anatomical image, (3) alignment to thehigh-resolution MPRAGE image, (4) nonlinear warping to the MNI tem-plate, and (5) restoration of the original 64 � 64, 3 mm isotropic resolu-tion. Warped images were spatially smoothed with a 6.0 FWHMGaussian kernel.
The AFNI 3dAutomask program was used to identify the brain voxelsthat were common to all participants. In each participant, a mask wascreated to label the largest contiguous region of suprathreshold intensityfound within the smoothed functional data. The intersection of the 20single participant masks was applied to all reported voxelwise fMRIanalyses.
fMRI data analysis. Each participant’s functional data were fit withfour separate general linear models (GLMs) using the AFNI program3dDeconvolve. Each GLM specified an identical baseline model, whichincluded the six motion time-series estimates, first-order throughfourth-order polynomial trend terms, and an intercept term. Regressorsof interest were modeled as delta functions, which were time-locked totrial onset and convolved with a canonical gamma hemodynamic re-sponse function. Parametric modulator regressors were constructed us-ing the mean-centered values of the corresponding parameter, and SVregressors were generated using the discount rates estimated for the fMRItask specifically. All GLMs included a regressor that indicated the occur-rence of missed trials (one trial for each of four participants); these trialswere omitted from all regressors of interest.
GLM #1: localization. The first GLM localized regions that reliablytracked SV within each Range Condition, while remaining sensitive tothe possibility that SV responses might vary across Conditions. For eachCondition, regressors estimated the mean trial response (TrialN, TrialW)and the modulation of these responses by SV (SVN, SVW). In the groupanalysis, coefficient estimates were submitted to a voxelwise joint t test ofthe Narrow and Wide Range SV effects [i.e., �(SVN) � �(SVW)]. Clustersthat survived a whole-brain corrected threshold of p � 0.05 (two-tailed)were identified using FSL randomize (cluster-forming threshold set atp � 0.0005, two-tailed, uncorrected). The localized clusters served as theregions-of-interest (ROIs) for all subsequent analyses, each of whichentailed simple contrasts performed upon each ROI (via two-tailed t test,evaluated against a significance threshold of p � 0.05).
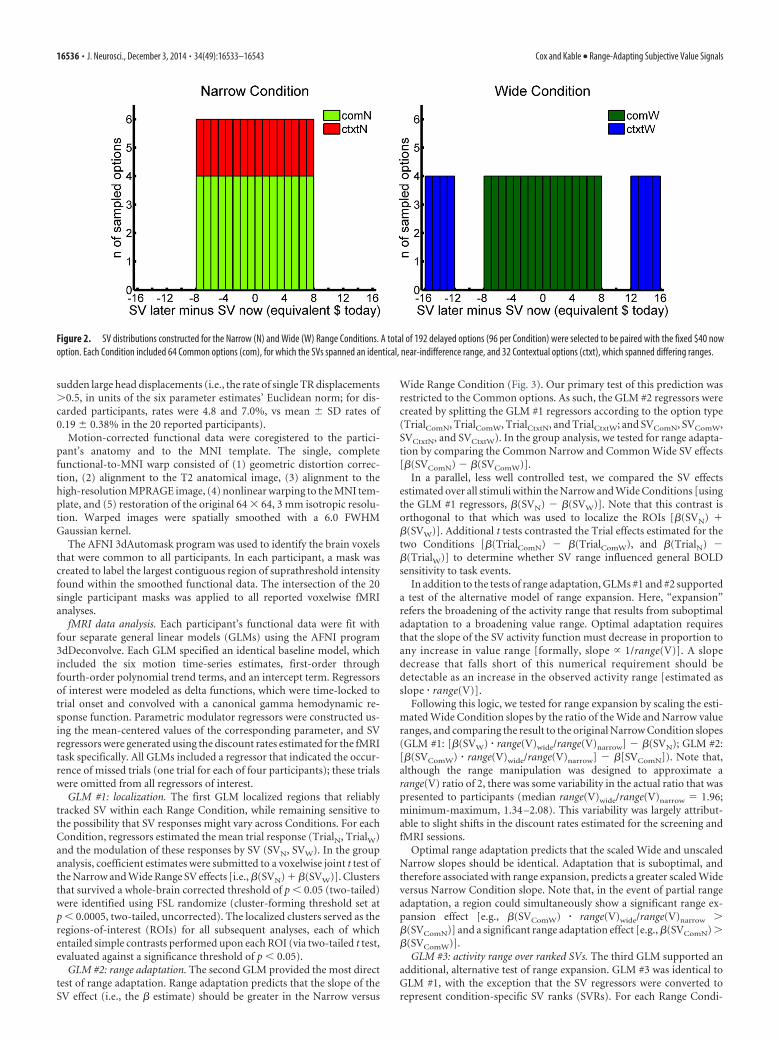
GLM #2: range adaptation. The second GLM provided the most directtest of range adaptation. Range adaptation predicts that the slope of theSV effect (i.e., the � estimate) should be greater in the Narrow versus
Wide Range Condition (Fig. 3). Our primary test of this prediction wasrestricted to the Common options. As such, the GLM #2 regressors werecreated by splitting the GLM #1 regressors according to the option type(TrialComN, TrialComW, TrialCtxtN, and TrialCtxtW; and SVComN, SVComW,SVCtxtN, and SVCtxtW). In the group analysis, we tested for range adapta-tion by comparing the Common Narrow and Common Wide SV effects[�(SVComN) � �(SVComW)].
In a parallel, less well controlled test, we compared the SV effectsestimated over all stimuli within the Narrow and Wide Conditions [usingthe GLM #1 regressors, �(SVN) � �(SVW)]. Note that this contrast isorthogonal to that which was used to localize the ROIs [�(SVN) ��(SVW)]. Additional t tests contrasted the Trial effects estimated for thetwo Conditions [�(TrialComN) � �(TrialComW), and �(TrialN) ��(TrialW)] to determine whether SV range influenced general BOLDsensitivity to task events.
In addition to the tests of range adaptation, GLMs #1 and #2 supporteda test of the alternative model of range expansion. Here, “expansion”refers the broadening of the activity range that results from suboptimaladaptation to a broadening value range. Optimal adaptation requiresthat the slope of the SV activity function must decrease in proportion toany increase in value range [formally, slope 1/range(V)]. A slopedecrease that falls short of this numerical requirement should bedetectable as an increase in the observed activity range [estimated asslope � range(V)].
Following this logic, we tested for range expansion by scaling the esti-mated Wide Condition slopes by the ratio of the Wide and Narrow valueranges, and comparing the result to the original Narrow Condition slopes(GLM #1: [�(SVW) � range(V)wide/range(V)narrow] � �(SVN); GLM #2:[�(SVComW) � range(V)wide/range(V)narrow] � �[SVComN]). Note that,although the range manipulation was designed to approximate arange(V) ratio of 2, there was some variability in the actual ratio that waspresented to participants (median range(V)wide/range(V)narrow � 1.96;minimum-maximum, 1.34 –2.08). This variability was largely attribut-able to slight shifts in the discount rates estimated for the screening andfMRI sessions.
Optimal range adaptation predicts that the scaled Wide and unscaledNarrow slopes should be identical. Adaptation that is suboptimal, andtherefore associated with range expansion, predicts a greater scaled Wideversus Narrow Condition slope. Note that, in the event of partial rangeadaptation, a region could simultaneously show a significant range ex-pansion effect [e.g., �(SVComW) � range(V)wide/range(V)narrow ��(SVComN)] and a significant range adaptation effect [e.g., �(SVComN) ��(SVComW)].
GLM #3: activity range over ranked SVs. The third GLM supported anadditional, alternative test of range expansion. GLM #3 was identical toGLM #1, with the exception that the SV regressors were converted torepresent condition-specific SV ranks (SVRs). For each Range Condi-
Figure 2. SV distributions constructed for the Narrow (N) and Wide (W) Range Conditions. A total of 192 delayed options (96 per Condition) were selected to be paired with the fixed $40 nowoption. Each Condition included 64 Common options (com), for which the SVs spanned an identical, near-indifference range, and 32 Contextual options (ctxt), which spanned differing ranges.
16536 • J. Neurosci., December 3, 2014 • 34(49):16533–16543 Cox and Kable • Range-Adapting Subjective Value Signals
tion, SVs were ranked using the Matlab “tiedrank” function, which as-signs ascending ranks to ascending numerical values, and a mean rank toany repeating values (e.g., for [40 50 50], rank � [1 2.5 2.5]). Since thetwo Range Conditions span identical ranges of SVR (1–96), expansion ofthe activity range should be manifested as a steepening of the slope of theSVR effect within the Wide Condition [in other words, �(SVRW) ��(SVRN) � 0; Fig. 3f]. Note that this contrast was not restricted to theCommon stimuli, since the unrestricted stimulus sets already spanmatching ranges of the predictor variable (SVR).
GLM #4: activity visualization. The fourth GLM enabled visualizationof the ROIs’ activity profiles. For each Range Condition, the 96 trials weresorted by ascending SVR and split across 12 eight-trial bins. GLM #4included 24 regressors (two Range Conditions � 12 Bins) that modeledthe mean BOLD response to the trials corresponding to each bin. Foreach ROI, the resulting 24 coefficient estimates were plotted against boththe median SVs and median SVRs for each bin.
GLM #4 also supported a test of range expansion. For each RangeCondition, we estimated the activity range by contrasting the estimatedcoefficients for the two most extreme bins (12 and 1). Range expansionpredicts that the contrast result should be greater for the Wide versus NarrowRange Condition [(�(BinW12) � �(BinW1)) � (�(BinN12) � �(BinN1)) � 0].
Behavioral analysesCross-range comparisons of choice behavior. Our fMRI analyses assumedthat discount rates remained stable across the two Range Conditions. Totest for possible violation of this assumption, we estimated participants’discount rates for the two Range Conditions separately. Estimates wereobtained using both the Common options in isolation (allowing forcomparisons across similar value ranges) and the combined Commonand Contextual options (allowing for the derivation of estimates overlarger pools of choice data). In each case, the resulting log(k) estimateswere compared with a paired t test.
The separate regression fits also informed analyses of choice consis-tency. These analyses asked whether the increased BOLD sensitivity to SVin the Narrow Range Condition corresponded to improved discrimina-tion between SVs during the choice process. In an initial test, we com-pared the two logistic function slopes to determine whether the slope
increased in the Narrow versus Wide Range Condition. Since logisticslope estimates are sensitive to the range of the predictor variable, weperformed a single t test using the Common stimuli alone, and minordifferences in the SV ranges (created by the minor differences in theCommon Narrow and Common Wide k estimates) were included as acovariate. Second, using the same t test structure (Common-only restric-tion, range difference covariate), we compared the percentage of choicesthat were successfully predicted by the estimated discount rates, where adelayed choice is predicted if SV � 40. A greater percentage of choicespredicted in the Narrow Range would be expected in the event of im-proved SV discrimination during decision making.
Range effects on RT. In keeping with classical distance effects in percep-tual and cognitive judgments (Festinger, 1943; Moyer and Landauer,1967), RTs typically increase as choices become more “difficult,” wheredifficulty is defined in terms of decreasing distance between two options’SVs (Soltani et al., 2012; De Martino et al., 2013). A series of RT analysesasked whether the increased neural SV sensitivity of the Narrow Rangecondition was associated with an enhanced distance effect. Under theassumption of a fixed range of choice RTs, which is fully exploited ineach context, one might anticipate that the relationship between dis-tance and RT might become more pronounced within the NarrowRange Condition.
The RT analyses paralleled those that were used to seek range effects inthe fMRI data. First, for each participant and Range Condition, we re-gressed RT against SV distance [SVD; abs(SV � $40)]. The reliability ofthe distance effect was confirmed through a joint t test of the separatelyestimated slope coefficients [�(SVDN) � �(SVDW)]. Identical analysesthat substituted SVD with SV did not yield a significant contrast result[for �(SVN) � �(SVW), p � 0.45].
Second, to test for range effects, we conducted similar Condition-specific regressions using the Common options alone. Range adaptationpredicts that RT should be more sensitive to SVD in the Narrow versusWide Range Condition [i.e., �(SVDComN) � �(SVDComW) � 0]. Thiscontrast was repeated using the coefficients estimated for the combinedCommon and Contextual stimuli [�(SVDN) � �(SVDW)]. As an initialtest for range expansion, we scaled the Wide Condition slopes by the ratio
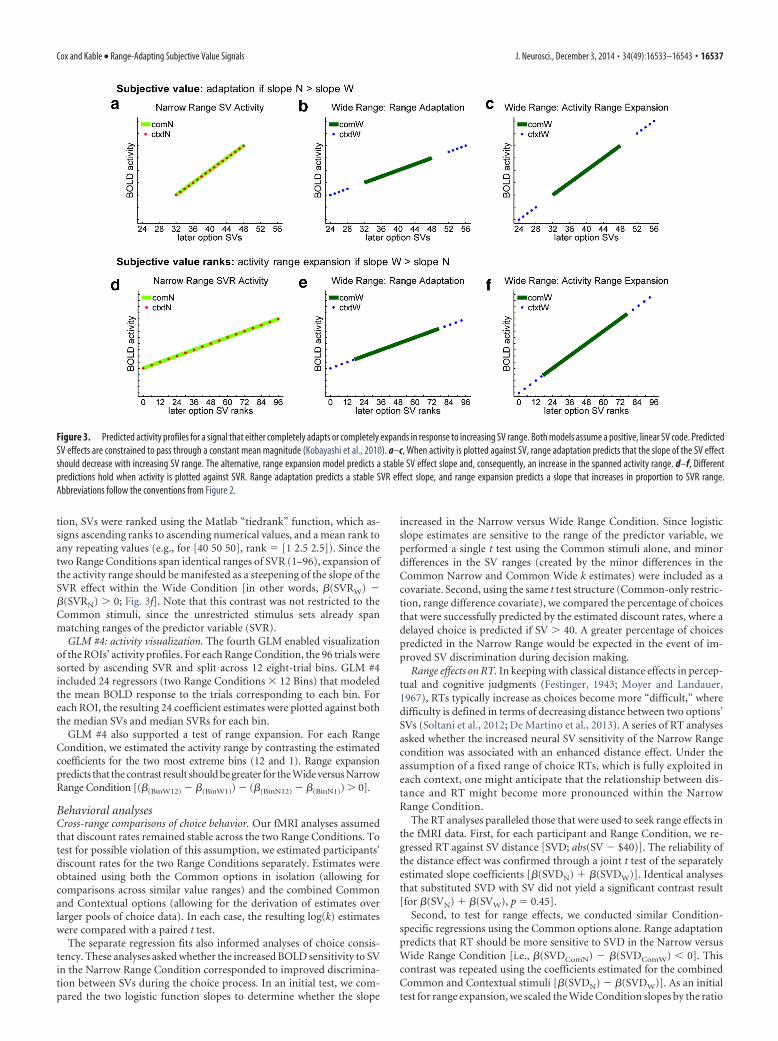
Figure 3. Predicted activity profiles for a signal that either completely adapts or completely expands in response to increasing SV range. Both models assume a positive, linear SV code. PredictedSV effects are constrained to pass through a constant mean magnitude (Kobayashi et al., 2010). a–c, When activity is plotted against SV, range adaptation predicts that the slope of the SV effectshould decrease with increasing SV range. The alternative, range expansion model predicts a stable SV effect slope and, consequently, an increase in the spanned activity range. d–f, Differentpredictions hold when activity is plotted against SVR. Range adaptation predicts a stable SVR effect slope, and range expansion predicts a slope that increases in proportion to SVR range.Abbreviations follow the conventions from Figure 2.
Cox and Kable • Range-Adapting Subjective Value Signals J. Neurosci., December 3, 2014 • 34(49):16533–16543 • 16537
of the Wide and Narrow SVD ranges (again 2 across participants: median,1.77; minimum-maximum, 1.25–2.04). Range expansion predicts a steeperscaled Wide versus Narrow Condition slope [�(SVDComWscaled) ��(SVDComN) � 0; �(SVDWscaled) � �(SVDN) � 0].
Range expansion was additionally tested by regressing RT against theCondition-specific SVD ranks (SVDRs). Again, range expansion predictsa steeper, more negative slope for the Wide versus Narrow Range Con-dition [i.e., �(SVDRW) � �(SVDRN) � 0].
Finally, the RT effects were visualized by grouping each Condition’strials into 12 uniformly sized bins (8 trials/bin; SVDR ascending acrossbins). Mean bin RTs were plotted against both the median SVs and SVRsfor each bin. As a final test of range expansion, we estimated Condition-specific RT ranges by contrasting the most extreme bins (12 and 1);range expansion predicts a more extreme (i.e., more negative) con-trast result for the Wide versus Narrow Condition [(mean(BinW12) �mean(BinW1)) � (mean(BinN12) � mean(BinN1)) � 0].
ResultsDuring fMRI scanning, participants completed 192 uniquechoices between a fixed $40 now option and variable delayedalternatives (e.g., $62 in 15 d; Fig. 1). Individual participant dis-count rates, which had been estimated during a previous screen-ing session, were used to construct separate conditions in whichthe delayed options spanned either a narrow or wide range of SVs(Fig. 2). Each Range Condition contained 64 Common optionsfor which the SVs spanned a matching near-indifference range.The Conditions were distinguished by 32 Contextual options,which were drawn from either the same near-indifference range
(in the Narrow Condition) or more extreme SV ranges (in theWide Condition).
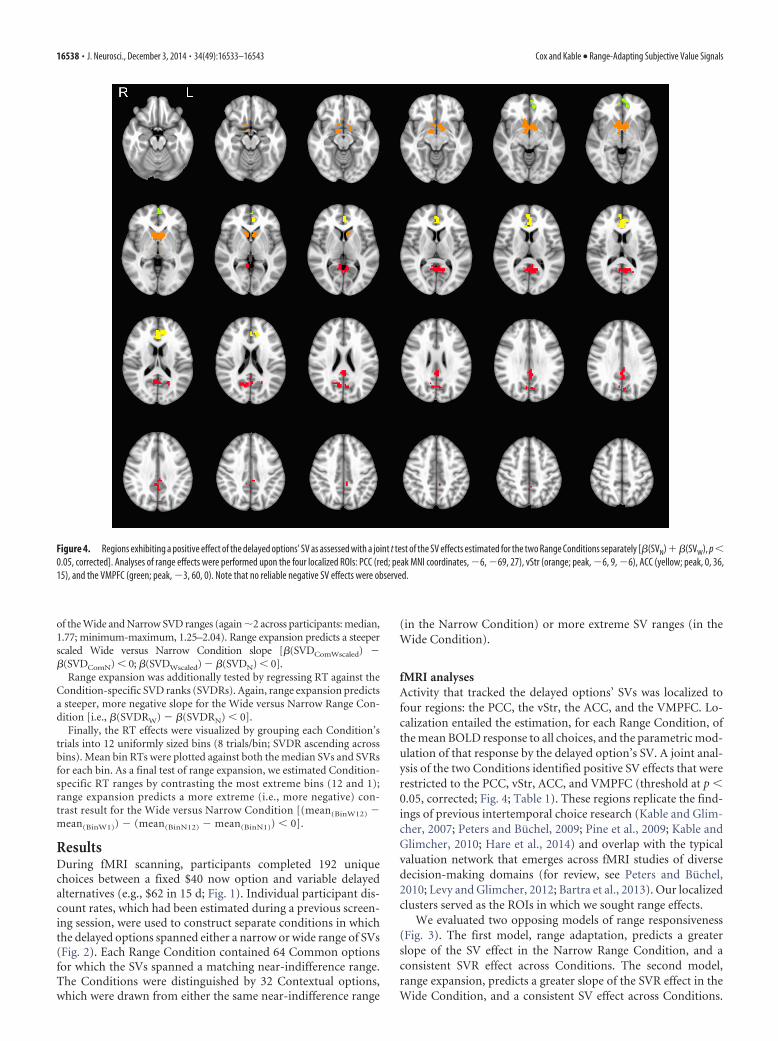
fMRI analysesActivity that tracked the delayed options’ SVs was localized tofour regions: the PCC, the vStr, the ACC, and the VMPFC. Lo-calization entailed the estimation, for each Range Condition, ofthe mean BOLD response to all choices, and the parametric mod-ulation of that response by the delayed option’s SV. A joint anal-ysis of the two Conditions identified positive SV effects that wererestricted to the PCC, vStr, ACC, and VMPFC (threshold at p �0.05, corrected; Fig. 4; Table 1). These regions replicate the find-ings of previous intertemporal choice research (Kable and Glim-cher, 2007; Peters and Buchel, 2009; Pine et al., 2009; Kable andGlimcher, 2010; Hare et al., 2014) and overlap with the typicalvaluation network that emerges across fMRI studies of diversedecision-making domains (for review, see Peters and Buchel,2010; Levy and Glimcher, 2012; Bartra et al., 2013). Our localizedclusters served as the ROIs in which we sought range effects.
We evaluated two opposing models of range responsiveness(Fig. 3). The first model, range adaptation, predicts a greaterslope of the SV effect in the Narrow Range Condition, and aconsistent SVR effect across Conditions. The second model,range expansion, predicts a greater slope of the SVR effect in theWide Condition, and a consistent SV effect across Conditions.
Figure 4. Regions exhibiting a positive effect of the delayed options’ SV as assessed with a joint t test of the SV effects estimated for the two Range Conditions separately [�(SVN) ��(SVW), p �0.05, corrected]. Analyses of range effects were performed upon the four localized ROIs: PCC (red; peak MNI coordinates, �6, �69, 27), vStr (orange; peak, �6, 9, �6), ACC (yellow; peak, 0, 36,15), and the VMPFC (green; peak, �3, 60, 0). Note that no reliable negative SV effects were observed.
16538 • J. Neurosci., December 3, 2014 • 34(49):16533–16543 Cox and Kable • Range-Adapting Subjective Value Signals
Partial adaptation would predict a combination of these twomodels’ effects.
We found reliable range adaptation in two regions, vStr andPCC, and trends consistent with range adaptation in the ACC andVMPFC (Fig. 5). These results held across analyses performed onthe Common options alone (ensuring identical analyzed SVranges) and on all presented options. Narrow Range SV effectssignificantly exceeded Wide Range SV effects in the vStr (Com:t(19) � 3.04, p � 0.0067; All: t(19) � 3.07, p � 0.0063) and PCC(Com: t(19) � 2.15, p � 0.044; All: t(19) � 2.74, p � 0.013) andwere numerically greater in the ACC (Com: t(19) � 1.38, p � 0.18;All: t(19) � 1.76, p � 0.093) and VMPFC (Com: t(19) � 1.71, p �0.10; All: t(19) � 0.92, p � 0.37). None of the ROIs exhibitedCondition-related differences in the mean trial responses evokedby either the Common options alone (p’s � 0.58) or all options(p’s � 0.35). Therefore, the observed range adaptation cannot bereadily explained in terms of a general change in these regions’sensitivity to task events.
Across multiple tests, we found no evidence of activity rangeexpansion. In the first test, we scaled the Wide Condition SVeffect by the ratio of the Wide and Narrow SV ranges (2), andcontrasted the scaled result against the Narrow Condition effect.A larger scaled slope for the Wide Condition would suggest in-complete or nonexistent range adaptation, and accompanyingactivity range expansion. However, we found no reliable differ-ences between the scaled Wide and Narrow slopes, either whenrestricting the comparison to the Common options (range t’s ��1.69 to �0.44; p’s � 0.11– 0.66) or when including all stimuli
(range t’s � �1.27 to 0.51; p’s � 0.22– 0.89). In the second test,we compared the effects that had been estimated using SVR,rather than SV. Range expansion predicts a greater SVR effect inthe Wide versus Narrow Condition. We observed no reliableCondition differences in the SVR effects for any of the four ROIs(Fig. 5; p’s � 0.22).
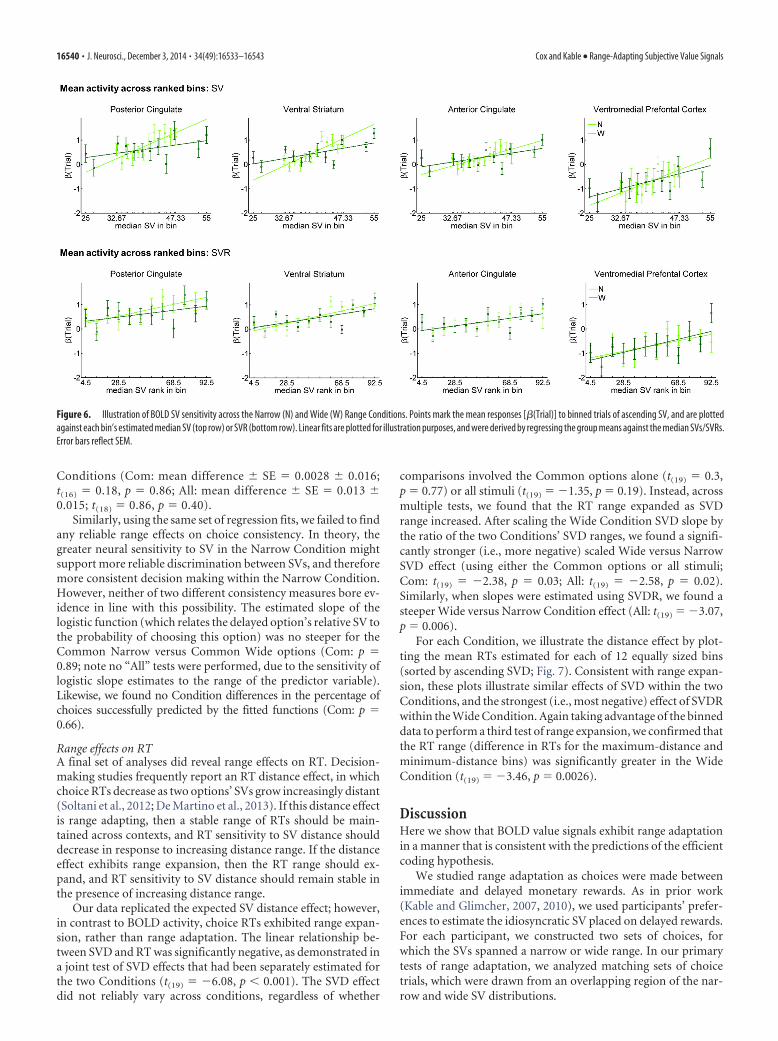
To illustrate each ROI’s activity profile, we sorted each Con-dition’s 96 trials by ascending SV, grouped the trials into 12 bins,and plotted the mean activity for each bin against either SV orSVR (Fig. 6). Consistent with the predictions for range adapta-tion, these plots illustrate an increased SV effect slope in theNarrow Condition, and similar SVR effects across Conditions.The binned data also permitted a third test of range expansion.For each Condition, the activity range was estimated by taking thedifference of the activation coefficients that had been obtainedfor the maximum-valued and minimum-valued bins. The differ-ence results were no greater in the Wide versus Narrow Condi-tion for any of the four ROIs (p’s � 0.26 for vStr, PCC, and ACC;for VMPFC, p � 0.057).
Behavioral analysesCross-range comparisons of discounting behaviorAs our fMRI analyses assumed, discount rates did not signifi-cantly differ across the two Range Conditions. To test this as-sumption, we compared discount rates that had been estimatedfor the Narrow and Wide Range Conditions separately, usingeither the Common options alone, or all options. Neitheranalysis yielded reliable differences in discount rate across
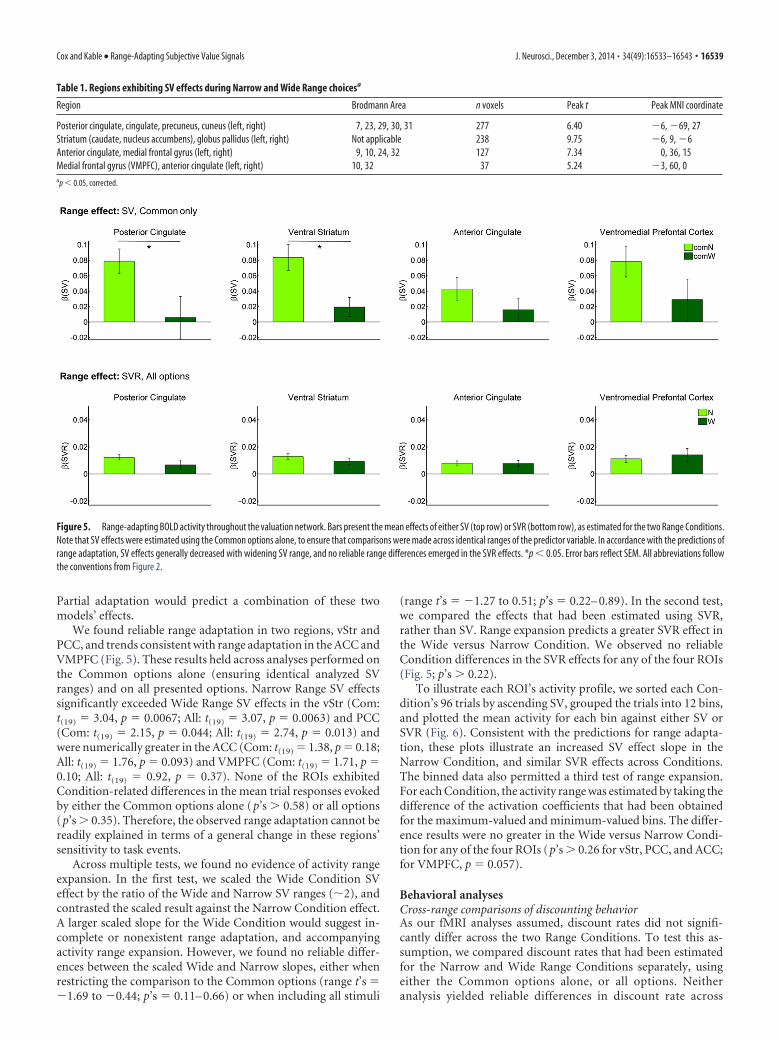
Table 1. Regions exhibiting SV effects during Narrow and Wide Range choicesa
Region Brodmann Area n voxels Peak t Peak MNI coordinate
Posterior cingulate, cingulate, precuneus, cuneus (left, right) 7, 23, 29, 30, 31 277 6.40 �6, �69, 27Striatum (caudate, nucleus accumbens), globus pallidus (left, right) Not applicable 238 9.75 �6, 9, �6Anterior cingulate, medial frontal gyrus (left, right) 9, 10, 24, 32 127 7.34 0, 36, 15Medial frontal gyrus (VMPFC), anterior cingulate (left, right) 10, 32 37 5.24 �3, 60, 0ap � 0.05, corrected.
Figure 5. Range-adapting BOLD activity throughout the valuation network. Bars present the mean effects of either SV (top row) or SVR (bottom row), as estimated for the two Range Conditions.Note that SV effects were estimated using the Common options alone, to ensure that comparisons were made across identical ranges of the predictor variable. In accordance with the predictions ofrange adaptation, SV effects generally decreased with widening SV range, and no reliable range differences emerged in the SVR effects. *p � 0.05. Error bars reflect SEM. All abbreviations followthe conventions from Figure 2.
Cox and Kable • Range-Adapting Subjective Value Signals J. Neurosci., December 3, 2014 • 34(49):16533–16543 • 16539
Conditions (Com: mean difference � SE � 0.0028 � 0.016;t(16) � 0.18, p � 0.86; All: mean difference � SE � 0.013 �0.015; t(18) � 0.86, p � 0.40).
Similarly, using the same set of regression fits, we failed to findany reliable range effects on choice consistency. In theory, thegreater neural sensitivity to SV in the Narrow Condition mightsupport more reliable discrimination between SVs, and thereforemore consistent decision making within the Narrow Condition.However, neither of two different consistency measures bore ev-idence in line with this possibility. The estimated slope of thelogistic function (which relates the delayed option’s relative SV tothe probability of choosing this option) was no steeper for theCommon Narrow versus Common Wide options (Com: p �0.89; note no “All” tests were performed, due to the sensitivity oflogistic slope estimates to the range of the predictor variable).Likewise, we found no Condition differences in the percentage ofchoices successfully predicted by the fitted functions (Com: p �0.66).
Range effects on RTA final set of analyses did reveal range effects on RT. Decision-making studies frequently report an RT distance effect, in whichchoice RTs decrease as two options’ SVs grow increasingly distant(Soltani et al., 2012; De Martino et al., 2013). If this distance effectis range adapting, then a stable range of RTs should be main-tained across contexts, and RT sensitivity to SV distance shoulddecrease in response to increasing distance range. If the distanceeffect exhibits range expansion, then the RT range should ex-pand, and RT sensitivity to SV distance should remain stable inthe presence of increasing distance range.
Our data replicated the expected SV distance effect; however,in contrast to BOLD activity, choice RTs exhibited range expan-sion, rather than range adaptation. The linear relationship be-tween SVD and RT was significantly negative, as demonstrated ina joint test of SVD effects that had been separately estimated forthe two Conditions (t(19) � �6.08, p � 0.001). The SVD effectdid not reliably vary across conditions, regardless of whether
comparisons involved the Common options alone (t(19) � 0.3,p � 0.77) or all stimuli (t(19) � �1.35, p � 0.19). Instead, acrossmultiple tests, we found that the RT range expanded as SVDrange increased. After scaling the Wide Condition SVD slope bythe ratio of the two Conditions’ SVD ranges, we found a signifi-cantly stronger (i.e., more negative) scaled Wide versus NarrowSVD effect (using either the Common options or all stimuli;Com: t(19) � �2.38, p � 0.03; All: t(19) � �2.58, p � 0.02).Similarly, when slopes were estimated using SVDR, we found asteeper Wide versus Narrow Condition effect (All: t(19) � �3.07,p � 0.006).
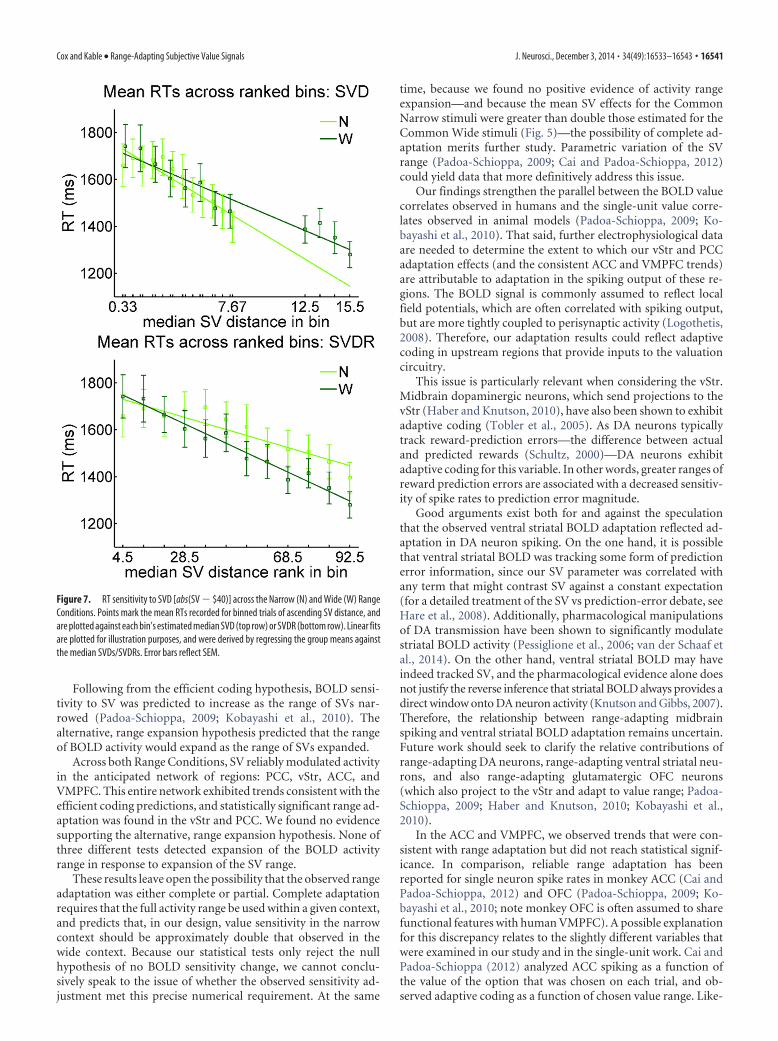
For each Condition, we illustrate the distance effect by plot-ting the mean RTs estimated for each of 12 equally sized bins(sorted by ascending SVD; Fig. 7). Consistent with range expan-sion, these plots illustrate similar effects of SVD within the twoConditions, and the strongest (i.e., most negative) effect of SVDRwithin the Wide Condition. Again taking advantage of the binneddata to perform a third test of range expansion, we confirmed thatthe RT range (difference in RTs for the maximum-distance andminimum-distance bins) was significantly greater in the WideCondition (t(19) � �3.46, p � 0.0026).
DiscussionHere we show that BOLD value signals exhibit range adaptationin a manner that is consistent with the predictions of the efficientcoding hypothesis.
We studied range adaptation as choices were made betweenimmediate and delayed monetary rewards. As in prior work(Kable and Glimcher, 2007, 2010), we used participants’ prefer-ences to estimate the idiosyncratic SV placed on delayed rewards.For each participant, we constructed two sets of choices, forwhich the SVs spanned a narrow or wide range. In our primarytests of range adaptation, we analyzed matching sets of choicetrials, which were drawn from an overlapping region of the nar-row and wide SV distributions.
Figure 6. Illustration of BOLD SV sensitivity across the Narrow (N) and Wide (W) Range Conditions. Points mark the mean responses [�(Trial)] to binned trials of ascending SV, and are plottedagainst each bin’s estimated median SV (top row) or SVR (bottom row). Linear fits are plotted for illustration purposes, and were derived by regressing the group means against the median SVs/SVRs.Error bars reflect SEM.
16540 • J. Neurosci., December 3, 2014 • 34(49):16533–16543 Cox and Kable • Range-Adapting Subjective Value Signals
Following from the efficient coding hypothesis, BOLD sensi-tivity to SV was predicted to increase as the range of SVs nar-rowed (Padoa-Schioppa, 2009; Kobayashi et al., 2010). Thealternative, range expansion hypothesis predicted that the rangeof BOLD activity would expand as the range of SVs expanded.
Across both Range Conditions, SV reliably modulated activityin the anticipated network of regions: PCC, vStr, ACC, andVMPFC. This entire network exhibited trends consistent with theefficient coding predictions, and statistically significant range ad-aptation was found in the vStr and PCC. We found no evidencesupporting the alternative, range expansion hypothesis. None ofthree different tests detected expansion of the BOLD activityrange in response to expansion of the SV range.
These results leave open the possibility that the observed rangeadaptation was either complete or partial. Complete adaptationrequires that the full activity range be used within a given context,and predicts that, in our design, value sensitivity in the narrowcontext should be approximately double that observed in thewide context. Because our statistical tests only reject the nullhypothesis of no BOLD sensitivity change, we cannot conclu-sively speak to the issue of whether the observed sensitivity ad-justment met this precise numerical requirement. At the same
time, because we found no positive evidence of activity rangeexpansion—and because the mean SV effects for the CommonNarrow stimuli were greater than double those estimated for theCommon Wide stimuli (Fig. 5)—the possibility of complete ad-aptation merits further study. Parametric variation of the SVrange (Padoa-Schioppa, 2009; Cai and Padoa-Schioppa, 2012)could yield data that more definitively address this issue.
Our findings strengthen the parallel between the BOLD valuecorrelates observed in humans and the single-unit value corre-lates observed in animal models (Padoa-Schioppa, 2009; Ko-bayashi et al., 2010). That said, further electrophysiological dataare needed to determine the extent to which our vStr and PCCadaptation effects (and the consistent ACC and VMPFC trends)are attributable to adaptation in the spiking output of these re-gions. The BOLD signal is commonly assumed to reflect localfield potentials, which are often correlated with spiking output,but are more tightly coupled to perisynaptic activity (Logothetis,2008). Therefore, our adaptation results could reflect adaptivecoding in upstream regions that provide inputs to the valuationcircuitry.
This issue is particularly relevant when considering the vStr.Midbrain dopaminergic neurons, which send projections to thevStr (Haber and Knutson, 2010), have also been shown to exhibitadaptive coding (Tobler et al., 2005). As DA neurons typicallytrack reward-prediction errors—the difference between actualand predicted rewards (Schultz, 2000)—DA neurons exhibitadaptive coding for this variable. In other words, greater ranges ofreward prediction errors are associated with a decreased sensitiv-ity of spike rates to prediction error magnitude.
Good arguments exist both for and against the speculationthat the observed ventral striatal BOLD adaptation reflected ad-aptation in DA neuron spiking. On the one hand, it is possiblethat ventral striatal BOLD was tracking some form of predictionerror information, since our SV parameter was correlated withany term that might contrast SV against a constant expectation(for a detailed treatment of the SV vs prediction-error debate, seeHare et al., 2008). Additionally, pharmacological manipulationsof DA transmission have been shown to significantly modulatestriatal BOLD activity (Pessiglione et al., 2006; van der Schaaf etal., 2014). On the other hand, ventral striatal BOLD may haveindeed tracked SV, and the pharmacological evidence alone doesnot justify the reverse inference that striatal BOLD always provides adirect window onto DA neuron activity (Knutson and Gibbs, 2007).Therefore, the relationship between range-adapting midbrainspiking and ventral striatal BOLD adaptation remains uncertain.Future work should seek to clarify the relative contributions ofrange-adapting DA neurons, range-adapting ventral striatal neu-rons, and also range-adapting glutamatergic OFC neurons(which also project to the vStr and adapt to value range; Padoa-Schioppa, 2009; Haber and Knutson, 2010; Kobayashi et al.,2010).
In the ACC and VMPFC, we observed trends that were con-sistent with range adaptation but did not reach statistical signif-icance. In comparison, reliable range adaptation has beenreported for single neuron spike rates in monkey ACC (Cai andPadoa-Schioppa, 2012) and OFC (Padoa-Schioppa, 2009; Ko-bayashi et al., 2010; note monkey OFC is often assumed to sharefunctional features with human VMPFC). A possible explanationfor this discrepancy relates to the slightly different variables thatwere examined in our study and in the single-unit work. Cai andPadoa-Schioppa (2012) analyzed ACC spiking as a function ofthe value of the option that was chosen on each trial, and ob-served adaptive coding as a function of chosen value range. Like-
Figure 7. RT sensitivity to SVD [abs(SV � $40)] across the Narrow (N) and Wide (W) RangeConditions. Points mark the mean RTs recorded for binned trials of ascending SV distance, andare plotted against each bin’s estimated median SVD (top row) or SVDR (bottom row). Linear fitsare plotted for illustration purposes, and were derived by regressing the group means againstthe median SVDs/SVDRs. Error bars reflect SEM.
Cox and Kable • Range-Adapting Subjective Value Signals J. Neurosci., December 3, 2014 • 34(49):16533–16543 • 16541
wise, Padoa-Schioppa (2009) found that for a subset of OFCneurons, firing rates were best explained as encoding chosenvalue, and also adapted to chosen value range. These findingsraise the question of whether ACC and VMPFC BOLD signalswould also exhibit reliable range adaptation if signals were ana-lyzed as a function of the chosen option’s SV. Although otherfMRI studies have reported chosen value signals in the ACC andVMPFC (Glascher et al., 2009; Wunderlich et al., 2009, 2010), ourstudy was not optimized to examine adaptation using this alter-native variable. In a set of secondary analyses, we found thatchosen value elicited only weak responses in the ACC andVMPFC, perhaps due to this variable’s restricted range, relative tothat of SV.
Although we observed range adaptation of BOLD activity,similar adjustments were not found in the behavioral responses.The enhanced BOLD SV sensitivity seen in the Narrow Rangecondition was not associated with an enhancement in choice con-sistency. Likewise, we did not observe range adaptation in choiceRTs. Although, as expected, responses speeded as the SVs of anoption pair grew more distant, this sensitivity to difficulty did notchange across contexts, such that a tighter range of RTs was ob-served in the Narrow versus Wide Range Condition.
The decoupling of our behavioral and BOLD effects might beinterpreted in multiple ways. Our procedures may have hinderedthe detection of corresponding behavioral changes, especiallywithin the consistency measure. The extensive prescan practicemay have promoted choice consistency, and the stability criterionmay have selected for participants with usually consistent behav-ior. Either of these factors could have resulted in a ceiling effectthat prevented the emergence of reliably greater consistency forthe Common Narrow choices. Alternatively, our results may in-dicate a fundamentally limited impact of neural range adaptationon the choice process, with implications for models that relate thedynamics of valuation to choice behavior (for the drift diffusionmodel, see Ratcliff and McKoon, 2008; Milosavljevic et al., 2010;for the divisive normalization model, see Louie et al., 2013; for thebiophysical model, see Chau et al., 2014). In addition, nonadapt-ing decision RTs would provide an interesting contrast to previ-ous monkey data (Kobayashi et al., 2010) that demonstratedadaptation in the invigoration effect of anticipated reward mag-nitude: when subjects performed saccades to earn cued juicerewards, saccade RTs generally decreased with increasing pro-spective reward, and this inverse relationship strengthened as therange of potential cued rewards narrowed.
A final, broad implication of our fMRI results involves theconstraints that range adaptation places upon the use of theBOLD signal to infer SVs. If value sensitivity varies with valuerange, then BOLD effects cannot be used as a proxy measure ofSV that may be generalized beyond the measurement context.Most immediately, this limitation suggests that studies that trainclassifiers to predict values from BOLD activity (Kahnt et al.,2010; Smith et al., 2014) will be most successful when the trainingand test data are drawn from similar contexts. In the long term,range adaptation raises caution with respect to the prospect thatBOLD measures might enable cross-individual comparisons ofutility that cannot be derived through choice behavior alone(Glimcher, 2010).
ReferencesBarlow HB (1961) Possible principles underlying the transformation of sen-
sory messages. In: Sensory communication (Rosenblith W, ed), pp 217–234. Cambridge, MA: MIT.
Bartra O, McGuire JT, Kable JW (2013) The valuation system: a coordinate-
based meta-analysis of BOLD fMRI experiments examining neural corre-lates of subjective value. Neuroimage 76:412– 427. CrossRef Medline
Bissonette GB, Gentry RN, Padmala S, Pessoa L, Roesch MR (2014) Impactof appetitive and aversive outcomes on brain responses: linking the ani-mal and human literatures. Front Syst Neurosci 8:24. CrossRef Medline
Cai X, Padoa-Schioppa C (2012) Neuronal encoding of subjective value indorsal and ventral anterior cingulate cortex. J Neurosci 32:3791–3808.CrossRef Medline
Chau BK, Kolling N, Hunt LT, Walton ME, Rushworth MF (2014) A neuralmechanism underlying failure of optimal choice with multiple alterna-tives. Nat Neurosci 17:463– 470. CrossRef Medline
Clithero JA, Rangel A (2014) Informatic parcellation of the network in-volved in the computation of subjective value. Soc Cogn Affect Neurosci9:1289 –1302. CrossRef Medline
Cox RW (2012) AFNI: what a long strange trip it’s been. Neuroimage 62:743–747. CrossRef Medline
Dale AM (1999) Optimal experimental design for event-related fMRI. HumBrain Mapp 8:109 –114. CrossRef Medline
Deichmann R, Gottfried JA, Hutton C, Turner R (2003) Optimized EPI forfMRI studies of the orbitofrontal cortex. Neuroimage 19:430 – 441.CrossRef Medline
De Martino B, Fleming SM, Garrett N, Dolan RJ (2013) Confidence invalue-based choice. Nat Neurosci 16:105–110. CrossRef Medline
Festinger L (1943) Studies in decision: I. Decision-time, relative frequencyof judgment and subjective confidence as related to physical stimulusdifference. J Exp Psychol 32.
Glascher J, Hampton AN, O’Doherty JP (2009) Determining a role for ven-tromedial prefrontal cortex in encoding action-based value signals duringreward-related decision making. Cereb Cortex 19:483– 495. CrossRefMedline
Glimcher PW (2010) Foundations of neuroeconomic analysis. New York:Oxford UP.
Haber SN, Knutson B (2010) The reward circuit: linking primate anatomyand human imaging. Neuropsychopharmacology 35:4 –26. CrossRefMedline
Hare TA, O’Doherty J, Camerer CF, Schultz W, Rangel A (2008) Dissociat-ing the role of the orbitofrontal cortex and the striatum in the computa-tion of goal values and prediction errors. J Neurosci 28:5623–5630.CrossRef Medline
Hare TA, Hakimi S, Rangel A (2014) Activity in dlPFC and its effectiveconnectivity to vmPFC are associated with temporal discounting. FrontNeurosci 8:50. CrossRef Medline
Jenkinson M, Beckmann CF, Behrens TE, Woolrich MW, Smith SM (2012)FSL. Neuroimage 62:782–790. CrossRef Medline
Kable JW, Glimcher PW (2007) The neural correlates of subjective valueduring intertemporal choice. Nat Neurosci 10:1625–1633. CrossRefMedline
Kable JW, Glimcher PW (2009) The neurobiology of decision: consensusand controversy. Neuron 63:733–745. CrossRef Medline
Kable JW, Glimcher PW (2010) An “as soon as possible” effect in humanintertemporal decision making: behavioral evidence and neural mecha-nisms. J Neurophysiol 103:2513–2531. CrossRef Medline
Kahnt T, Heinzle J, Park SQ, Haynes JD (2010) The neural code of rewardanticipation in human orbitofrontal cortex. Proc Natl Acad Sci U S A107:6010 – 6015. CrossRef Medline
Knutson B, Gibbs SE (2007) Linking nucleus accumbens dopamine andblood oxygenation. Psychopharmacology (Berl) 191:813– 822. CrossRefMedline
Kobayashi S, Pinto de Carvalho O, Schultz W (2010) Adaptation of rewardsensitivity in orbitofrontal neurons. J Neurosci 30:534 –544. CrossRefMedline
Levy DJ, Glimcher PW (2012) The root of all value: a neural common cur-rency for choice. Curr Opin Neurobiol 22:1027–1038. CrossRef Medline
Logothetis NK (2008) What we can do and what we cannot do with fMRI.Nature 453:869 – 878. CrossRef Medline
Louie K, Khaw MW, Glimcher PW (2013) Normalization is a general neuralmechanism for context-dependent decision making. Proc Natl Acad SciU S A 110:6139 – 6144. CrossRef Medline
Mazur JE (1987) An adjusting procedure for studying delayed reinforce-ment. In: Quantitative analysis of behavior: the effects of delay and inter-vening events on reinforcement value (Commons ML, Mazur JE, Nevin
16542 • J. Neurosci., December 3, 2014 • 34(49):16533–16543 Cox and Kable • Range-Adapting Subjective Value Signals
JA, Rachlin H, eds.), pp 55–73. Hillsdale, NJ: Lawrence ErlbaumAssociates.
Milosavljevic M, Malmaud J, Huth A, Koch C, Rangel A (2010) The DriftDiffusion Model can account for the accuracy and reaction time of value-based choices under high and low time pressure. Judgment DecisionMaking 5:437– 449.
Moyer RS, Landauer TK (1967) Time required for judgements of numericalinequality. Nature 215:1519 –1520. CrossRef Medline
Padoa-Schioppa C (2009) Range-adapting representation of economicvalue in the orbitofrontal cortex. J Neurosci 29:14004 –14014. CrossRefMedline
Padoa-Schioppa C, Assad JA (2006) Neurons in the orbitofrontal cortexencode economic value. Nature 441:223–226. CrossRef Medline
Park SQ, Kahnt T, Talmi D, Rieskamp J, Dolan RJ, Heekeren HR (2012)Adaptive coding of reward prediction errors is gated by striatal coupling.Proc Natl Acad Sci U S A 109:4285– 4289. CrossRef Medline
Pessiglione M, Seymour B, Flandin G, Dolan RJ, Frith CD (2006)Dopamine-dependent prediction errors underpin reward-seeking behav-iour in humans. Nature 442:1042–1045. CrossRef Medline
Peters J, Buchel C (2009) Overlapping and distinct neural systems code forsubjective value during intertemporal and risky decision making. J Neu-rosci 29:15727–15734. CrossRef Medline
Peters J, Buchel C (2010) Neural representations of subjective reward value.Behav Brain Res 213:135–141. CrossRef Medline
Pine A, Seymour B, Roiser JP, Bossaerts P, Friston KJ, Curran HV, Dolan RJ(2009) Encoding of marginal utility across time in the human brain.J Neurosci 29:9575–9581. CrossRef Medline
Ratcliff R, McKoon G (2008) The diffusion decision model: theory and data
for two-choice decision tasks. Neural Comput 20:873–922. CrossRefMedline
Rushworth MF, Noonan MP, Boorman ED, Walton ME, Behrens TE (2011)Frontal cortex and reward-guided learning and decision-making. Neuron70:1054 –1069. CrossRef Medline
Schultz W (2000) Multiple reward signals in the brain. Nat Rev Neurosci1:199 –207. CrossRef Medline
Smith A, Bernheim D, Camerer C, Rangel A (2014) Neural activity revealspreferences without choices. Am Economic J Microeconomics 6:1–36.
Soltani A, De Martino B, Camerer C (2012) A range-normalization modelof context-dependent choice: a new model and evidence. PLoS ComputBiol 8:e1002607. CrossRef Medline
Tobler PN, Fiorillo CD, Schultz W (2005) Adaptive coding of reward valueby dopamine neurons. Science 307:1642–1645. CrossRef Medline
Valentin VV, Dickinson A, O’Doherty JP (2007) Determining the neuralsubstrates of goal-directed learning in the human brain. J Neurosci 27:4019 – 4026. CrossRef Medline
van der Schaaf ME, van Schouwenburg MR, Geurts DE, Schellekens AF,Buitelaar JK, Verkes RJ, Cools R (2014) Establishing the dopamine de-pendency of human striatal signals during reward and punishment rever-sal learning. Cereb Cortex 24:633– 642. CrossRef Medline
Wark B, Lundstrom BN, Fairhall A (2007) Sensory adaptation. Curr OpinNeurobiol 17:423– 429. CrossRef Medline
Wunderlich K, Rangel A, O’Doherty JP (2009) Neural computations under-lying action-based decision making in the human brain. Proc Natl AcadSci U S A 106:17199 –17204. CrossRef Medline
Wunderlich K, Rangel A, O’Doherty JP (2010) Economic choices can bemade using only stimulus values. Proc Natl Acad Sci U S A 107:15005–15010. CrossRef Medline
Cox and Kable • Range-Adapting Subjective Value Signals J. Neurosci., December 3, 2014 • 34(49):16533–16543 • 16543
Recommended


![Narrative Inquiry: An Interview With Michael Bamberg...Interview NarrativeInquiry:AnInterviewWithMichaelBamberg MichaelBamberg*a,CarolinDemuthb [a]ClarkUniversity,DepartmentofPsychology,Worcester,MA,USA.[b](https://img.dokumen.tips/doc/110x75/5f4359d6ce71613216513c94/narrative-inquiry-an-interview-with-michael-bamberg-interview-narrativeinquiryaninterviewwithmichaelbamberg.jpg)


![Threats to Human Rights: A General Review€¦ · ReviewArticles ThreatstoHumanRights:AGeneralReview KevinR.Carriere*a [a]DepartmentofPsychology,GeorgetownUniversity,Washington,DC,USA](https://img.dokumen.tips/doc/110x75/605e5bd72b39fe757060c089/threats-to-human-rights-a-general-review-reviewarticles-threatstohumanrightsageneralreview.jpg)