Blueprint for nanoscale NMR
I. Schwartz1,3, J. Rosskopf1, S. Schmitt2, B. Tratzmiller1, Q. Chen1, L.P. McGuinness2, F. Jelezko2 and M.B. Plenio1
1 Institute of Theoretical Physics and IQST, Universitat Ulm, 89081 Ulm, Germany2 Institute of Quantum Optics and IQST, Universitat Ulm, 89081 Ulm, Germany
3 NVision Imaging Technologies GmbH, 89134 Blaustein, Germany
Nitrogen vacancy (NV) centers in diamond have been used as ultrasensitive magnetometers to perform nuclearmagnetic resonance (NMR) spectroscopy of statistically polarized samples at 1 - 100 nm length scales. However,the spectral linewidth is typically limited to the kHz level, both by the NV sensor coherence time and by rapidmolecular diffusion of the nuclei through the detection volume which in turn is critical for achieving longnuclear coherence times. Here we provide a blueprint for a set-up that combines a sensitivity sufficient fordetecting NMR signals from nano- to micron-scale samples with a spectral resolution that is limited only bythe nuclear spin coherence, i.e. comparable to conventional NMR. Our protocol detects the nuclear polarizationinduced along the direction of an external magnetic field with near surface NV centers using lock-in detectiontechniques to enable phase coherent signal averaging. Using NV centers in a dual role of NMR detector andoptical hyperpolarization source to increase signal to noise, and in combination with Bayesian interferencemodels for signal processing, nano/microscale NMR spectroscopy can be performed on sub-millimolar sampleconcentrations, several orders of magnitude better than the current state of the art.
Introduction — Nuclear magnetic resonance (NMR) andmagnetic resonance imaging (MRI) are technologies whoseapplications in organic chemistry, biology, medicine andmaterial science have enabled fundamental scientific break-throughs and continue to be drivers of scientific and techno-logical progress [1]. Despite these successes, it is recognizedthat nuclear magnetic resonance applications has limitationsdue to the minute nuclear magnetization of analytes whichleads to limited sensitivity in comparison to other analytictechniques such as mass spectrometry.
Strategies that are being pursued to overcome this chal-lenge include an evolution towards larger applied magneticfields which improves sensitivity due to the resulting increaseof thermal equilibrium polarization and signal frequency [2].The approximately linear growth in the magnetic field that hasbeen achieved over the last 5 decades comes at the cost ofgrowing size, purchase and operating costs of these devices,which limit portability and challenge their integration with de-sired applications. More compact magnets lead to smaller us-able detection volumes and thus limit sensitivity. A promisingalternative strategy is the reduction in size of the radio fre-quency coils used to excite and detect the NMR signals [3]as this results in a sensitivity enhancement with decreasingcoil-diameter and promises the development of portable on-chip NMR spectrometers [5]. Limitations and challenges inthis approach include the homogeneity of the system whichlimit resolution and the thermal noise in the readout coil, i.e.thermal Johnson noise, which, together with the low samplevolume, limits sensitivity. A further avenue towards improvedNMR sensitivity is to increase the nuclear spin polarizationbeyond its thermal equilibrium value by means of techniquessuch as dynamical nuclear polarization [6]. Despite promisingresults, the integration of these approaches with NMR involvesignificant challenges, as they typically require low tempera-tures and dissolution of the sample - significantly reducing itsconcentration.
Addressing these challenges in a single device to simul-
taneously achieve improved sensitivity, ideally at the sub-millimolar level, portability and the ability to vary sample vol-umes from the nano- to the millimeter scale would decisivelyenhance a broad range of applications thus offering the po-tential for new ground breaking insights. These include NMRstudies of single cells and neurons [8], the study of catalysis atsmallest volumes, NMR studies of surfaces and on-chip NMRbased metabolic fingerprinting with applications in personal-ized medicine [4, 9].
Here we present a novel physical platform for NMR detec-tion that we show is capable of overcoming these challengesfor samples ranging from the nano- to the millimeter-scale.We introduce an NMR protocol that permits spectroscopy ofsuch volumes with chemical resolution and micromolar sensi-tivity and demonstrate signal processing algorithms that allowfor a significant reduction in signal acquisition time, therebyyielding sample analysis with dramatic speed-up. The feasi-bility of this approach is demonstrated by detecting magneticsignals applied to a single NV center in diamond. The signaldynamics are obtained from atomistic simulations of a diffu-sive nanoscale nuclear sample, with a signal intensity scaledto correspond to an NV depth of 6.2 nm.
Background and key design elements — High-resolutionNMR spectroscopy makes use of several properties of bulkmatter in resolving chemical shifts and J-couplings for molec-ular structure determination. The rapid molecular diffusionand rotation leads to the suppression of internuclear interac-tion down to the Hz-level while not limiting the signal coher-ence due to the large volume from which the signal is col-lected. Furthermore, for bulk samples, the thermal polariza-tion (scaling with the sample volume V) greatly exceeds thestatistical polarization fluctuations (scaling with V 1/2). Thisallows on the one hand for the controlled initialization of thesignal and therefore phase coherent signal accumulation re-sulting in a rapid growth of the signal to noise ratio (SNR)and on the other hand long signal coherence times and there-fore high spectral resolution.
arX
iv:1
706.
0713
4v1
[qu
ant-
ph]
21
Jun
2017
2
Nuclei
τD
Sta�s�cal Polariza�on
( )
a)
b) M Polariza�onz
�2
NV
T *2
B fie
ldB
field
Nuclei
c)0 1 2 3
-101
-101
time [ms]
-101
B fie
ld
...
U U}k
U
0 0.01 0.02 0.03time [ms]
-0.5
0
0.5
76 77 78 [kHz]
S() a
.u.
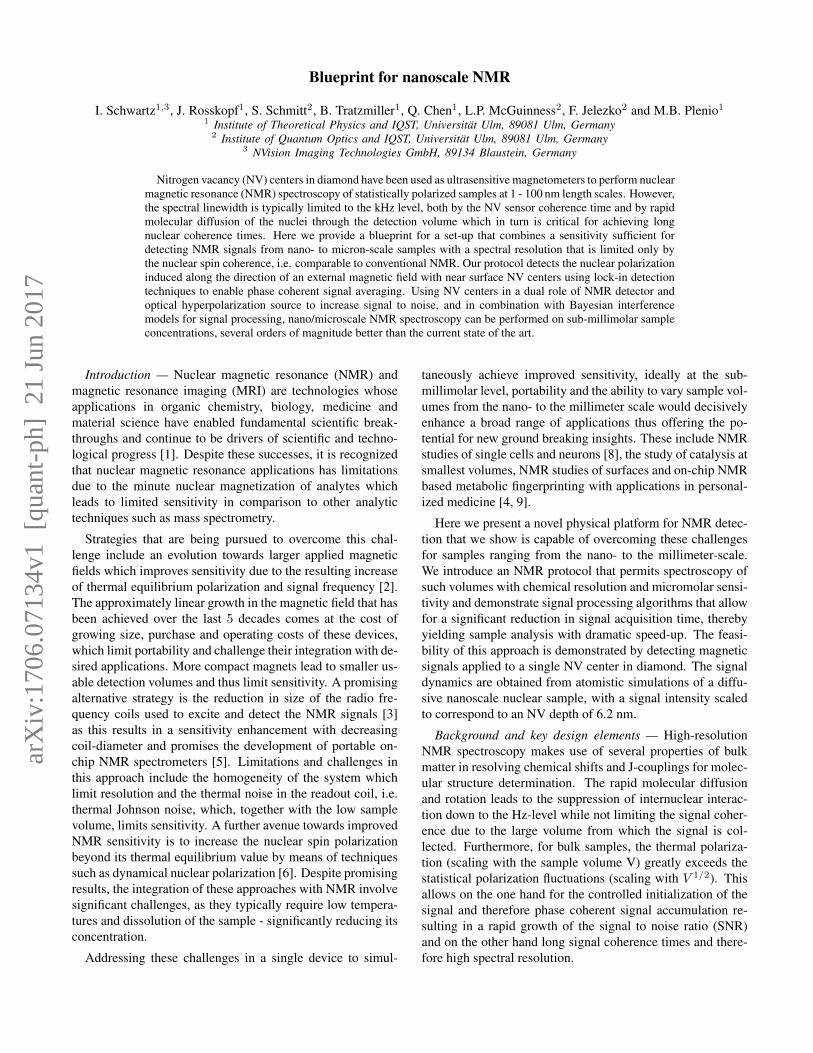
Figure 1. (a) Illustration of the Qdyne signal and the detected statis-tical magnetization by the NV center. The diffusion of nuclear spinsin or out of the NV detection range leads to rapid fluctuations of thedetected phase, introducing a short signal coherence time-scale, τD ,on the order of the interaction correlation time. (b) The adoption ofMz Qdyne enables the detection of the FID signal from the nuclear zmagnetization (thermal or hyperpolarized), regardless of the molec-ular diffusion. (c) An atomistic simulation of the time-dependentmagnetic field induced by the diffusing nuclear spins on a 6.2 nmdeep NV, where the statistical polarization is still clearly strongerthan the hyperpolarized Mz = 0.1% polarization. However, Mz
Qdyne can be averaged over many runs Nm, significantly reducingthe statistical polarization signal by 1/
√Nm while the Mz signal
remains unchanged (due to same initial phase at every run). The fig-ure on the top r.h.s. shows the averaged signal for the first 0.03 mswith Nm = 300, where only the smaller Mz polarization (oscil-lates between±0.45) remains visible. Using an AWG, the simulatedmagnetic field (Nm = 1000) was applied on a single NV center bya current carrying wire, with the setup of Ref [14], where the Mz ,diffusion independent signal can be clearly seen, producing a peakwith 170 Hz linewidth (limited only by the 5.6 ms length of the sim-ulated signal). A simulated signal with only statistical polarizationproduces no peak, and the diffusion limited signal would be over 10kHz.
However, for (1µm)3 of water in a 1 Tesla field, the statis-tical polarization of the hydrogen nuclei is comparable to thethermal polarization and becomes dominant at the nanoscale.This observation has motivated successful experimental ef-forts towards NMR detection of statistical polarization ofnanoscale samples [10]. However, the stochastic nature andrandom phase of the observed statistical polarization preventphase coherent signal averaging and the impact of diffusionlimits signal coherence time and thus spectral resolution [18].Overcoming these limitations calls for new modes of observa-tion.
Here we will consider, perhaps counter-intuitively, the de-tection of the signal originating from the thermal polarization,even for nanoscale samples for which the statistical compo-nent is expected to dominate. We use three key features tocompensate for this apparent shortcoming, namely, (i) the sig-nal phase can be controlled by an initializing π/2-pulse to al-low for phase coherent accumulation across subsequent mea-surements, (ii) because the thermal polarization component isuniform across the entire sample beyond the immediate de-tection region, the signal coherence time becomes essentiallyindependent of diffusion allowing for high spectral resolution,(iii) and for the same reasons the signal is uniform across thesample which allows for the use of multiple NV-centers forsimultaneous signal acquisition thus further improving SNR.
The platform and protocols described in the followingleverage the unique characteristics of color centers in diamond[11] to make use of these three key features. First, we useoptically detected magnetic resonance in either individual orensembles of color centers [12, 13] to detect small magneticfields emanating from the sample which, by making use ofa recently developed lock-in technique, Qdyne, which allowsfor spectral resolution in the µHz range [14–16]. This substi-tutes the electrical detection via rf-microcoils which is accom-panied by thermal Johnson noise by optical detection whichis only limited by the non-thermal photon shot noise. Sec-ondly, the ability to bring color centers to within nanoscaledistance of the sample allows for their use as a source of nu-clear hyerpolarization even under ambient conditions usinglaser induced polarization of the electron spin native to thecolor center and the subsequent microwave assisted transferto the sample nuclei [17, 19, 20]. This obviates the need fora strong magnetic field and holds the potential for an ordersof magnitude increase in signal strength, thus bringing sub-millimolar sensitivities into reach while at the same time re-ducing nuclear spin polarization fluctuations induced by dif-fusion. Thirdly, in order to reduce averaging times requiredfor achieving sub-millimolar sensitivities, we employ signalprocessing methods based on Bayesian inference algorithmsthat allow for orders of magnitude reduction of measurementsrequired for the identification of signal components due tochemical shifts. The remainder of this work will describethese key elements and present theoretical and experimentalresults that demonstrate the feasibility of the approach.
Qdyne for nuclear magnetic resonance — The recently de-veloped Qdyne method introduces a quantum lock-in spec-
3
troscopy technique [14–16] whose spectral resolution is inde-pendent of the sensor coherence time. Using Qdyne, a co-herent external oscillating radiofrequency (RF) field, could bemeasured with a spectral linewidth of 607 µHz [14], therebymaking the technique promising for realizing true nanoscaleNMR via shallow NV centers.
In Qdyne, the sensor qubit is tailored to collect a signalthat depends not only on the amplitude and frequency of thedetected field, but also on the phase with respect to the startof each measurement. Performing N measurements each oflength TL, a different phase is accumulated in each measure-ment due to the difference between TL and period of the oscil-latory field. As shown in Ref. [14], for an XY8 measurementsequence when the excitation and detection π/2 pulses areperpendicular to each other, the detected signal is given by
P = sin(4kτmπ
cos(δt+ φ)) +1
2, (1)
where k is the interaction strength, τm the interaction time, φis an arbitrary initial phase of the RF field, and δ denotes thefrequency of the accumulated phase.
As with most NV sensing schemes, when using a shallowNV for detection, due to the small number NI of spins in thevicinity of the NV, the signal detected by Qdyne is dominatedby the statistical polarization of the nuclear spins in the sens-ing volume - Brms(t) =
∑iA
ix(t)Ix, with Aix(t) denoting
the coupling of the NV center to the i-th nuclear spin.Diffusion of molecules into and out of this volume leads
to random fluctuations of the detected signal, which is gov-erned by a correlation function 〈Brms(t)Brms(t + τ)〉 =B2rms exp(−τ/τc), where τc is the correlation time. Thus, the
phase φ in Eq.(1) becomes a stochastic variable, φ(t), whichdenotes the instantaneous phase of the statistical nuclear spinpolarization within the NV detection region [21].
This stochastic variable ties the observed Qdyne signal tothe molecular diffusion of the moving molecules, leading toa stringent limitation on the minimal observable line-width,thereby obscuring small but important details such as chem-ical shift and quadrupole information. See figure 1(a) for anillustration of a statistical magnetization detected by a Qdynemeasurement, and the diffusion effect on the phase of the de-tected signal.
To solve this issue, and decouple the Qdyne signal frommolecular diffusion, we modify the sequence to detect thermalnuclear magnetization along the z-axis of the applied mag-netic field. This modified Mz Qdyne sequence consists ofNm measurements, and, at the beginning of the sequence, aπ/2 pulse which rotates the nuclear z magnetization to the x-yplane, where it can be detected by the XY dynamical decou-pling measurement with the correct filter function, similar toa free induction decay (FID) in traditional NMR. Importantly,at the beginning of each of theNm sequences, the initial phaseof the z magnetization on the x-y plane is known and identi-cal. Moreover, as the phase is identical for all nuclear spinsacross the sample, the diffusion of molecules in or out of theNV center detection region has no effect on the signal phase,
and the detected linewidth becomes limited only by the nu-clear coherence times, see Fig. 1(b).
In a realistic NMR scenario using a 5 – 100 nm deep NVcenter, both the statistical andMz sample magnetizations con-tribute to the detected signal, with the statistical polarizationgenerally dominating the z-magnetization. However, the sum-mation of Nm repeated measurements can be used to reducethe statistical signal by a factor of 1/
√Nm due to its random
phase and magnitude, while locking-in to the phase of Mz-magnetization so as to prevent its cancellation. Thus, espe-cially when combined with hyperpolarization, the detection ofMz magnetization is feasible even with relatively shallow NVcenters, and therefore even sub-micron detection volumes.Figure 1(c) shows the magnetization produced by an atomisticsimulation of diffusing hyperpolarized (< Mz >= 0.1%) nu-clear spins [22] near a 6.2 nm deep NV center. Clearly the sta-tistical polarization is larger than the hyperpolarized signal inthis regime as the FID is not visible. However, when averag-ing the signal over 300 runs, the smaller Mz polarization canbe clearly seen due to the reduction of the contribution fromthe statistical polarization. The magnetic field produced by anensemble of nuclear spins as calculated by atomistic simula-tions was applied to a single NV center by a current carryingwire (see Ref. [14] for experimental details) for Nm = 1000.The amplitude of the signal is calibrated by fitting the accumu-lated phase due to the statistical polarization to that measuredby a 6.2 nm deep NV center [23]. A measured signal due tothe Mz polarization is clearly visible with 170 Hz linewidth,limited only by the 5.6 ms length of the detected signal. Forcomparison, with the chosen diffusion parameter the linewidthdue to the statistical polarization would exceed 10 kHz.
An additional advantage of Mz Qdyne due to the averagingof Nm measurements is better statistical information on eachmeasured point. This improves the low photon collection ef-ficiency inherent in NV-based detection, with the statisticaldetection process becoming a Poissonian distribution ratherthan a Bernoulli process. Moreover, as the Mz-polarizationis uniform across the entire sample, different NV centers nowdetect the same phase φ, which allows the measurement to beperformed with ensembles of NV centers. The accumulatedfluorescence from the different NV centers acts identically torepeated measurements Nm of the single NV center, i.e. im-proving statistical information and averaging out the statisticalpolarization. Thus, the number of statistical averages is givenbyN = NNV ×Nm, whereNNV is the number of NV centersused as sensors.Mz Qdyne unlocks the potential of NV-based NMR, al-
lowing for volumes ranging from nanometric to macroscopicscales. However, as the nuclear thermal polarization is veryweak, especially at lower magnetic fields, achieving a goodsignal to noise (SNR) in this regime requires macroscopic di-amonds with densely packed NV centers and roughly 1 µlsamples (1 mm3) for practical NMR applications (r.h.s. of fig2). Pushing the limits of this regime to even large micro-scalewould require averaging of several hours of measurement timefor acquiring a sufficient SNR, due to the small signal pro-
4
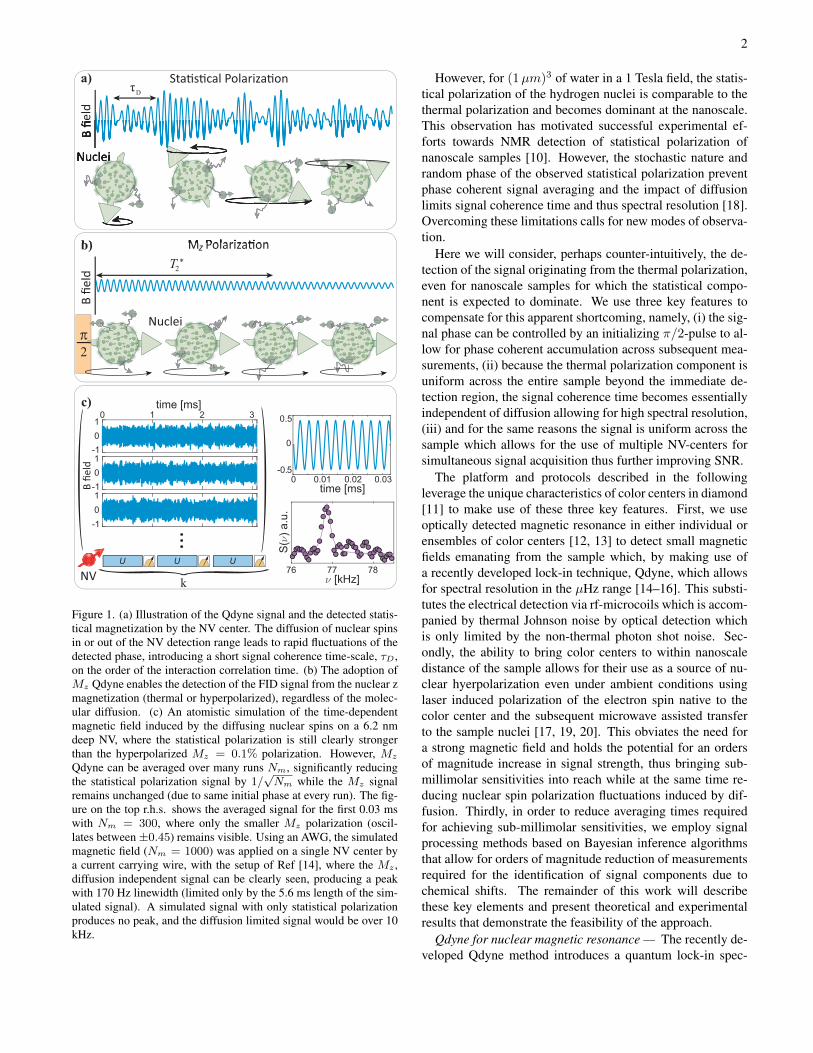
Figure 2. Illustration of the three different regimes made possible byMz Qdyne. On the r.h.s. is the “classical” regime, where a macro-scopic diamond with densely packed NV centers senses the thermalpolarization, providing a substitute to traditional NMR micro-coils.In the middle figure, using the NV center ensemble in a dual role- polarizing the nuclear spin bath to increase the nuclear signal anddetection of the NMR signal, thus termed Hyperdyne, enables su-perb sensitivities in the nano- and micro-scale regimes (the illustra-tion includes a nanostructured diamond for enhanced polarization ef-ficiency). Hyperdyne can be pushed to the extreme nano-scale limit,using a single NV center (l.h.s.) albeit at a significantly reduced po-larization / sensitivity efficiency.
duced by thermal polarization. Thus, in this regime the NVensemble in the diamond serves as a “classical” macroscopicNMR sensor, similar to currently used micro-coils, albeit withthe advantage of different noise processes which could lead toimproved sensitivity. To push the application into the micro-and nano-scale regimes, the Mz polarization needs to be en-hanced, in a manner which still allows fast repetitive mea-surements. Fortuitously, optically polarized NV centers havebeen demonstrated to be superb polarization sources for nu-clear spin hyperpolarization either inside the diamond [24–27]or in external molecules [17, 19, 20]. Thus by using the NVcenters in a dual role of hyperpolarization sources and NMRdetectors, with shallow NVs used for polarization and deeperones for detection, the NMR SNR of each measurement canbe increased over 10,000-fold, without the need for shuttlingbetween polarization and detection zones and without suf-fering other detrimental side-effects of dissolution DNP (e.g.cooling the sample to T = 1K, reduction of analyte concen-tration upon dissolution). Thus, using interleaved hyperpolar-ization / detection sequences on the NV centers (the Hyper-dyne protocol) one can achieve true NMR applicability on the(sub)microscale, see middle of fig. 2.
On the extreme nanometric scale (l.h.s. of fig 2), one mayimplement Hyperdyne NMR with a single NV center. How-ever, the single NV center needs to be close to the surfacefor sufficient efficiency in the hyperpolarization cycle, whichleads to the disadvantage that many of the polarized nucleiwill diffuse outside the small NV detection region, and thusproduce a much smaller net gain in the NMR sensitivity.
Signal Analysis of Hyperdyne: From FFT to Bayesian in-ference — In this section we provide expressions for the sig-
nal to noise ratio for large numbers of detection events, eitherdue to high detection efficiency or large number of phase co-herent averages, and then present Bayesian inference methodsto improve signal detection for when these conditions are notmet to allow for a significant order of magnitude reduction inmeasurement time. For shot noise limited detection,
SNR ∝√NPhotkτm ∝
√NρPnτm, (2)
withNPhot ∝ Vs being the number of detected photons, τm thethe length of a single XY measurement, Vs the total detectionvolume, k(τm) the interaction strength (time) for an individ-ual NV center, N = NmNNV the number of independentmeasurements (which is the product of Nm runs with NNVNV centers), ρ the nuclear spin concentration and Pn the av-erage polarization. There are two regimes to be consideredwhen aiming to maximize SNR in a given total experimenttime here. Firstly, when τm < min(TNV2 , π/4k) it is mostadvantageous to increase τm while keeping Nm constant, i.e.increase the time over which the signal is accumulated coher-ently. In this case the total measurement time T = Nmτmscales as the first case of eq. (3). If however, τm = TNV2 wecannot increase τm any further without suffering an exponen-tial in τm loss in signal (for τm > π/4k we lose the abilityto identify the phase). Hence we are reduced to increase Nm,that is averaging over independent runs. In this case the totalmeasurement time T = Nmτm scales as the second case ofeq. (3) benefiting more from an increase in polarization of thesample.
1
T∝
{√VsρNV ρPn if increasing τm < min
(TNV2 , π4k
)VsρNV ρ
2P 2n else.
(3)where T is the total measurement time for achieving a fixedSNR value, ρNV is the NV concentration, and enlarging Vs isassumed to be achieved by increasing the surface cross sec-tion, thereby scaling linearly with the number of NV centers.
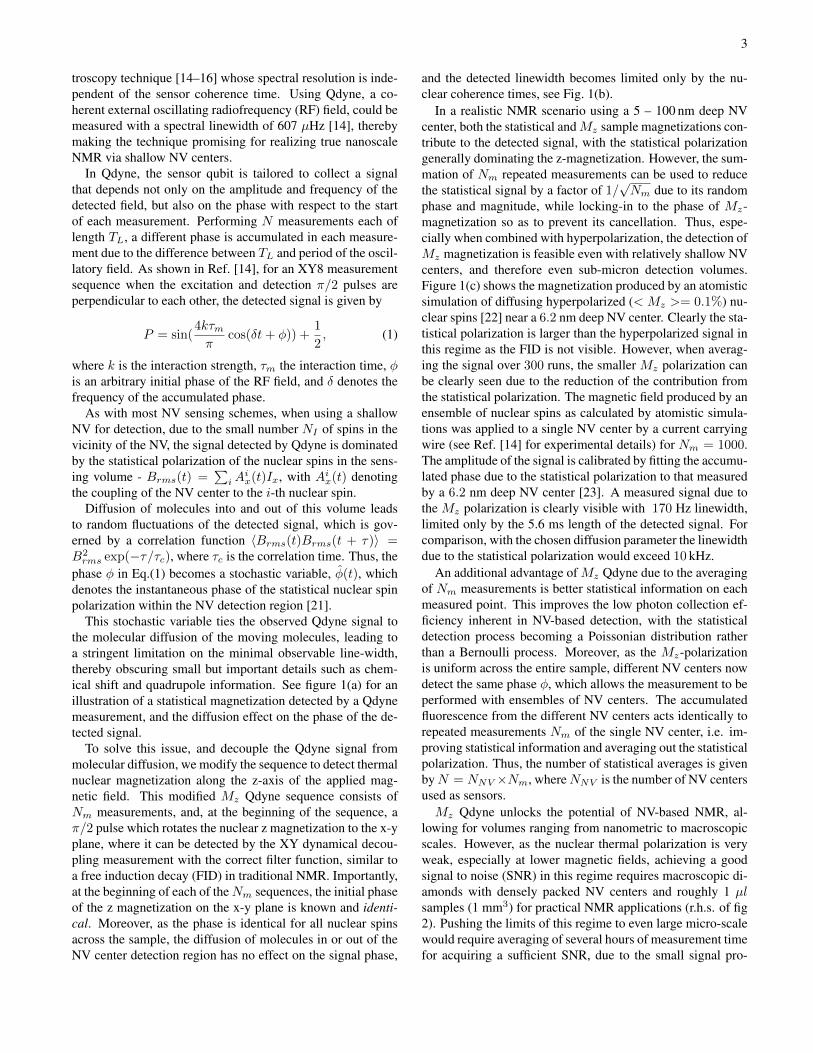
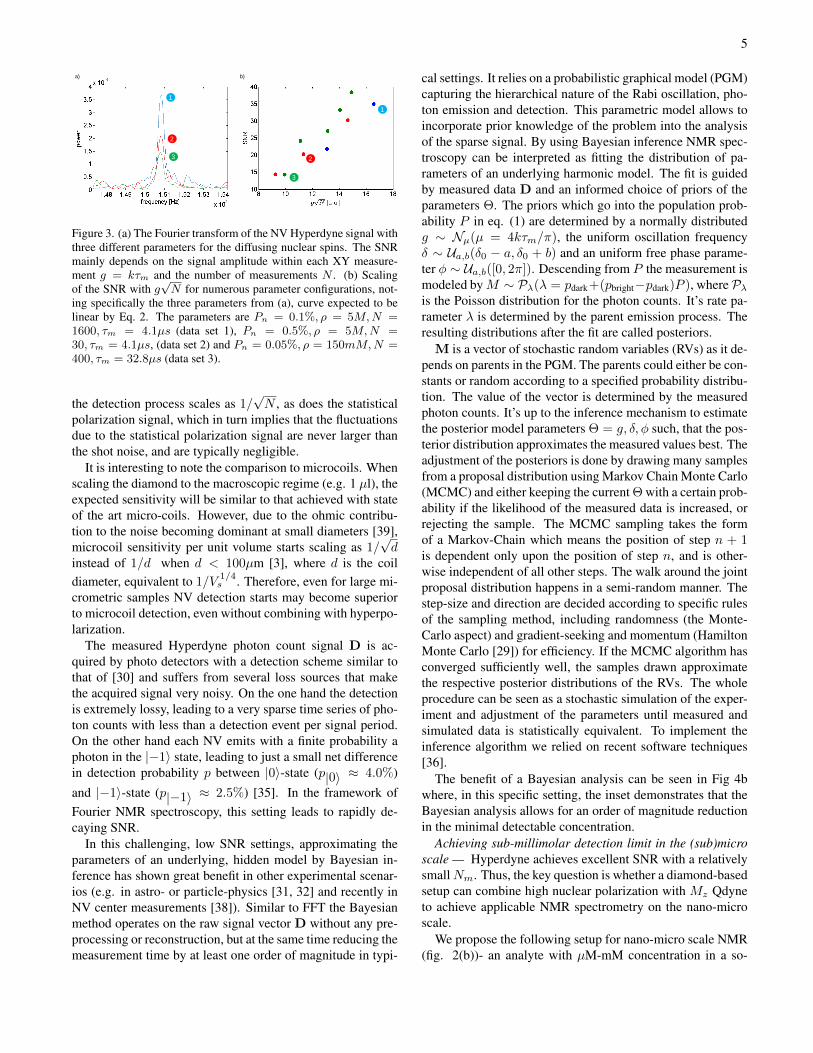
Figure 3(a) shows the Fourier transform of the acquiredMz
Qdyne signal by a 6.2 nm deep NV center for three scenar-ios with different polarization, molecular concentration andnumber of measurements N . All scenarios were producedby atomistic simulation of the detection process for diffus-ing nuclei at the density of water. One can see a differencein the SNR between the three scenarios, due to a difference ing = kτm and N . As shown in figure 3(b), the scaling of theSNR is proportional to g
√N , as expected from Eq. 2 [34].
As noted above, the statistical polarization can be largerthan the Mz polarization as it is reduced by the averaging ofthe signal. The statistical polarization does limit the accumu-lation time in the XY sequences for shallow NV centers, asthe condition γeBrmstm < π/2 needs to be fulfilled to en-sure that the Mz-signal is not fully randomized by the statis-tical polarization. As hyperpolarization enhances the Mz tostatistical polarization ratio, a larger Mz signal can be accu-mulated by shallow NV centers, enabling the sensing of nano-scale volumes. It is important to note that the shot noise in
5
1
2
3
1
2
3
a) b)
Figure 3. (a) The Fourier transform of the NV Hyperdyne signal withthree different parameters for the diffusing nuclear spins. The SNRmainly depends on the signal amplitude within each XY measure-ment g = kτm and the number of measurements N . (b) Scalingof the SNR with g
√N for numerous parameter configurations, not-
ing specifically the three parameters from (a), curve expected to belinear by Eq. 2. The parameters are Pn = 0.1%, ρ = 5M,N =1600, τm = 4.1µs (data set 1), Pn = 0.5%, ρ = 5M,N =30, τm = 4.1µs, (data set 2) and Pn = 0.05%, ρ = 150mM,N =400, τm = 32.8µs (data set 3).
the detection process scales as 1/√N , as does the statistical
polarization signal, which in turn implies that the fluctuationsdue to the statistical polarization signal are never larger thanthe shot noise, and are typically negligible.
It is interesting to note the comparison to microcoils. Whenscaling the diamond to the macroscopic regime (e.g. 1 µl), theexpected sensitivity will be similar to that achieved with stateof the art micro-coils. However, due to the ohmic contribu-tion to the noise becoming dominant at small diameters [39],microcoil sensitivity per unit volume starts scaling as 1/
√d
instead of 1/d when d < 100µm [3], where d is the coildiameter, equivalent to 1/V
1/4s . Therefore, even for large mi-
crometric samples NV detection starts may become superiorto microcoil detection, even without combining with hyperpo-larization.
The measured Hyperdyne photon count signal D is ac-quired by photo detectors with a detection scheme similar tothat of [30] and suffers from several loss sources that makethe acquired signal very noisy. On the one hand the detectionis extremely lossy, leading to a very sparse time series of pho-ton counts with less than a detection event per signal period.On the other hand each NV emits with a finite probability aphoton in the |−1〉 state, leading to just a small net differencein detection probability p between |0〉-state (p|0〉 ≈ 4.0%)and |−1〉-state (p|−1〉 ≈ 2.5%) [35]. In the framework ofFourier NMR spectroscopy, this setting leads to rapidly de-caying SNR.
In this challenging, low SNR settings, approximating theparameters of an underlying, hidden model by Bayesian in-ference has shown great benefit in other experimental scenar-ios (e.g. in astro- or particle-physics [31, 32] and recently inNV center measurements [38]). Similar to FFT the Bayesianmethod operates on the raw signal vector D without any pre-processing or reconstruction, but at the same time reducing themeasurement time by at least one order of magnitude in typi-
cal settings. It relies on a probabilistic graphical model (PGM)capturing the hierarchical nature of the Rabi oscillation, pho-ton emission and detection. This parametric model allows toincorporate prior knowledge of the problem into the analysisof the sparse signal. By using Bayesian inference NMR spec-troscopy can be interpreted as fitting the distribution of pa-rameters of an underlying harmonic model. The fit is guidedby measured data D and an informed choice of priors of theparameters Θ. The priors which go into the population prob-ability P in eq. (1) are determined by a normally distributedg ∼ Nµ(µ = 4kτm/π), the uniform oscillation frequencyδ ∼ Ua,b(δ0 − a, δ0 + b) and an uniform free phase parame-ter φ ∼ Ua,b([0, 2π]). Descending from P the measurement ismodeled byM ∼ Pλ(λ = pdark+(pbright−pdark)P ), wherePλis the Poisson distribution for the photon counts. It’s rate pa-rameter λ is determined by the parent emission process. Theresulting distributions after the fit are called posteriors.M is a vector of stochastic random variables (RVs) as it de-
pends on parents in the PGM. The parents could either be con-stants or random according to a specified probability distribu-tion. The value of the vector is determined by the measuredphoton counts. It’s up to the inference mechanism to estimatethe posterior model parameters Θ = g, δ, φ such, that the pos-terior distribution approximates the measured values best. Theadjustment of the posteriors is done by drawing many samplesfrom a proposal distribution using Markov Chain Monte Carlo(MCMC) and either keeping the current Θ with a certain prob-ability if the likelihood of the measured data is increased, orrejecting the sample. The MCMC sampling takes the formof a Markov-Chain which means the position of step n + 1is dependent only upon the position of step n, and is other-wise independent of all other steps. The walk around the jointproposal distribution happens in a semi-random manner. Thestep-size and direction are decided according to specific rulesof the sampling method, including randomness (the Monte-Carlo aspect) and gradient-seeking and momentum (HamiltonMonte Carlo [29]) for efficiency. If the MCMC algorithm hasconverged sufficiently well, the samples drawn approximatethe respective posterior distributions of the RVs. The wholeprocedure can be seen as a stochastic simulation of the exper-iment and adjustment of the parameters until measured andsimulated data is statistically equivalent. To implement theinference algorithm we relied on recent software techniques[36].
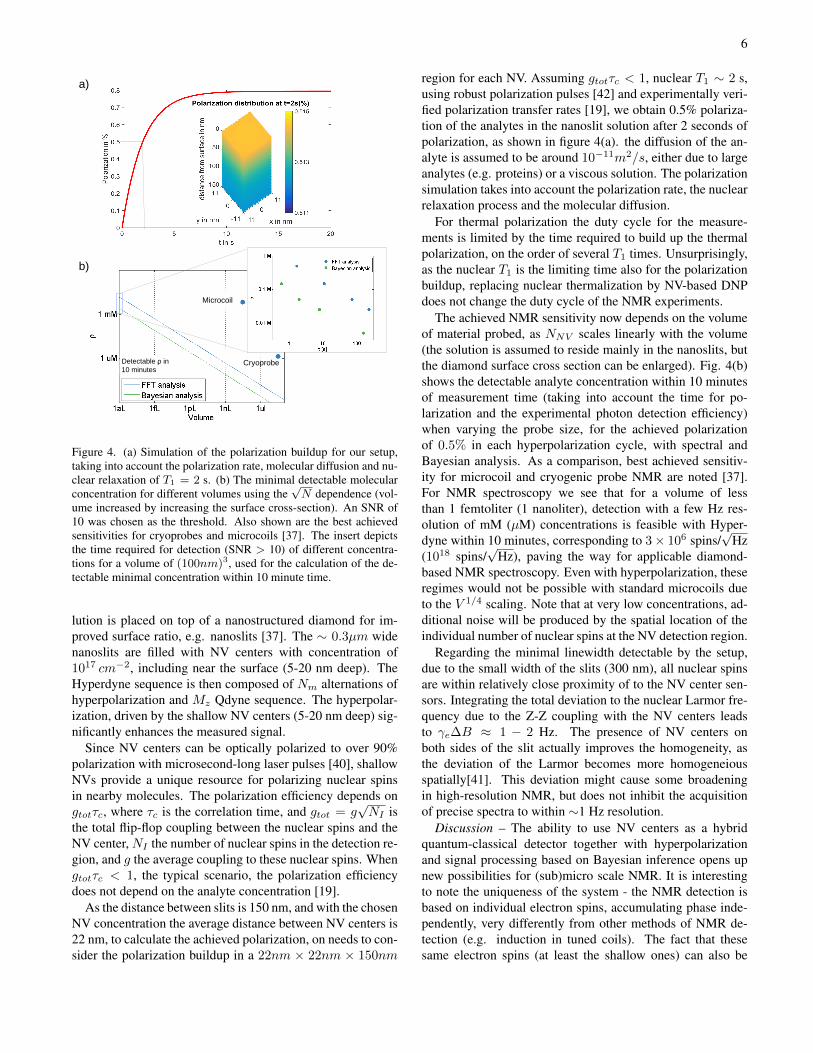
The benefit of a Bayesian analysis can be seen in Fig 4bwhere, in this specific setting, the inset demonstrates that theBayesian analysis allows for an order of magnitude reductionin the minimal detectable concentration.
Achieving sub-millimolar detection limit in the (sub)microscale — Hyperdyne achieves excellent SNR with a relativelysmallNm. Thus, the key question is whether a diamond-basedsetup can combine high nuclear polarization with Mz Qdyneto achieve applicable NMR spectrometry on the nano-microscale.
We propose the following setup for nano-micro scale NMR(fig. 2(b))- an analyte with µM-mM concentration in a so-
6
Detectable ρ in
10 minutes
a)
b)
Microcoil
Cryoprobe
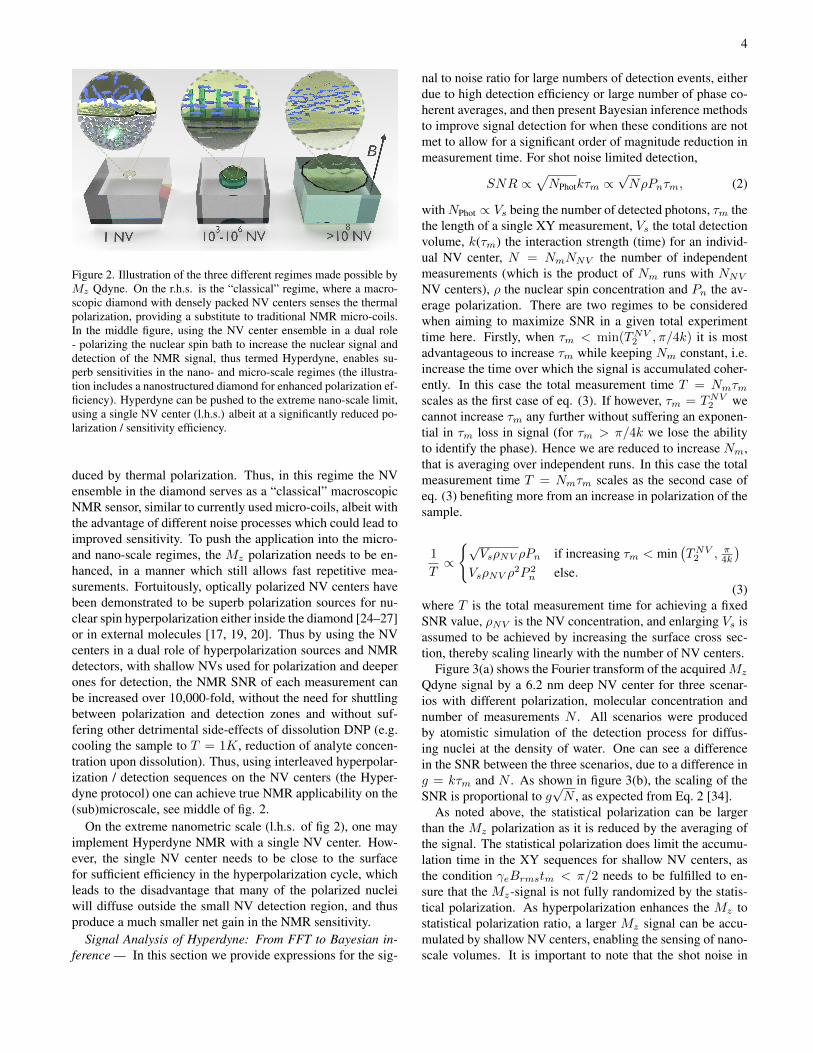
Figure 4. (a) Simulation of the polarization buildup for our setup,taking into account the polarization rate, molecular diffusion and nu-clear relaxation of T1 = 2 s. (b) The minimal detectable molecularconcentration for different volumes using the
√N dependence (vol-
ume increased by increasing the surface cross-section). An SNR of10 was chosen as the threshold. Also shown are the best achievedsensitivities for cryoprobes and microcoils [37]. The insert depictsthe time required for detection (SNR > 10) of different concentra-tions for a volume of (100nm)3, used for the calculation of the de-tectable minimal concentration within 10 minute time.
lution is placed on top of a nanostructured diamond for im-proved surface ratio, e.g. nanoslits [37]. The ∼ 0.3µm widenanoslits are filled with NV centers with concentration of1017 cm−2, including near the surface (5-20 nm deep). TheHyperdyne sequence is then composed of Nm alternations ofhyperpolarization and Mz Qdyne sequence. The hyperpolar-ization, driven by the shallow NV centers (5-20 nm deep) sig-nificantly enhances the measured signal.
Since NV centers can be optically polarized to over 90%polarization with microsecond-long laser pulses [40], shallowNVs provide a unique resource for polarizing nuclear spinsin nearby molecules. The polarization efficiency depends ongtotτc, where τc is the correlation time, and gtot = g
√NI is
the total flip-flop coupling between the nuclear spins and theNV center,NI the number of nuclear spins in the detection re-gion, and g the average coupling to these nuclear spins. Whengtotτc < 1, the typical scenario, the polarization efficiencydoes not depend on the analyte concentration [19].
As the distance between slits is 150 nm, and with the chosenNV concentration the average distance between NV centers is22 nm, to calculate the achieved polarization, on needs to con-sider the polarization buildup in a 22nm × 22nm × 150nm
region for each NV. Assuming gtotτc < 1, nuclear T1 ∼ 2 s,using robust polarization pulses [42] and experimentally veri-fied polarization transfer rates [19], we obtain 0.5% polariza-tion of the analytes in the nanoslit solution after 2 seconds ofpolarization, as shown in figure 4(a). the diffusion of the an-alyte is assumed to be around 10−11m2/s, either due to largeanalytes (e.g. proteins) or a viscous solution. The polarizationsimulation takes into account the polarization rate, the nuclearrelaxation process and the molecular diffusion.
For thermal polarization the duty cycle for the measure-ments is limited by the time required to build up the thermalpolarization, on the order of several T1 times. Unsurprisingly,as the nuclear T1 is the limiting time also for the polarizationbuildup, replacing nuclear thermalization by NV-based DNPdoes not change the duty cycle of the NMR experiments.
The achieved NMR sensitivity now depends on the volumeof material probed, as NNV scales linearly with the volume(the solution is assumed to reside mainly in the nanoslits, butthe diamond surface cross section can be enlarged). Fig. 4(b)shows the detectable analyte concentration within 10 minutesof measurement time (taking into account the time for po-larization and the experimental photon detection efficiency)when varying the probe size, for the achieved polarizationof 0.5% in each hyperpolarization cycle, with spectral andBayesian analysis. As a comparison, best achieved sensitiv-ity for microcoil and cryogenic probe NMR are noted [37].For NMR spectroscopy we see that for a volume of lessthan 1 femtoliter (1 nanoliter), detection with a few Hz res-olution of mM (µM) concentrations is feasible with Hyper-dyne within 10 minutes, corresponding to 3× 10⁶ spins/
√Hz
(1018 spins/√
Hz), paving the way for applicable diamond-based NMR spectroscopy. Even with hyperpolarization, theseregimes would not be possible with standard microcoils dueto the V 1/4 scaling. Note that at very low concentrations, ad-ditional noise will be produced by the spatial location of theindividual number of nuclear spins at the NV detection region.
Regarding the minimal linewidth detectable by the setup,due to the small width of the slits (300 nm), all nuclear spinsare within relatively close proximity of to the NV center sen-sors. Integrating the total deviation to the nuclear Larmor fre-quency due to the Z-Z coupling with the NV centers leadsto γe∆B ≈ 1 − 2 Hz. The presence of NV centers onboth sides of the slit actually improves the homogeneity, asthe deviation of the Larmor becomes more homogeneiousspatially[41]. This deviation might cause some broadeningin high-resolution NMR, but does not inhibit the acquisitionof precise spectra to within ∼1 Hz resolution.
Discussion – The ability to use NV centers as a hybridquantum-classical detector together with hyperpolarizationand signal processing based on Bayesian inference opens upnew possibilities for (sub)micro scale NMR. It is interestingto note the uniqueness of the system - the NMR detection isbased on individual electron spins, accumulating phase inde-pendently, very differently from other methods of NMR de-tection (e.g. induction in tuned coils). The fact that thesesame electron spins (at least the shallow ones) can also be
7
optically polarized and serve as a source for suprathermal dy-namic nuclear polarization for the investigated nuclear spins isa fortuitous coincidence for the hybrid polarizer/micro-NMRsystem, and enables achieving remarkable sensitivities. Theachieved polarization of the molecules will depend on themolecular relaxation time and diffusion, and can be optimizedfor specific molecules.
Regarding the analysis of the Mz Qdyne signal, the intro-duced Bayesian analysis was shown to dramatically improvethe detection sensitivity. It is worth exploring how well thisanalysis could also improve non- hyperpolarized Qdyne, asit could push the limits (concentration, time, volume) of theregimes where it is applicable.
Summary and Conclusions — In this work we have pre-sented a blueprint for nanoscale NMR. Our approach buildson earlier work that demonstrates experimental feasibility ofthe required magnetic field detection scheme [14], on theoret-ical and experimental work that developed and demonstratedpolarization transfer from color centers to liquids [17, 19, 20]and signal processing methods [32, 33].
Acknowledgements — The authors would like to thankJochen Scheuer and Julen Simon Pedernales for discussionsand support. This work was supported by the EU projectsHYPERDIAMOND and DIADEMS, the ERC Synergy grantBioQ and a PhD fellowship of the Integrated Center for Quan-tum Science and Technology (IQST).
[1] M. Findeisen, S. Berger, 50 and More Essential NMR Experi-ments: A Detailed Guide, Wiley-VCH,Weinheim, 2014.
[2] V. Badilita, R. Ch. Meier, N. Spengler, U. Wallrabe, M. Utz,and J.G. Korvink, Microscale nuclear magnetic resonance: atool for soft matter research. Soft Matt. 8, 10583 (2012).
[3] A.G. Webb, Radiofrequency microcoils in magnetic resonance.Prog. Nuc. Magn. Res. Spectrosc. 31, 1 (1997).
[4] H.W. Spiess, 50th Anniversary Perspective: The Importanceof NMR Spectroscopy to Macromolecular Science. Macro-molecules 50, 1761 (2017).
[5] S.S. Zalesskiy, E. Danieli, B. Blmich, and V.P. Ananikov,Miniaturization of NMR Systems: Desktop Spectrometers, Mi-crocoil Spectroscopy, and NMR on a Chip for Chemistry, Bio-chemistry, and Industry. Chem. Rev. 114, 5641 (2014).
[6] J.H. Ardenkjaer-Larsen, B. Fridlund, A. Gram, G. Hansson, L.Hansson, M.H. Lerche, R. Servin, M. Thaning, and K. Golman,Increase in signal-to-noise ratio of ¿ 10,000 times in liquid-state NMR. Proc. Natl. Acad. Sci. USA. 100, 10158 (2003).
[7] S.B. Duckett and R.E. Mewis, Application of Parahydrogen In-duced Polarization Techniques in NMR Spectroscopy and Imag-ing. Acc. Chem. Res. 45, 1247 (2012).
[8] M. Grisi, F. Vincent, B. Volpe, R. Guidetti, N. Harris, A. Beckand G. Boero, NMR spectroscopy of single sub-nL ova with in-ductive ultra-compact single-chip probes. Sci. Rep. 7, 44670(2017).
[9] J.L. Markley, R. Bruschweiler, A.S. Edison, H.R. Eghbalnia, R.Powers, D. Raftery and D.S. Wishart, The future of NMR-basedmetabolomics. Curr. Opin. Biotech. 43, 34 (2017).
[10] T. Staudacher, F. Shi, S. Pezzagna, J. Meijer, J. Du, C.A. Mer-iles, F. Reinhard and J. Wrachtrup, Nuclear magnetic resonance
spectroscopy on a (5-nanometer)3 sample volume, Science 339,561 (2013).
[11] Y. Wu, F. Jelezko, M.B. Plenio and T. Weil, Diamond QuantumDevices in Biology. Angewandte Chemie International EditionMinireview 55, 6586 (2016).
[12] A. Gruber, A. Drabenstedt, C. Tietz, L. Fleury, J. Wrachtrup andC. von Borczyskowski, Scanning Confocal Optical Microscopyand Magentic Resonance on Single Defect Centers in Diamond.Science 276, 2012 (1997).
[13] E. van Oort, P. Stromer and M. Glasbeek, Low-field opticallydetected magnetic resonance of a coupled triplet-doublet defectpair in diamond. Phys. Rev. B 42, 8605 (1990).
[14] S. Schmitt, T. Gefen, F.M. Strmer, T. Unden, G. Wolff, Ch.Mller, J. Scheuer, B. Naydenov, M. Markham, S. Pezzagna, J.Meijer, I. Schwarz, M. B. Plenio, A. Retzker, L.P. McGuin-ness, and F. Jelezko, Sub-millihertz magnetic spectroscopy per-formed with a nanoscale quantum sensor. Science 351, 832(2017).
[15] J.M. Boss, K.S. Cujia, J. Zopes, and C.L. Degen, QuantumSensing with arbitrary frequency resolution. Science 351, 837(2017).
[16] D.B. Bucher, D.R. Glenn, J. Lee, M.D. Lukin, H. Park, and R.L.Walsworth, High Resolution Magnetic Resonance SpectroscopyUsing Solid-State Spins. E-print arXiv:1705.08887.
[17] Q. Chen, I. Schwarz, F. Jelezko, A. Retzker and M.B. Plenio,Resonance-inclined optical nuclear polarization of liquids indiamond structures. Phys. Rev. B 93, 060408(R)(2016).
[18] X. Kong, A. Stark, J.F. Du, L.P. McGuinness and F. Jelezko, To-wards Chemical Structure Resolution with Nanoscale NuclearMagnetic Resonance Spectroscopy. Phys. Rev. Appl. 4, 024004(2015)
[19] P. Fernandez-Acebal, O. Rosolio, J. Scheuer, I. Schwarz, B.Tratzmiller, Q. Chen, C. Muller, B. Naydenov, A. Retzker,M.B. Plenio, and F. Jelezko. Polarisation of oil molecules vianitrogen-vacancy centers in diamond. In preparation.
[20] D. Abrams, M.E. Trusheim, D.R. Englund, M.D. Shattuck, andC.A. Meriles, Dynamic nuclear spin polarization of liquids andgases in contact with nanostructured diamond. Nano Lett. 5,2471 (2014).
[21] Some fluctuations in φ are still expected due to spatial devia-tions of the molecule locations, however, this is expected to benegligible even for shallow NVs. k would also fluctuate due tothe density and spin fluctuations, but to a much lesser extentthan φ(t).
[22] The diffusion coefficient was chosen to be D = 10−12m2/s,similar to oil molecules.
[23] Linh M. Pham, Stephen J. DeVience, Francesco Casola, IgorLovchinsky, Alexander O. Sushkov, Eric Bersin, Junghyun Lee,Elana Urbach, Paola Cappellaro, Hongkun Park, Amir Yacoby,Mikhail Lukin, and Ronald L. Walsworth NMR technique fordetermining the depth of shallow nitrogen-vacancy centers indiamond. Physical Review B 93.4 (2016): 045425.
[24] J. Scheuer, I. Schwarz, Q. Chen, D. Schulze-Sunninghausen,P. Carl, P. Hofer, A. Retzker, H. Sumiya, J. Isoya, B. Luy,M.B. Plenio, B. Naydenov, and F. Jelezko. Optically induceddynamic nuclear spin polarisation in diamond. New J. Phys.18, 013040 (2016).
[25] G.A. Alvarez, C.O. Bretschneider, R. Fischer, P. London, H.Kanda, S. Onoda, J. Isoya, D. Gershoni, and L. Frydman. Localand bulk 13C hyperpolarization in nitrogen-vacancy-centreddiamonds at variable fields and orientations. Nature Comm. 6,(2015).
[26] J.P. King, K. Jeong, C.C. Vassiliou, C.S. Shin, R.H. Page, C.E.
8
Avalos, H.-J. Wang, and A. Pines. Room-temperature in situnuclear spin hyperpolarization from optically pumped nitrogenvacancy centres in diamond. Nature Comm. 6, (2015).
[27] J. Scheuer, I. Schwartz, S. Muller, Q. Chen, I. Dhand, M.B.Plenio, B. Naydenov, and F. Jelezko. Robust techniques forpolarization and detection of nuclear spin ensembles. E-printarXiv:1706.01315
[28] J. Salvatier, T. V. Wiecki, Ch. Fonnesbeck. Probabilistic pro-gramming in Python using PyMC3. PeerJ Computer Science 2(2016): e55.
[29] M. Hoffman, A. Gelman. The No-U-turn sampler: adaptivelysetting path lengths in Hamiltonian Monte Carlo. Journal ofMachine Learning Research 15.1 (2014): 1593-1623.
[30] T. Gaebel, M. Domhan, I. Popa, C. Wittmann, P. Neumann, F.Jelezko, ..., J. Meijer. Room-temperature coherent coupling ofsingle spins in diamond. Nature Physics, 2(6), 408-413. (2006)
[31] F. Feroz, M. Hobson, M. Bridges. MultiNest: an efficientand robust Bayesian inference tool for cosmology and particlephysics. Monthly Notices of the Royal Astronomical Society398.4 (2009): 1601-1614.
[32] J. Hilbe, R. de Souza, E. Ishida. Bayesian Models for Astro-physical Data: Using R, JAGS, Python, and Stan. CambridgeUniversity Press, 2017.
[33] J. Flegal, G. Jones Implementing MCMC: estimating with con-fidence. Handbook of Markov chain Monte Carlo, Boca Raton,Florida: Chapman & Hall/CRC, 175-197. (2011).
[34] Due to large deviations in the SNR caused by the Poissoninanphoton detection, we do not expect an exact linear line, but onlya trend.
[35] The detection efficiency can be significantly increased to almost100% by using single-shot readout.
[36] Practically the performance of the sampling highly depends onit’s initial starting value [33]. Therefore an as good as pos-sible a posteriori (MAP) estimate is used as a starting point.Recently tools for probabilistic programming (PP), automaticdifferentiation frameworks and advances in MCMC methodsmade automatic Bayesian inference on PGMs easy to formu-late and perform. The tool used in this work is called PyMC3[28]. The framework automatically derives a likelihood func-tion for the model and repeats the sampling and evaluation for aa defined upper bound. This reduces implementation effort andmake quick model changes possible.
[37] P. Kehayias, et al. Solution nuclear magnetic resonance spec-troscopy on a nanostructured diamond chip. arXiv preprintarXiv:1701.01401 (2017).
[38] I. Hincks, C. Granade, and D.G. Cory, Statistical Inference withQuantum Measurements: Methodologies for Nitrogen VacancyCenters in Diamond. E-print arXiv:1705.10897
[39] Peck, Timothy L., Richard L. Magin, and Paul C. Lauterbur.Design and analysis of microcoils for NMR microscopy. Journalof Magnetic Resonance, Series B 108.2 (1995): 114-124.
[40] N.B. Manson, J.P. Harrison,and M.J. Sellars. Nitrogen-vacancycenter in diamond: Model of the electronic structure and asso-ciated dynamics. Physical Review B. 74, 104303 (2006).
[41] See supplementary information.[42] I. Schwartz, J. Scheuer, B. Tratzmiller, S. Mller, Q. Chen, C.
Mller, B. Naydenov, F. Jelezko and M.B. Plenio. Pulsed Polar-isation for Robust DNP. In preparation
Recommended