Biofuel Impacts on Midwestern Agriculture
Chad Hart
Center for Agricultural and Rural Development
Iowa State University
January 16, 2007
2007 Wisconsin Fertilizer, Aglime and Pest Management Conference
Madison, Wisconsin
E-mail: [email protected]

Ethanol Explosion
Source: Renewable Fuels Association
0.0
0.5
1.0
1.5
2.0
2.5
3.0
3.5
4.0
4.5
5.0
1980
1982
1984
1986
1988
1990
1992
1994
1996
1998
2000
2002
2004
2006
Bil
lion
Gal
lons

Biodiesel Growth
Source: National Biodiesel Board
0
50
100
150
200
250
1999 2000 2001 2002 2003 2004 2005 2006
Mil
lion
Gal
lons

Renewable Fuels Standard
Source: Renewable Fuels Association
0
1
2
3
4
5
6
7
8
2006 2007 2008 2009 2010 2011 2012
Bil
lion
Gal
lons

Ethanol Industry Snapshots
Ethanol Plants Capacity (mgy)
Jan. 2000 54 1,749
Jan. 2001 56 1,921
Jan. 2002 61 2,347
Jan. 2003 68 2,707
Jan. 2004 72 3,101
Jan. 2005 81 3,644
Jan. 2006 95 4,336
Jan. 2007 110 5,386Source: Renewable Fuels Association
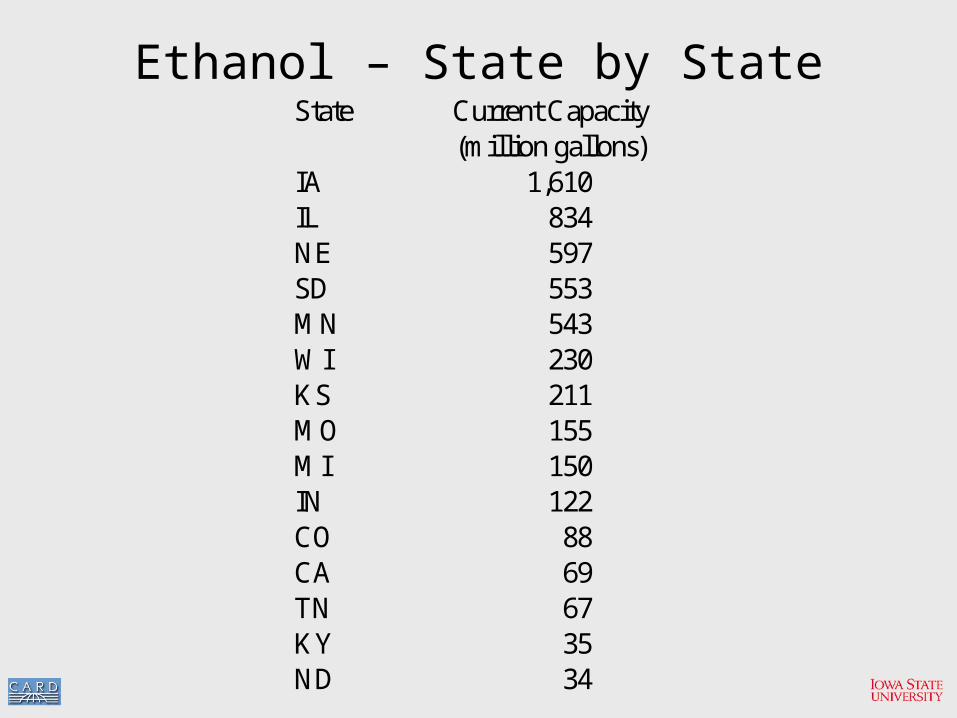
Ethanol – State by StateState Current Capacity
(million gallons)IA 1,610IL 834NE 597SD 553MN 543WI 230KS 211MO 155MI 150IN 122CO 88CA 69TN 67KY 35ND 34

Biodiesel – State by StateState Current Capacity
(million gallons)IA 112TX 104MN 63TN 48OH 41MO 36IL 35AR 27CO 27OK 23FL 23GA 19IN 15LA 15MI 15

Historical Corn Utilization
0
10
20
30
40
50
60
70
Marketing Year
%
Feed Ethanol Exports Other

Where Are We Headed?
• Based on construction announcements for ethanol plants, by the end of 2008, ethanol production capacity could exceed 12 billion gallons
• Announced biodiesel capacity exceeds 2 billion gallons

Ethanol – State by StateState Current Capacity Being Built Total
IA 1,610 1,230 2,840NE 597 1,163 1,760IL 834 398 1,232SD 553 360 913MN 543 351 894IN 122 699 821WI 230 282 512KS 211 240 451TX 0 370 370OH 4 345 349MI 150 107 257ND 34 200 234NY 0 164 164MO 155 0 155OR 0 143 143
(million gallons)

Biodiesel – State by StateState Current Capacity Being Built Total
IA 112 235 347TX 104 149 253IL 35 106 141IN 15 105 120ND 0 120 120MO 36 70 106WA 5 101 106MN 63 4 67AL 10 55 65PA 9 55 64SC 6 56 62NJ 13 45 58NE 0 55 55KY 4 50 54OH 41 11 51
(million gallons)
Wisconsin is ranked 24th with 25 million gallons of biodiesel capacity being built.

Projected Corn Utilization
0
10
20
30
40
50
60
70
Marketing Year
%
Feed Ethanol Exports Other
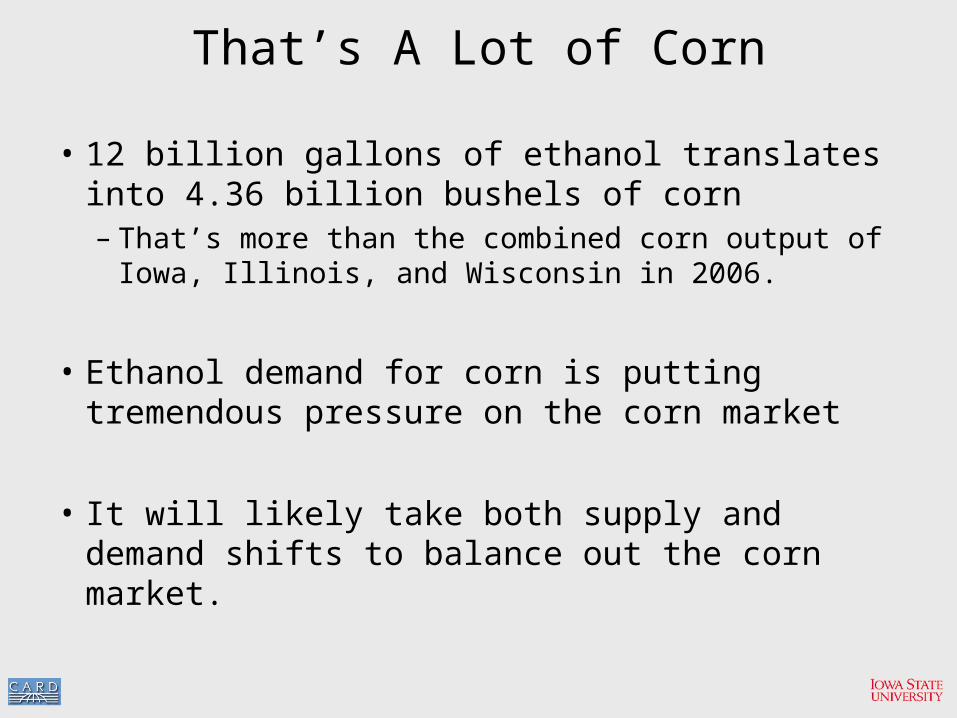
That’s A Lot of Corn
• 12 billion gallons of ethanol translates into 4.36 billion bushels of corn– That’s more than the combined corn output of Iowa,
Illinois, and Wisconsin in 2006.
• Ethanol demand for corn is putting tremendous pressure on the corn market
• It will likely take both supply and demand shifts to balance out the corn market.

U.S. Livestock Production
15
20
25
30
35
40B
illi
on P
ound
s
Beef Pork Poultry
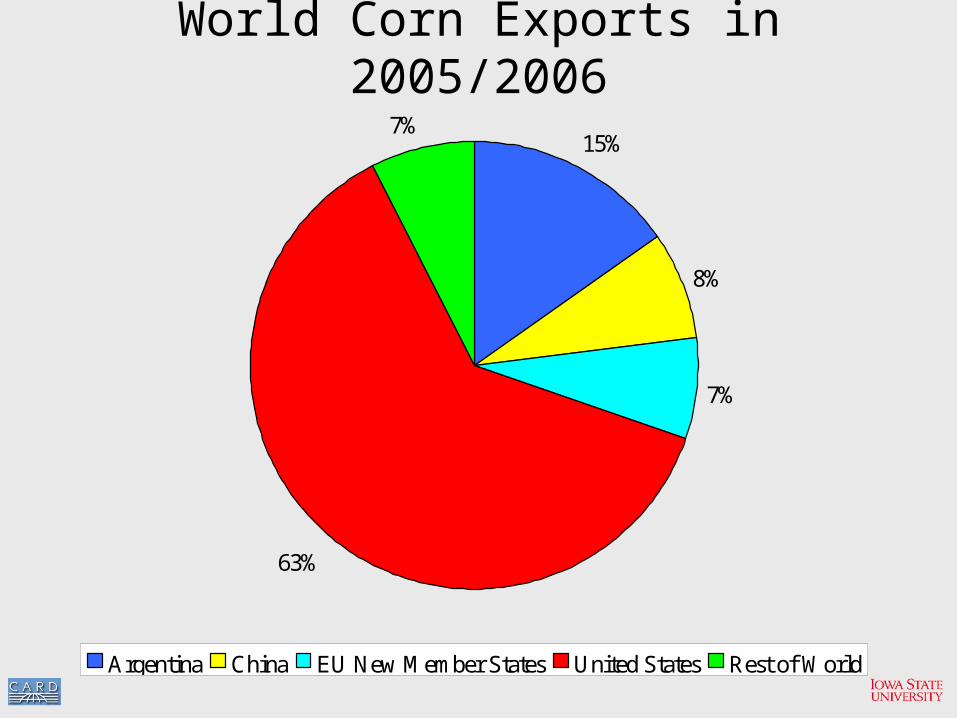
World Corn Exports in 2005/2006
15%
8%
7%
63%
7%
Argentina China EU New Member States United States Rest of World

Oil Futures As Of 1/8/2007
52
54
56
58
60
62
64
66
Feb.2007
Dec.2007
Dec.2008
Dec.2009
Dec.2010
Dec.2011
Dec.2012
$ pe
r ba
rrel

Nearby Corn Futures
2.00
2.20
2.40
2.60
2.80
3.00
3.20
3.40
3.60
3.80
4.00
$ pe
r bu
shel

Corn Futures As Of 1/8/2007
3.35
3.40
3.45
3.50
3.55
3.60
3.65
3.70
Dec. 2007 Dec. 2008 Dec. 2009
$ pe
r bu
shel

Support for More Corn Acres
• Futures prices are providing a definite signal for more corn acres
• Early projections for the 2007 crop year indicate acreage in the mid-to-upper 80 million acre range
• Up substantially from 2006, but will it be enough?

Where Will the Acreage Come From?
State 2000-2006 Average Percentage of If the States Followed a 2/1 Rotation Corn Soybeans Acreage in Corn Corn Soybeans
(acres) (acres) Illinois 11,421 10,236 53% 14,438 7,219 Indiana 5,657 5,571 50% 7,486 3,743 Iowa 12,386 10,450 54% 15,224 7,612 Kansas 3,314 2,850 54% 4,110 2,055 Kentucky 1,217 1,279 49% 1,664 832 Michigan 2,221 2,036 52% 2,838 1,419 Minnesota 7,214 7,257 50% 9,648 4,824 Missouri 2,864 5,050 36% 5,276 2,638 Nebraska 8,307 4,743 64% 8,700 4,350 Ohio 3,371 4,493 43% 5,243 2,621 South Dakota 4,350 4,179 51% 5,686 2,843 Wisconsin 3,636 1,610 69% 3,497 1,749

Ethanol-Livestock Synergies

A 50-Million Gallon Ethanol Plant …
• Uses roughly 18.5 million bushels of corn– In Iowa, corn from 116,000 acres
• Produces 315 million pounds of distillers grains– This could feed approx. 60,000 dairy cattle or 17.26
million layers
• Utilizes natural gas/coal in plant operations– Manure from 60,000 dairy cattle could produce
methane to meet part of the ethanol plant’s energy needs

The Next Generation of Ethanol Plants
• Plants being constructed in Mead, Nebraska and Hereford, Texas are modeled on the ethanol-livestock synergies
• The Mead plant was scheduled to come online in Dec. 2006
• The Hereford plant is scheduled to be running by the second half of 2007

E3 Biofuels – Mead, Nebraska
• 24 million gallon ethanol plant paired with a 30,000 head feedlot
• Will process 8 million bushels of corn and 228,000 tons of manure
• The biogas from the manure is projected to meet the energy needs of the ethanol plant

E3 Biofuels – Mead, Nebraska
• 100,000 tons of wet distillers grains are also produced and fed to the cattle in the feedlot– Energy savings of not drying the distillers grains

Panda Ethanol – Hereford, Texas
• 100 million gallon ethanol plant surrounded by 3.5 million head of cattle (within 100 miles)– “Saudi Arabia of cattle manure”
• Utilizes 40 million bushels of corn and 900,000 tons of wet distillers grains
• Methane derived from manure will be burned to generate steam to power the plant
10 Observations about Ethanol
1. Ethanol production growth has exceeded expectations
– Growth has exceeded forecasts and has put the U.S. on pace to far exceed the RFS
– But the industry is approaching another barrier point (10% of gasoline usage)
2. Gasoline prices are likely to remain high enough to support ethanol

10 Observations about Ethanol
3. Ethanol margins can remain positive over a wide corn price range
4. Corn prices are likely to remain higher than usual
5. Given positive margins, ethanol plants will be competitive for corn at higher prices

10 Observations about Ethanol
6. To maintain all corn usage demands, the U.S. will need to dramatically expand corn acreage
7. Other countries will response to higher corn prices as well
8. With heighted demand and thin stocks, the corn market will be more volatile

10 Observations about Ethanol
9. Cellulosic ethanol has tremendous promise, but it will be several years before cellulosic ethanol truly impacts the energy markets
10. The merging of the energy and agricultural sectors will force substantial changes in both sectors
Recommended