Fourth Quarter 2014Connecticut Market Report
This issue
Going Global
Warren Buffett’s franchise expands

ct market report • 2
Welcome to Berkshire Hathaway HomeServices New England Properties’ Fourth Quarter Connecticut Market Report, our examination of the single family and condominium markets in Connecticut.
2014 proved to be consistent with 2013 sales volume and pricing with 26,340 total sales and an average sales price of $411,400. Condominium sales continued to see robust gains in both average price and number of sales with 1.47% and 0.6% increases respectively. The luxury market saw an uptick in sales at all price points, with a 10% increase in sales over $5 million. When reviewing the Fourth Quarter specifically, closed sales were up slightly year over year, average price continued to drop while days on market remained consistent. Those properties priced properly in their market and in show-ready condition continued to sell at asking price in fewer days than competitive homes. Inventory decreased this quarter which will be beneficial to sellers who have already listed their home as the spring market quickly approaches.
In 2015 we anticipate that interest rates will begin to increase as employment, as well as GDP, continue to grow at a moderate pace. First time homebuyers, as well as those returning to homeownership, will see a number of great opportunities in 2015, with lenders increasing the maximum loan to value to 97% from 95% and FHA reducing the annual mortgage insurance premium by .50 bps, allowing more customers to qualify.
At Berkshire Hathaway HomeServices New England Properties, our mission is to provide an unparalleled customer service experience throughout all aspects of the home transaction process. If you have any questions regarding this report, Berkshire Hathaway HomeServices New England Properties REAlToRS® are here to help you navigate the current market with expert knowledge and exceptional service.
President and CEo
Prepared by:
Candace Adams, President/CEO, [email protected] Redican, Director of Marketing, [email protected] Pruner, REALTOR®, Greenwich Office, [email protected] - The Luxury Market Report
2015 expansionBerkshire hathaway homeservices
kicks off next phase of expansion
for 2015! With all Prudential
affiliates on board, Warren Buffett’s
franchise brand will go global.
Read the full article
famous faces in historical places
This timeless riverfront estate, listed by Mary Palmieri Gai, is truly a piece of history. The property’s
over 10 acres have been home to a notable cast of characters over its
250 years, including Paul Newman’s mother-in-law (Joanne Woodward’s mother), twentieth century sculptor James earle Fraser and generations
of the Coley family. set on one of the largest parcels in Westport, CT, at one point the estate included a town green, schoolhouse, gristmill,
shoemaker and blacksmith.
see the property

ct market report • 3
Contents
CoNNECTICuT ovERvIEW
THE luxuRy MARkET
FAIRFIElD CouNTy
HARTFoRD CouNTy
lITCHFIElD CouNTy
MIDDlESEx CouNTy
NEW HAvEN CouNTy
NEW loNDoN CouNTy
TollAND CouNTy
WINDHAM CouNTy
Avon • www.35WesthillsDrive.bhhsNeproperties.com
Cover Photo: Greenwichwww.26GlenAvonDrive.bhhsNEproperties.com
Information here-in is based in whole or part on reports supplied by Collateral Analytics and area Multiple listing Services (MlS), for residential property transactions as of December 31st, 2014, and is being provided “as is.” Data maintained by an MlS may not reflect all real estate activity in the market. It is deemed reliable but not guaranteed.

Connecticut Market Overview Q4-2014
back to table of contents • www.bhhsNEproperties.com ct market report • 4
2014 By THE NuMBERS
AVERAGE SALES PRICE MEDIAN SALES PRICE SALES DAyS oN MARkEt DoLLAR VoLuMEQTR 42014
%CHG13-14
QTR 42014
%CHG13-14
QTR 42014
%CHG13-14
QTR 42014
%CHG13-14
QTR 42014
%CHG13-14
FAIRFIELD CouNty
1 Family $780,900 -4.2% $450,000 0.0% 1767 -3.9% 147 -2.6% $1,379,798,000 -7.9%
Condo $332,000 4.1% $250,000 -3.8% 608 -0.5% 125 -5.6% $201,847,000 3.6%
HARtFoRD CouNty
1 Family $240,400 -4.4% $200,000 -3.5% 1581 -5.4% 74 7.5% $380,095,000 -9.6%
Condo $169,600 0.8% $145,000 -3.3% 449 6.4% 79 -7.4% $76,131,000 7.3%
LItCHFIELD CouNty
1 Family $414,100 18.8% $224,900 2.2% 387 9.3% 150 6.3% $160,242,000 29.9%
Condo $122,400 -9.4% $104,000 -1.0% 56 -1.8% 119 -32.6% $6,855,000 -10.9%
MIDDLESEX CouNty
1 Family $298,400 -9.3% $251,500 1.3% 382 20.9% 89 -11.2% $113,979,000 9.6%
Condo $153,000 -15.7% $124,500 -19.5% 75 21.0% 115 37.3% $11,473,000 2.0%
NEW HAVEN CouNty
1 Family $246,200 -1.5% $207,000 0.9% 1419 2.4% 96 3.4% $349,310,000 0.8%
Condo $155,800 4.9% $125,000 -2.2% 407 -0.7% 93 -6.0% $63,398,000 4.1%
NEW LoNDoN CouNty
1 Family $256,000 4.2% $200,000 -3.6% 517 4.0% 106 7.8% $132,349,000 8.4%
Condo $139,600 19.8% $133,500 33.5% 60 -4.8% 115 19.2% $8,378,000 14.1%
toLLAND CouNty
1 Family $226,700 -9.5% $206,400 -9.0% 258 5.7% 89 0.2% $58,487,000 -4.3%
Condo $179,500 16.9% $149,500 12.8% 36 -21.7% 63 -51.9% $6,461,000 -8.5%
WINDHAM CouNty
1 Family $170,800 -4.5% $155,000 -6.1% 201 5.2% 97 1.0% $34,321,000 0.5%
Condo $188,000 47.7% $210,000 69.4% 11 -31.2% 47 -80.5% $2,068,000 1.6%
• Connecticut’s condominium market saw increases in both number of sales and sales volume in 2014 by 0.6% and 2.1% respectively.
• The year ended with one of the lowest mortgage interest rates of the year: 3.875% for a conforming 30 year fixed loan. In 2014, rates stayed near historic lows in response to slow, but steady growth in employment and GDP.
• Days on market for single family homes dropped by 3.6% when compared to 2013, down to 103 days.
• Sales over $2 million jumped by 16 units or 3%.

Connecticut Market Overview Q4-2014
back to table of contents • www.bhhsNEproperties.com ct market report • 5
Stat
ewid
e C
lose
d Sa
les
0
1000
2000
3000
4000
5000
6000
7000
8000
9000
10000
Q3 2012 Q4 2012 Q1 2013 Q2 2013 Q3 2013 Q4 2013 Q1 2014 Q2 2014 Q3 2014
Sta
tew
ide
Clo
sed
Sal
es
Single Family Condominium
0
1000
2000
3000
4000
5000
6000
7000
8000
9000
Q1 2013 Q2 2013 Q3 2013 Q4 2013 Q1 2014 Q2 2014 Q3 2014 Q4 2014
Sta
tew
ide
Clo
sed
Sal
es
Single Family Condominium
NEW HouSING PERMITS
According to the National Association of Home Builders, sales of newly built, single family homes dropped 11.6% in November. In Connecticut, new housing permit data provided by the Connecticut Department of Economic and Community Development, shows a 15.4% increase year over year for single and multi-unit residential housing through November. Permits issued for 3-4 units and 5+ units showed the largest growth year to date with 90.2% and 41.0% increases respectively.
CloSED SAlES & CoNTRACTS SIGNED
There were 6,512 closed sales for single family homes during Fourth Quarter 2014, up 0.2% year over year. Condominium sales increased as well with 1,702 closed sales. Pending sales, or contracts signed on single family homes were down slightly by 0.8%, while signed contracts for condominiums dropped to its lowest number in two years with only 1,359 contracts signed.
Stat
ewid
e C
ontr
acts
Sig
ned
0
2000
4000
6000
8000
10000
12000
14000
Q3 2012 Q4 2012 Q1 2013 Q2 2013 Q3 2013 Q4 2013 Q1 2014 Q2 2014 Q3 2014
Co
ntr
acts
Sig
ned
Single Family Condominium
0
2000
4000
6000
8000
10000
12000
14000
Q1 2013 Q2 2013 Q3 2013 Q4 2013 Q1 2014 Q2 2014 Q3 2014 Q4 2014
Co
ntr
acts
Sig
ned
Single Family Condominium

Connecticut Market Overview Q4-2014
back to table of contents • www.bhhsNEproperties.com ct market report • 6
STATEWIDE SAlES voluME
Sales volume for single family homes decreased to $2.6 billion, down 3.76% when compared to Fourth Quarter 2013. Sales volume rose most notably in litchfield and Middlesex Counties by 29.9% and 9.6% respectively. Statewide condominium dollar volume was $376,610,000, a 4.0% increase year over year.
$0.0
$0.5
$1.0
$1.5
$2.0
$2.5
$3.0
$3.5
$4.0
Q3 2012 Q4 2012 Q1 2013 Q2 2013 Q3 2013 Q4 2013 Q1 2014 Q2 2014 Q3 2014
Do
llars
in
Bill
ion
s
Statewide Sales Volume
Single Family
Condominium
-4.7%Q3 2014 vs Q3 2013
-4.3%
Q3 2014 vs Q3 2013
$0.0
$0.5
$1.0
$1.5
$2.0
$2.5
$3.0
$3.5
$4.0
Q1 2013 Q2 2013 Q3 2013 Q4 2013 Q1 2014 Q2 2014 Q3 2014 Q4 2014
Do
llars
in
Bill
ion
s
Statewide Sales Volume
Single Family
Condominium
-3.76%Q4 2014 vs Q4 2013
+4.03%
Q4 2014 vs Q4 2013
HoME PRICES
year over year median prices for both single family and condominium home values are only slightly lower by percentage this quarter with single family home median sale price at $242,000. Average condominium sale price is up 3.1% statewide to $221,300 with Windham and New london Counties showing increases of 47.7% and 19.8% respectively.
Average Sales Price Single Family
Average Sales Price Condominium
Median Sales Price Single Family
Median Sales Price Condominium
Q3 2014 $420,600 $234,000 $265,000 $165,000
Change -4.8% -5.4% -8.7% -3.3%
Q4 2014 $400,600 $221,300 $242,000 $160,000
Q4 2013 $417,100 $214,600 $247,000 $163,000
Change -4.0% 3.1% -2.0% -1.8%
Q4 2014 $400,600 $221,300 $242,000 $160,000

Connecticut Market Overview Q4-2014
back to table of contents • www.bhhsNEproperties.com ct market report • 7
The Luxury Market
Greenwich • www.31OwenokeWay.bhhsNEproperties.com
High end sales typically follow a seasonal pattern with sales peaking in the third quarter; a pattern that repeated itself in 2014 for the $2-3 million market. The over $3 million market showed surprising strength with 49 fourth quarter sales in 2014 compared to 48 sales the same time last year. The over $5 million also had more sales in fourth quarter 2014 than in the third quarter, with 25 sales versus 22.
FouRTH QuARTER luxuRy SAlES
0 50 100 150 200 250
Q3 2012
Q4 2012
Q1 2013
Q2 2013
Q3 2013
Q4 2013
Q1 2014
Q2 2014
Q3 2014
Number of Sales
Luxury Sales Over $5 Million $3-$5 Million $2-$3 Million
0 50 100 150 200 250
Q1 2013
Q2 2013
Q3 2013
Q4 2013
Q1 2014
Q2 2014
Q3 2014
Q4 2014
Number of Sales
Luxury Sales Over $5 Million $3-$5 Million $2-$3 Million

Q4-2014
back to table of contents • www.bhhsNEproperties.com ct market report • 8
The Luxury Market
Sales of luxury properties over $2 million jumped by 16 units, or 3%. This increase was led by an increase of 15 house sales from $3 – 5 million or 9%. The increase over $5 million was even better with a 10% increase or 7 units. While 7 houses is not a large increase in unit sales it represents over $35 million in increased sales which is a significant investment in Connecticut.
Both New london County and New Haven County saw large jumps in sales over $2 million. Sales tripled in New london County and almost doubled in New Haven County. By far the largest number of sales of properties over $2 million in Connecticut is in Fairfield County. In 2014, 578 houses were sold for more than $2 million while the total of the other five counties was 40 sales or 6% of the luxury market.
ToTAl uNIT SAlES By CouNTy
SAlES ovER $2 MIllIoN IN 2014
0
100
200
300
400
500
600
700
2012 2013 2014
CT Sales >$2M by Year and County
CT - NEWLONDONCT - NEW HAVEN
CT - MIDDLESEX
CT - LITCHFIELD
CT - HARTFORD
FAIRFIELD HARtFoRD LItCHFIELD MIDDLESEX NEW HAVEN NEW LoNDoN Ct totAL
2012 $1,705,215,562 $16,465,000 $41,530,000 $17,100,000 $40,650,000 $4,850,000 $1,825,810,562
2013 $1,985,068,175 $7,500,000 $49,055,000 $20,490,000 $20,002,750 $5,400,000 $2,087,515,925
2014 $2,031,790,503 $7,826,492 $58,362,500 $7,600,000 $34,497,500 $15,705,000 $2,155,781,995
Total $5,722,074,240 $31,791,492 $148,947,500 $45,190,000 $95,150,250 $25,955,000 $6,069,108,482
0
100
200
300
400
500
600
700
2012 2013 2014
CT Sales >$2M by Year and County
CT - NEWLONDONCT - NEW HAVEN
CT - MIDDLESEX
CT - LITCHFIELD
CT - HARTFORD
NEW loNDoN
NEW HAvEN
MIDDlESEx
lITCHFIElD
HARTFoRD
FAIRFIElD

Q4-2014
back to table of contents • www.bhhsNEproperties.com ct market report • 9
overall 2014 was a good year for luxury sales in Connecticut with 617 units sold statewide for over $2 million. of these, slightly less than half or 288 units were sold in Greenwich. Greenwich had 16 properties sell for over $10 million which brought the average sale to $4 million dollars. Westport and New Canaan combined represent about a quarter of the statewide sales volume and unit sales in Connecticut with $260 million in sales. The highest average luxury sales price went to the Town of Washington, CT with a $4.3 million average for its 5 sales.
luxuRy SAlES By CITy AND ToWN
The Luxury Market
RANk by $ VoLuME toWN SALES totAL
$ SALESAVERAGE
SALESPERCENt by
uNItSPERCENt by
DoLLAR
1 GREENWICH 288 $1,158,883,292 $4,023,900 46.7% 53.8%
2 WESTPoRT 88 $261,351,160 $2,969,900 14.3% 12.1%
3 NEW CANAAN 83 $258,885,175 $3,119,098 13.5% 12.0%
4 DARIEN 68 $201,436,743 $2,962,305 11.0% 9.3%
5 FAIRFIElD 16 $54,451,500 $3,403,219 2.6% 2.5%
6 NoRWAlk 16 $50,147,633 $3,134,227 2.6% 2.3%
7 MADISoN 7 $18,687,500 $2,669,643 1.1% 0.9%
8 WASHINGToN 5 $23,350,000 $4,670,000 0.8% 1.1%
9 STAMFoRD 5 $12,887,500 $2,577,500 0.8% 0.6%
10 RIDGEFIElD 4 $11,212,500 $2,803,125 0.6% 0.5%
11 WIlToN 4 $10,967,500 $2,741,875 0.6% 0.5%
12 SHARoN 3 $12,547,500 $4,182,500 0.5% 0.6%
13 GRoToN 3 $7,830,000 $2,610,000 0.5% 0.4%
14 WESToN 3 $7,317,500 $2,439,167 0.5% 0.3%
15 WARREN 2 $7,050,000 $3,525,000 0.3% 0.3%
16 GuIlFoRD 2 $6,060,000 $3,030,000 0.3% 0.3%
17 FARMINGToN 2 $5,776,492 $2,888,246 0.3% 0.3%
18 MIlFoRD 2 $4,775,000 $2,387,500 0.3% 0.2%
19 ESSEx 2 $4,300,000 $2,150,000 0.3% 0.2%
20 BRIDGEWATER 1 $4,300,000 $4,300,000 0.2% 0.2%
21 lITCHFIElD 1 $3,815,000 $3,815,000 0.2% 0.2%
22 olD SAyBRook 1 $3,300,000 $3,300,000 0.2% 0.2%
23 BRANFoRD 1 $2,875,000 $2,875,000 0.2% 0.1%
24 MySTIC 1 $2,850,000 $2,850,000 0.2% 0.1%
25 SToNINGToN 1 $2,825,000 $2,825,000 0.2% 0.1%
26 RoxBuRy 1 $2,800,000 $2,800,000 0.2% 0.1%
27 SAlISBuRy 1 $2,275,000 $2,275,000 0.2% 0.1%
28 kENT 1 $2,225,000 $2,225,000 0.2% 0.1%
29 BRIDGEPoRT 1 $2,200,000 $2,200,000 0.2% 0.1%
30 WATERFoRD 1 $2,200,000 $2,200,000 0.2% 0.1%
31 WooDBRIDGE 1 $2,100,000 $2,100,000 0.2% 0.1%
32 AvoN 1 $2,050,000 $2,050,000 0.2% 0.1%
33 SHERMAN 1 $2,050,000 $2,050,000 0.2% 0.1%
tOtal 2014 617 $2,155,781,995 $3,493,974 100.0% 100%

back to table of contents • www.bhhsNEproperties.com ct market report • 10
Fairfield County
Greenwich • www.26GlenavonDrive.bhhsNEproperties.com
FAIRFIELD
NEW HAVEN
MIDDLESEX NEW LONDON
WINDHAM
TOLLANDHARTFORDLITCHFIELD

Q4-2014
back to table of contents • www.bhhsNEproperties.com ct market report • 11
Q4 2013
Single Family Condominium
Fairfield County
Fairfield County’s condominium market saw gains over last year with a 4.1% increase in average price and 5.6% decrease in days on market. Sales remained consistent year over year which confirms the demand for condominium properties in lower Connecticut. Single family home sales decreased by 3.9% to 1,767 sales but days on market also decreased again. Rental prices in Fairfield County continued to decrease this quarter with an average price of $2,300.
SINGlE FAMIly AND CoNDo RATIo
AvERAGE AND MEDIAN SAlES PRICE
Number of Sales
Days on Market
Q4 2014 2375 141
Q3 2014 2995 126
Q2 2014 2860 144
Q1 2014 1666 157
Q4 2013 2450 146
CondominiumsSingle Family
Q4 2013 Q4 2014
0
100000
200000
300000
400000
500000
600000
700000
800000
900000
Q3 2012 Q4 2012 Q1 2013 Q2 2013 Q3 2013 Q4 2013 Q1 2014 Q2 2014 Q3 2014
AVERAGE AND MEDIAN SALES PRICE
Average Single Family Average Condominium Median Single Family Median Condominium
0
100000
200000
300000
400000
500000
600000
700000
800000
900000
Q1 2013 Q2 2013 Q3 2013 Q4 2013 Q1 2014 Q2 2014 Q3 2014 Q4 2014
AVERAGE AND MEDIAN SALES PRICE
Average Single Family Average Condominium Median Single Family Median Condominium
Q4 2014
Single Family Condominium

Q4-2014
back to table of contents • www.bhhsNEproperties.com ct market report • 12
Fairfield County
AVERAGE SALES PRICE MEDIAN SALES PRICE SALES DAyS oN MARkEt DoLLAR VoLuMEQTR 42014
%CHG13-14
QTR 42014
%CHG13-14
QTR 42014
%CHG13-14
QTR 42014
%CHG13-14
QTR 42014
%CHG13-14
bEtHEL
1 Family $287,000 -4.8% $288,500 -0.9% 36 -5.3% 143 9.4% $10,333,000 -9.8%
Condo $279,000 34.5% $245,000 30.7% 18 100.0% 117 -3.4% $5,022,000 169.1%
bRIDGEPoRt
1 Family $149,200 16.5% $141,800 11.0% 138 4.5% 118 -15.4% $20,584,000 21.8%
Condo $74,900 -12.7% $62,800 -10.4% 62 37.8% 104 -33.8% $4,645,000 20.3%
bRookFIELD
1 Family $396,200 4.3% $367,500 10.5% 36 -28.0% 138 8.6% $14,265,000 -24.9%
Condo $231,300 -19.3% $180,000 -35.0% 23 -39.5% 125 -16.8% $5,321,000 -51.2%
DANbuRy
1 Family $271,600 -0.1% $255,000 7.4% 102 -8.1% 174 8.7% $27,705,000 -8.2%
Condo $209,900 -8.9% $197,500 -6.4% 80 -30.4% 144 8.5% $16,792,000 -36.6%
DARIEN
1 Family $1,463,000 -4.2% $1,430,000 10.0% 71 -2.7% 121 0.7% $103,874,000 -6.9%
Condo $435,400 -49.8% $541,000 -20.4% 8 166.7% 55 -67.5% $3,483,000 34.0%
EAStoN
1 Family $617,900 7.3% $582,500 2.6% 24 -7.7% 176 14.6% $14,830,000 -1.0%
Condo - - - - - - - - - -
FAIRFIELD
1 Family $733,200 -14.2% $545,000 -2.4% 120 -23.1% 119 -29.1% $87,985,000 -34.0%
Condo $444,600 19.9% $425,000 32.8% 21 61.5% 119 -10.9% $9,336,000 93.7%
GREENWICH
1 Family $2,423,700 -8.5% $1,775,000 -1.9% 149 0.7% 171 25.2% $361,136,000 -7.9%
Condo $891,500 6.7% $760,000 16.9% 50 25.0% 153 16.8% $44,573,000 33.3%
MoNRoE
1 Family $353,000 15.4% $337,500 12.5% 30 -23.1% 157 -1.9% $10,591,000 -11.2%
Condo $195,000 4.3% $190,000 0.0% 13 44.4% 122 -29.1% $2,535,000 50.6%
NEW CANAAN
1 Family $1,863,600 2.7% $1,562,500 -2.3% 58 5.5% 181 -4.8% $108,088,000 8.3%
Condo $854,400 -12.8% $892,500 6.3% 10 42.9% 130 15.2% $8,544,000 24.6%
NEW FAIRFIELD
1 Family $374,100 -2.8% $345,000 0.7% 46 7.0% 136 -38.2% $17,209,000 4.0%
Condo $324,100 - $324,900 - 5 - 97 - $1,620,000 -
NEWtoWN
1 Family $368,800 -4.4% $360,000 5.9% 79 8.2% 154 -8.1% $29,137,000 3.5%
Condo $460,000 36.8% $464,600 22.3% 12 9.1% 128 -45.9% $5,520,000 49.2%
NoRWALk
1 Family $636,300 10.3% $439,500 5.9% 148 2.8% 144 -5.3% $94,166,000 13.4%
Condo $284,200 15.3% $265,000 16.7% 83 31.7% 129 5.9% $23,590,000 52.0%
REDDING
1 Family $533,600 -16.3% $547,000 -12.6% 21 -4.5% 176 -3.8% $11,206,000 -20.1%
Condo - - - - - - - - - -

Q4-2014
back to table of contents • www.bhhsNEproperties.com ct market report • 13
Fairfield County
AVERAGE SALES PRICE MEDIAN SALES PRICE SALES DAyS oN MARkEt DoLLAR VoLuMEQTR 42014
%CHG13-14
QTR 42014
%CHG13-14
QTR 42014
%CHG13-14
QTR 42014
%CHG13-14
QTR 42014
%CHG13-14
RIDGEFIELD
1 Family $640,400 -25.0% $585,000 -14.0% 59 -21.3% 174 -4.2% $37,782,000 -41.0%
Condo $267,900 -15.1% $211,500 14.3% 14 7.7% 244 113.1% $3,751,000 -8.6%
SHELtoN
1 Family $359,100 8.9% $342,500 15.5% 91 21.3% 139 22.6% $32,679,000 32.1%
Condo $242,000 -10.4% $214,000 -4.0% 27 -25.0% 130 -12.0% $6,535,000 -32.8%
SHERMAN
1 Family $646,600 54.5% $534,500 54.9% 11 -26.7% 319 104.7% $7,113,000 13.3%
Condo - - - - - - - - - -
StAMFoRD
1 Family $676,600 -5.3% $575,000 -4.2% 177 9.3% 121 -10.7% $119,753,000 3.4%
Condo $350,100 1.4% $320,000 3.4% 131 -10.3% 105 -12.4% $45,860,000 -9.0%
StRAtFoRD
1 Family $237,700 -2.3% $225,000 0.0% 106 2.9% 156 16.3% $25,199,000 0.5%
Condo $171,000 -6.6% $163,500 0.3% 30 -3.2% 141 9.4% $5,131,000 -9.6%
tRuMbuLL
1 Family $364,100 -6.0% $330,000 -7.0% 92 -15.6% 98 -20.1% $33,500,000 -20.7%
Condo $365,800 13.6% $333,000 2.8% 9 -10.0% 100 -37.3% $3,292,000 2.3%
WEStoN
1 Family $929,200 14.6% $851,000 37.3% 32 -8.6% 221 50.9% $29,734,000 4.8%
Condo - - - - - - - - - -
WEStPoRt
1 Family $1,517,100 0.2% $1,250,000 4.2% 93 -9.7% 172 4.6% $141,087,000 -9.5%
Condo $539,800 -2.3% $500,000 31.6% 9 80.0% 120 21.7% $4,858,000 75.9%
WILtoN
1 Family $871,700 -14.9% $811,500 8.6% 48 -7.7% 159 -21.9% $41,844,000 -21.5%
Condo $478,800 14.1% $519,000 40.7% 3 -82.4% 86 -7.4% $1,437,000 -79.9%
back to table of contents • www.bhhsNEproperties.com ct market report • 14
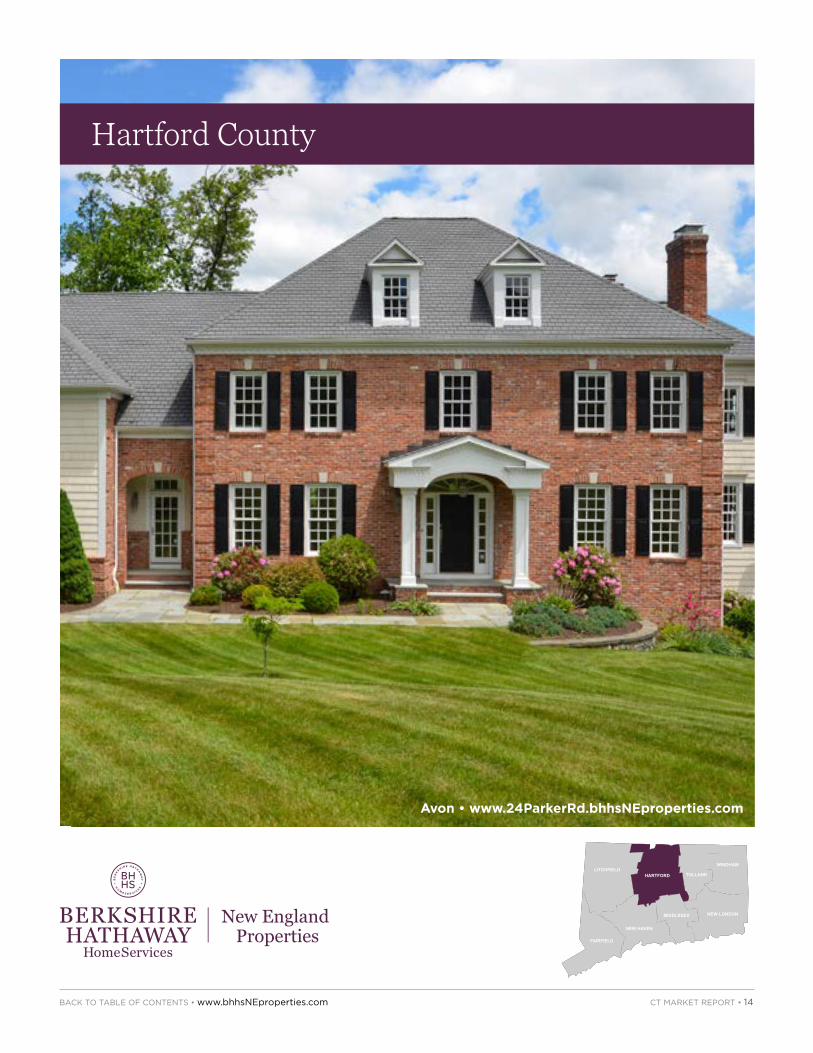
Hartford County
avon • www.24ParkerRd.bhhsNEproperties.com
FAIRFIELD
NEW HAVEN
MIDDLESEX NEW LONDON
WINDHAM
TOLLANDHARTFORDLITCHFIELD

Q4-2014
back to table of contents • www.bhhsNEproperties.com ct market report • 15
Q4 2014
Single Family Condominium
Q4 2013
Single Family Condominium
Hartford County
Hartford County’s single family home sales dropped by 5.4% this quarter. Total dollar volume in sales was $380,095,000, down 9.6% for single family homes and $76,131,000, up 7.3% for condominiums. The average sales price of single family homes was $240,400, down 4.4% from 2013 pricing and the average for condominiums was $169,600, up 0.8%. Average rental prices increased year over year to $2,100 per month.
CondominiumsSingle Family
Number of Sales
Days on Market
Q4 2014 2030 75
Q3 2014 2587 66
Q2 2014 2273 71
Q1 2014 1432 80
Q4 2013 2094 72
SINGlE FAMIly AND CoNDo RATIo
AvERAGE AND MEDIAN SAlES PRICE
Q4 2013 Q4 2014
0
50000
100000
150000
200000
250000
300000
Q1 2013 Q2 2013 Q3 2013 Q4 2013 Q1 2014 Q2 2014 Q3 2014 Q4 2014
AVERAGE AND MEDIAN SALES PRICE
Average Single Family Average Condominium Median Single Family Median Condominium

Q4-2014
back to table of contents • www.bhhsNEproperties.com ct market report • 16
Hartford County
AVERAGE SALES PRICE MEDIAN SALES PRICE SALES DAyS oN MARkEt DoLLAR VoLuMEQTR 42014
%CHG13-14
QTR 42014
%CHG13-14
QTR 42014
%CHG13-14
QTR 42014
%CHG13-14
QTR 42014
%CHG13-14
AVoN
1 Family $452,300 -35.0% $406,000 -21.5% 66 22.2% 69 -13.7% $29,850,000 -20.5%
Condo $270,700 16.5% $270,000 22.7% 25 56.3% 78 21.9% $6,766,000 82.0%
bERLIN
1 Family $267,300 -8.5% $252,500 -6.5% 37 -21.3% 54 -29.4% $9,890,000 -28.0%
Condo $223,700 -1.8% $226,100 -4.8% 12 20.0% 107 112.1% $2,685,000 17.9%
bLooMFIELD
1 Family $181,900 9.0% $176,000 10.8% 44 -6.4% 96 19.0% $8,004,000 2.0%
Condo $250,700 -22.7% $245,500 -30.6% 16 14.3% 95 -2.8% $4,011,000 -11.7%
bRIStoL
1 Family $177,800 4.6% $170,000 9.7% 111 -15.9% 65 -13.4% $19,732,000 -12.0%
Condo $110,300 -2.2% $104,900 7.0% 33 13.8% 116 0.6% $3,641,000 11.3%
buRLINGtoN
1 Family $376,400 12.9% $380,000 23.8% 23 -34.3% 113 77.2% $8,658,000 -25.8%
Condo - - - - - - - - - -
CANtoN
1 Family $375,600 18.4% $300,000 7.5% 28 21.7% 72 -12.2% $10,516,000 44.1%
Condo $153,600 24.5% $151,000 22.8% 5 -16.7% 83 28.7% $768,000 3.7%
EASt GRANby
1 Family $246,600 -5.4% $228,500 -8.6% 14 -6.7% 97 151.0% $3,452,000 -11.7%
Condo $100,500 22.6% $100,500 22.6% 2 100.0% 59 30.0% $201,000 145.1%
EASt HARtFoRD
1 Family $134,300 8.3% $136,000 6.7% 98 -4.9% 80 13.2% $13,157,000 3.0%
Condo $104,500 26.0% $88,800 40.9% 10 -9.1% 78 -33.4% $1,045,000 14.6%
EASt WINDSoR
1 Family $160,600 11.5% $134,000 -24.5% 11 57.1% 124 4.7% $1,767,000 75.2%
Condo $150,100 -26.0% $148,500 -27.6% 8 -38.5% 62 -66.2% $1,201,000 -54.5%
ENFIELD
1 Family $164,000 2.8% $163,000 3.3% 112 24.4% 69 0.0% $18,374,000 28.0%
Condo $169,000 10.0% $140,000 -6.0% 17 6.3% 78 -32.1% $2,873,000 16.9%
FARMINGtoN
1 Family $560,400 33.1% $431,300 21.5% 28 -31.7% 77 6.9% $15,691,000 -9.1%
Condo $232,900 11.0% $190,000 8.6% 25 0.0% 75 11.2% $5,821,000 11.0%
GLAStoNbuRy
1 Family $357,900 -4.3% $349,900 9.4% 67 -21.2% 66 21.9% $23,977,000 -24.5%
Condo $173,900 2.0% $160,000 -0.6% 22 -8.3% 76 -27.5% $3,826,000 -6.5%
GRANby
1 Family $240,100 -15.1% $235,000 -0.8% 21 -34.4% 63 -27.5% $5,042,000 -44.3%
Condo $178,500 -20.7% $181,500 -19.3% 4 300.0% 94 64.5% $714,000 217.3%
HARtFoRD
1 Family $138,400 -18.4% $134,000 13.7% 58 -24.7% 85 32.1% $8,026,000 -38.5%
Condo $121,500 13.8% $82,500 42.2% 24 14.3% 49 -57.4% $2,915,000 30.0%

Q4-2014
back to table of contents • www.bhhsNEproperties.com ct market report • 17
Hartford County
AVERAGE SALES PRICE MEDIAN SALES PRICE SALES DAyS oN MARkEt DoLLAR VoLuMEQTR 42014
%CHG13-14
QTR 42014
%CHG13-14
QTR 42014
%CHG13-14
QTR 42014
%CHG13-14
QTR 42014
%CHG13-14
MANCHEStER
1 Family $180,100 -0.8% $170,000 0.9% 107 -2.7% 72 -6.3% $19,271,000 -3.5%
Condo $116,000 -23.7% $116,000 -17.1% 21 0.0% 103 135.9% $2,437,000 -23.7%
MARLboRouGH
1 Family $253,900 -9.5% $233,200 -13.0% 26 23.8% 111 37.8% $6,601,000 12.1%
Condo $218,500 25.5% $218,500 25.5% 2 100.0% 51 2450.0% $437,000 151.1%
NEW bRItAIN
1 Family $122,800 -7.6% $122,200 -2.2% 80 -11.1% 65 -7.9% $9,823,000 -17.9%
Condo $88,600 -5.7% $77,900 -18.8% 17 0.0% 64 -16.3% $1,505,000 -5.7%
NEWINGtoN
1 Family $206,600 -8.7% $208,500 4.8% 68 13.3% 57 8.0% $14,048,000 3.5%
Condo $169,100 0.7% $149,500 -9.4% 32 10.3% 64 -7.7% $5,410,000 11.1%
PLAINVILLE
1 Family $188,200 4.1% $183,300 4.7% 34 -2.9% 75 73.0% $6,398,000 1.2%
Condo $153,600 22.4% $122,000 6.1% 19 35.7% 47 -42.9% $2,917,000 66.1%
RoCky HILL
1 Family $271,100 -4.1% $247,000 4.0% 28 3.7% 86 -7.7% $7,590,000 -0.5%
Condo $142,700 -25.2% $155,500 -22.0% 16 -20.0% 72 35.9% $2,283,000 -40.2%
SIMSbuRy
1 Family $290,500 -3.9% $280,000 -0.7% 41 -14.6% 92 38.9% $11,911,000 -17.9%
Condo $162,200 21.3% $127,100 -1.5% 15 -16.7% 79 16.5% $2,433,000 1.1%
SoutH WINDSoR
1 Family $300,000 -1.2% $271,700 6.6% 58 5.5% 47 7.5% $17,402,000 4.2%
Condo $144,800 4.5% $125,000 -1.6% 23 -17.9% 70 -0.3% $3,330,000 -14.2%
SoutHINGtoN
1 Family $280,100 -3.2% $291,000 13.7% 70 -19.5% 76 13.1% $19,604,000 -22.1%
Condo $173,700 -13.0% $181,000 -8.9% 19 -5.0% 81 36.9% $3,301,000 -17.3%
SuFFIELD
1 Family $348,900 20.3% $290,000 15.2% 28 -12.5% 136 7.0% $9,768,000 5.3%
Condo $189,700 -7.9% $165,000 2.6% 9 12.5% 147 136.7% $1,708,000 3.6%
WESt HARtFoRD
1 Family $310,800 -7.3% $276,000 -6.4% 147 -6.4% 61 4.2% $45,690,000 -13.2%
Condo $253,900 22.2% $242,500 50.2% 29 -6.5% 48 -37.1% $7,364,000 14.3%
WEtHERSFIELD
1 Family $221,200 -6.8% $213,500 -5.1% 78 6.8% 76 26.6% $17,250,000 -0.4%
Condo $114,900 22.4% $104,000 62.5% 16 220.0% 103 22.6% $1,839,000 291.7%
WINDSoR
1 Family $192,300 7.2% $170,000 2.4% 59 -15.7% 94 32.1% $11,343,000 -9.6%
Condo $162,300 -1.4% $168,000 -11.5% 19 46.2% 88 23.2% $3,085,000 44.1%
WINDSoR LoCkS
1 Family $186,100 3.2% $179,900 7.1% 39 105.3% 55 0.5% $7,257,000 111.8%
Condo $179,200 -15.4% $139,900 -36.7% 9 -10.0% 113 -50.8% $1,613,000 -23.9%

back to table of contents • www.bhhsNEproperties.com ct market report • 18
Litchfield County
Winchester • www.147ChapelRoad.bhhsneproperties.com
FAIRFIELD
NEW HAVEN
MIDDLESEX NEW LONDON
WINDHAM
TOLLANDHARTFORDLITCHFIELD

Q4-2014
back to table of contents • www.bhhsNEproperties.com ct market report • 19
Litchfield County
Single family home sales in litchfield County saw the biggest gains across the state this quarter with increases in average sales price and number of sales. Sales volume increased by 29.9% to $160,242,000 when compared to Fourth Quarter 2013. Condominium average price decreased by 9.4% to $122,400 and days on market decreased 32.6% to 119 days. Average rental prices increased 9.4% to $1,600 per month.
Number of Sales
Days on Market
Q4 2014 443 146
Q3 2014 502 120
Q2 2014 394 133
Q1 2014 282 162
Q4 2013 411 146
CondominiumsSingle Family
SINGlE FAMIly AND CoNDo RATIo
AvERAGE AND MEDIAN SAlES PRICE
Q4 2013 Q4 2014
0
50000
100000
150000
200000
250000
300000
Q3 2012 Q4 2012 Q1 2013 Q2 2013 Q3 2013 Q4 2013 Q1 2014 Q2 2014 Q3 2014
AVERAGE AND MEDIAN SALES PRICE
Average Single Family Average Condominium Median Single Family Median Condominium
0
50000
100000
150000
200000
250000
300000
350000
400000
Q3 2012 Q4 2012 Q1 2013 Q2 2013 Q3 2013 Q4 2013 Q1 2014 Q2 2014 Q3 2014
AVERAGE AND MEDIAN SALES PRICE
Average Single Family Average Condominium Median Single Family Median Condominium
0
50000
100000
150000
200000
250000
300000
350000
400000
450000
Q1 2013 Q2 2013 Q3 2013 Q4 2013 Q1 2014 Q2 2014 Q3 2014 Q4 2014
AVERAGE AND MEDIAN SALES PRICE
Average Single Family Average Condominium Median Single Family Median Condominium
Q4 2013
Single Family Condominium
Q4 2014
Single Family Condominium

Q4-2014
back to table of contents • www.bhhsNEproperties.com ct market report • 20
Litchfield County
AVERAGE SALES PRICE MEDIAN SALES PRICE SALES DAyS oN MARkEt DoLLAR VoLuMEQTR 42014
%CHG13-14
QTR 42014
%CHG13-14
QTR 42014
%CHG13-14
QTR 42014
%CHG13-14
QTR 42014
%CHG13-14
bARkHAMStED
1 Family $236,700 -2.2% $246,000 36.7% 11 83.3% 168 302.5% $2,604,000 79.3%
Condo - - - - - - - - - -
bEtHLEHEM
1 Family $286,000 -17.1% $276,500 2.0% 8 0.0% 235 27.8% $2,288,000 -17.1%
Condo - - - - - - - - - -
bRIDGEWAtER
1 Family $992,300 214.9% $550,000 84.9% 11 83.3% 304 0.3% $10,915,000 477.3%
Condo $200,000 - $200,000 - 2 - 120 - $400,000 -
CANAAN
1 Family $149,500 12.7% $135,000 -9.1% 8 60.0% 202 16.1% $1,196,000 80.3%
Condo - - - - - - - - - -
CoLEbRook
1 Family $226,000 -38.5% $226,000 -14.7% 2 -60.0% 154 -41.4% $452,000 -75.4%
Condo - - - - - - - - - -
CoRNWALL bRIDGE
1 Family $487,500 111.5% $487,500 111.5% 1 -50.0% 237 20.6% $488,000 5.7%
Condo - - - - - - - - - -
GoSHEN
1 Family $484,400 23.6% $352,500 32.3% 17 21.4% 249 54.7% $8,236,000 50.1%
Condo - - - - - - - - - -
HARWINtoN
1 Family $219,200 -21.2% $191,500 -26.9% 18 20.0% 95 39.1% $3,945,000 -5.4%
Condo $314,000 0.8% $314,000 0.8% 1 0.0% - - $314,000 0.8%
kENt
1 Family $642,200 -55.2% $423,800 28.4% 8 60.0% 239 -12.3% $5,138,000 -28.2%
Condo - - - - - - - - - -
LItCHFIELD
1 Family $689,300 56.8% $420,000 31.0% 17 -5.6% 148 -29.0% $11,717,000 48.1%
Condo $163,000 -29.2% $163,000 -33.2% 1 -83.3% 36 -81.1% $163,000 -88.2%
MoRRIS
1 Family $217,000 -35.0% $217,000 -14.9% 2 -60.0% 25 -73.6% $434,000 -74.0%
Condo - - - - - - - - - -
NEW HARtFoRD
1 Family $266,200 9.2% $255,000 41.7% 17 30.8% 89 -19.9% $4,525,000 42.8%
Condo $83,500 -7.2% $83,500 -7.2% 1 0.0% 35 2.9% $84,000 -7.2%
NEW MILFoRD
1 Family $281,200 -24.9% $261,000 0.4% 31 -16.2% 128 50.0% $8,718,000 -37.1%
Condo $152,800 -29.4% $133,800 -40.6% 6 50.0% 72 -65.2% $917,000 6.0%
NoRFoLk
1 Family $330,000 -55.0% $275,000 -62.5% 3 200.0% 239 82.2% $990,000 35.1%
Condo - - - - - - - - - -

Q4-2014
back to table of contents • www.bhhsNEproperties.com ct market report • 21
Litchfield County
AVERAGE SALES PRICE MEDIAN SALES PRICE SALES DAyS oN MARkEt DoLLAR VoLuMEQTR 42014
%CHG13-14
QTR 42014
%CHG13-14
QTR 42014
%CHG13-14
QTR 42014
%CHG13-14
QTR 42014
%CHG13-14
PLyMoutH
1 Family $190,900 25.7% $198,500 52.7% 8 14.3% 103 -21.5% $1,527,000 43.7%
Condo $130,300 - $130,300 - 2 - 184 - $261,000 -
RoXbuRy
1 Family $856,400 -8.9% $800,000 -1.2% 9 -40.0% 252 -22.5% $7,708,000 -45.4%
Condo - - - - - - - - - -
SALISbuRy
1 Family $678,800 -8.1% $377,500 -37.3% 8 100.0% 152 -18.2% $5,430,000 83.8%
Condo $315,200 - $300,000 - 3 - 53 - $946,000 -
SHARoN
1 Family $876,000 26.2% $150,000 -67.5% 5 25.0% 130 -52.0% $4,380,000 57.7%
Condo - - - - - - - - - -
tHoMAStoN
1 Family $169,300 -12.6% $170,500 -5.2% 15 114.3% 79 19.8% $2,539,000 87.3%
Condo $91,300 -26.6% $95,000 -3.2% 5 25.0% 84 -34.6% $456,000 -8.2%
toRRINGtoN
1 Family $143,100 6.3% $138,000 2.2% 72 -1.4% 92 -0.2% $10,303,000 4.9%
Condo $74,200 1.1% $62,000 -6.1% 19 -9.5% 158 2.1% $1,409,000 -8.5%
WARREN
1 Family $1,891,000 11.3% $1,100,000 29.4% 5 0.0% 542 94.6% $9,455,000 11.3%
Condo - - - - - - - - - -
WASHINGtoN
1 Family $1,979,400 271.3% $1,150,000 194.1% 17 13.3% 304 17.0% $33,651,000 320.8%
Condo - - - - - - - - - -
WAtERtoWN
1 Family $210,800 4.7% $182,000 -5.0% 44 -6.4% 111 9.8% $9,276,000 -2.0%
Condo $144,500 -15.4% $160,000 3.2% 6 50.0% 101 -51.3% $867,000 27.0%
WINCHEStER
1 Family $173,500 24.3% $130,000 -0.8% 29 81.3% 128 13.2% $5,030,000 125.4%
Condo $73,900 -5.2% $65,600 -15.9% 4 100.0% 198 180.5% $296,000 89.6%
WooDbuRy
1 Family $442,800 3.5% $311,000 -29.3% 21 16.7% 146 -19.2% $9,298,000 20.7%
Condo $124,000 -15.8% $89,500 -28.4% 6 -53.8% 92 -61.0% $744,000 -61.1%

Connecticut Market Overview Q4-2014
back to table of contents • www.bhhsNEproperties.com ct market report • 22
Middlesex County
Portland • www.1204tryonSt.bhhsNEproperties.com
FAIRFIELD
NEW HAVEN
MIDDLESEX NEW LONDON
WINDHAM
TOLLANDHARTFORDLITCHFIELD

Q4-2014
back to table of contents • www.bhhsNEproperties.com ct market report • 23
Middlesex County
Middlesex County saw increases of 9.6% in sales volume and 20.9% in number of sales this quarter. The average sales price of single family homes was $298,400, down 9.3% and the average for condominiums was $153,000, down 15.7%. Average rental prices remained flat compared to Fourth Quarter 2013 at $1,350 per month.
Number of Sales
Days on Market
Q4 2014 457 93
Q3 2014 543 81
Q2 2014 498 89
Q1 2014 325 109
Q4 2013 378 97
CondominiumsSingle Family
SINGlE FAMIly AND CoNDo RATIo
AvERAGE AND MEDIAN SAlES PRICE
Q4 2013 Q4 2014
0
50000
100000
150000
200000
250000
300000
350000
400000
Q3 2012 Q4 2012 Q1 2013 Q2 2013 Q3 2013 Q4 2013 Q1 2014 Q2 2014 Q3 2014
AVERAGE AND MEDIAN SALES PRICE
Average Single Family Average Condominium Median Single Family Median Condominium
0
50000
100000
150000
200000
250000
300000
350000
Q3 2012 Q4 2012 Q1 2013 Q2 2013 Q3 2013 Q4 2013 Q1 2014 Q2 2014 Q3 2014
AVERAGE AND MEDIAN SALES PRICE
Average Single Family Average Condominium Median Single Family Median Condominium
0
50000
100000
150000
200000
250000
300000
350000
Q1 2013 Q2 2013 Q3 2013 Q4 2013 Q1 2014 Q2 2014 Q3 2014 Q4 2014
AVERAGE AND MEDIAN SALES PRICE
Average Single Family Average Condominium Median Single Family Median Condominium
Q4 2013
Single Family Condominium
Q4 2014
Single Family Condominium

Q4-2014
back to table of contents • www.bhhsNEproperties.com ct market report • 24
Middlesex County
AVERAGE SALES PRICE MEDIAN SALES PRICE SALES DAyS oN MARkEt DoLLAR VoLuMEQTR 42014
%CHG13-14
QTR 42014
%CHG13-14
QTR 42014
%CHG13-14
QTR 42014
%CHG13-14
QTR 42014
%CHG13-14
CHEStER
1 Family $286,800 -32.4% $235,000 -38.6% 9 28.6% 80 -30.1% $2,582,000 -13.1%
Condo $222,500 - $222,500 - 2 - 55 - $445,000 -
CLINtoN
1 Family $255,300 -12.7% $242,000 -9.5% 40 33.3% 82 22.5% $10,213,000 16.4%
Condo $110,800 -27.6% $109,000 -35.1% 6 100.0% 75 -5.3% $665,000 44.9%
CobALt
1 Family - - - - - - - - - -
Condo - - - - - - - - - -
CRoMWELL
1 Family $242,200 -5.5% $215,000 -15.8% 19 -5.0% 107 72.2% $4,602,000 -10.3%
Condo $165,500 -8.8% $138,000 -1.4% 19 -9.5% 142 46.8% $3,144,000 -17.4%
DEEP RIVER
1 Family $276,300 -5.0% $245,000 -8.8% 13 8.3% 120 80.6% $3,592,000 2.9%
Condo $85,000 -39.9% $85,000 -39.9% 1 -50.0% 296 1276.7% $85,000 -70.0%
DuRHAM
1 Family $253,600 -5.6% $270,000 10.2% 14 7.7% 91 -1.4% $3,551,000 1.6%
Condo - - - - - - - - - -
EASt HADDAM
1 Family $249,300 -29.2% $256,300 -10.5% 15 7.1% 125 -6.5% $3,740,000 -24.1%
Condo - - - - - - - - - -
EASt HAMPtoN
1 Family $246,100 0.0% $194,000 -19.2% 29 3.6% 93 -16.0% $7,136,000 3.5%
Condo $299,000 93.7% $299,000 124.8% 1 -66.7% 364 849.6% $299,000 -35.4%
ESSEX
1 Family $536,600 -20.8% $432,000 -25.2% 22 22.2% 112 -42.6% $11,805,000 -3.2%
Condo $180,000 -25.0% $180,000 -25.0% 1 0.0% 322 323.7% $180,000 -25.0%
HADDAM
1 Family $362,600 2.7% $303,500 -8.3% 8 33.3% 118 -12.9% $2,901,000 36.9%
Condo - - - - - - - - - -
HADDAM NECk
1 Family - - - - - - - - - -
Condo - - - - - - - - - -
kILLINGWoRtH
1 Family $380,600 15.7% $340,000 30.8% 22 144.4% 77 -37.4% $8,372,000 182.9%
Condo - - - - - - - - - -
MIDDLEFIELD
1 Family $224,600 -9.8% $207,500 -17.0% 9 12.5% 92 -19.9% $2,021,000 1.5%
Condo $159,500 - $159,500 - 1 - 366 - $160,000 -

Q4-2014
back to table of contents • www.bhhsNEproperties.com ct market report • 25
Middlesex County
AVERAGE SALES PRICE MEDIAN SALES PRICE SALES DAyS oN MARkEt DoLLAR VoLuMEQTR 42014
%CHG13-14
QTR 42014
%CHG13-14
QTR 42014
%CHG13-14
QTR 42014
%CHG13-14
QTR 42014
%CHG13-14
MIDDLEtoWN
1 Family $213,400 -3.7% $197,000 -4.2% 92 17.9% 78 -2.5% $19,637,000 13.6%
Condo $100,600 -7.1% $105,000 22.1% 33 83.3% 87 72.3% $3,319,000 70.4%
oLD SAybRook
1 Family $457,100 -23.9% $327,000 14.7% 41 36.7% 86 -32.4% $18,742,000 3.9%
Condo $330,500 -6.8% $332,000 -7.3% 4 -42.9% 188 203.8% $1,322,000 -46.7%
PoRtLAND
1 Family $197,300 -15.1% $195,300 -18.6% 24 -11.1% 76 -7.1% $4,736,000 -24.5%
Condo $204,400 1.2% $199,300 -1.5% 4 0.0% 38 -56.9% $818,000 1.2%
WEStbRook
1 Family $414,000 -11.1% $332,000 -14.3% 25 56.3% 80 -33.5% $10,350,000 38.9%
Condo $345,800 36.0% $339,900 39.6% 3 0.0% 88 -73.9% $1,037,000 36.0%

back to table of contents • www.bhhsNEproperties.com ct market report • 26
New Haven County
FAIRFIELD
NEW HAVEN
MIDDLESEX NEW LONDON
WINDHAM
TOLLANDHARTFORDLITCHFIELD
Madison • www.54libertySt.bhhsNEproperties.com

Q4-2014
back to table of contents • www.bhhsNEproperties.com ct market report • 27
Q4 2014
Single Family Condominium
Q4 2013
Single Family Condominium
New Haven County
The demand for New Haven County’s condominium properties remained strong this quarter with a 4.9% increase in average sales price and 6.0% decrease in days on market. Total dollar volume in sales reached $349,310,000, up 0.8% for single family homes and $63,398,000, up 4.1% for condominiums. The average sales price of single family homes was $246,200, down 1.5% and the average for condominiums was $155,800, up 4.9%. Average rental prices remained consistent at $1,400 per month.
Number of Sales
Days on Market
Q4 2014 1826 95
Q3 2014 2172 83
Q2 2014 1949 88
Q1 2014 1221 98
Q4 2013 1796 94
CondominiumsSingle Family
SINGlE FAMIly AND CoNDo RATIo
AvERAGE AND MEDIAN SAlES PRICE
Q4 2013 Q4 2014
0
50000
100000
150000
200000
250000
300000
Q1 2013 Q2 2013 Q3 2013 Q4 2013 Q1 2014 Q2 2014 Q3 2014 Q4 2014
AVERAGE AND MEDIAN SALES PRICE
Average Single Family Average Condominium Median Single Family Median Condominium

Q4-2014
back to table of contents • www.bhhsNEproperties.com ct market report • 28
New Haven County
AVERAGE SALES PRICE MEDIAN SALES PRICE SALES DAyS oN MARkEt DoLLAR VoLuMEQTR 42014
%CHG13-14
QTR 42014
%CHG13-14
QTR 42014
%CHG13-14
QTR 42014
%CHG13-14
QTR 42014
%CHG13-14
ANSoNIA
1 Family $176,500 -3.9% $165,300 -8.2% 34 25.9% 137 -3.1% $6,000,000 21.0%
Condo - - - - - - - - - -
bEACoN FALLS
1 Family $226,100 -13.7% $222,500 -14.4% 8 14.3% 114 -29.4% $1,809,000 -1.4%
Condo $259,800 32.2% $259,300 17.9% 4 -42.9% 294 5.3% $1,039,000 -24.5%
bEtHANy
1 Family $419,600 51.9% $316,000 12.4% 15 7.1% 91 9.3% $6,293,000 62.7%
Condo - - - - - - - - - -
bRANFoRD
1 Family $320,900 -19.0% $305,900 -12.6% 55 34.1% 90 -28.4% $17,651,000 8.6%
Condo $159,800 -10.6% $154,000 -6.1% 43 -2.3% 90 -10.1% $6,869,000 -12.7%
CHESHIRE
1 Family $333,600 -2.0% $312,000 -0.5% 56 -3.4% 79 17.2% $18,684,000 -5.4%
Condo $271,900 58.9% $212,000 49.3% 17 -19.0% 57 -37.2% $4,622,000 28.6%
DERby
1 Family $174,500 1.6% $152,500 -5.3% 16 14.3% 105 -20.6% $2,793,000 16.1%
Condo $140,600 4.6% $140,700 -0.8% 6 -25.0% 100 20.1% $843,000 -21.5%
EASt HAVEN
1 Family $196,800 12.4% $165,000 -1.2% 53 3.9% 86 -16.4% $10,430,000 16.8%
Condo $165,200 38.7% $142,000 42.0% 21 10.5% 123 62.1% $3,469,000 53.3%
GuILFoRD
1 Family $572,400 38.0% $400,800 14.5% 42 -20.8% 126 20.1% $24,041,000 9.3%
Condo $158,300 9.3% $142,900 24.3% 13 8.3% 114 1.7% $2,058,000 18.5%
HAMDEN
1 Family $193,000 -8.3% $168,500 -15.7% 105 8.2% 103 14.9% $20,262,000 -0.7%
Condo $117,000 10.2% $110,000 26.4% 26 -10.3% 84 14.0% $3,043,000 -1.2%
MADISoN
1 Family $597,400 -5.2% $408,000 -14.1% 49 4.3% 101 -20.2% $29,273,000 -1.1%
Condo $334,600 -3.8% $271,500 -7.2% 12 20.0% 84 -44.4% $4,015,000 15.4%
MERIDEN
1 Family $140,000 -5.6% $135,000 -4.7% 95 -18.1% 73 -2.0% $13,303,000 -22.7%
Condo $86,700 -5.6% $90,500 -5.7% 28 21.7% 99 40.6% $2,428,000 15.0%
MIDDLEbuRy
1 Family $318,900 2.4% $348,300 18.1% 10 -9.1% 124 33.9% $3,189,000 -6.9%
Condo $319,900 113.3% $357,500 138.3% 5 400.0% 48 -31.4% $1,599,000 966.3%
MILFoRD
1 Family $330,900 17.4% $293,000 14.5% 126 13.5% 90 11.3% $41,693,000 33.3%
Condo $224,400 16.1% $197,500 12.9% 30 -14.3% 88 15.1% $6,731,000 -0.5%
NAuGAtuCk
1 Family $140,400 -16.5% $131,300 -20.5% 65 14.0% 113 9.5% $9,125,000 -4.8%
Condo $75,700 -5.8% $70,500 -11.4% 12 71.4% 56 -26.2% $909,000 61.4%
Q4-2014
back to table of contents • www.bhhsNEproperties.com ct market report • 29
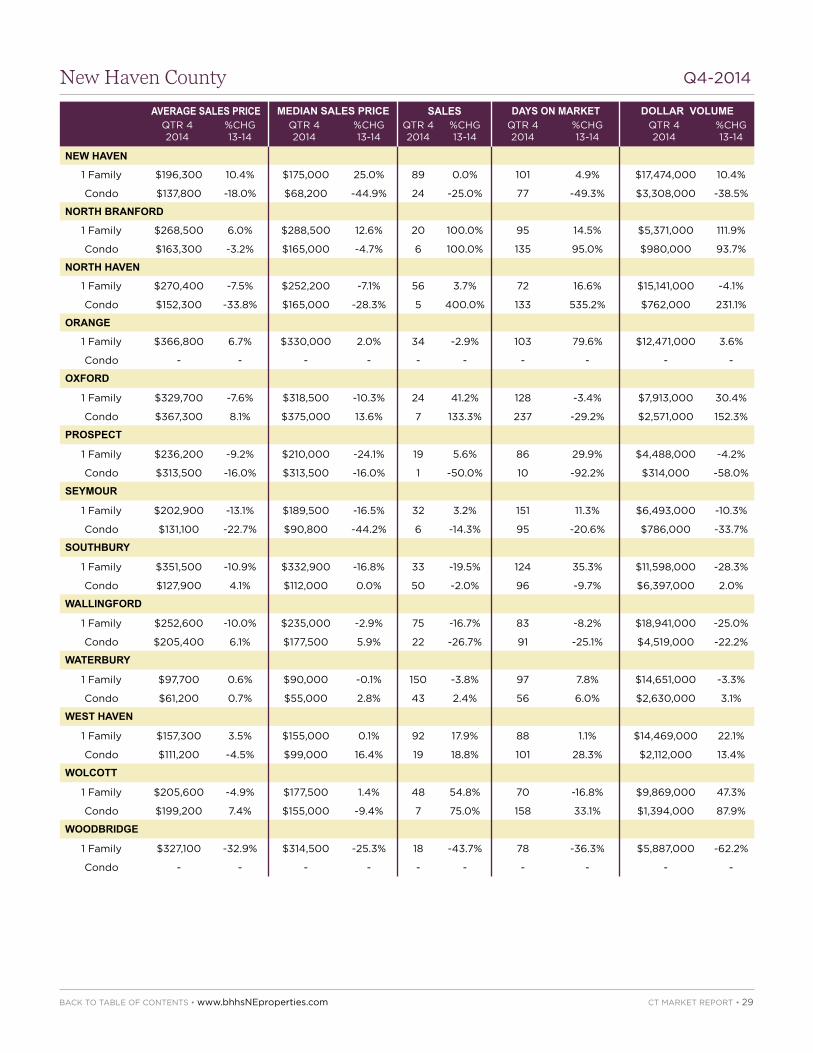
New Haven County
AVERAGE SALES PRICE MEDIAN SALES PRICE SALES DAyS oN MARkEt DoLLAR VoLuMEQTR 42014
%CHG13-14
QTR 42014
%CHG13-14
QTR 42014
%CHG13-14
QTR 42014
%CHG13-14
QTR 42014
%CHG13-14
NEW HAVEN
1 Family $196,300 10.4% $175,000 25.0% 89 0.0% 101 4.9% $17,474,000 10.4%
Condo $137,800 -18.0% $68,200 -44.9% 24 -25.0% 77 -49.3% $3,308,000 -38.5%
NoRtH bRANFoRD
1 Family $268,500 6.0% $288,500 12.6% 20 100.0% 95 14.5% $5,371,000 111.9%
Condo $163,300 -3.2% $165,000 -4.7% 6 100.0% 135 95.0% $980,000 93.7%
NoRtH HAVEN
1 Family $270,400 -7.5% $252,200 -7.1% 56 3.7% 72 16.6% $15,141,000 -4.1%
Condo $152,300 -33.8% $165,000 -28.3% 5 400.0% 133 535.2% $762,000 231.1%
oRANGE
1 Family $366,800 6.7% $330,000 2.0% 34 -2.9% 103 79.6% $12,471,000 3.6%
Condo - - - - - - - - - -
oXFoRD
1 Family $329,700 -7.6% $318,500 -10.3% 24 41.2% 128 -3.4% $7,913,000 30.4%
Condo $367,300 8.1% $375,000 13.6% 7 133.3% 237 -29.2% $2,571,000 152.3%
PRoSPECt
1 Family $236,200 -9.2% $210,000 -24.1% 19 5.6% 86 29.9% $4,488,000 -4.2%
Condo $313,500 -16.0% $313,500 -16.0% 1 -50.0% 10 -92.2% $314,000 -58.0%
SEyMouR
1 Family $202,900 -13.1% $189,500 -16.5% 32 3.2% 151 11.3% $6,493,000 -10.3%
Condo $131,100 -22.7% $90,800 -44.2% 6 -14.3% 95 -20.6% $786,000 -33.7%
SoutHbuRy
1 Family $351,500 -10.9% $332,900 -16.8% 33 -19.5% 124 35.3% $11,598,000 -28.3%
Condo $127,900 4.1% $112,000 0.0% 50 -2.0% 96 -9.7% $6,397,000 2.0%
WALLINGFoRD
1 Family $252,600 -10.0% $235,000 -2.9% 75 -16.7% 83 -8.2% $18,941,000 -25.0%
Condo $205,400 6.1% $177,500 5.9% 22 -26.7% 91 -25.1% $4,519,000 -22.2%
WAtERbuRy
1 Family $97,700 0.6% $90,000 -0.1% 150 -3.8% 97 7.8% $14,651,000 -3.3%
Condo $61,200 0.7% $55,000 2.8% 43 2.4% 56 6.0% $2,630,000 3.1%
WESt HAVEN
1 Family $157,300 3.5% $155,000 0.1% 92 17.9% 88 1.1% $14,469,000 22.1%
Condo $111,200 -4.5% $99,000 16.4% 19 18.8% 101 28.3% $2,112,000 13.4%
WoLCott
1 Family $205,600 -4.9% $177,500 1.4% 48 54.8% 70 -16.8% $9,869,000 47.3%
Condo $199,200 7.4% $155,000 -9.4% 7 75.0% 158 33.1% $1,394,000 87.9%
WooDbRIDGE
1 Family $327,100 -32.9% $314,500 -25.3% 18 -43.7% 78 -36.3% $5,887,000 -62.2%
Condo - - - - - - - - - -

back to table of contents • www.bhhsNEproperties.com ct market report • 30
New London County
Stonington • www.15FrontSt.bhhsNEproperties.com
FAIRFIELD
NEW HAVEN
MIDDLESEX NEW LONDON
WINDHAM
TOLLANDHARTFORDLITCHFIELD

Q4-2014
back to table of contents • www.bhhsNEproperties.com ct market report • 31
New London County
New london County single family home sales increased 4.0% year over year with sales volume reaching $132,349,000. The average sale price of single family homes was $256,000, up 4.2%, and the average for condominiums was $139,600, up 19.8%. Average rental prices remained flat when compared to third quarter at $1,400 per month.
Number of Sales
Days on Market
Q4 2014 577 107
Q3 2014 662 95
Q2 2014 607 97
Q1 2014 417 104
Q4 2013 560 98
SINGlE FAMIly AND CoNDo RATIo
AvERAGE AND MEDIAN SAlES PRICE
Q4 2013 Q4 2014
0
50000
100000
150000
200000
250000
300000
Q1 2013 Q2 2013 Q3 2013 Q4 2013 Q1 2014 Q2 2014 Q3 2014 Q4 2014
AVERAGE AND MEDIAN SALES PRICE
Average Single Family Average Condominium Median Single Family Median Condominium
Q4 2013
Single Family Condominium
Q4 2014
Single Family Condominium

Q4-2014
back to table of contents • www.bhhsNEproperties.com ct market report • 32
New London County
AVERAGE SALES PRICE MEDIAN SALES PRICE SALES DAyS oN MARkEt DoLLAR VoLuMEQTR 42014
%CHG13-14
QTR 42014
%CHG13-14
QTR 42014
%CHG13-14
QTR 42014
%CHG13-14
QTR 42014
%CHG13-14
boZRAH
1 Family $124,000 -40.6% $125,500 -44.2% 4 -20.0% 49 64.2% $496,000 -52.5%
Condo - - - - - - - - - -
CoLCHEStER
1 Family $225,000 -7.0% $232,000 -4.9% 39 -11.4% 84 -23.3% $8,777,000 -17.6%
Condo $145,000 -15.2% $145,000 3.8% 3 -62.5% 78 -51.6% $435,000 -68.2%
EASt LyME
1 Family $318,800 -13.0% $267,500 -26.7% 26 -10.3% 90 17.6% $8,290,000 -22.0%
Condo $155,800 46.6% $155,800 46.6% 2 0.0% 26 -72.0% $312,000 46.6%
GRISWoLD
1 Family $219,500 45.8% $187,500 16.7% 27 35.0% 99 9.8% $5,927,000 96.9%
Condo $50,900 28.9% $43,500 15.5% 5 -16.7% 60 47.2% $254,000 7.4%
GRotoN
1 Family $364,700 46.5% $215,000 10.3% 55 41.0% 129 42.3% $20,057,000 106.7%
Condo $126,000 15.5% $121,000 18.0% 17 21.4% 136 76.8% $2,142,000 40.2%
LEbANoN
1 Family $202,900 -13.4% $212,000 -9.6% 17 -39.3% 177 92.0% $3,449,000 -47.4%
Condo - - - - - - - - - -
LEDyARD
1 Family $213,900 0.2% $233,500 7.2% 48 2.1% 95 -3.9% $10,268,000 2.4%
Condo $105,000 48.7% $105,000 54.4% 2 -60.0% 104 249.0% $210,000 -40.5%
LISboN
1 Family $174,300 13.2% $175,000 9.4% 9 -40.0% 72 -36.0% $1,569,000 -32.1%
Condo - - - - - - - - - -
LyME
1 Family $482,400 -27.5% $260,000 -48.7% 5 25.0% 377 208.9% $2,412,000 -9.4%
Condo - - - - - - - - - -
NEW LoNDoN
1 Family $157,100 13.7% $148,500 17.4% 30 -6.2% 90 41.9% $4,713,000 6.6%
Condo $160,900 109.1% $170,000 179.4% 7 75.0% 157 435.8% $1,126,000 266.0%
NoRtH FRANkLIN
1 Family $155,000 -31.3% $155,000 -33.9% 1 -75.0% 17 -57.8% $155,000 -82.8%
Condo - - - - - - - - - -
NoRtH StoNINGtoN
1 Family $304,300 21.1% $285,000 18.3% 6 -57.1% 94 27.3% $1,826,000 -48.1%
Condo - - - - - - - - - -
NoRWICH
1 Family $111,600 -10.2% $116,500 1.7% 78 4.0% 88 -16.4% $8,702,000 -6.6%
Condo $77,500 -17.5% $53,000 -48.0% 9 -30.8% 61 -34.7% $697,000 -42.9%
oLD LyME
1 Family $348,900 -24.9% $320,800 -13.9% 36 20.0% 129 -11.4% $12,561,000 -9.9%
Condo - - - - - - - - - -
Q4-2014
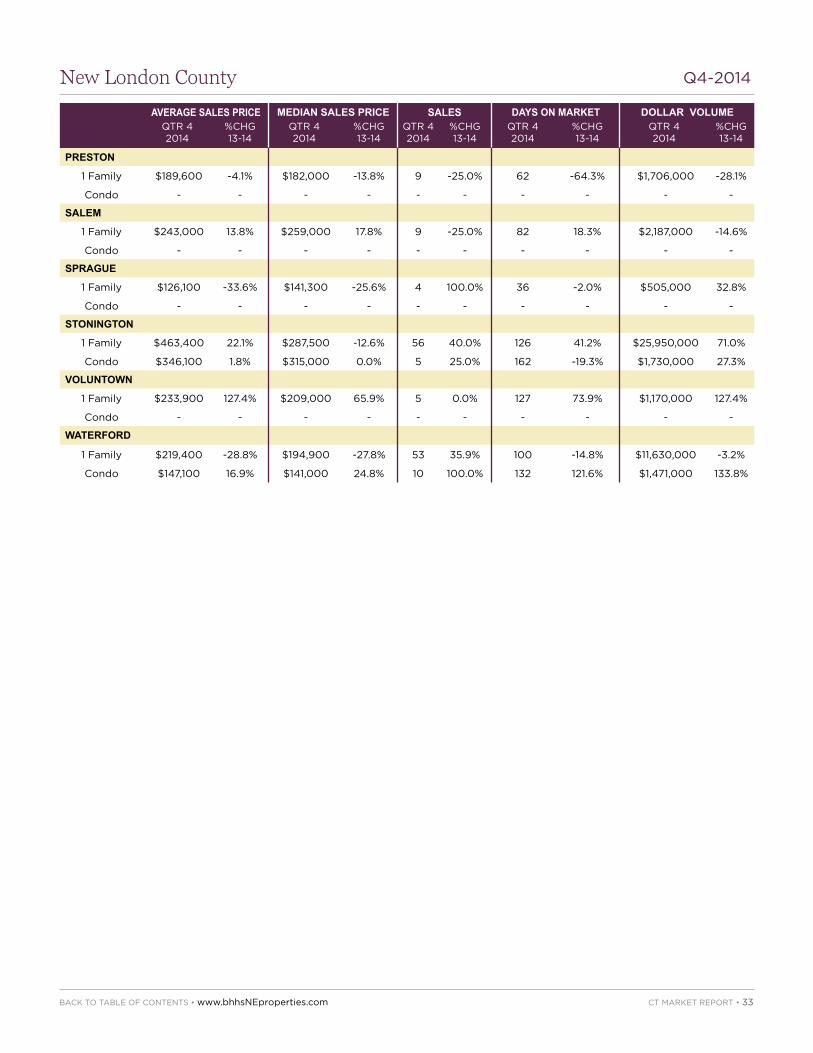
back to table of contents • www.bhhsNEproperties.com ct market report • 33
New London County
AVERAGE SALES PRICE MEDIAN SALES PRICE SALES DAyS oN MARkEt DoLLAR VoLuMEQTR 42014
%CHG13-14
QTR 42014
%CHG13-14
QTR 42014
%CHG13-14
QTR 42014
%CHG13-14
QTR 42014
%CHG13-14
PREStoN
1 Family $189,600 -4.1% $182,000 -13.8% 9 -25.0% 62 -64.3% $1,706,000 -28.1%
Condo - - - - - - - - - -
SALEM
1 Family $243,000 13.8% $259,000 17.8% 9 -25.0% 82 18.3% $2,187,000 -14.6%
Condo - - - - - - - - - -
SPRAGuE
1 Family $126,100 -33.6% $141,300 -25.6% 4 100.0% 36 -2.0% $505,000 32.8%
Condo - - - - - - - - - -
StoNINGtoN
1 Family $463,400 22.1% $287,500 -12.6% 56 40.0% 126 41.2% $25,950,000 71.0%
Condo $346,100 1.8% $315,000 0.0% 5 25.0% 162 -19.3% $1,730,000 27.3%
VoLuNtoWN
1 Family $233,900 127.4% $209,000 65.9% 5 0.0% 127 73.9% $1,170,000 127.4%
Condo - - - - - - - - - -
WAtERFoRD
1 Family $219,400 -28.8% $194,900 -27.8% 53 35.9% 100 -14.8% $11,630,000 -3.2%
Condo $147,100 16.9% $141,000 24.8% 10 100.0% 132 121.6% $1,471,000 133.8%

back to table of contents • www.bhhsNEproperties.com ct market report • 34
Tolland County
FAIRFIELD
NEW HAVEN
MIDDLESEX NEW LONDON
WINDHAM
TOLLANDHARTFORDLITCHFIELD
Ellington • www.40BrookCrossing.bhhsNEProperties.com

Q4-2014
back to table of contents • www.bhhsNEproperties.com ct market report • 35
Q4 2014
Single Family Condominium
Q4 2013
Single Family Condominium
0
50000
100000
150000
200000
250000
300000
Q3 2012 Q4 2012 Q1 2013 Q2 2013 Q3 2013 Q4 2013 Q1 2014 Q2 2014 Q3 2014
AVERAGE AND MEDIAN SALES PRICE
Average Single Family Average Condominium Median Single Family Median Condominium
0
50000
100000
150000
200000
250000
300000
Q3 2012 Q4 2012 Q1 2013 Q2 2013 Q3 2013 Q4 2013 Q1 2014 Q2 2014 Q3 2014
AVERAGE AND MEDIAN SALES PRICE
Average Single Family Average Condominium Median Single Family Median Condominium
0
50000
100000
150000
200000
250000
300000
Q3 2012 Q4 2012 Q1 2013 Q2 2013 Q3 2013 Q4 2013 Q1 2014 Q2 2014 Q3 2014
AVERAGE AND MEDIAN SALES PRICE
Average Single Family Average Condominium Median Single Family Median Condominium
Tolland County
Tolland County single family home sales increased this quarter by 5.7% while average sales price dropped 9.5% to $226,700. The average for condominiums was $179,500, up 16.9%. Days on market for condominiums dropped by 51.9% when compared to Fourth Quarter 2013 to 63 days. Average rental prices remained flat quarter over quarter at $1,350.
Number of Sales
Days on Market
Q4 2014 577 107
Q3 2014 662 95
Q2 2014 607 97
Q1 2014 417 104
Q4 2013 560 98
CondominiumsSingle Family
SINGlE FAMIly AND CoNDo RATIo
AvERAGE AND MEDIAN SAlES PRICE
Q4 2013 Q4 2014

Q4-2014
back to table of contents • www.bhhsNEproperties.com ct market report • 36
Tolland County
AVERAGE SALES PRICE MEDIAN SALES PRICE SALES DAyS oN MARkEt DoLLAR VoLuMEQTR 42014
%CHG13-14
QTR 42014
%CHG13-14
QTR 42014
%CHG13-14
QTR 42014
%CHG13-14
QTR 42014
%CHG13-14
ANDoVER
1 Family $185,200 -21.4% $211,400 -15.5% 8 33.3% 122 73.0% $1,482,000 4.9%
Condo - - - - - - - - - -
boLtoN
1 Family $275,500 4.1% $260,000 2.7% 12 -20.0% 112 6.9% $3,306,000 -16.7%
Condo - - - - - - - - - -
CoLuMbIA
1 Family $264,900 16.7% $240,000 -1.0% 16 100.0% 156 101.6% $4,239,000 133.4%
Condo - - - - - - - - - -
CoVENtRy
1 Family $201,900 -18.9% $194,000 -11.1% 37 -7.5% 89 -25.8% $7,469,000 -25.0%
Condo $194,000 28.9% $194,000 26.0% 1 -66.7% 34 -90.6% $194,000 -57.0%
ELLINGtoN
1 Family $294,800 -8.3% $277,800 5.7% 26 -18.7% 95 8.5% $7,665,000 -25.5%
Condo $249,600 45.0% $251,600 128.7% 8 60.0% 42 -67.8% $1,997,000 131.9%
HEbRoN
1 Family $301,100 8.3% $303,800 7.9% 12 33.3% 104 243.0% $3,613,000 44.3%
Condo $254,000 - $254,000 - 1 - 54 - $254,000 -
MANSFIELD
1 Family $224,400 -6.1% $175,000 -8.9% 30 30.4% 55 -22.0% $6,733,000 22.5%
Condo $178,500 5.7% $155,500 4.4% 4 -63.6% 40 -66.6% $714,000 -61.6%
SoMERS
1 Family $269,100 4.8% $236,900 -5.2% 15 -28.6% 110 41.5% $4,037,000 -25.1%
Condo $425,000 - $425,000 - 1 - 98 - $425,000 -
StAFFoRD
1 Family $308,000 - $308,000 - 1 - 185 - $308,000 -
Condo - - - - - - - - - -
toLLAND
1 Family $243,400 -12.0% $220,000 -10.2% 35 -5.4% 68 -14.1% $8,521,000 -16.7%
Condo $371,900 56.3% $371,900 16.2% 1 -66.7% - - $372,000 -47.9%
uNIoN
1 Family $190,000 30.9% $190,000 19.9% 1 -66.7% 31 -75.6% $190,000 -56.4%
Condo - - - - - - - - - -
VERNoN
1 Family $165,500 -12.3% $171,500 0.9% 61 41.9% 85 -11.2% $10,094,000 24.4%
Condo $130,200 -0.4% $125,000 5.7% 19 -13.6% 82 -15.9% $2,473,000 -14.0%
WILLINGtoN
1 Family $208,000 -2.2% $234,500 6.6% 4 -42.9% 35 -58.4% $832,000 -44.1%
Condo $32,000 -78.8% $32,000 -78.8% 1 -50.0% 20 -80.0% $32,000 -89.4%

back to table of contents • www.bhhsNEproperties.com ct market report • 37
Pomfret • www.10andersonRoad.bhhsNEproperties.com
Windham County
FAIRFIELD
NEW HAVEN
MIDDLESEX NEW LONDON
WINDHAM
TOLLANDHARTFORDLITCHFIELD

Q4-2014
back to table of contents • www.bhhsNEproperties.com ct market report • 38
Q4 2013
Single Family Condominium
0
20000
40000
60000
80000
100000
120000
140000
160000
180000
200000
Q3 2012 Q4 2012 Q1 2013 Q2 2013 Q3 2013 Q4 2013 Q1 2014 Q2 2014 Q3 2014
AVERAGE AND MEDIAN SALES PRICE
Average Single Family Average Condominium Median Single Family Median Condominium
0
50000
100000
150000
200000
250000
Q1 2013 Q2 2013 Q3 2013 Q4 2013 Q1 2014 Q2 2014 Q3 2014 Q4 2014
AVERAGE AND MEDIAN SALES PRICE
Average Single Family Average Condominium Median Single Family Median Condominium
Windham County
Windham County saw an increase in the number of single family home sales with lower prices this quarter. Total dollar volume in sales increased 0.5% year over year reaching $34,321,000. Average prices of single family homes was $170,800, down 4.5%, and the average for condominiums was $188,000, up 47.7%. Average rental prices remained flat year over year at $1,100 per month.
Number of Sales
Days on Market
Q3 2014 112 87
Q2 2014 110 98
Q1 2014 70 97
Q4 2013 92 107
Q3 2013 98 88
Number of Sales
Days on Market
Q4 2014 212 95
Q3 2014 262 87
Q2 2014 220 101
Q1 2014 149 108
Q4 2013 207 108
CondominiumsSingle Family
SINGlE FAMIly AND CoNDo RATIo
AvERAGE AND MEDIAN SAlES PRICE
Q4 2013 Q4 2014 Q4 2014
Single Family Condominium

Q4-2014
back to table of contents • www.bhhsNEproperties.com ct market report • 39
Windham County
AVERAGE SALES PRICE MEDIAN SALES PRICE SALES DAyS oN MARkEt DoLLAR VoLuMEQTR 42014
%CHG13-14
QTR 42014
%CHG13-14
QTR 42014
%CHG13-14
QTR 42014
%CHG13-14
QTR 42014
%CHG13-14
ASHFoRD
1 Family $143,600 6.0% $136,000 6.0% 14 133.3% 76 63.5% $2,010,000 147.4%
Condo - - - - - - - - - -
bRookLyN
1 Family $186,700 0.0% $173,500 -15.4% 29 -9.4% 119 23.9% $5,413,000 -9.4%
Condo $247,700 6.3% $257,500 10.5% 3 50.0% 28 -97.2% $743,000 59.5%
CANtERbuRy
1 Family $158,900 -4.0% $146,500 -23.5% 10 66.7% 133 29.8% $1,589,000 59.9%
Condo - - - - - - - - - -
CHAPLIN
1 Family $131,600 -15.4% $157,500 -2.5% 6 50.0% 82 7.2% $790,000 26.9%
Condo - - - - - - - - - -
EAStFoRD
1 Family $302,500 -1.5% $302,500 63.1% 2 -33.3% 62 -54.3% $605,000 -34.3%
Condo - - - - - - - - - -
HAMPtoN
1 Family $195,400 -17.7% $234,000 20.0% 5 66.7% 193 310.6% $977,000 37.2%
Condo - - - - - - - - - -
kILLINGLy
1 Family $139,100 -11.8% $137,000 -8.1% 45 -8.2% 80 -12.6% $6,259,000 -19.0%
Condo - - - - - - - - - -
PLAINFIELD
1 Family $129,100 -21.0% $139,000 -6.7% 21 10.5% 126 59.7% $2,710,000 -12.7%
Condo - - - - - - - - - -
PutNAM
1 Family $142,500 5.5% $142,500 -2.7% 17 -19.0% 108 1.4% $2,422,000 -14.6%
Condo $165,600 35.0% $186,500 65.0% 8 166.7% 54 -62.3% $1,325,000 259.9%
QuINEbAuG
1 Family $145,000 - $145,000 - 1 - 70 - $145,000 -
Condo - - - - - - - - - -
StERLING
1 Family $196,600 59.2% $197,500 31.7% 7 40.0% 103 129.6% $1,376,000 122.9%
Condo - - - - - - - - - -
tHoMPSoN
1 Family $209,900 13.4% $157,500 -10.0% 17 70.0% 90 -25.2% $3,568,000 92.9%
Condo - - - - - - - - - -
WINDHAM
1 Family $151,200 -15.2% $143,500 -9.5% 8 -20.0% 102 2.1% $1,209,000 -32.2%
Condo - - - - - - - - - -
WooDStoCk
1 Family $276,200 2.8% $270,000 -2.5% 19 -17.4% 51 -60.5% $5,247,000 -15.1%
Condo - - - - - - - - - -

Every house has a story to tell. A good agent knows every chapter by heart.
Berkshire Hathaway
HomeServices New England
Properties REAlToRS® live,
shop and work in your town.
When you’re ready to buy
or sell choose a local market
expert backed by the most
admired name in business.
Work with the best . . . bhhsNEproperties.com
New England PropertiesbhhsNEproperties.com
Fairfield • www.1410SouthPineCreekRd.bhhsNEproperties.com
Recommended