PRESENTATION OF THE REPUBLIC OF BELARUSOF BELARUS
February 2013
1

Belarus OverviewBelarus Overview
Geographical Position Key Indicators (2012)Area 207,595 km
2
Population 9.46 mnEstonia
Currency (as of 30.01.2013) BYR, 1 USD = 8,650 BYR
Credit ratings (M/S&P) B3 (Neg.) / B‐ (Stab.)
GDP, USD bn 63.0
GDP growth y‐o‐y 1.5%
GDP per capita, USD thsd 6.7Poland
Russia
Lithuania
Latvia
G
Sweden
Denmark
Belarus
Minsk
p p ,
Foreign trade turnover, USD bn*9M2012 70.9
Industrial production, % of GDP 31.8%
Inflation 21.8%
Budget Revenues, USD bn 25.8
Budget Expenditures, USD bn 25.7
Moldova
Germany
RomaniaHungary
SlovakiaCzech Rep.
Austria
It l
Switzerland
Ukraine
SloveniaCroatia g p ,
Budget Balance, % of GDP 0.7%
Public debt, % of GDP 23.8%
External public debt, % of GDP 19.0%
SerbiaBulgaria
Italy
Turkey
CroatiaBiH
MontenegroMacedonia
Key Historical Events
Creation of the Customs Union of Belarus,
Kazakhstan and Russia
Creation of a Common Economic Space of Belarus, Kazakhstan and Russia
Agreeing on a USD 3.5 bnIMF SBA program
Signing the Treaty on Establishing the Union State
of Belarus and RussiaIndependence
1991 20122010
Membership in the CIS, IMF and World Bank
2000
Creation of the EurAsEC(Belarus, Russia, Kazakhstan,
Kyrgyzstan Tajikistan)
2007
Acquiring credit ratings issued by S&P
and Moody’s
World Hockey championship
in Minsk
20091997 2014
Debut Eurobond USD 1.0 bn issue
2011
Agreeing on a USD 3.0 bnACF Stabilisation
Program
Source: National Statistical Committee of the Republic of Belarus, National Bank Note: average official USD exchange rates used: 2,792.54 Br for 1 USD in 2009, 2,978.10 Br for 1 USD in 2010, 4,623.47 Br for USD in 2011, 8,267.52 Br for 1 USD for 9M2012
World Bank Kyrgyzstan, Tajikistan) and Moody s in Minsk
1
Program
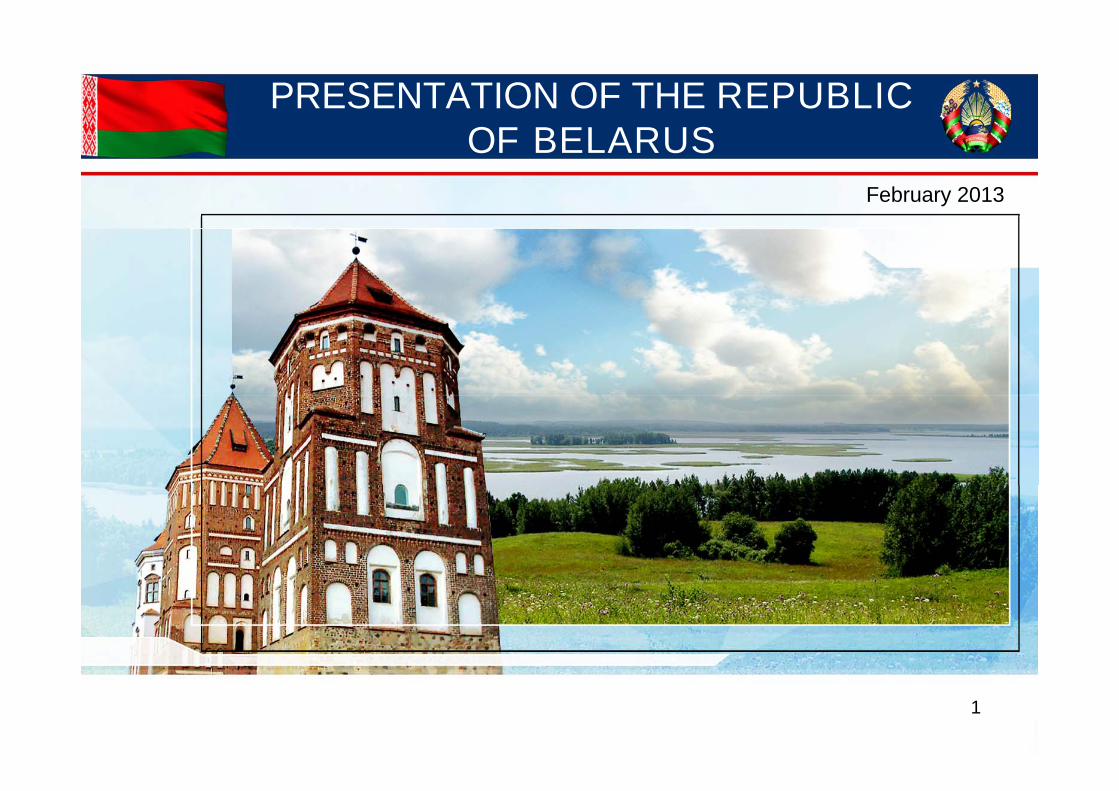
Investment HighlightsInvestment Highlights
Well‐diversified economy with focus on industrial productionfocus on industrial production
Improving businessImproving business environment and increasing competitiveness
One of the most qualified labor force in Eastern Europe
Active foreign trade playerEffective macroeconomicand budgetary policies
Ability to absorb external turbulence:y
Managed floating exchange rate mechanism
International reserves increase
2
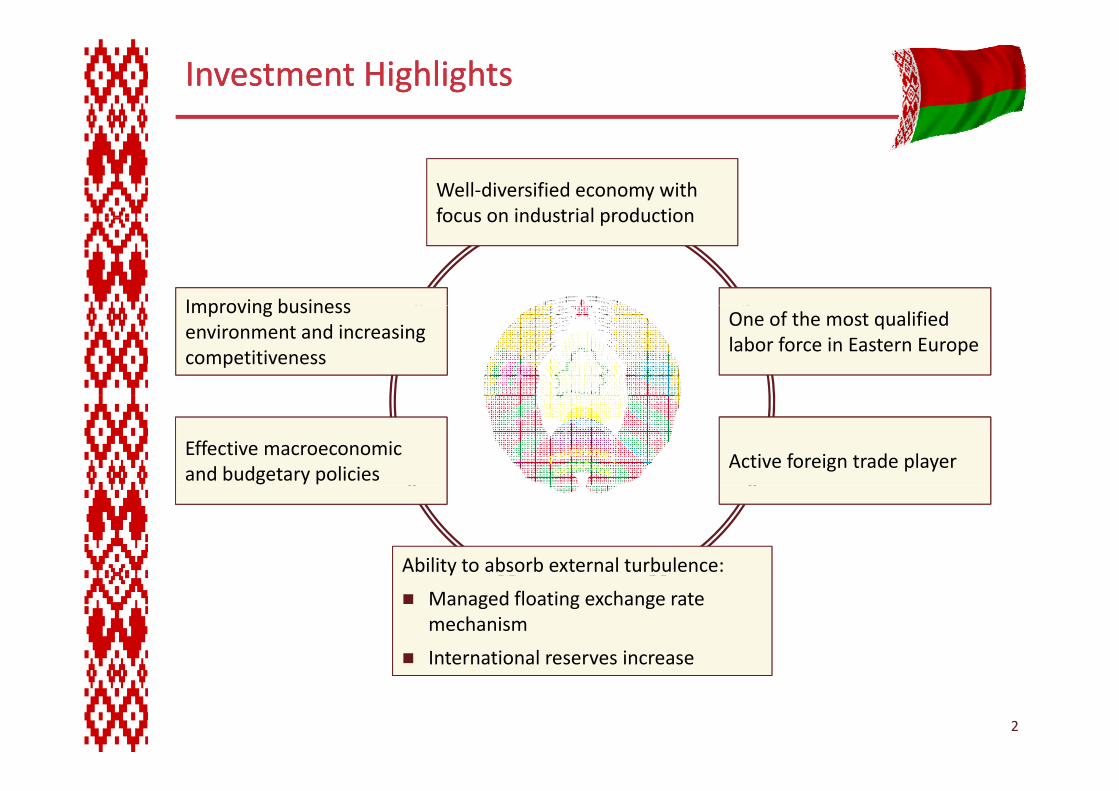
Credit Metrics ComparisonCredit Metrics Comparison
GDP per Capita, USD thsd
4 8
Public Debt, % of GDP
40,638 04,8
4,4
3,1
Median BB Belarus Median B
38,035,5
Median B Median BB Belarus
Budget Balance, % of GDP
0 5
Gross External Debt, % of current account inflows
93,30,5
‐3,1‐4,2
83,477,4
Median B Median BB BelarusBelarus Median BB Median B
ed a ed a e a us
Belarus’ fiscal metrics have appeared strong relative to its B‐rated peers. Its financial balance has, since 2002, consistently placed it in the top half among the 24 currently B‐rated countries…
Belarus’ fiscal metrics have appeared strong relative to its B‐rated peers. Its financial balance has, since 2002, consistently placed it in the top half among the 24 currently B‐rated countries…
Rating Upgrade Triggers
sustained improvement in competitiveness
Rating Upgrade Triggers
sustained improvement in competitiveness in the top half among the 24 currently B rated countries…Belarus’s economic strength…based on the country’s relatively high average annual real growth rate, a diversified industrial sector and high levels of per capita income, which are reflected in a workforce that is generally well‐educated and, thanks to low unemployment, maintains strong job‐related skills…
JULY 4 2012 M d ’ C dit A l i
in the top half among the 24 currently B rated countries…Belarus’s economic strength…based on the country’s relatively high average annual real growth rate, a diversified industrial sector and high levels of per capita income, which are reflected in a workforce that is generally well‐educated and, thanks to low unemployment, maintains strong job‐related skills…
JULY 4 2012 M d ’ C dit A l i
sustained improvement in competitiveness
diversification of funding sources
increased availability of foreign exchange
improvement in external balances
MAY 30, 2012, Standard and Poor’s
sustained improvement in competitiveness
diversification of funding sources
increased availability of foreign exchange
improvement in external balances
MAY 30, 2012, Standard and Poor’s
3
JULY 4, 2012, Moody’s, Credit AnalysisJULY 4, 2012, Moody’s, Credit Analysis
Source: Sovereign Risk Indicators (S&P, December 2012) based on 2012E
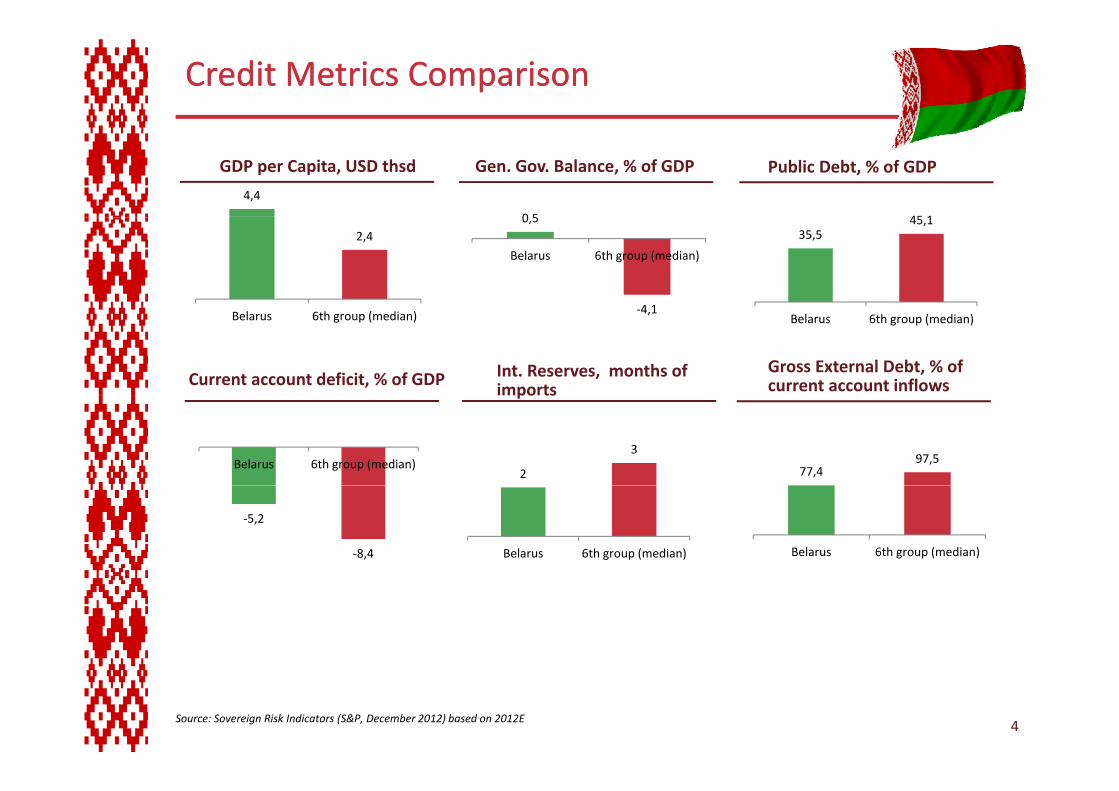
Credit Metrics ComparisonCredit Metrics Comparison
Gen. Gov. Balance, % of GDPGDP per Capita, USD thsd Public Debt, % of GDP
4,4
0 5 45 12,4
0,5
4 1
Belarus 6th group (median)
35,545,1
Gross External Debt, % of current account inflows
Belarus 6th group (median) ‐4,1Belarus 6th group (median)
Current account deficit, % of GDP Int. Reserves, months of imports
Belarus 6th group (median)
po ts
2
3
77,497,5
‐5,2
‐8,4 Belarus 6th group (median) Belarus 6th group (median)
4Source: Sovereign Risk Indicators (S&P, December 2012) based on 2012E
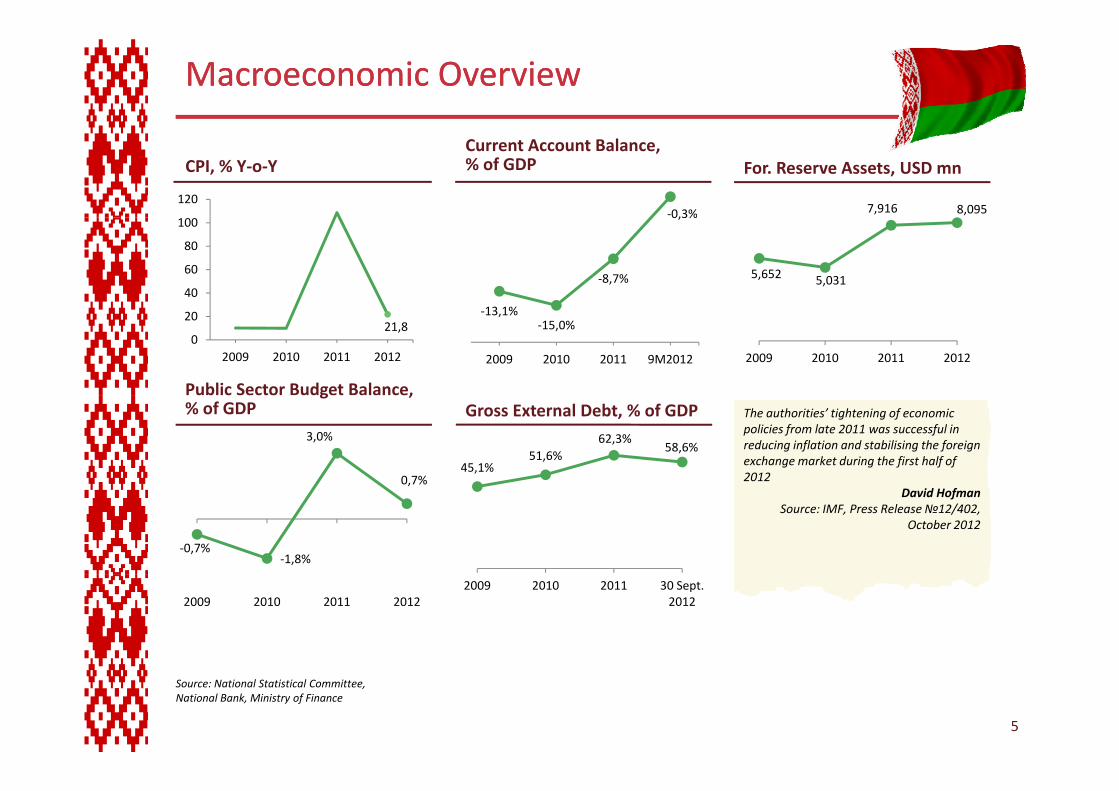
Macroeconomic OverviewMacroeconomic Overview
120
For. Reserve Assets, USD mn
‐0 3%
CPI, % Y‐o‐YCurrent Account Balance, % of GDP
7,916 8,095
40
60
80
100
‐8,7%
0,3%
5,652 5,031
21,80
20
2009 2010 2011 2012
‐13,1%‐15,0%
2009 2010 2011 9M2012 2009 2010 2011 2012
Public Sector Budget Balance, Gross External Debt, % of GDP
45,1%51,6%
62,3%58,6%
g ,% of GDP
3,0%
0,7%
The authorities’ tightening of economic policies from late 2011 was successful in reducing inflation and stabilising the foreign exchange market during the first half of 2012
The authorities’ tightening of economic policies from late 2011 was successful in reducing inflation and stabilising the foreign exchange market during the first half of 2012
‐0,7%‐1,8%
,David Hofman
Source: IMF, Press Release№12/402, October 2012
David HofmanSource: IMF, Press Release№12/402,
October 2012
2009 2010 2011 30 Sept. 20122009 2010 2011 2012
5
Source: National Statistical Committee, National Bank, Ministry of Finance
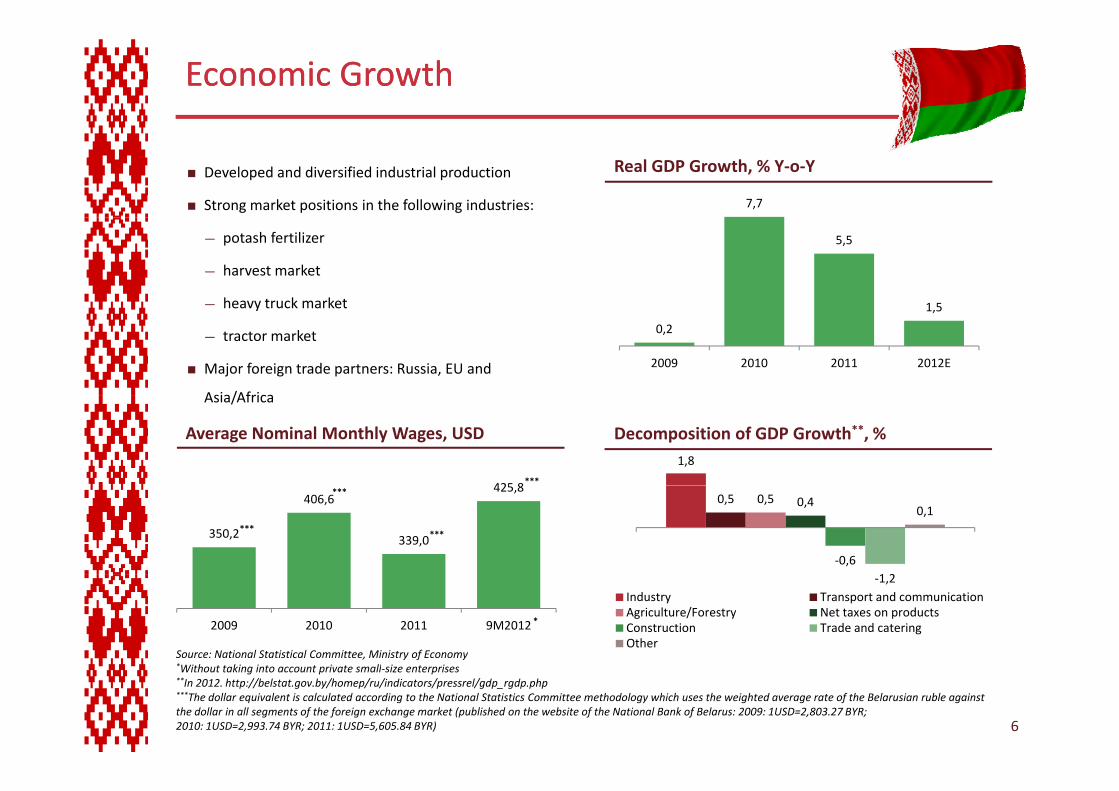
Economic GrowthEconomic Growth
7,7
Real GDP Growth, % Y‐o‐YDeveloped and diversified industrial production
Strong market positions in the following industries:
5,5
1 5
— potash fertilizer
— harvest market
— heavy truck market
0,2
1,5
2009 2010 2011 2012E
heavy truck market
— tractor market
Major foreign trade partners: Russia, EU and
Asia/Africa
Decomposition of GDP Growth**, %1,8
Asia/Africa
425 8
Average Nominal Monthly Wages, USD
***
0,5 0,5 0,4
‐0,61 2
0,1
350,2
406,6
339,0
425,8
***
***
***
‐1,2Industry Transport and communicationAgriculture/Forestry Net taxes on productsConstruction Trade and cateringOther
Source: National Statistical Committee, Ministry of Economy*Wi h ki i i ll i i
2009 2010 2011 9M2012 *
6
*Without taking into account private small‐size enterprises**In 2012. http://belstat.gov.by/homep/ru/indicators/pressrel/gdp_rgdp.php***The dollar equivalent is calculated according to the National Statistics Committee methodology which uses the weighted average rate of the Belarusian ruble against the dollar in all segments of the foreign exchange market (published on the website of the National Bank of Belarus: 2009: 1USD=2,803.27 BYR; 2010: 1USD=2,993.74 BYR; 2011: 1USD=5,605.84 BYR)
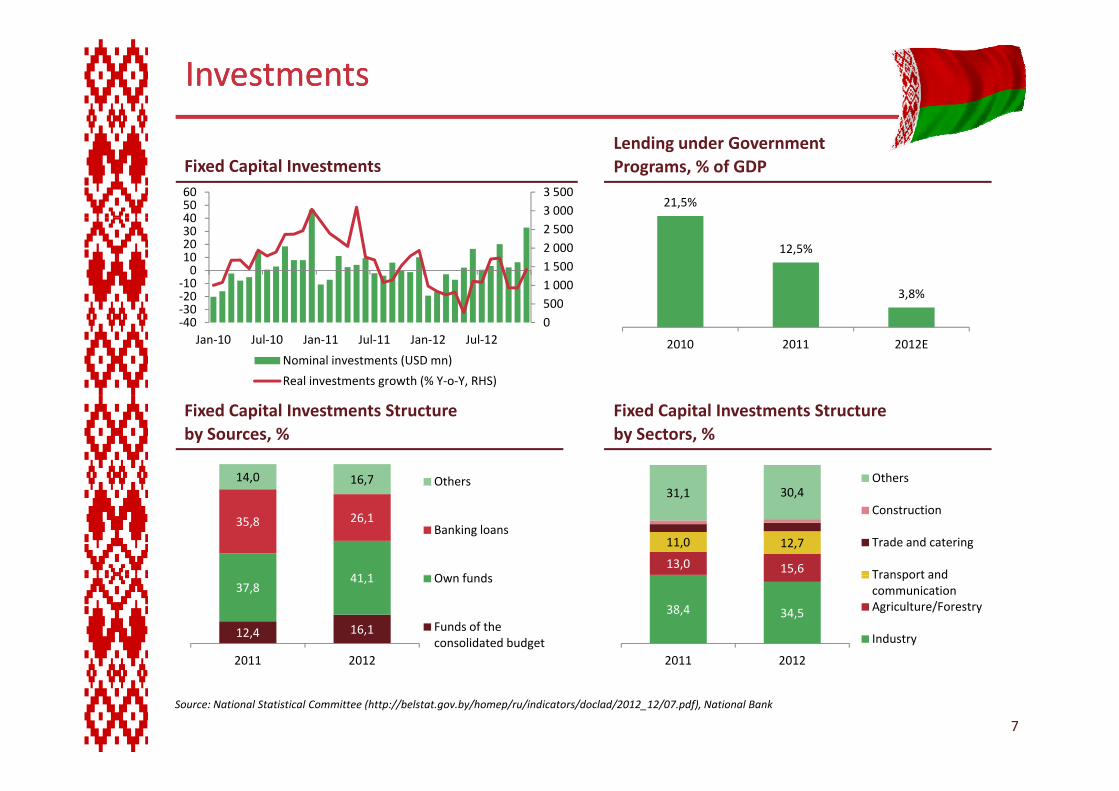
InvestmentsInvestments
3 0003 500
405060
Fixed Capital InvestmentsLending under Government Programs, % of GDP
21,5%
5001 0001 5002 0002 500
30‐20‐100
10203040
12,5%
3,8%
0500
‐40‐30
Jan‐10 Jul‐10 Jan‐11 Jul‐11 Jan‐12 Jul‐12
Nominal investments (USD mn)
Real investments growth (% Y‐o‐Y, RHS)
2010 2011 2012E
Fixed Capital Investments Structure by Sources, %
Fixed Capital Investments Structure by Sectors, %
14,0 16,7 Others Others
41 1
35,8 26,1
, Others
Banking loans
O f d13,0 15,6
11,0 12,7
31,1 30,4Construction
Trade and catering
Transport and
12,4 16,1
37,841,1
2011 2012
Own funds
Funds of the consolidated budget
38,4 34,5
2011 2012
Transport and communicationAgriculture/Forestry
Industry
7
Source: National Statistical Committee (http://belstat.gov.by/homep/ru/indicators/doclad/2012_12/07.pdf), National Bank

Foreign Foreign TradeTrade
4 0006 000
Current Account Balance, USD mn Export/Import FX Flows, USD mn
60 000
10 000‐8 000‐6 000‐4 000‐2 000
02 000
‐20 000
0
20 000
40 000
‐10 0002009 2010 2011 9M2011 9M2012
Secondary income Primary Income
Trade balance Current account balance
‐60 000
‐40 000
2009 2010 2011 9M2011 9M2012
Import payments Export inflows Net flows
Imported Energy Prices
265,5
250
300 Compliance with WTO principlesIntegrated oil, gas and telecom marketF t f it l d kf
CES Export Opportunities
147,8187,6
165,6
53,8100
150
200
250 Free movement of capital and workforceCoordination of macroeconomic and industrial policy, unification of exchange arrangementsTechnical regulationCommon principles of regulation in the field of protection and defense of intellectual property rights, etc.Catalyst for reforms, competitiveness development d i bl li i
45,0 40,4 56,10
50
2009 2010 2011 2012
Imported gas prices (USD/1000 cubic m)Imported oil prices (USD/barrel)
and sustainable policy mix
The Customs Union of Russia, Belarus and Kazakhstan is the first successful example in regional economic integration between countries of the former Soviet Union….Potentially the union can bring further benefits such as improved cross‐border infrastructure and strengthened institutions
S EBRD T iti R t 2012
The Customs Union of Russia, Belarus and Kazakhstan is the first successful example in regional economic integration between countries of the former Soviet Union….Potentially the union can bring further benefits such as improved cross‐border infrastructure and strengthened institutions
S EBRD T iti R t 2012*
8
Imported oil prices (USD/barrel)
Source: National Statistical Committee, National Bank, Ministry of Economy*Exchange rate used for convention: 7.28 barrels per ton
Source: EBRD, Transition Report 2012 «Integration Across Borders», November 2012
Source: EBRD, Transition Report 2012 «Integration Across Borders», November 2012
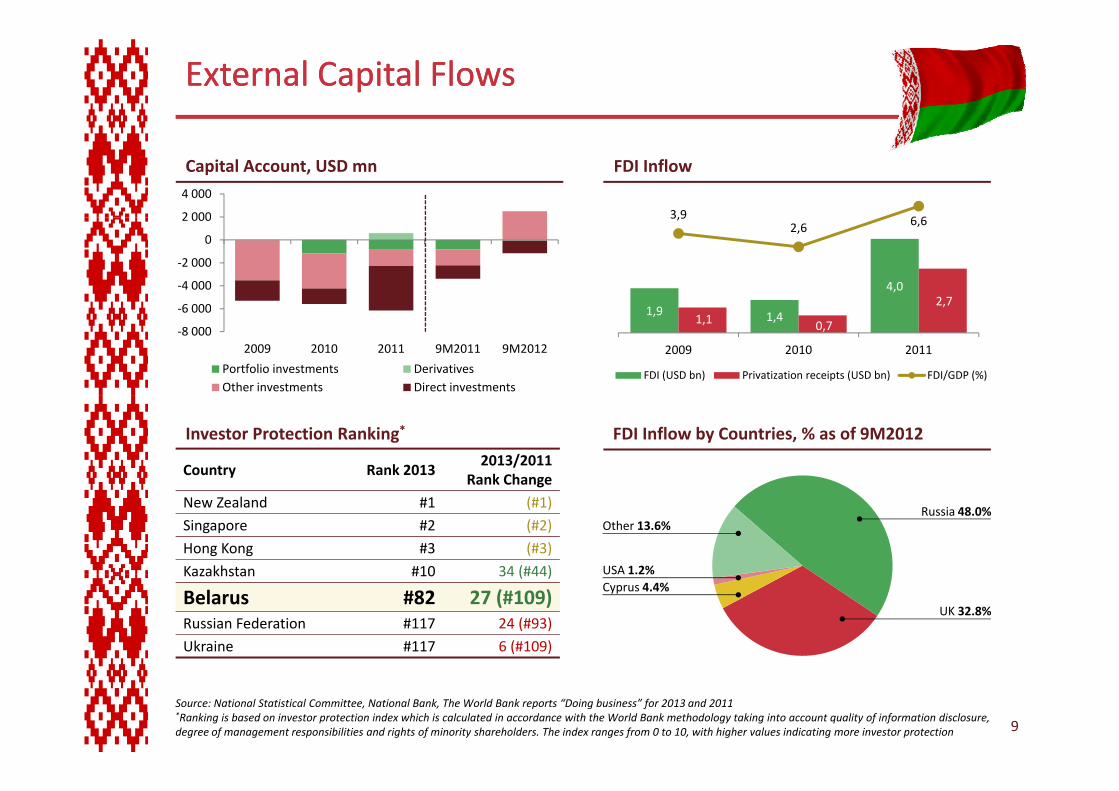
External Capital FlowsExternal Capital Flows
2 000
4 000
Capital Account, USD mn FDI Inflow
3 9
6 000
‐4 000
‐2 000
0
2 000
4,02,7
3,92,6 6,6
‐8 000
‐6 000
2009 2010 2011 9M2011 9M2012
Portfolio investments DerivativesOther investments Direct investments
1,9 1,41,1 0,7
,
2009 2010 2011
FDI (USD bn) Privatization receipts (USD bn) FDI/GDP (%)
FDI Inflow by Countries, % as of 9M2012 Investor Protection Ranking*
Country Rank 20132013/2011
Rank Changeg
New Zealand #1 (#1)
Singapore #2 (#2)
Hong Kong #3 (#3)
Kazakhstan #10 34 (#44)
Russia 48.0%
USA 1.2%
Other 13.6%
Kazakhstan #10 34 (#44)
Belarus #82 27 (#109)Russian Federation #117 24 (#93)
Ukraine #117 6 (#109)
Cyprus 4.4%
UK 32.8%
9
Source: National Statistical Committee, National Bank, The World Bank reports “Doing business” for 2013 and 2011 *Ranking is based on investor protection index which is calculated in accordance with the World Bank methodology taking into account quality of information disclosure, degree of management responsibilities and rights of minority shareholders. The index ranges from 0 to 10, with higher values indicating more investor protection
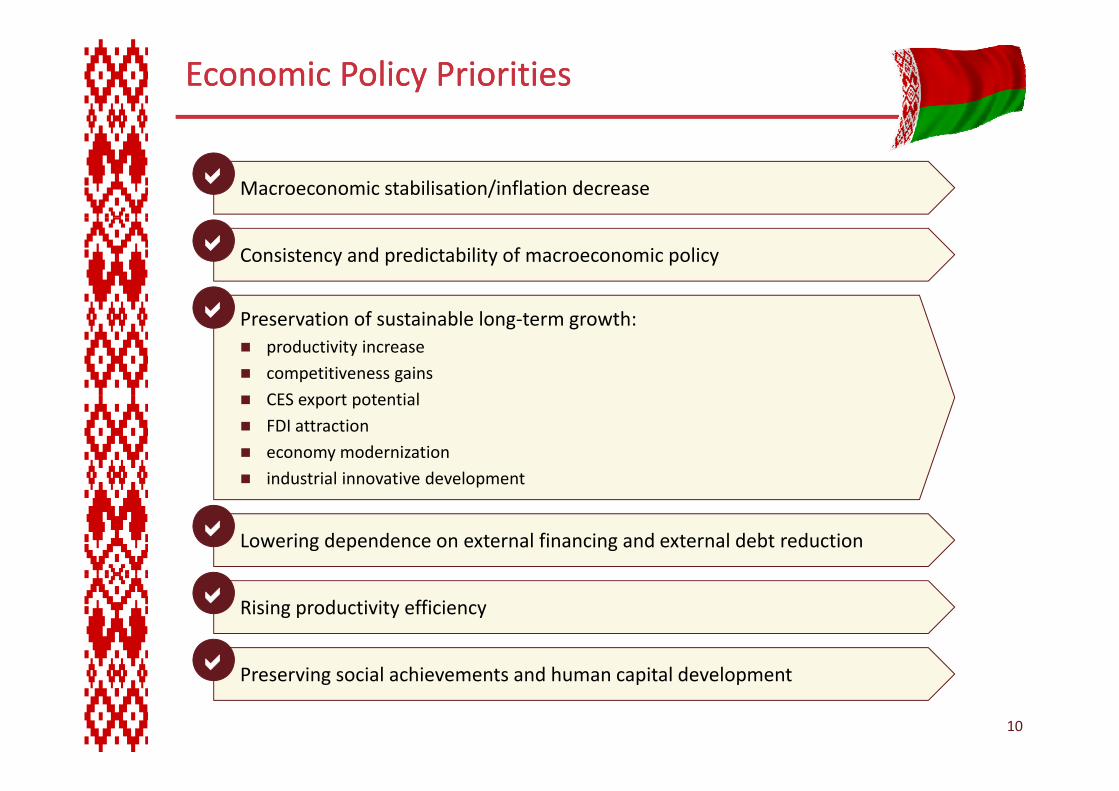
Economic Economic Policy PrioritiesPolicy Priorities
Macroeconomic stabilisation/inflation decrease
Consistency and predictability of macroeconomic policy
Preservation of sustainable long‐term growth:productivity increasecompetitiveness gains CES t t ti lCES export potential FDI attractioneconomy modernizationindustrial innovative developmentp
Lowering dependence on external financing and external debt reduction
Rising productivity efficiency
10
Preserving social achievements and human capital development
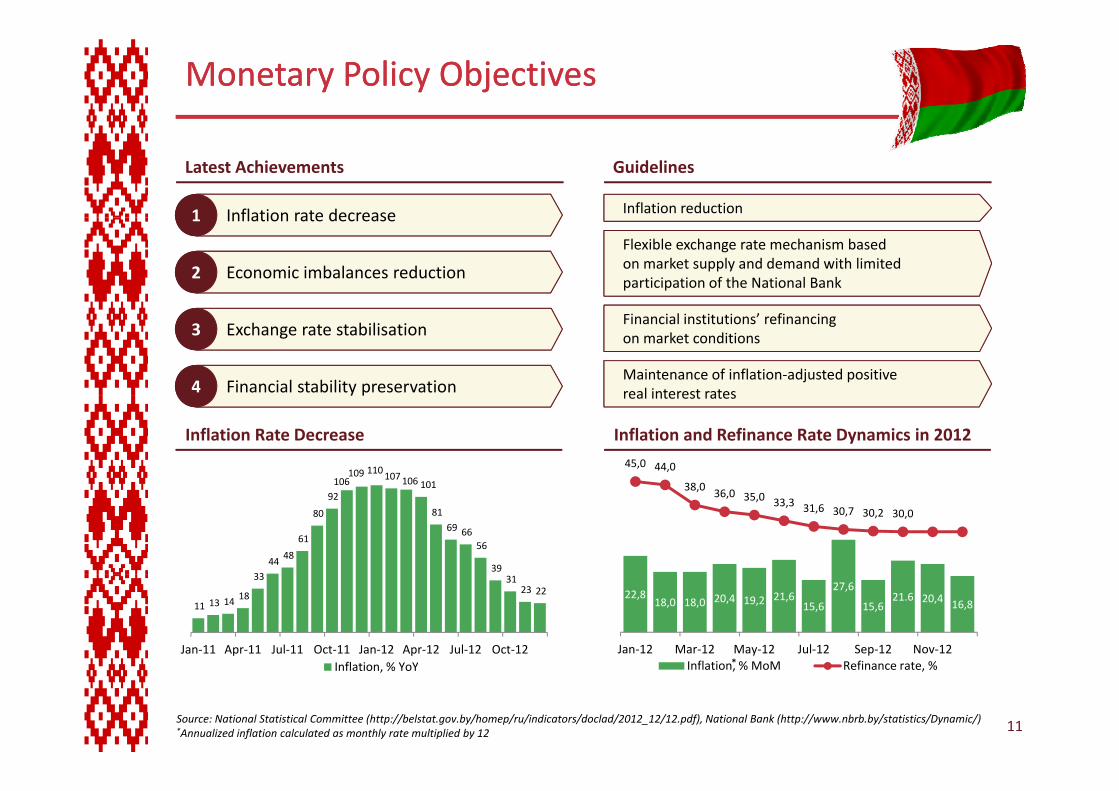
Monetary Monetary Policy ObjectivesPolicy Objectives
GuidelinesLatest Achievements
Inflation rate decrease1 Inflation rate decrease1 Inflation reduction
Flexible exchange rate mechanism based on market supply and demand with limited participation of the National Bank
Inflation rate decrease1 Inflation rate decrease1
Economic imbalances reduction2 Economic imbalances reduction2
Financial institutions’ refinancing on market conditions
Maintenance of inflation‐adjusted positive real interest rates
Exchange rate stabilisation3 Exchange rate stabilisation3
Financial stability preservation4 Financial stability preservation4
Inflation Rate Decrease
real interest ratesy py p
Inflation and Refinance Rate Dynamics in 2012
106109 110107106 101
45,0 44,0
38 0
3344
48
61
80
92101
8169 66
56
39
38,0 36,0 35,0 33,3 31,6 30,7 30,2 30,0
11 13 14 18
33 3123 22
Jan‐11 Apr‐11 Jul‐11 Oct‐11 Jan‐12 Apr‐12 Jul‐12 Oct‐12Inflation % YoY
22,818,0 18,0 20,4 19,2 21,6
15,6
27,6
15,621.6 20,4 16,8
Jan‐12 Mar‐12 May‐12 Jul‐12 Sep‐12 Nov‐12Inflation % MoM Refinance rate %*
Source: National Statistical Committee (http://belstat.gov.by/homep/ru/indicators/doclad/2012_12/12.pdf), National Bank (http://www.nbrb.by/statistics/Dynamic/)*Annualized inflation calculated as monthly rate multiplied by 12 11
Inflation, % YoY Inflation, % MoM Refinance rate, %
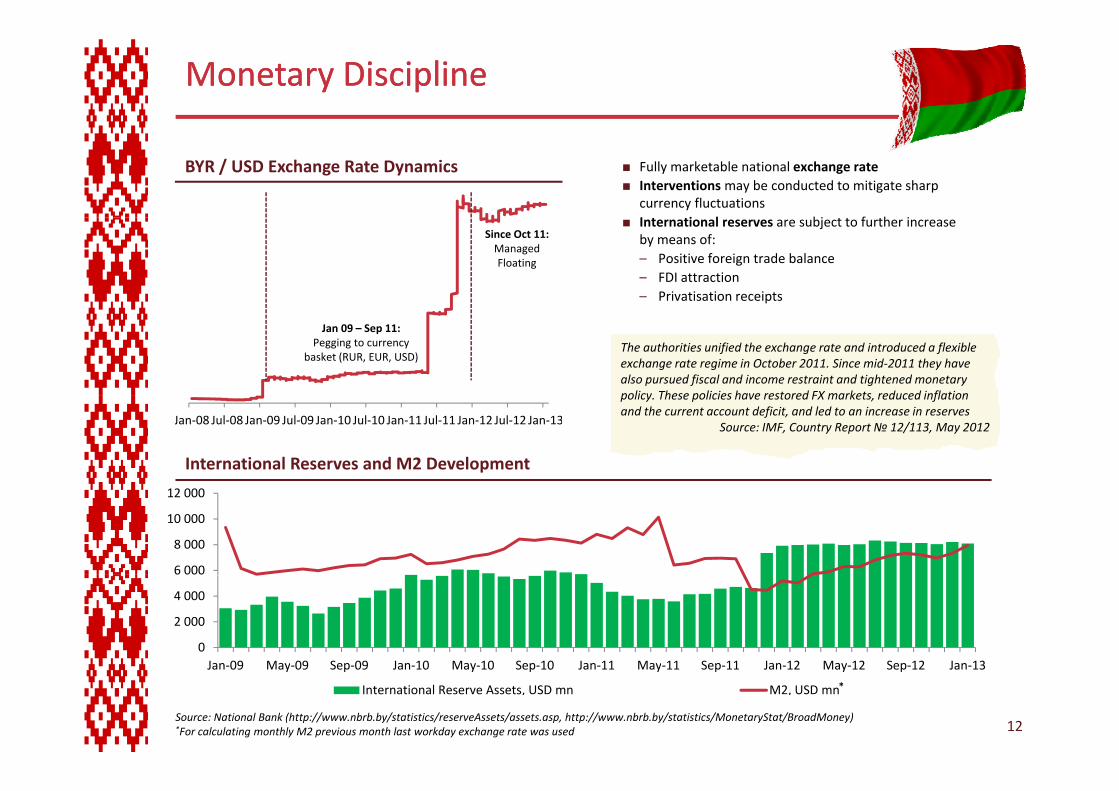
Monetary DisciplineMonetary Discipline
BYR / USD Exchange Rate Dynamics Fully marketable national exchange rate Interventionsmay be conducted to mitigate sharp currency fluctuations
Since Oct 11: ManagedFloating
International reserves are subject to further increase by means of:– Positive foreign trade balance– FDI attraction– Privatisation receipts
Jan 09 – Sep 11:Pegging to currency
basket (RUR, EUR, USD)The authorities unified the exchange rate and introduced a flexible exchange rate regime in October 2011. Since mid‐2011 they have also pursued fiscal and income restraint and tightened monetary policy These policies have restored FX markets reduced inflation
The authorities unified the exchange rate and introduced a flexible exchange rate regime in October 2011. Since mid‐2011 they have also pursued fiscal and income restraint and tightened monetary policy These policies have restored FX markets reduced inflation
Jan‐08 Jul‐08 Jan‐09 Jul‐09 Jan‐10 Jul‐10 Jan‐11 Jul‐11 Jan‐12 Jul‐12 Jan‐13
International Reserves and M2 Development
policy. These policies have restored FX markets, reduced inflation and the current account deficit, and led to an increase in reserves
Source: IMF, Country Report № 12/113, May 2012
policy. These policies have restored FX markets, reduced inflation and the current account deficit, and led to an increase in reserves
Source: IMF, Country Report № 12/113, May 2012
6 000
8 000
10 000
12 000
0
2 000
4 000
Jan 09 May 09 Sep 09 Jan 10 May 10 Sep 10 Jan 11 May 11 Sep 11 Jan 12 May 12 Sep 12 Jan 13
Source: National Bank (http://www.nbrb.by/statistics/reserveAssets/assets.asp, http://www.nbrb.by/statistics/MonetaryStat/BroadMoney) *For calculating monthly M2 previous month last workday exchange rate was used 12
Jan‐09 May‐09 Sep‐09 Jan‐10 May‐10 Sep‐10 Jan‐11 May‐11 Sep‐11 Jan‐12 May‐12 Sep‐12 Jan‐13
International Reserve Assets, USD mn M2, USD mn*
Banking SectorBanking Sector
Deposits by customer type*
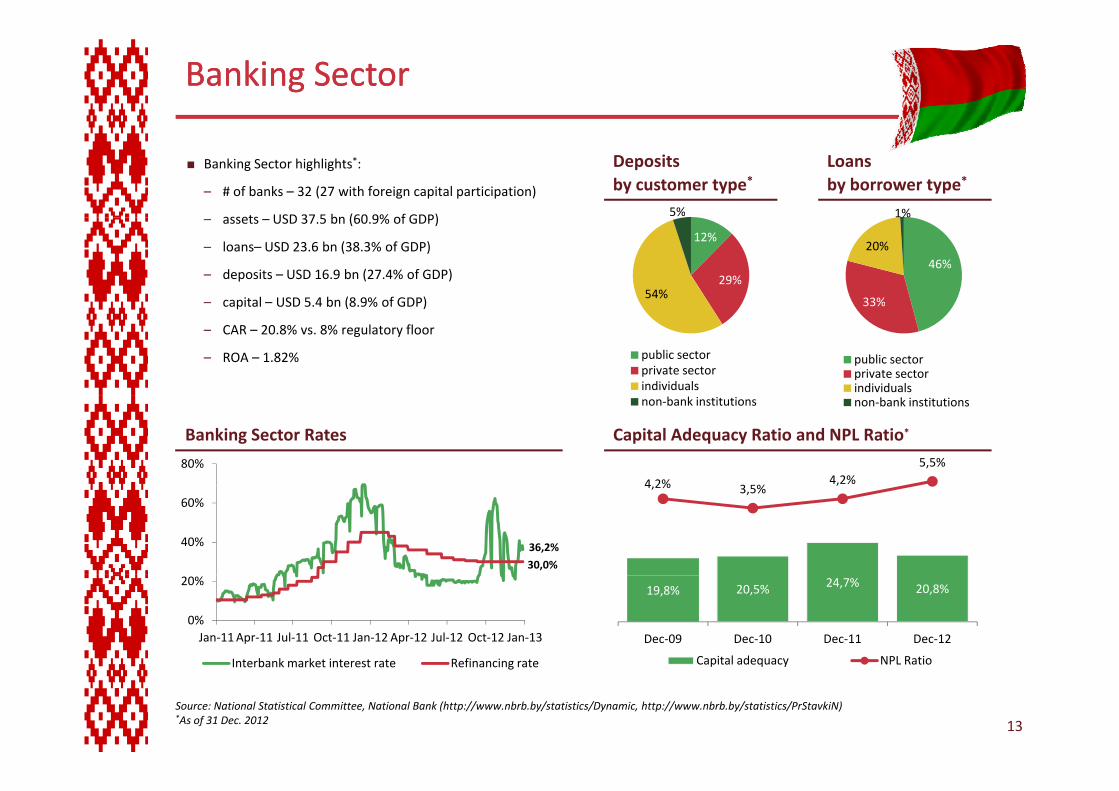
Banking Sector highlights*:
– # of banks – 32 (27 with foreign capital participation)
t USD 37 5 b (60 9% f GDP)
Loansby borrower type*
5% 1%– assets – USD 37.5 bn (60.9% of GDP)
– loans– USD 23.6 bn (38.3% of GDP)
– deposits – USD 16.9 bn (27.4% of GDP)
– capital – USD 5.4 bn (8.9% of GDP)
12%
29%54%
%
46%
33%
20%
1%
capital USD 5.4 bn (8.9% of GDP)
– CAR – 20.8% vs. 8% regulatory floor
– ROA – 1.82% public sectorprivate sectorindividuals
33%
public sectorprivate sectorindividuals
Capital Adequacy Ratio and NPL Ratio*
4 2% 3 5%4,2%
5,5%
Banking Sector Rates
80%
non‐bank institutions non‐bank institutions
4,2% 3,5%,
36,2%
30,0%
40%
60%
19,8% 20,5% 24,7% 20,8%
Dec‐09 Dec‐10 Dec‐11 Dec‐12
Capital adequacy NPL Ratio
0%
20%
Jan‐11Apr‐11 Jul‐11 Oct‐11 Jan‐12 Apr‐12 Jul‐12 Oct‐12 Jan‐13
Interbank market interest rate Refinancing rate p q y
Source: National Statistical Committee, National Bank (http://www.nbrb.by/statistics/Dynamic, http://www.nbrb.by/statistics/PrStavkiN)*As of 31 Dec. 2012
Interbank market interest rate Refinancing rate
13
Public Sector BudgetPublic Sector Budget
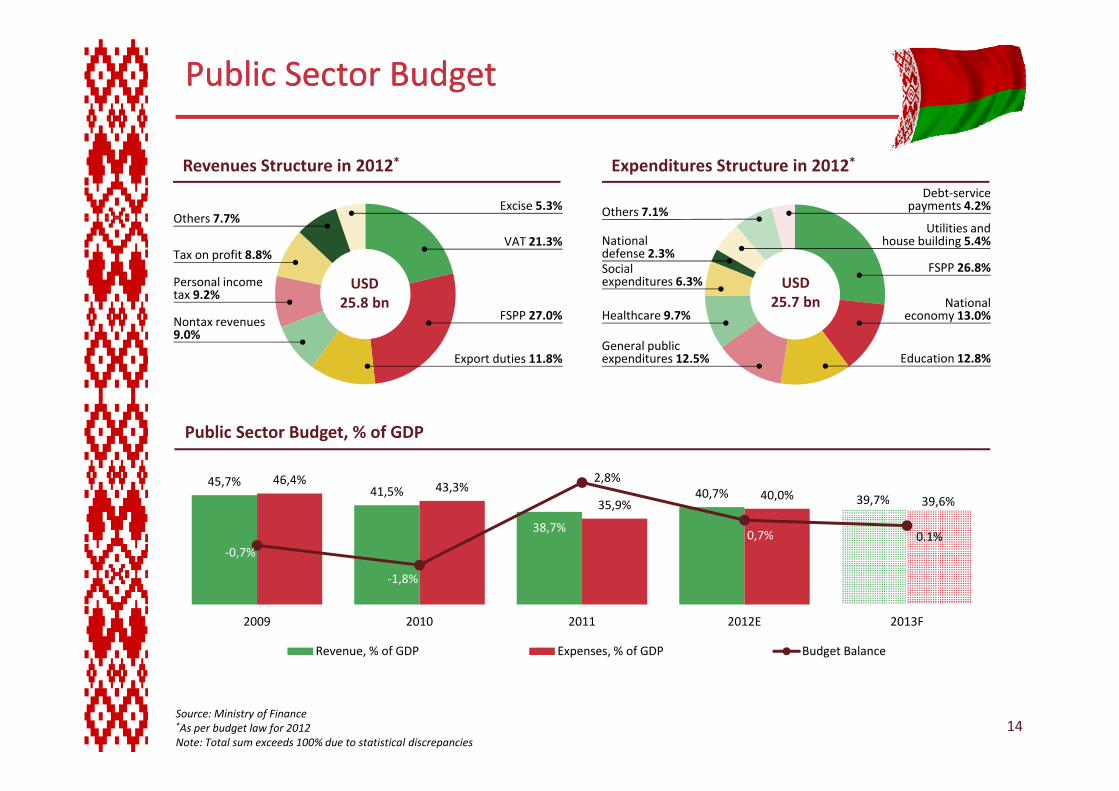
Revenues Structure in 2012* Expenditures Structure in 2012*
Excise 5.3%Oth 7 7%
Debt‐service payments 4.2%Others 7.1%
USD25.7 bn
Others 7.7%
VAT 21.3%Tax on profit 8.8%
Personal income tax 9.2%
Ot e s . %
FSPP 26.8%
National defense 2.3%
Utilities and house building 5.4%
Social expenditures 6.3%
NationalUSD
25.8 bn 25.7 bnNontax revenues 9.0%
FSPP 27.0%
Export duties 11.8%
Healthcare 9.7%
General public expenditures 12.5%
National economy 13.0%
Education 12.8%
25.8 bn
Public Sector Budget, % of GDP
45,7% 46,4% 43 3%2,8%45,7%
41,5%
38,7%
40,7% 39,7%
, 43,3%35,9%
40,0% 39,6%
‐0,7%
1 8%
0,7% 0.1%
‐1,8%
2009 2010 2011 2012E 2013F
Revenue, % of GDP Expenses, % of GDP Budget Balance
Source: Ministry of Finance*As per budget law for 2012Note: Total sum exceeds 100% due to statistical discrepancies
14
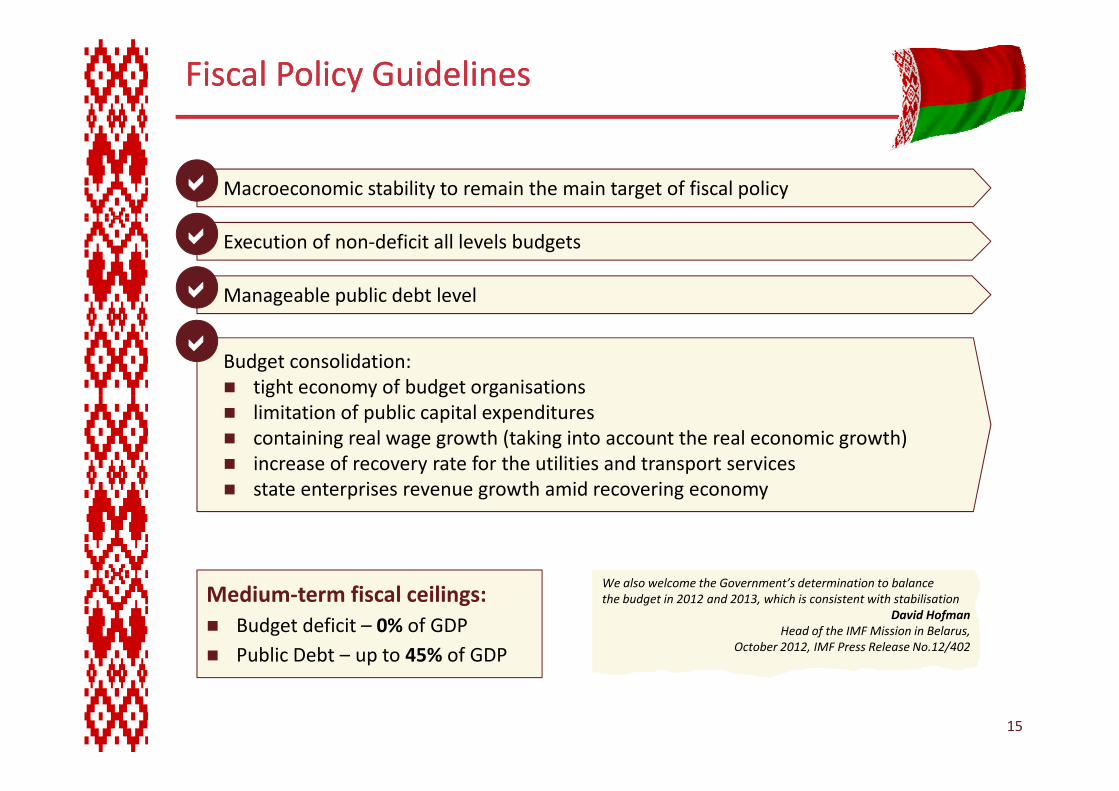
Fiscal Fiscal Policy Policy GuidelinesGuidelines
Macroeconomic stability to remain the main target of fiscal policy
Execution of non‐deficit all levels budgets
Manageable public debt level
Budget consolidation:tight economy of budget organisationsg y g glimitation of public capital expenditurescontaining real wage growth (taking into account the real economic growth)increase of recovery rate for the utilities and transport servicest t t i th id istate enterprises revenue growth amid recovering economy
Medium‐term fiscal ceilings:Budget deficit – 0% of GDPPublic Debt – up to 45% of GDP
We also welcome the Government’s determination to balance the budget in 2012 and 2013, which is consistent with stabilisation
David Hofman Head of the IMF Mission in Belarus,
October 2012, IMF Press Release No.12/402
We also welcome the Government’s determination to balance the budget in 2012 and 2013, which is consistent with stabilisation
David Hofman Head of the IMF Mission in Belarus,
October 2012, IMF Press Release No.12/402p
15
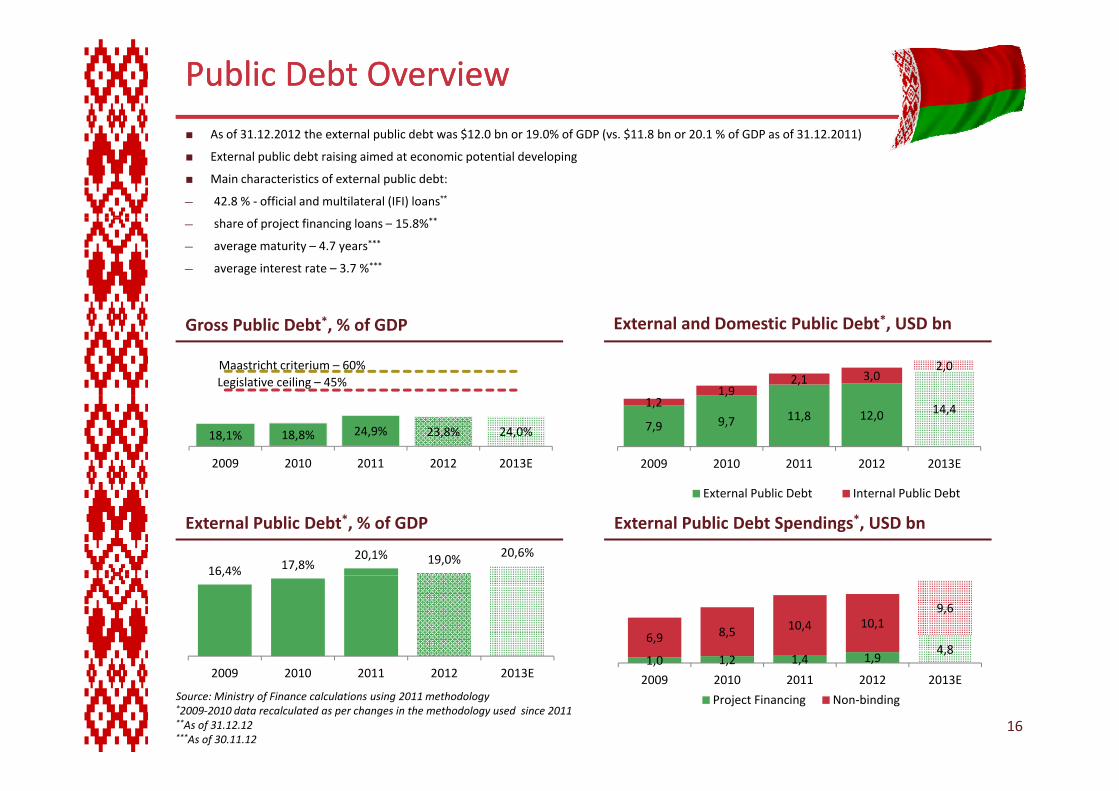
Public Public DebtDebt OverviewOverviewAs of 31.12.2012 the external public debt was $12.0 bn or 19.0% of GDP (vs. $11.8 bn or 20.1 % of GDP as of 31.12.2011)
External public debt raising aimed at economic potential developing
Main characteristics of external public debt:
— 42.8 % ‐ official and multilateral (IFI) loans**
— share of project financing loans – 15.8%**
— average maturity – 4.7 years***
— average interest rate – 3.7 %***
Gross Public Debt*, % of GDP
Legislative ceiling – 45%Maastricht criterium – 60%
External and Domestic Public Debt*, USD bn
1,92,1 3,0
2,0
18,1% 18,8% 24,9% 23,8% 24,0%
2009 2010 2011 2012 2013E
7,9 9,7 11,8 12,0 14,41,2,
2009 2010 2011 2012 2013E
External Public Debt*, % of GDP
External Public Debt Internal Public Debt
External Public Debt Spendings*, USD bn
16,4% 17,8%20,1% 19,0% 20,6%
, %
1,0 1,2 1,4 1,94,8
6,9 8,5 10,4 10,19,6
2009 2010 2011 2012 2013E
Source: Ministry of Finance calculations using 2011 methodology *2009‐2010 data recalculated as per changes in the methodology used since 2011**As of 31.12.12***As of 30.11.12
, , ,
2009 2010 2011 2012 2013E
Project Financing Non‐binding
16
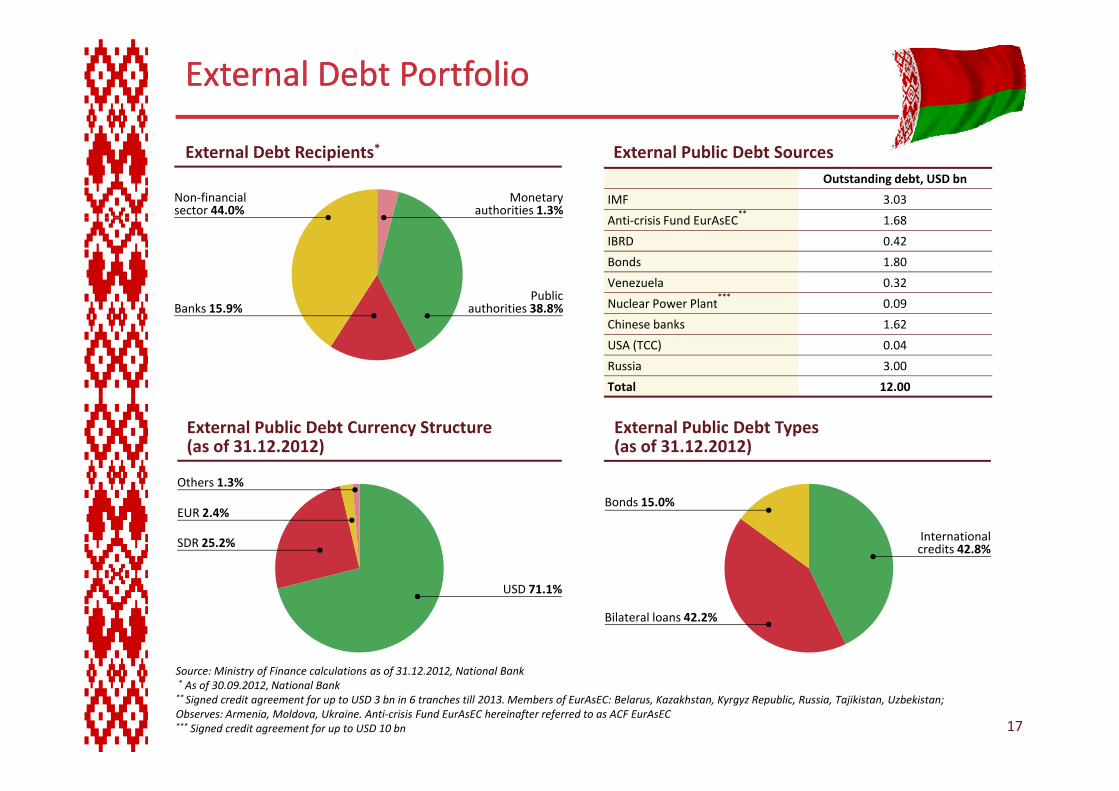
External Debt External Debt PortfolioPortfolio
Outstanding debt, USD bn
IMF 3.03
A i i i d A C**
1 68
External Public Debt SourcesExternal Debt Recipients*
Monetary authorities 1.3%
Non‐financial sector 44.0%
Anti‐crisis Fund EurAsEC 1.68
IBRD 0.42
Bonds 1.80
Venezuela 0.32
Nuclear Power Plant***
0 09Public
th iti 38 8%B k 15 9% Nuclear Power Plant 0.09
Chinese banks 1.62
USA (TCC) 0.04
Russia 3.00
Total 12.00
authorities 38.8%Banks 15.9%
External Public Debt Currency Structure (as of 31.12.2012)
External Public Debt Types (as of 31.12.2012)
Others 1.3%Others 1.3%
SDR 25.2%
EUR 2.4%
International credits 42.8%
Bonds 15.0%
USD 71.1%
Bilateral loans 42.2%
Source: Ministry of Finance calculations as of 31.12.2012, National Bank* As of 30.09.2012, National Bank** Signed credit agreement for up to USD 3 bn in 6 tranches till 2013. Members of EurAsEC: Belarus, Kazakhstan, Kyrgyz Republic, Russia, Tajikistan, Uzbekistan; Observes: Armenia, Moldova, Ukraine. Anti‐crisis Fund EurAsEC hereinafter referred to as ACF EurAsEC*** Signed credit agreement for up to USD 10 bn 17
Recommended