Basis of the BOLD signal
Ciara O’Mahony and Miriam Klein

Section 1: Basics of MRI PhysicsSection 2: What does BOLD reflect?
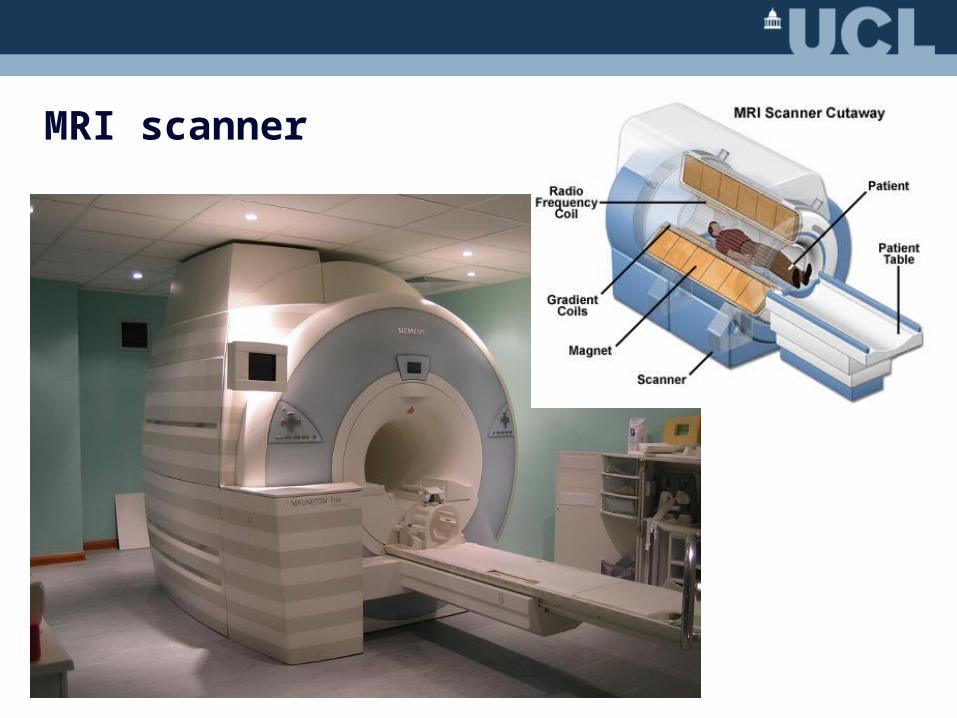
MRI scanner
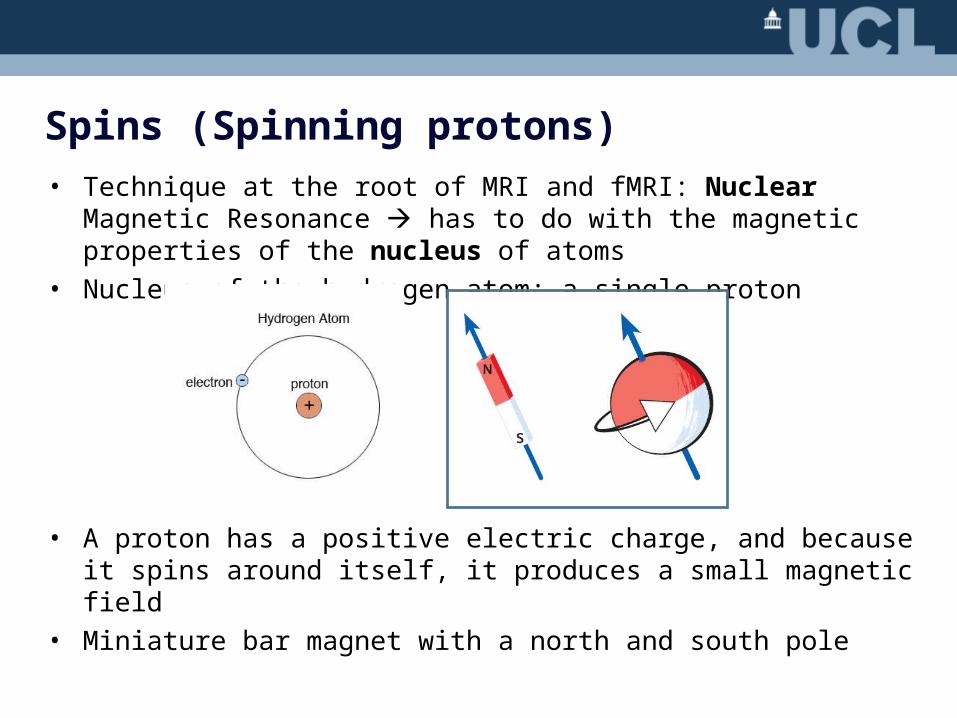
• A proton has a positive electric charge, and because it spins around itself, it produces a small magnetic field
• Miniature bar magnet with a north and south pole
Spins (Spinning protons)• Technique at the root of MRI and fMRI: Nuclear Magnetic Resonance
has to do with the magnetic properties of the nucleus of atoms• Nucleus of the hydrogen atom: a single proton
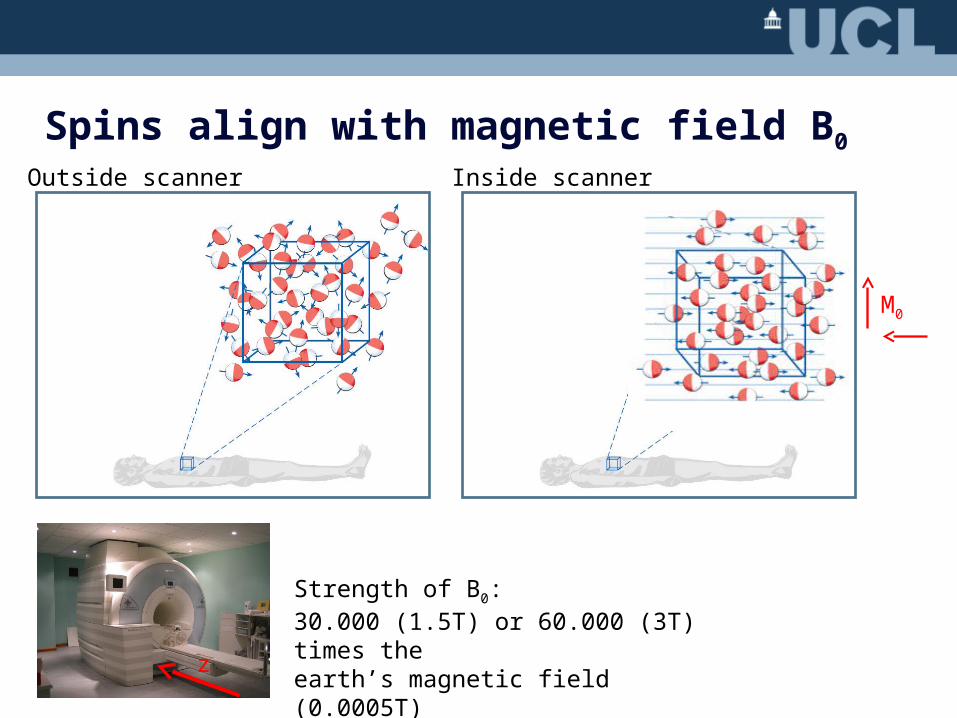
Spins align with magnetic field B0
Outside scanner Inside scanner
Strength of B0: 30.000 (1.5T) or 60.000 (3T) times theearth’s magnetic field (0.0005T)
z
M0
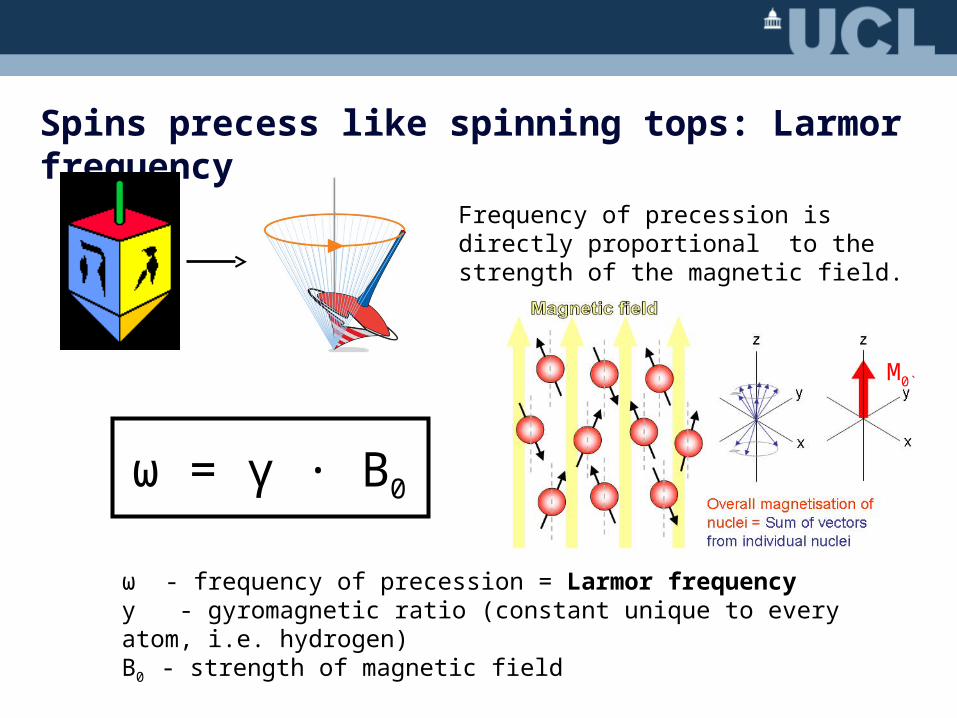
Spins precess like spinning tops: Larmor frequency
Frequency of precession is directly proportional to the strength of the magnetic field.
ω = γ · B0
ω - frequency of precession = Larmor frequencyy - gyromagnetic ratio (constant unique to every atom, i.e. hydrogen)B0 - strength of magnetic field
M0`
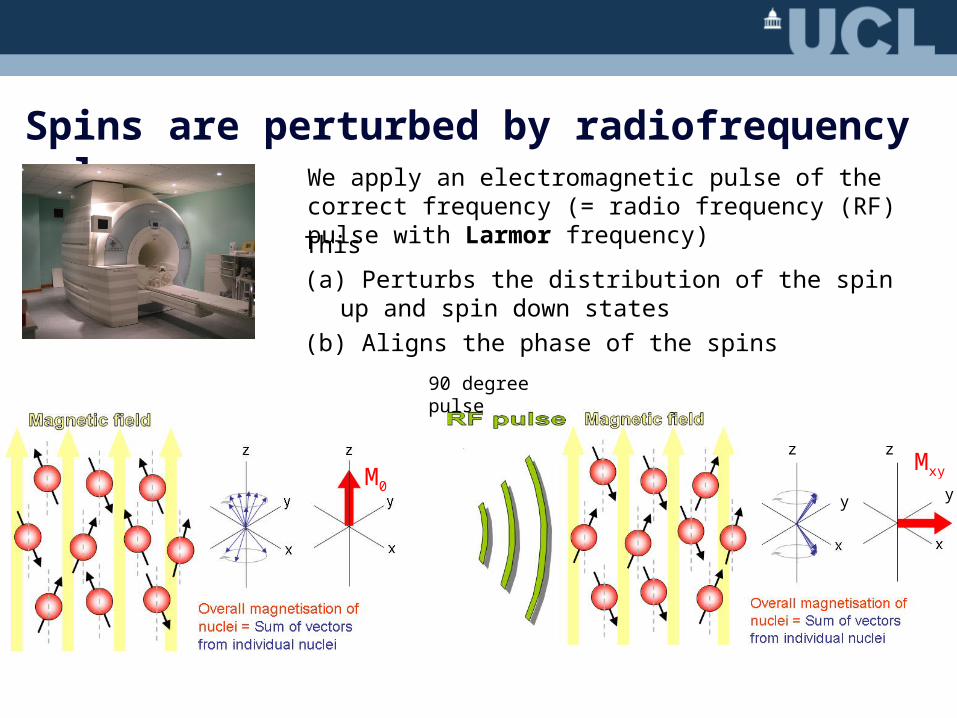
Spins are perturbed by radiofrequency pulseWe apply an electromagnetic pulse of the correct frequency (= radio frequency (RF) pulse with Larmor frequency)
90 degree pulse
M0
Mxy
z z
y y
This
(a) Perturbs the distribution of the spin up and spin down states
(b) Aligns the phase of the spins
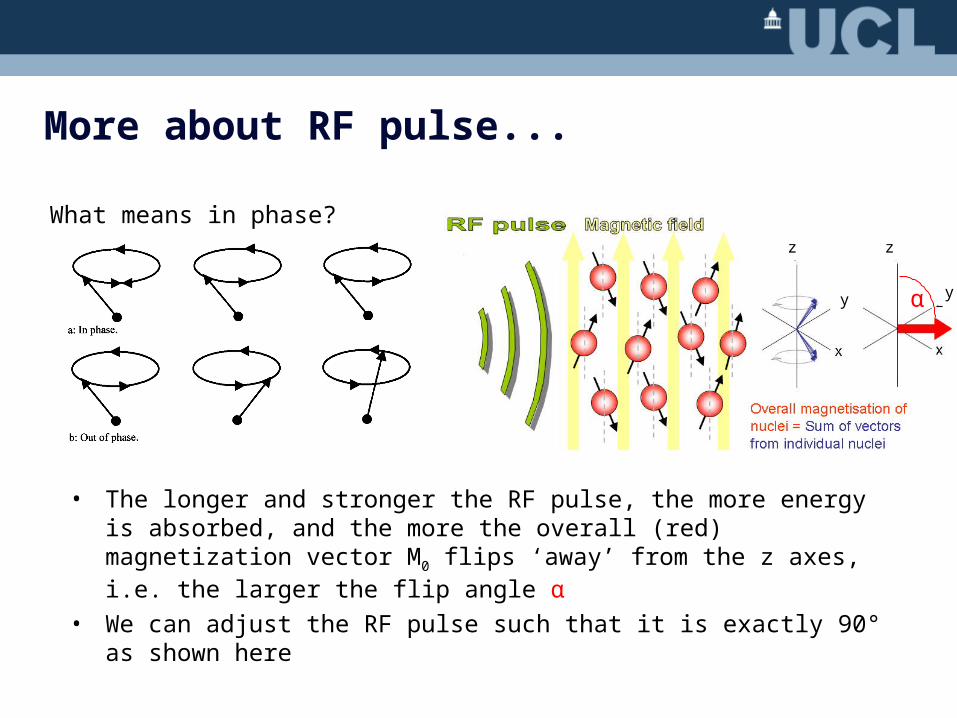
• The longer and stronger the RF pulse, the more energy is absorbed, and the more the overall (red) magnetization vector M0 flips ‘away’ from the z axes, i.e. the larger the flip angle α
• We can adjust the RF pulse such that it is exactly 90° as shown here
More about RF pulse...
α
What means in phase?z z
y y
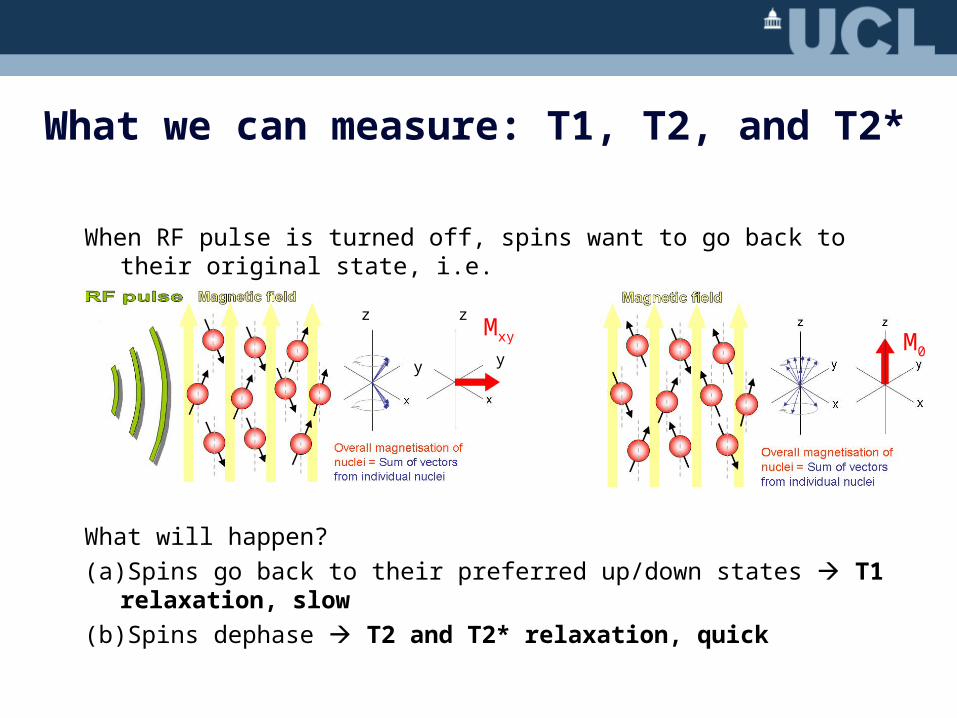
What we can measure: T1, T2, and T2*
When RF pulse is turned off, spins want to go back to their original state, i.e.
from to
What will happen?
(a) Spins go back to their preferred up/down states T1 relaxation, slow
(b) Spins dephase T2 and T2* relaxation, quick
Mxy M0
z z
y y

T1: Spins go back to up/down states
• T1 relaxation called longitudinal relaxation: along z-axis
• Absorbed energy partly given to tissue in the form of heat and partly retransmitted to RF receivers
• Time course of returning to equilibrium is described by exponential function signal gets stronger in z-direction
M0
z z
y y

T1 imageT1 is unique to every tissue: Time constant T1 is defined as the point where 63% of the magnetization M has recovered alignment with B0
Slow recovery in CSF and quick in white matter
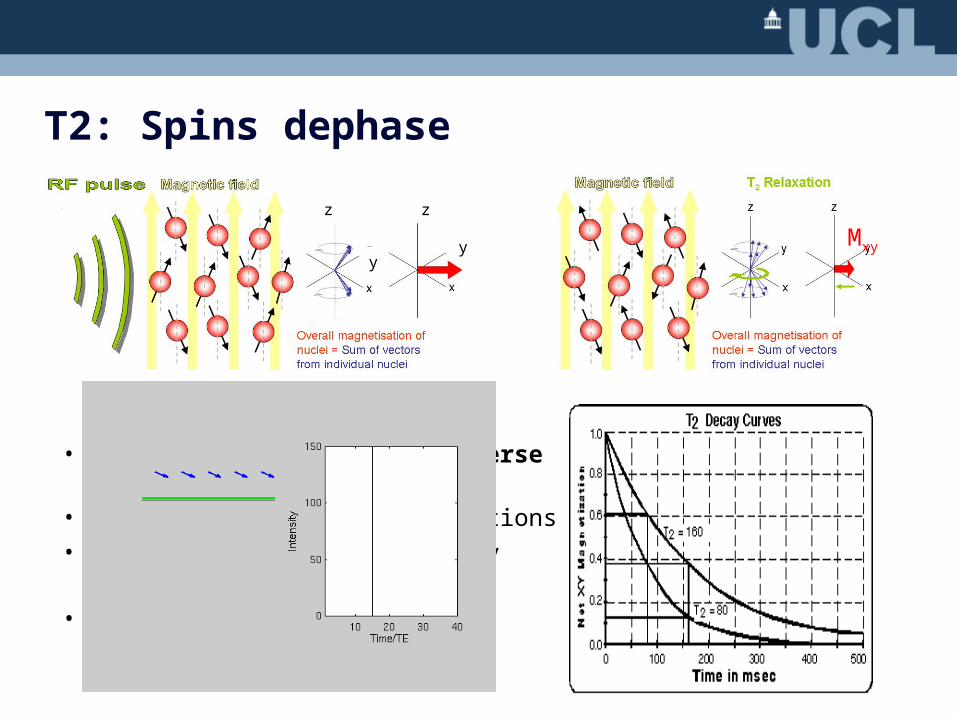
T2: Spins dephase
• Signal decay in xy plane described by exponential curve
• T2 relaxation called transverse relaxation: in xy plane
• Caused by spin-spin interactions
• The loss of signal in the xy plane produces our signal
Mxy
z z
yy

T2 image
T2 is also unique to every tissue. Time constant T2 is defined as the point where 63% of the magnetization in xy has decayed.

Singer et al., 2006
The decay is faster than T2 would predict because of inhomogeneities in the magnetic field what we measure is T2*
T2* is the apparent transverse relaxation
What is T2*?
time
Mxy
Mo sinT2
T2*

How has all this to do with brain activity?• If other magnetic particles are present, T2* decay is even quicker• When a brain area is active, less magnetic particles are present
because more oxygen (oxyhemoglobin) is present (relative to deoxyhemoglobin) and so T2* relaxation is relatively slow
• So all we measure with fMRI/BOLD from a physics point of view are stronger or weaker inhomogeneities in the field due to more or less oxygen being present
time
Mxy
SignalMo sin
T2* taskT2* control
TEoptimum
Stask
ScontrolS
Take-home message part 1: • BOLD is a T2*-weighted contrast
• We are measuring a signal from hydrogen but the signal we get from hydrogen atoms is weaker when less oxygen (oxyhemoglobin) is present
Section 1: Basics of MRI Physics Section 2: What does BOLD reflect?

A Typical Neuron
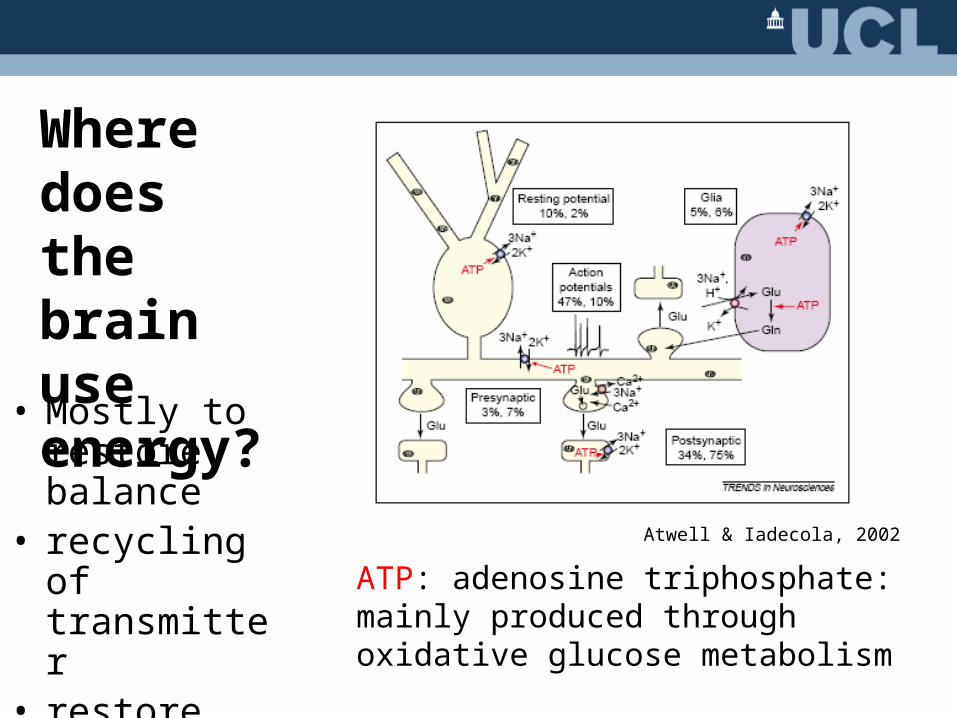
• Mostly to restore balance
• recycling of transmitter
• restore ion gradients
Where does the brain use energy?
Atwell & Iadecola, 2002
ATP: adenosine triphosphate: mainly produced through oxidative glucose metabolism

How is the energy supplied?
Zlokovic & Apuzzo, 1998
Capillary networks supply glucose and oxygen
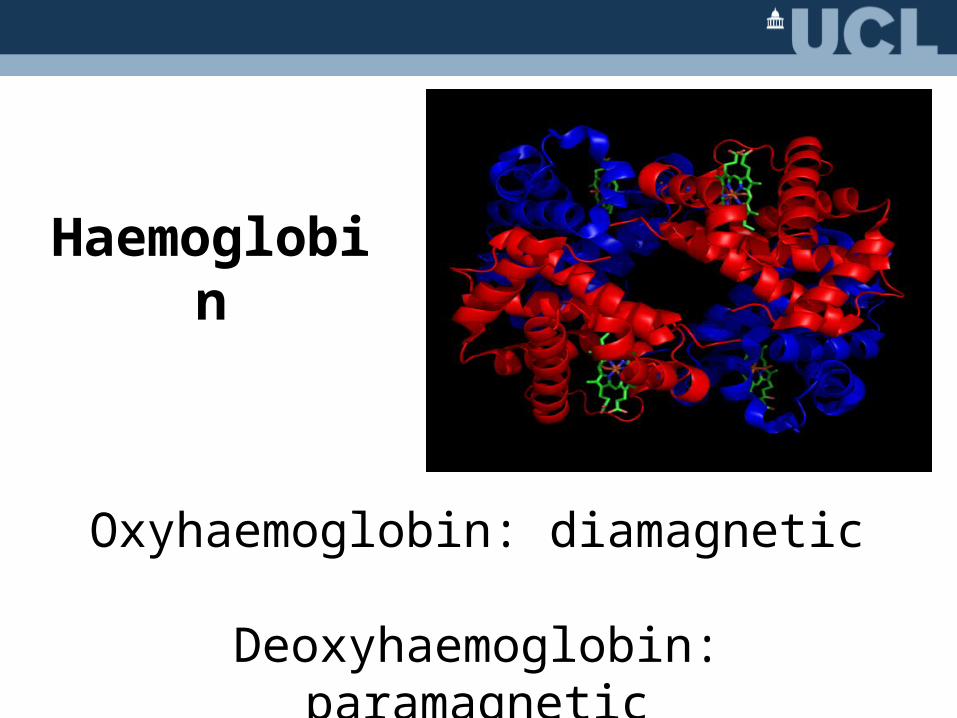
Haemoglobin
Oxyhaemoglobin: diamagnetic
Deoxyhaemoglobin: paramagnetic
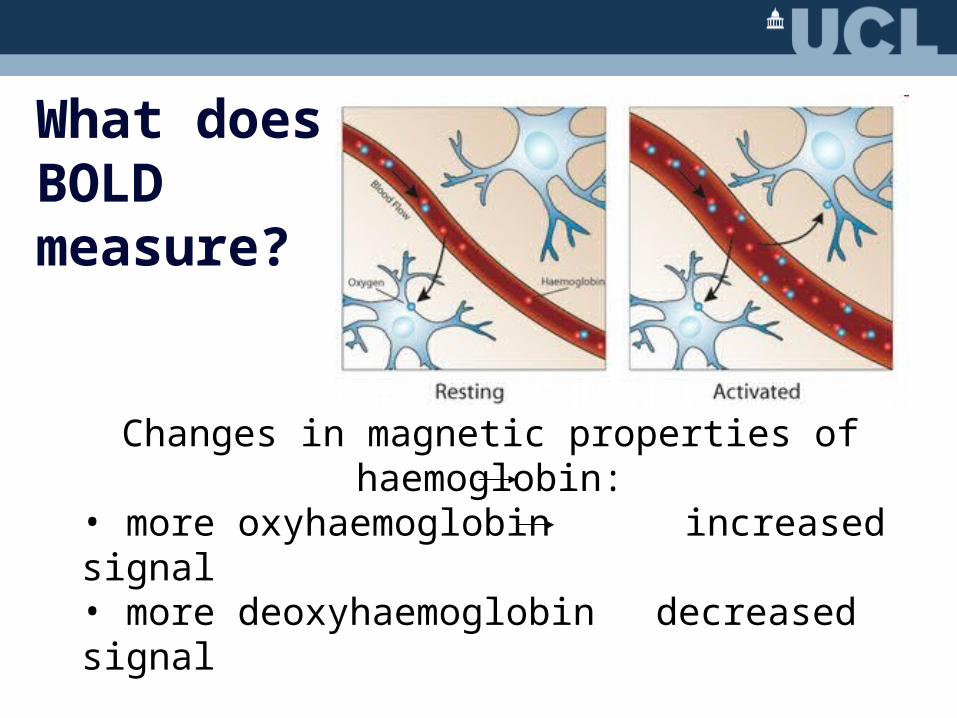
What does BOLD measure?
Changes in magnetic properties of haemoglobin:• more oxyhaemoglobin increased signal• more deoxyhaemoglobin decreased signal
SO…we are NOT measuring oxygen usage directly
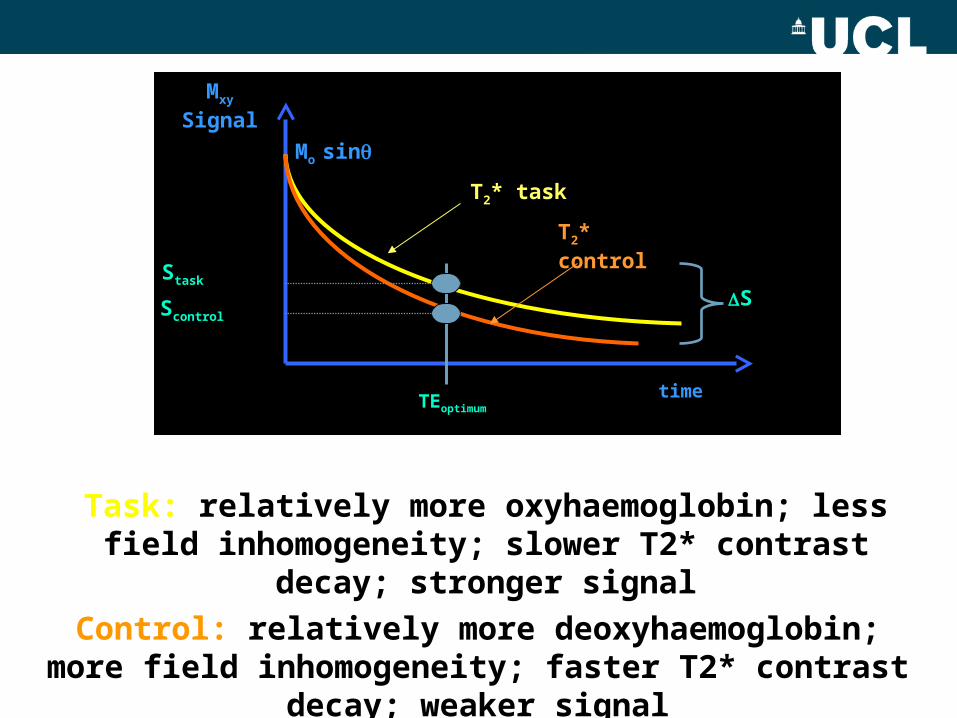
Task: relatively more oxyhaemoglobin; less field inhomogeneity; slower T2* contrast decay; stronger
signal
time
Mxy
Signal
Mo sin
T2* task
T2* control
TEoptimum
Stask
ScontrolS
Control: relatively more deoxyhaemoglobin; more field inhomogeneity; faster T2* contrast decay; weaker signal
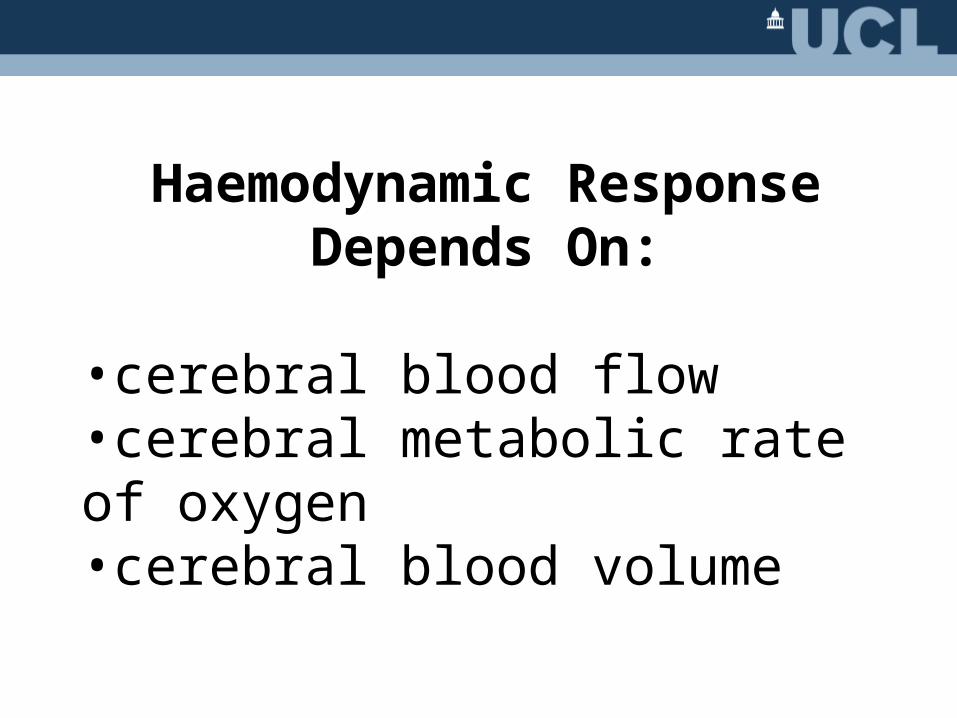
Haemodynamic Response Depends On:
•cerebral blood flow•cerebral metabolic rate of oxygen•cerebral blood volume
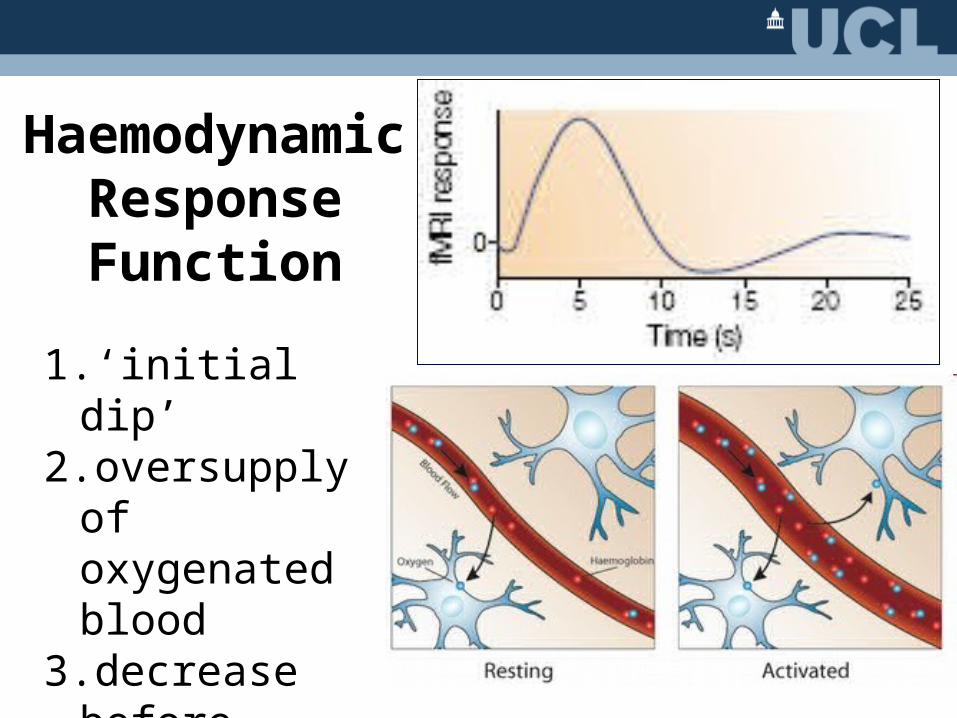
Haemodynamic Response Function
1.‘initial dip’2.oversupply of
oxygenated blood
3.decrease before return to baseline

Supply of blood is correlated with glucose and oxygen consumption
Response is much slower than changes in neuronal activity
Not affected by sustained hypoxia or hypoglycemia
How is cerebral blood flow controlled?

How is cerebral blood flow controlled?
• by-products of neuronal spiking e.g. NO• calcium signalling in astrocytes

What component of neural activity?
Local Field Potential or Spiking?
LFP: synchronized dendritic currents, averaged over large volume of tissue
Could LFP increase without concomitant increase in mean firing rate?
fMRI signal might reflect not only the firing rates of the local neuronal population, but also subthreshold activity
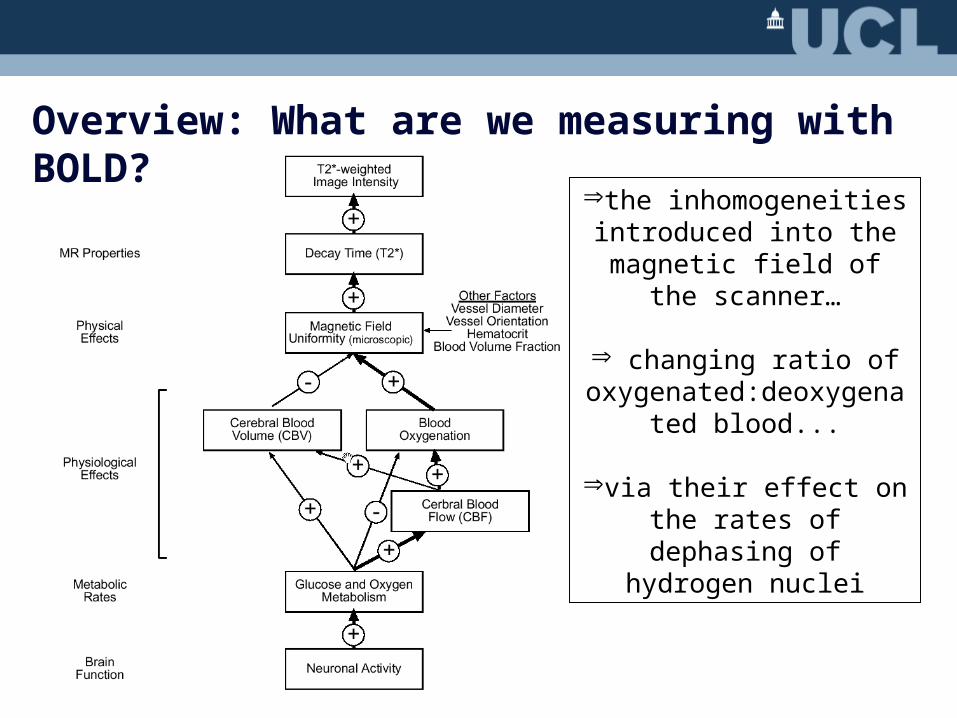
Overview: What are we measuring with BOLD?
the inhomogeneities introduced into the
magnetic field of the scanner…
changing ratio of oxygenated:deoxygenated
blood...
via their effect on the rates of dephasing of
hydrogen nuclei

RealignmentRealignment SmoothingSmoothing
NormalisationNormalisation
General linear modelGeneral linear model
Statistical parametric map (SPM)Statistical parametric map (SPM)Image time-seriesImage time-series
Parameter estimatesParameter estimates
Design matrixDesign matrix
TemplateTemplate
KernelKernel
Gaussian Gaussian field theoryfield theory
p <0.05p <0.05
StatisticalStatisticalinferenceinference
Where are we?

Thanks to...
• Antoinette Nicolle• Nikolaus Weiskopf

References:
• http://www.simplyphysics.com/MRI_shockwave.html• http://www.cardiff.ac.uk/biosi/researchsites/emric/basics.html• Previous year’s talks• Physic’s Wiki: http://cast.fil.ion.ucl.ac.uk/pmwiki/pmwiki.php/Main/HomePage• Heeger, D.J. & Ress, D. (2002) What does fMRI tell us about neuronal activity?Nature
3:142.• Atwell, D. & Iadecola, C. (2002) The neural basis of functional brain imaging signals.
Trends in Neurosciences 25(12):621.
Recommended