
BASSET QUALITY APPENDIX
MREL, FUNDING
& LIQUIDITY
CAPITAL
& LEVERAGE
BREXIT
PREPARATIONS
DIVISIONS
& LEGAL ENTITIES
STRATEGY, TARGETS
& GUIDANCE PERFORMANCE CREDIT RATINGS
Barclays PLCFixed Income Investor Presentation
Q3 2019 Results Announcement
25 October 2019

BASSET QUALITY APPENDIX
MREL, FUNDING
& LIQUIDITY
CAPITAL
& LEVERAGE
BREXIT
PREPARATIONS
DIVISIONS
& LEGAL ENTITIES
STRATEGY, TARGETS
& GUIDANCE PERFORMANCE CREDIT RATINGS
Strategy, Targets and Guidance
STRATEGY, TARGETS
& GUIDANCE

| Barclays Q3 2019 Fixed Income Investor Presentation
BASSET QUALITY APPENDIX
MREL, FUNDING
& LIQUIDITY
CAPITAL
& LEVERAGE
BREXIT
PREPARATIONS
DIVISIONS
& LEGAL ENTITIES
STRATEGY, TARGETS
& GUIDANCE PERFORMANCE CREDIT RATINGS
Focused on profitability and returning capital to shareholders
1 Excluding L&C, with returns targets based on a Group CET1 ratio of c.13.5% | 2 CET1 ratio is currently 140bps above the regulatory minimum level. The headroom will continue to be reviewed on a regular basis | 3 Excluding L&C and based on 1.27 USD/GBP FX rate |
Group targets
Target increased from c.13% to c.13.5%
following the benefit of removing operational risk RWA floor
>9% in 2019
>10% in 2020
Progressive ordinary dividend, supplemented by share buybacks as
and when appropriate
Below £13.6bn for 20193
Cost: income ratio <60% over time
CET1 ratio2
RoTE1 Cost
Capital returns
Q319 highlights
13.4%
CET1 ratio
10.2%
Group RoTE1
Full year dividend intention remains unchanged
Dividends
59%
Group cost: income ratio1
• Given the global macroeconomic uncertainty and current low interest rate environment, it has become more challenging to achieve the Group RoTE targets, particularly with respect to 2020
• Continuing to improve returns on a sustainable basis remains a key priority for the Group, whilst also delivering attractive capital returns to shareholders and investing in key business growth initiatives
STRATEGY, TARGETS
& GUIDANCE
3
| Barclays Q3 2019 Fixed Income Investor Presentation
BASSET QUALITY APPENDIX
MREL, FUNDING
& LIQUIDITY
CAPITAL
& LEVERAGE
BREXIT
PREPARATIONS
DIVISIONS
& LEGAL ENTITIES
STRATEGY, TARGETS
& GUIDANCE PERFORMANCE CREDIT RATINGS
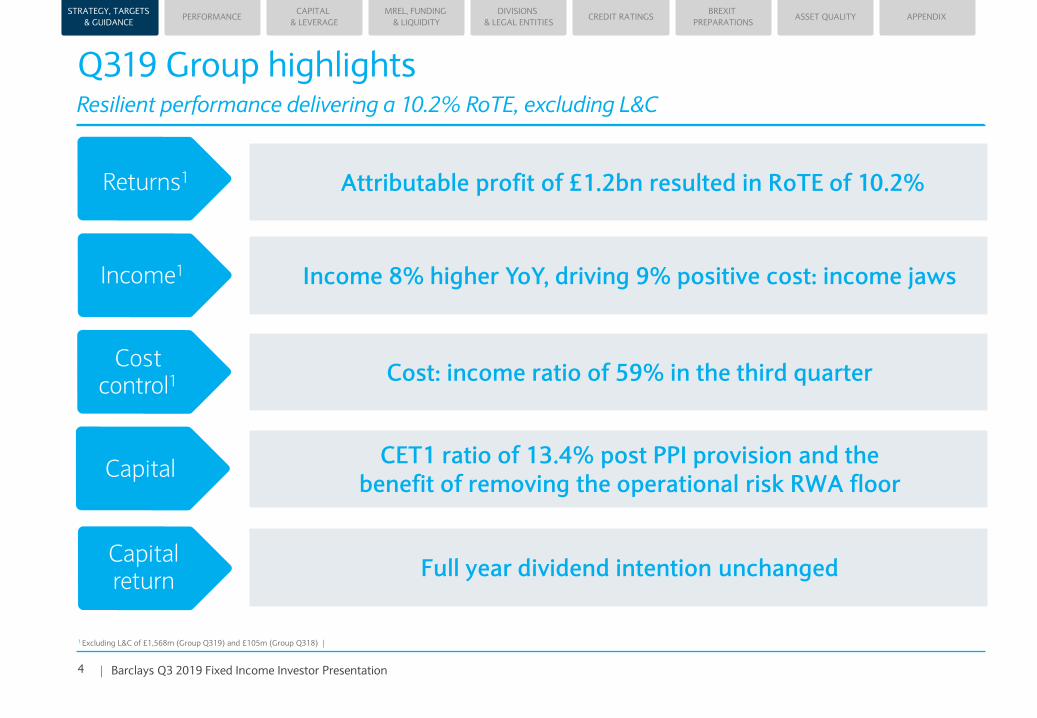
Q319 Group highlightsResilient performance delivering a 10.2% RoTE, excluding L&C
1 Excluding L&C of £1,568m (Group Q319) and £105m (Group Q318) |
Attributable profit of £1.2bn resulted in RoTE of 10.2%Returns1
Income 8% higher YoY, driving 9% positive cost: income jawsIncome1
Cost: income ratio of 59% in the third quarterCost
control1
Full year dividend intention unchangedCapital return
CET1 ratio of 13.4% post PPI provision and the benefit of removing the operational risk RWA floor
Capital
STRATEGY, TARGETS
& GUIDANCE
4
| Barclays Q3 2019 Fixed Income Investor Presentation
BASSET QUALITY APPENDIX
MREL, FUNDING
& LIQUIDITY
CAPITAL
& LEVERAGE
BREXIT
PREPARATIONS
DIVISIONS
& LEGAL ENTITIES
STRATEGY, TARGETS
& GUIDANCE PERFORMANCE CREDIT RATINGS
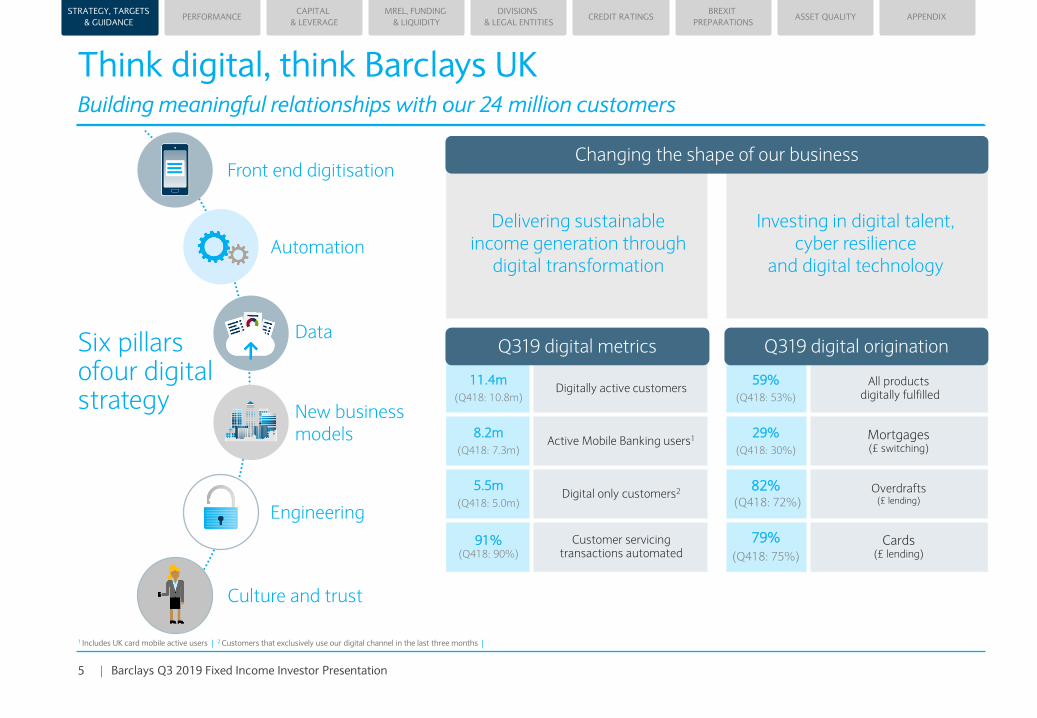
Delivering sustainable income generation through
digital transformation
Investing in digital talent, cyber resilience
and digital technology
11.4m
(Q418: 10.8m)Digitally active customers
59%
(Q418: 53%)
All productsdigitally fulfilled
8.2m
(Q418: 7.3m)Active Mobile Banking users1
29%
(Q418: 30%)
Mortgages (£ switching)
5.5m
(Q418: 5.0m)Digital only customers2 82%
(Q418: 72%)Overdrafts
(£ lending)
91%(Q418: 90%)
Customer servicing transactions automated
79%
(Q418: 75%)
Cards (£ lending)
Think digital, think Barclays UKBuilding meaningful relationships with our 24 million customers
1 Includes UK card mobile active users | 2 Customers that exclusively use our digital channel in the last three months |
Data
Automation
Culture and trust
Engineering
Six pillars ofour digital strategy New business
models
Front end digitisation
Q319 digital metrics
Changing the shape of our business
Q319 digital origination
5
STRATEGY, TARGETS
& GUIDANCE

| Barclays Q3 2019 Fixed Income Investor Presentation
BASSET QUALITY APPENDIX
MREL, FUNDING
& LIQUIDITY
CAPITAL
& LEVERAGE
BREXIT
PREPARATIONS
DIVISIONS
& LEGAL ENTITIES
STRATEGY, TARGETS
& GUIDANCE PERFORMANCE CREDIT RATINGS
XX
30bps
XXX
Barclays International: Improving share in the CIBGaining share in Markets and Banking
1 Source: Coalition 1H19 Competitor Analysis. Ranks are based on the following banks: Bank of America Merrill Lynch, BNP Paribas, Citigroup, Credit Suisse, Deutsche Bank, Goldman Sachs, HSBC, J.P. Morgan, Morgan Stanley, Société Générale and UBS. Market share represents Barclays share of the total Industry Revenue Pool. Analysis is based on Barclays’ internal business structure and internal revenues. | 2 Source: Dealogic for period 1 January 2019 to 30 September 2019 |
Q319 YTD fee share rank of #6 globally and #5 based onUS fee share, both up one spot from FY18
Up 4 places to #7 rank in Equity underwriting Q319 YTD
#1 ranked European bank in the US since 2013
Banking fees2Markets1
XXXXX
#4 rank in Debt underwriting Q319 YTD
XX
20bps
XXX
4.3% 4.5%
H118 H119
#5 rank in Advisory, up one spot from FY18
Overall 20bps gain of market share in Global Markets, driven by strong performance in FICC, reflecting improvements in Macro and Securitised Products
4.1% 4.4%
FY18 Q319 YTD
50bps gain of market share in FICC over the period
Up 1 place to #6 rank in Prime Financing. Barclays is currently the largest non-US Prime Broker
6
STRATEGY, TARGETS
& GUIDANCE
| Barclays Q3 2019 Fixed Income Investor Presentation
BASSET QUALITY APPENDIX
MREL, FUNDING
& LIQUIDITY
CAPITAL
& LEVERAGE
BREXIT
PREPARATIONS
DIVISIONS
& LEGAL ENTITIES
STRATEGY, TARGETS
& GUIDANCE PERFORMANCE CREDIT RATINGS
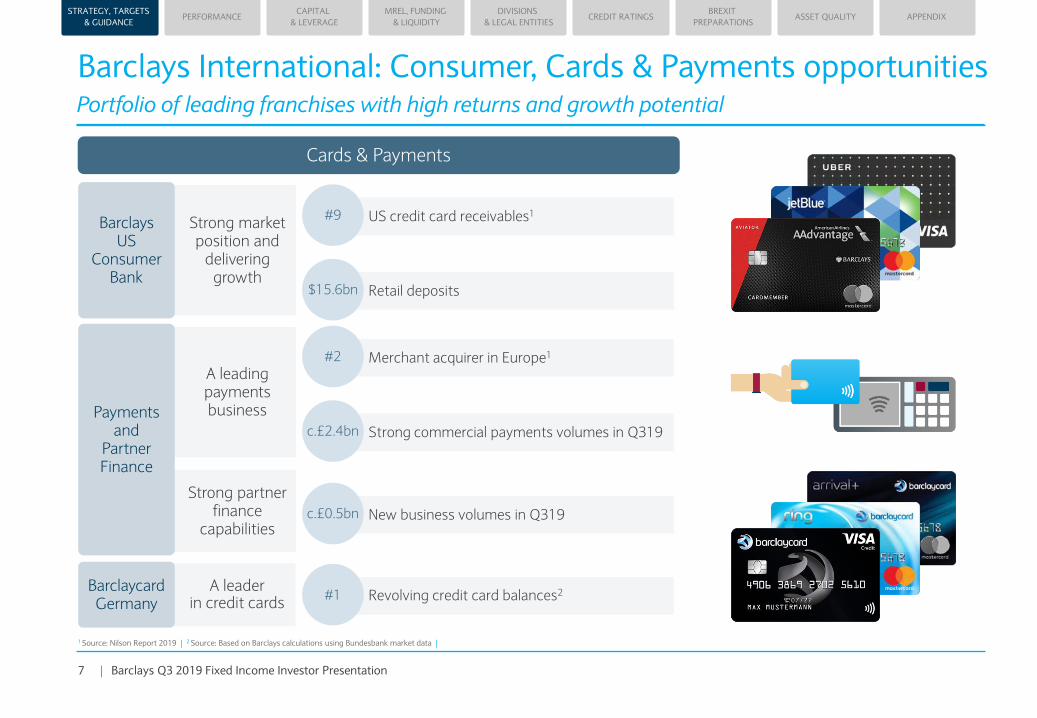
Strong partner finance
capabilities
Barclays International: Consumer, Cards & Payments opportunitiesPortfolio of leading franchises with high returns and growth potential
1 Source: Nilson Report 2019 | 2 Source: Based on Barclays calculations using Bundesbank market data |
Strong market position and
delivering growth
Barclays US
Consumer Bank
Cards & Payments
A leading payments businessPayments
andPartner Finance
A leader in credit cards
Barclaycard Germany
New business volumes in Q319c.£0.5bn
US credit card receivables1#9
Retail deposits$15.6bn
Merchant acquirer in Europe1#2
Strong commercial payments volumes in Q319c.£2.4bn
Revolving credit card balances2#1
7
STRATEGY, TARGETS
& GUIDANCE

| Barclays Q3 2019 Fixed Income Investor Presentation
BASSET QUALITY APPENDIX
MREL, FUNDING
& LIQUIDITY
CAPITAL
& LEVERAGE
BREXIT
PREPARATIONS
DIVISIONS
& LEGAL ENTITIES
STRATEGY, TARGETS
& GUIDANCE PERFORMANCE CREDIT RATINGS
3.4 3.3
3.3 3.5
3.3 3.3
3.9
FY18 2019 YTD 2019 guidance
13.9 <13.62
Q3
Q4
Q2
Q1
Absolute cost reduction 2018 to 2019 (£bn)1
2019 cost guidance remains unchanged Cost control remains on track as we continue to prioritise cost efficiency measures
1 Costs exclude L&C; for 2018 the GMP charge of £140m is also excluded | 2 Excluding L&C and based on 1.27 USD/GBP FX rate |
Targeting cost: incomeratio below
60% over time
Attractive medium term growth initiatives
Capacity to invest
BX generating significant productivity savings
2019 cost flexibility
• Expect to reduce 2019 costs below £13.6bn2 (based on 1.27 USD/GBP FX rate) through:– Management focus on cost control and efficiencies
– Ability to prioritise and adjust pace of investment spend
– Continued flexibility in compensation costs depending on income performance
Improved cost efficiency and operating leverage enabled by BX
10.1
8
STRATEGY, TARGETS
& GUIDANCE

| Barclays Q3 2019 Fixed Income Investor Presentation
BASSET QUALITY APPENDIX
MREL, FUNDING
& LIQUIDITY
CAPITAL
& LEVERAGE
BREXIT
PREPARATIONS
DIVISIONS
& LEGAL ENTITIES
STRATEGY, TARGETS
& GUIDANCE PERFORMANCE CREDIT RATINGS
Focus on ESG Growing momentum on key Environmental, Social and Governance factors across the firm
1 Total financing volume in eligible social and environmental categories according to Barclays Impact Eligibility Framework (2018-25) | 2 Investments in labelled Green Bonds by Barclays Treasury (no end timeframe) | 3 Total capacity for UK SME lending 2019-21 |4 Scope 2 emissions measured according to market basis under the Greenhouse Gas Protocol (2025 against a 2018 baseline) | 5 100% by 2030, 90% by 2025 | 6 Total number of participating ventures since launch (2016-22) | 7 Total number of participants in the UK (2018-22) | 8 Total number of work placements across programmes and regions – UK, US, Asia (2019-22) |
£150bn social and environmental financing1
£4bn green bond investment2
Capital and Products
£14bn UK SME lending fund with dedicated regional and industry focused growth funds3
Work with partners to build thriving local economies
Economic Growth
10 million people7 helped to improve skills through our LifeSkills programme250,000 people placed into work8 through our Connect with Work partnerships
Skills and Employability
250 high impact businesses supported through our Unreasonable Impact programme6
Continue to support Barclays’ Social Innovation Facility
Sustainable Innovation
80% reduction in operational Scope 1 and 2 emissions4
RE100 commit to procure 100% of global operational electricity needs from renewable sources5
Environmental Stewardship
Sustainability & Citizenship commitments
STRATEGY, TARGETS
& GUIDANCE
Progress on key ESG factors
• Continued to build green and sustainable finance platform across business lines
• Released Energy and Climate Change and Forestry and Palm Oil statements
• Integrating climate risk management including PRA supervisory statement and TCFD disclosures
• Issued inaugural BPLC green bond (November 2017) and continued to increase green bond investments held in Treasury
Environment
• Launched £14bn SME fund and held over 100 Brexit clinics
• 24% women in senior leadership roles of Director and Managing Director, up 1% YoY with new target of 28% by 2021
• Focused on strong data privacy and security with customer education initiatives
Social
• Strengthened control environment and resolved legacy litigation and conduct matters
• Conduct and Culture performance dashboards tracked by the Board and senior leadership
• Established new Environmental and Social Impact Committee chaired by Group CEO
Governance
9
BASSET QUALITY APPENDIX
MREL, FUNDING
& LIQUIDITY
CAPITAL
& LEVERAGE
BREXIT
PREPARATIONS
DIVISIONS
& LEGAL ENTITIES
STRATEGY, TARGETS
& GUIDANCE PERFORMANCE CREDIT RATINGS
Performance
PERFORMANCE
| Barclays Q3 2019 Fixed Income Investor Presentation
BASSET QUALITY APPENDIX
MREL, FUNDING
& LIQUIDITY
CAPITAL
& LEVERAGE
BREXIT
PREPARATIONS
DIVISIONS
& LEGAL ENTITIES
STRATEGY, TARGETS
& GUIDANCE PERFORMANCE CREDIT RATINGS
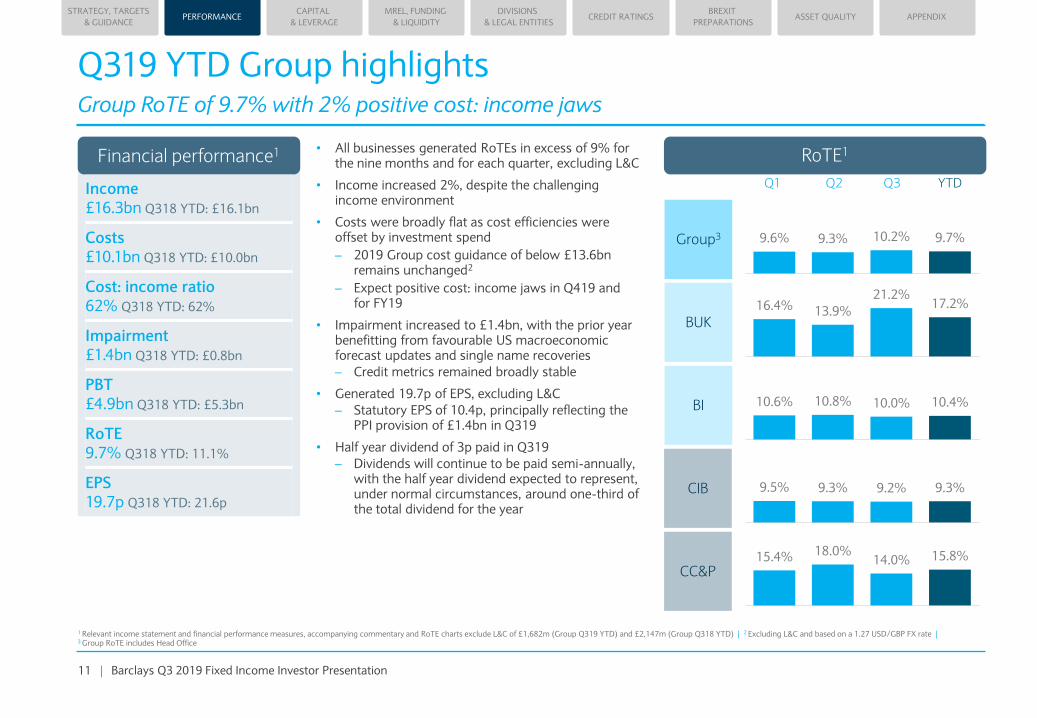
Income £16.3bn Q318 YTD: £16.1bn
Costs £10.1bn Q318 YTD: £10.0bn
Cost: income ratio 62% Q318 YTD: 62%
Impairment£1.4bn Q318 YTD: £0.8bn
PBT £4.9bn Q318 YTD: £5.3bn
RoTE 9.7% Q318 YTD: 11.1%
EPS 19.7p Q318 YTD: 21.6p
• All businesses generated RoTEs in excess of 9% for the nine months and for each quarter, excluding L&C
• Income increased 2%, despite the challenging income environment
• Costs were broadly flat as cost efficiencies were offset by investment spend
– 2019 Group cost guidance of below £13.6bn remains unchanged2
– Expect positive cost: income jaws in Q419 and for FY19
• Impairment increased to £1.4bn, with the prior year benefitting from favourable US macroeconomic forecast updates and single name recoveries
– Credit metrics remained broadly stable
• Generated 19.7p of EPS, excluding L&C
– Statutory EPS of 10.4p, principally reflecting the PPI provision of £1.4bn in Q319
• Half year dividend of 3p paid in Q319
– Dividends will continue to be paid semi-annually, with the half year dividend expected to represent, under normal circumstances, around one-third of the total dividend for the year
Q319 YTD Group highlightsGroup RoTE of 9.7% with 2% positive cost: income jaws
1 Relevant income statement and financial performance measures, accompanying commentary and RoTE charts exclude L&C of £1,682m (Group Q319 YTD) and £2,147m (Group Q318 YTD) | 2 Excluding L&C and based on a 1.27 USD/GBP FX rate | 3 Group RoTE includes Head Office
BUK
BI
CIB
CC&P15.4% 18.0%
14.0% 15.8%
9.5% 9.3% 9.2% 9.3%
10.6% 10.8% 10.0% 10.4%
16.4% 13.9%
21.2%17.2%
Group3 9.6% 9.3% 10.2% 9.7%
Q1 Q2 YTDQ3
Financial performance1 RoTE1
11
PERFORMANCE

| Barclays Q3 2019 Fixed Income Investor Presentation
BASSET QUALITY APPENDIX
MREL, FUNDING
& LIQUIDITY
CAPITAL
& LEVERAGE
BREXIT
PREPARATIONS
DIVISIONS
& LEGAL ENTITIES
STRATEGY, TARGETS
& GUIDANCE PERFORMANCE CREDIT RATINGS
Income £5.5bn Q318: £5.1bn
Costs £3.3bn Q318: £3.3bn
Cost: income ratio 59% Q318: 65%
Impairment£461m Q318: £254m
PBT £1.8bn Q318: £1.6bn
RoTE 10.2% Q318: 10.2%
EPS 7.2p Q318: 6.6p
CET1 ratio 13.4% Jun-19: 13.4%
TNAV274p Jun-19: 275p
Financial performance1
Q319 Group highlightsGenerated attributable profit of £1.2bn and 9% positive cost: income jaws
1 Relevant income statement, financial performance measures and accompanying commentary excludes L&C of £1,568m (Group Q319) and £105m (Group Q318) |
• Income increased 8% driven by a 17% increase in CIB and a 7% increase in CC&P
• Q319 costs of £3.3bn reflected cost efficiency measures across the Group and drove positive operating leverage as income increased
• Impairment increased to £461m primarily due to non-recurrence of significant favourable US macroeconomic updates in Q318
– Q319 included a net charge of c.£60m for macroeconomic scenario updates, primarily impacting the Group’s UK and US Card portfolios
– Underlying credit metrics remained broadly stable across the Group
• PBT increased 16% to £1.8bn, resulting in attributable profit of £1.2bn, EPS of 7.2p and RoTE of 10.2%
• CET1 ratio of 13.4%, in line with the prior quarter
– PPI provision of £1.4bn and other net adverse movements were offset by underlying profits and the benefit of removing the operational risk RWA floor
• TNAV of 274p, decreased 1p in Q319
– Underlying EPS of 7.2p, and net positive FX and other reserve movements were more than offset by a 9p reduction due to L&C and payment of the 3p H119 dividend
12
PERFORMANCE

| Barclays Q3 2019 Fixed Income Investor Presentation
BASSET QUALITY APPENDIX
MREL, FUNDING
& LIQUIDITY
CAPITAL
& LEVERAGE
BREXIT
PREPARATIONS
DIVISIONS
& LEGAL ENTITIES
STRATEGY, TARGETS
& GUIDANCE PERFORMANCE CREDIT RATINGS
Q219 Q319Q418 Q119Q318
Q319 Barclays UKRoTE of 21.2% with 1% positive cost: income jaws and an improved risk profile in UK cards
1 Relevant income statement, financial performance measures and accompanying commentary exclude L&C | 2 Average allocated tangible equity | 3 Net loans and advances at amortised cost | 4 Customer deposits at amortised cost |
Income £1.8bn Q318: £1.9bn
Costs £952m Q318: £988m
Cost: income ratio52% Q318: 52%
Impairment£101m Q318: £115m
LLR20bps Q318: 24bps
PBT £0.8bn Q318: £0.8bn
RoTE21.2% Q318: 22.0%
Average equity2
£10.4bn Q318: £10.1bn
RWAs £76.8bn Jun-19: £76.2bn
1,529 1,513 1,469 1,438 1,503
367 350 308 333 343
196 197 197 201 203
187 188 188 189193
3.22% 3.20% 3.18% 3.05% 3.10%
Totalincome
(£m)
NIM
L&A tocustomers3
(£bn)
Customerdeposits4
(£bn)
NII
Financial performance1 • Strong RoTE of 21.2%, with 1% positive cost: income jaws
• Income decreased 3% YoY reflecting lower interest-earning lending in UK cards and continued mortgage margin pressure
– QoQ income increased 4% as NIM improved slightly to 3.10% despite ongoing mix impact from growth in secured over unsecured lending
– Expect FY19 NIM to be close to the Q319 level of 3.10%
• Costs decreased 4% YoY as ongoing efficiency savings more than offset inflation and continued investment in digital initiatives
– Maintain guidance of positive cost: income jaws in Q419
• Impairment decreased 12% to £101m primarily reflecting an improved risk profile in UK cards, partially offset by the impact of macroeconomic scenario updates of c.£30m
– Underlying credit metrics marginally improved, with UK cards 30 and 90 day arrears of 1.7% (Q318: 1.8%) and 0.8% (Q318: 0.9%) respectively
• L&A3 increased 2% QoQ to £193.2bn
– Continued mortgage growth, up £2.9bn QoQ and £5.3bn YoY
• Loan: deposit ratio of 97% reflects prudent approach to lending given macroeconomic uncertainties
1,8961,846
UK cards arrears
rates (%)
1.8% 1.8% 1.9% 1.8% 1.7%
0.9% 0.9% 0.9% 0.9% 0.8%
1,863 1,777 1,771
30 day arrears 90 day arrears
Non-interest income
13
PERFORMANCE

| Barclays Q3 2019 Fixed Income Investor Presentation
BASSET QUALITY APPENDIX
MREL, FUNDING
& LIQUIDITY
CAPITAL
& LEVERAGE
BREXIT
PREPARATIONS
DIVISIONS
& LEGAL ENTITIES
STRATEGY, TARGETS
& GUIDANCE PERFORMANCE CREDIT RATINGS
1,310
688 619
1,133
Q319 Barclays InternationalDiversified business delivered a third consecutive quarter of double digit returns
1 Relevant income statement, financial performance measures and accompanying commentary exclude L&C | 2 Average allocated tangible equity | 3 H119 BBPLC income, based on counterparty location |
Income £3.8bn Q318: £3.3bn
Costs £2.3bn Q318: £2.3bn
Cost: income ratio61% Q318: 69%
Impairment £352m Q318: £143m
PBT £1.1bn Q318: £0.9bn
RoTE 10.0% Q318: 9.2%
Average equity2
£32.2bn Q318: £31.1bn
LLR99bps Q318: 41bps
RWAs £223.1bn Jun-19: £214.8bn
• Achieved RoTE of 10.0%
• Balanced and diversified business, with US representing c.55% and UK c.30% of income3
• 5% appreciation of average USD against GBP was a tailwind to income and profits and a headwind to costs and impairment
• Income grew 14%, reflecting improved performance, particularly in CIB
• Cost: income ratio decreased significantly to 61%, reflecting the benefits of operating leverage and cost efficiencies
• Impairment increased principally due to the non-recurrence of prior year favourable US macroeconomic scenario updates
• RWAs increased to £223.1bn largely due to increased CIB activity and FX movements
Businessdiversity of
Q319 income(£m)
54%
28%
12%
6%
Geographicdiversity of
H119 income3
(%)
Americas
UK
Europe
Other
Financial performance1 Income balanced across businesses and geographies
Markets
Banking fees
Corporate
CC&P
14
PERFORMANCE

| Barclays Q3 2019 Fixed Income Investor Presentation
BASSET QUALITY APPENDIX
MREL, FUNDING
& LIQUIDITY
CAPITAL
& LEVERAGE
BREXIT
PREPARATIONS
DIVISIONS
& LEGAL ENTITIES
STRATEGY, TARGETS
& GUIDANCE PERFORMANCE CREDIT RATINGS
Q319 Barclays International: Corporate & Investment BankRobust performance with RoTE of 9.2% and significantly positive cost: income jaws of 17%
1 Relevant income statement, financial performance measures and accompanying commentary exclude L&C | 2 Average allocated tangible equity | 3 Source: Dealogic for period 1 January 2019 to 30 September 2019 | 4 USD basis is calculated by translating GBP revenues by month for Q319 and Q318 using the corresponding GBP/USD FX rates |
Income £2.6bn Q318: £2.2bn
Costs £1.7bn Q318: £1.7bn
Cost: income ratio65% Q318: 77%
Impairment £31m charge Q318: £3m releases
PBT £0.9bn Q318: £0.5bn
RoTE9.2% Q318: 7.0%
Average equity2
£26.9bn Q318: £25.9bn
Total assets£941.5bn Jun-19: £878.3bn
RWAs £184.9bn Jun-19: £175.9bn
Financial performance1 • RoTE of 9.2%, reflecting positive operating leverage from a 17% increase in income and flat costs
• Markets income increased 13% driven by FICC
– FICC increased 19%, driven by strong performance particularly in rates and securitised products
– Equities increased 5% despite a lower contribution from equity derivatives
– Included a £40m loss on Tradeweb, and a c.£90m gain from the net impact of treasury operations and hedging counterparty risk
• Banking fees increased 33%, reflecting improved global fee share and growth across M&A, DCM and ECM
– Improved rank vs. FY18 to #6 and increased market share to 4.4%3
• Corporate income increased by 1% driven by Transaction banking
• Costs were stable despite increased income, as cost efficiencies were offset by continued investment in the business
• Impairment charge of £31m reflected the non-recurrence of prior year releases and single name charges
• Total assets increased by £63.2bn QoQ, primarily driven by the flattening of the major interest rate curves, which resulted in increases in both derivative assets and liabilities
• RWAs increased to £184.9bn largely reflecting increased activity and FX movements
+1%
+19%
+33%
+5%
+24%
-1%
+11%
Q318 Q319YoY
Q318 Q319YoY
Income
USD basis4 ($m)GBP basis (£m)
197 195
416 424
688 816
519688
899 1,000
614 606
677842
1,159 1,310 1,513 1,605
FICC
Equities
Markets
Bankingfees
CorporateTransaction banking
Corporate lending
+13% +6%
471 494
15
PERFORMANCE
| Barclays Q3 2019 Fixed Income Investor Presentation
BASSET QUALITY APPENDIX
MREL, FUNDING
& LIQUIDITY
CAPITAL
& LEVERAGE
BREXIT
PREPARATIONS
DIVISIONS
& LEGAL ENTITIES
STRATEGY, TARGETS
& GUIDANCE PERFORMANCE CREDIT RATINGS
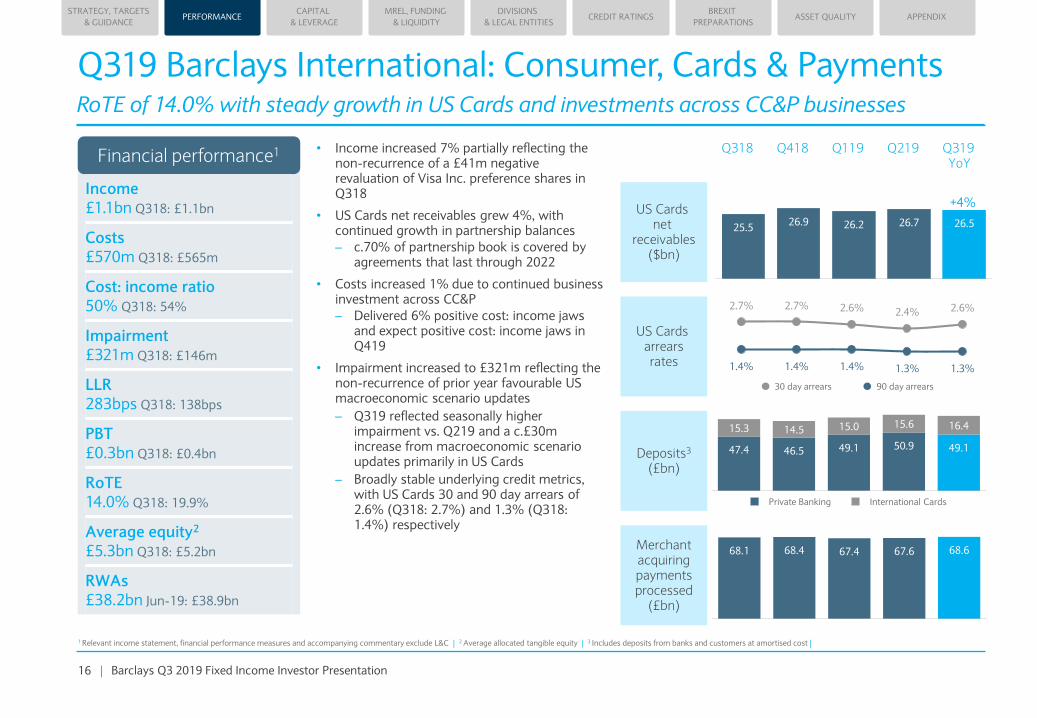
Q418 Q119Q318 Q219 Q319YoY
• Income increased 7% partially reflecting the non-recurrence of a £41m negative revaluation of Visa Inc. preference shares in Q318
• US Cards net receivables grew 4%, with continued growth in partnership balances
– c.70% of partnership book is covered by agreements that last through 2022
• Costs increased 1% due to continued business investment across CC&P
– Delivered 6% positive cost: income jaws and expect positive cost: income jaws in Q419
• Impairment increased to £321m reflecting the non-recurrence of prior year favourable US macroeconomic scenario updates
– Q319 reflected seasonally higher impairment vs. Q219 and a c.£30m increase from macroeconomic scenario updates primarily in US Cards
– Broadly stable underlying credit metrics, with US Cards 30 and 90 day arrears of 2.6% (Q318: 2.7%) and 1.3% (Q318: 1.4%) respectively
68.1 68.4 67.4 67.6 68.6
2.7% 2.7% 2.6% 2.4% 2.6%
1.4% 1.4% 1.4% 1.3% 1.3%
25.526.9 26.2 26.7 26.5
+4%
Q319 Barclays International: Consumer, Cards & PaymentsRoTE of 14.0% with steady growth in US Cards and investments across CC&P businesses
1 Relevant income statement, financial performance measures and accompanying commentary exclude L&C | 2 Average allocated tangible equity | 3 Includes deposits from banks and customers at amortised cost |
Income £1.1bn Q318: £1.1bn
Costs £570m Q318: £565m
Cost: income ratio50% Q318: 54%
Impairment £321m Q318: £146m
LLR283bps Q318: 138bps
PBT £0.3bn Q318: £0.4bn
RoTE14.0% Q318: 19.9%
Average equity2
£5.3bn Q318: £5.2bn
RWAs £38.2bn Jun-19: £38.9bn
Financial performance1
US Cardsnet
receivables($bn)
US Cardsarrearsrates
Merchantacquiringpaymentsprocessed
(£bn)
30 day arrears 90 day arrears
Deposits3
(£bn)
47.4 46.5 49.1 50.9 49.1
15.3 14.5 15.0 15.6 16.4
Private Banking International Cards
16
PERFORMANCE

| Barclays Q3 2019 Fixed Income Investor Presentation
BASSET QUALITY APPENDIX
MREL, FUNDING
& LIQUIDITY
CAPITAL
& LEVERAGE
BREXIT
PREPARATIONS
DIVISIONS
& LEGAL ENTITIES
STRATEGY, TARGETS
& GUIDANCE PERFORMANCE CREDIT RATINGS
Head Office
1 Excluding L&C |
• Q319 negative income included:
– c.£30m residual negative income impact from legacy capital instruments following redemption of the 14% RCI in Q219
– Hedge accounting expenses
– Certain negative treasury items
– Partially offset by the Absa Group Ltd dividend of £35m
• Quarterly Head Office costs expected to remain around current levels going forward
• RWAs reduced to £13.4bn following removal of the operational risk RWA floor
Income(£m)
Costs1
(£m)
Loss before tax1
(£m)
RWAs(£bn) 26.8 28.1
13.4
(64) (44) (59)
(57) (136) (55)
Q318 Q219 Q319
(110)(168) (116)
17
PERFORMANCE
BASSET QUALITY APPENDIX
MREL, FUNDING
& LIQUIDITY
CAPITAL
& LEVERAGE
BREXIT
PREPARATIONS
DIVISIONS
& LEGAL ENTITIES
STRATEGY, TARGETS
& GUIDANCE PERFORMANCE CREDIT RATINGS
Capital & Leverage
CAPITAL
& LEVERAGE

| Barclays Q3 2019 Fixed Income Investor Presentation
BASSET QUALITY APPENDIX
MREL, FUNDING
& LIQUIDITY
CAPITAL
& LEVERAGE
BREXIT
PREPARATIONS
DIVISIONS
& LEGAL ENTITIES
STRATEGY, TARGETS
& GUIDANCE PERFORMANCE CREDIT RATINGS
Q319 CET1 ratio of 13.4% benefited from the removal of the operational risk RWA floor by c.60bps
1 CET1 ratio calculated applying CRR and IFRS 9 transitional arrangements, as amended by CRR II as at the reporting date | 2 Regulatory minimum level represents the MDR hurdle | 3 The increase in the Pillar 2A CET1 requirement was part of the PRA’s Individual Capital Requirement applicable from 24 October 2019. The increase in the regulatory minimum level is the same, but does not match due to rounding |
• Following discussions with regulators, we have removed the operational risk RWA floor. This brings the operational risk RWA treatment more in line with other UK banks
– Previous treatment included an RWA floor at £56.7bn as part of the Pillar 1 capital requirement
– Removal of the floor reduced total RWAs by c.£14bn
– Group’s total capital requirement for operational risk remains unchanged
• As a result, for the Group:
– CET1 ratio of 13.4% for Q319 included a benefit of c.60bps
– Target CET1 ratio also increased from c.13% to c.13.5%
– Pillar 2A CET1 requirement increased from 2.6% to 3.0%3, resulting in the CET1 regulatory minimum level increasing from 11.7% to 12.0%
– CET1 ratio target currently provides a c.150bps headroom to the regulatory minimum level, an increase of 20bps2
c.60bps positive CET1 ratio impact from change in operational risk regulatory treatment1
Old basis New basis Change
4.5%
2.6%
1.5%
2.5%
0.5%
Previous requirement
1.5%
4.5%
3.0%
1.5%
2.5%
0.5%
New requirement
c.13%c.13.5% +50bps
CET1 ratio target
11.7%12.0% +30bps
Regulatory minimum level2
Countercyclical Buffer (CCyB)
Capital Conservation Buffer (CCB)
G-SII buffer
Pillar 2A CET1 requirement3
Pillar 1 requirement
19
CAPITAL
& LEVERAGE

| Barclays Q3 2019 Fixed Income Investor Presentation
BASSET QUALITY APPENDIX
MREL, FUNDING
& LIQUIDITY
CAPITAL
& LEVERAGE
BREXIT
PREPARATIONS
DIVISIONS
& LEGAL ENTITIES
STRATEGY, TARGETS
& GUIDANCE PERFORMANCE CREDIT RATINGS
• CET1 ratio of 13.4% reflecting:
– c.60bps from the benefit of removing the operational risk RWA floor
– c.50bps of profits generated in the quarter
Offset by:
– 21bps for dividends paid and foreseen on ordinary dividends and AT1 coupons
– 6bps due to pension contributions of £250m
– 13bps from the FX impact on redemption of USD and EUR AT1 securities
– 24bps from RWA increases and other capital movements
− 49bps from L&C, including the PPI provision of £1.4bn
CET1 ratio progression13.4% with strong capital generation from profits
1 CET1 ratio is currently 140bps above the regulatory minimum level. The headroom will continue to be reviewed on a regular basis. The fully loaded CET1 ratio was 13.0% as at September 2019 |
CET1 ratio1
13.4%
14.0%13.9%
13.4%
c.60bps
48bps21bps 6bps
13bps
24bps
49bps
Jun-19 Removal of
operational
risk RWA
floor
Profits Dividends
paid &
foreseen
Pension
contributions
AT1
redemptions
RWA
& other
movements
L&C Sep-19
£42.9bn £41.9bn
£8.4bn £313.3bn(£14.2bn)
CET1capital:
RWA: £319.1bn
20
CAPITAL
& LEVERAGE

| Barclays Q3 2019 Fixed Income Investor Presentation
BASSET QUALITY APPENDIX
MREL, FUNDING
& LIQUIDITY
CAPITAL
& LEVERAGE
BREXIT
PREPARATIONS
DIVISIONS
& LEGAL ENTITIES
STRATEGY, TARGETS
& GUIDANCE PERFORMANCE CREDIT RATINGS
Strong Group CET1 and leverage ratios
1 Represents transitional CET1 ratios. Fully loaded CET1 ratio as at 30 September 2019 was 13.0% | 2 Represents transitional RWA and UK leverage exposure for 1-Jan-18 onwards. Fully loaded RWA and leverage exposures are materially the same as on the transitional basis | 3 Represents transitional leverage ratios. Fully loaded leverage ratio as at 30 September 2019 was 4.7% |
• Transitional UK leverage ratio decreased by 30bps in the quarter to 4.8%, driven by:
– £21bn increase in leverage exposure
– £2.3bn decrease in Tier 1 capital, due to a £1.3bn net decrease in AT1 capital and £1bn decrease in CET1 capital
• Average transitional UK daily leverage ratio was 4.6% as at 30 September 2019, down 10bps in the quarter. The average UK leverage exposure increased £36bn QoQ to £1,171bn
• Remain comfortably above the 4% UK leverage minimum requirement
IFRS 9 transitional benefitFully loaded CET1 ratio
IFRS 9 transitional benefitFully loaded UK leverage ratioCRR leverage ratio
• Transitional CET1 ratio was stable QoQ at 13.4%, reflecting:
– c.60bps from the benefit of removing the operational risk RWA floor
– c.50bps of profits generated in the quarter
Partly offset by:
– 21bps for dividends paid and foreseen on ordinary dividends and AT1 coupons
– 6bps due to pension contributions of £250m
– 13bps from the FX impact on redemption of USD and EUR AT1 securities
– 24bps from RWA increases and other capital movements
– 49bps from L&C, including the PPI provision of £1.4bn
CAPITAL
& LEVERAGE
Leverage Exposure (£bn)2
Fully loaded and transitional CET1 ratio
Fully loaded and transitional leverage ratio
RWAs (£bn)2
11.4%12.4%
13.3%113.2%1 13.4%1 13.4%1
31-Dec-15 31-Dec-16 1-Jan-18 31-Dec-18 30-Jun-19 30-Sep-19
4.5%
5.0% 5.1%3 5.1%3 5.1%3
4.8%3
31-Dec-15 31-Dec-16 1-Jan-18 31-Dec-18 30-Jun-19 30-Sep-19
1,050 9851,028 999 1,079 1,100
366 313358 312 319 313
21

| Barclays Q3 2019 Fixed Income Investor Presentation
BASSET QUALITY APPENDIX
MREL, FUNDING
& LIQUIDITY
CAPITAL
& LEVERAGE
BREXIT
PREPARATIONS
DIVISIONS
& LEGAL ENTITIES
STRATEGY, TARGETS
& GUIDANCE PERFORMANCE CREDIT RATINGS
Prudently managing the Group’s capital positionGroup’s CET1 managed to remain above the regulatory minimum, pass stress tests, and absorb any PRA buffer
1 CET1 ratio calculated applying CRR and IFRS 9 transitional arrangements, as amended by CRR II as at the reporting date | 2 As per CRD Art. 141, restrictions on discretionary distributions would apply in case of a breach of the CBR as defined in CRD Art 128(6) | 3 All regulatory models are subject to PRA approval before adoption. The impacts may change as a result |
• Barclays’ headroom is currently 1.4% above our current MDR hurdle, intended to absorb fluctuations in the CET1 ratio, cover event risk and stress and to enable management actions to be taken in sufficient time to avoid mandatory distribution restrictions
• Distribution restrictions2 apply if an institution fails to meet the Combined Buffer Requirement (CBR), at which point the maximum distributable amount is calculated on a reducing scale. Barclays’ recovery plan actions are calibrated to take effect ahead of breaching the CBR
• In determining any proposed distributions to shareholders, the Board notes it will consider the expectation of servicing more senior securities4.5%
3.0%
1.5%
2.5%
CET1 requirement
Headroom12.0%
1.5%
0.5%
CAPITAL
& LEVERAGE
Pillar 2A CET1 requirement
Pillar 1 requirement
Capital Conservation Buffer (CCB)
G-SII buffer
Mandatory Distribution Restrictions (MDR) hurdle
Countercyclical Buffer (CCyB)
Q319 CET1 ratio1 13.4%
c.13.5% target
• Maintained robust capital buffers based on 30 September 2019 capital position:
– Buffer to 30 September 2019 MDR hurdle: c.1.4% or c.£4.4bn
– Buffer to 7% AT1 trigger event: c.6.0% or c.£18.8bn based on the fully loaded CET1 ratio of 13.0%, excluding transitional relief, in line with AT1 terms and conditions
Distribution restrictions
RWA guidance
• Manageable near-term regulatory-driven RWA increases, each in low single digit billions3:
– Mortgages (Definition of Default moving from 180 to 90 days and adoption of hybrid model) in December 2020 (BUK)
– Securitisation in January 2020 (CIB)
– SA-CCR in June 2021 (CIB)
22

| Barclays Q3 2019 Fixed Income Investor Presentation
BASSET QUALITY APPENDIX
MREL, FUNDING
& LIQUIDITY
CAPITAL
& LEVERAGE
BREXIT
PREPARATIONS
DIVISIONS
& LEGAL ENTITIES
STRATEGY, TARGETS
& GUIDANCE PERFORMANCE CREDIT RATINGS
Managing evolving future Group minimum leverage requirements
1 Leverage ratio calculated applying CRR and IFRS 9 transitional arrangements, as amended by CRR II as at the reporting date |
23
BoE minimum leverage requirement
G-SII leverage buffer
Regulatory minimumleverage requirement
CountercyclicalLeverage Buffer (CCLB)
BoE stress test hurdlerate for 2018 tests
3.25%
0.525%
Leverage requirement
Headroom
3.61%
3.975%0.2%
0.525%
• We continue to view leverage as a backstop measure in determining the capital Barclays holds. Our business mix means the risk based RWA measure of capital remains our binding constraint
• The Group currently has one leverage requirement, as measured under the UK’s PRA leverage regime. The requirement must be met on a daily basis, and is reflected in the daily average leverage exposure
• As at 30 September 2019, the UK leverage ratio was c.80bps above the 2019 requirement and c.120bps above the 2018 BoE stress test hurdle rate
• Barclays’ UK spot leverage ratio is consistently c.5%, with the daily average ratio typically below as we deploy incremental leverage in high velocity businesses
• We continue to closely monitor leverage regulatory developments, cognisant of future FPC statements
• SA-CCR change in June 2021 under CRR II expected to reduce leverage exposure modestly
CAPITAL
& LEVERAGE
Q319 Leverage ratios1:
UK Spot: 4.8%
UK Average: 4.6%
Minimum leverage requirements and buffers under the UK regime

| Barclays Q3 2019 Fixed Income Investor Presentation
BASSET QUALITY APPENDIX
MREL, FUNDING
& LIQUIDITY
CAPITAL
& LEVERAGE
BREXIT
PREPARATIONS
DIVISIONS
& LEGAL ENTITIES
STRATEGY, TARGETS
& GUIDANCE PERFORMANCE CREDIT RATINGS
Transition to 2022 capital structure well establishedExpect to maintain prudent headroom above AT1 and Tier 2 minimums
1 Includes combined buffer requirement and CET1 headroom | 2 CET1 ratio is currently 140bps above the regulatory minimum level, at our target of c.13.5% | 3 In line with their regulatory capital values until 1 January 2022; based on Barclays’ understanding of the current BoE position |
• BBPLC issued capital instruments are expected to be included as MREL, until 1 January 20223, and may continue to qualify as Tier 2 regulatory capital thereafter
• Aim is to manage our capital structure in an efficient manner:
– Expect to be a regular issuer of AT1 and to maintain around the current level of RWAs in AT1 over time
– Expect to continue to maintain a headroom to 3.3% of Tier 2
• Barclays’ Pillar 2A requirement is set as part of an “Overall Capital Requirement” (P1 + P2A) reviewed and prescribed at least annually by the PRA
• The Group P2A requirement applicable from 24 October 2019 has been revised to 5.3% and is split:
– CET1 of 3.0% (assuming 56.25% of total P2A requirement)
– AT1 of 1.0% (assuming 18.75% of total P2A requirement)
– Tier 2 of 1.3% (assuming 25% of total P2A requirement)
13.4% (£41.9bn)
CET1
3.4%(£10.8bn)
AT1
0.3% (£0.8bn) Legacy T1
4.1%(£12.7bn)
T2
21.1% Total capital ratio
≥19.3% Total capital requirement1
2022capital structure
T2 Headroom
≥3.3% T2
AT1 Headroom
≥2.5% AT1
CET1 Headroom2
12.0%CET1 MDR hurdle
Sep-19capital structure
CAPITAL
& LEVERAGE
Illustrative evolution of regulatory capital structure Well managed and balanced total capital structure
Pillar 2A Requirement
24

| Barclays Q3 2019 Fixed Income Investor Presentation
BASSET QUALITY APPENDIX
MREL, FUNDING
& LIQUIDITY
CAPITAL
& LEVERAGE
BREXIT
PREPARATIONS
DIVISIONS
& LEGAL ENTITIES
STRATEGY, TARGETS
& GUIDANCE PERFORMANCE CREDIT RATINGS
Managing the call and maturity profiles of BPLC and BBPLC capital instruments
1 Prepared on nominal basis which will not reconcile with regulatory or accounting bases due to adjustments |
• Strong track record of managing outstanding legacy instruments
• Legacy capital instruments maturing or callable post 1 January 2022 are modest and short-dated, with c.90% of all instruments maturing or callable by the end of 2022
0.9
4.8
3.4
0.50.40.2 0.1 0.1
2019 2020 2021 2022 2023+
BBPLC Tier 2 capital as at 30 September 20191BBPLC AT1 capital as at 30 September 20191
0.20.5
2019 2020 2021 2022 2023+
Post 1 January 2022 Post 1 January 2022
• Redemption of three AT1 instruments effected on 15 September 2019
BPLC AT1 capital as at 30 September 20191
0.8
2.1
7.9
2019 2020 2021 2022 2023+
2.7
1.1
4.3
2019 2020 2021 2022 2023+
BPLC Tier 2 capital as at 30 September 20191
First call date By next call date as applicableBy contractual maturity as applicable
CAPITAL
& LEVERAGE
BPLC capital call and maturity profile (£bn)
BBPLC capital call and maturity profile (£bn)
Short and small tail of legacy capital by 1 January 2022
25

| Barclays Q3 2019 Fixed Income Investor Presentation
BASSET QUALITY APPENDIX
MREL, FUNDING
& LIQUIDITY
CAPITAL
& LEVERAGE
BREXIT
PREPARATIONS
DIVISIONS
& LEGAL ENTITIES
STRATEGY, TARGETS
& GUIDANCE PERFORMANCE CREDIT RATINGS
ADI position supports strong distribution capacity
1 Coupon payments on AT1s have to be paid from an institution’s ADIs (CRR Art 52(1)(l)). Should the level of ADIs be insufficient, coupons cannot be paid. The CRR, as amended by CRR II, does not provide for a particular method for the calculation of ADIs. In the absence of further regulatory guidance, Barclays PLC’s distributable items are calculated consistently with the requirements of the UK Companies Act, as applicable to ordinary shares, and IFRS |
• Barclays PLC has significant ADIs1 to cover dividends on ordinary shares and AT1 distributions
• Barclays has never missed an external discretionary interest payment on its capital instruments, including during the financial crisis
• Continue to manage ADIs as part of our capital planning
768
752
Barclays PLC 2018distributable items
c.16.1x dividend and coupon cover
24,471
1,520
CAPITAL
& LEVERAGE
Barclays PLC AT1 couponsADI Barclays PLC dividend payments
Distribution capacity as at 31 December 2018 (£m) Distributable items
26

BASSET QUALITY APPENDIX
MREL, FUNDING
& LIQUIDITY
CAPITAL
& LEVERAGE
BREXIT
PREPARATIONS
DIVISIONS
& LEGAL ENTITIES
STRATEGY, TARGETS
& GUIDANCE PERFORMANCE CREDIT RATINGS
MREL, Funding and Liquidity
MREL, FUNDING
& LIQUIDITY
| Barclays Q3 2019 Fixed Income Investor Presentation
BASSET QUALITY APPENDIX
MREL, FUNDING
& LIQUIDITY
CAPITAL
& LEVERAGE
BREXIT
PREPARATIONS
DIVISIONS
& LEGAL ENTITIES
STRATEGY, TARGETS
& GUIDANCE PERFORMANCE CREDIT RATINGS
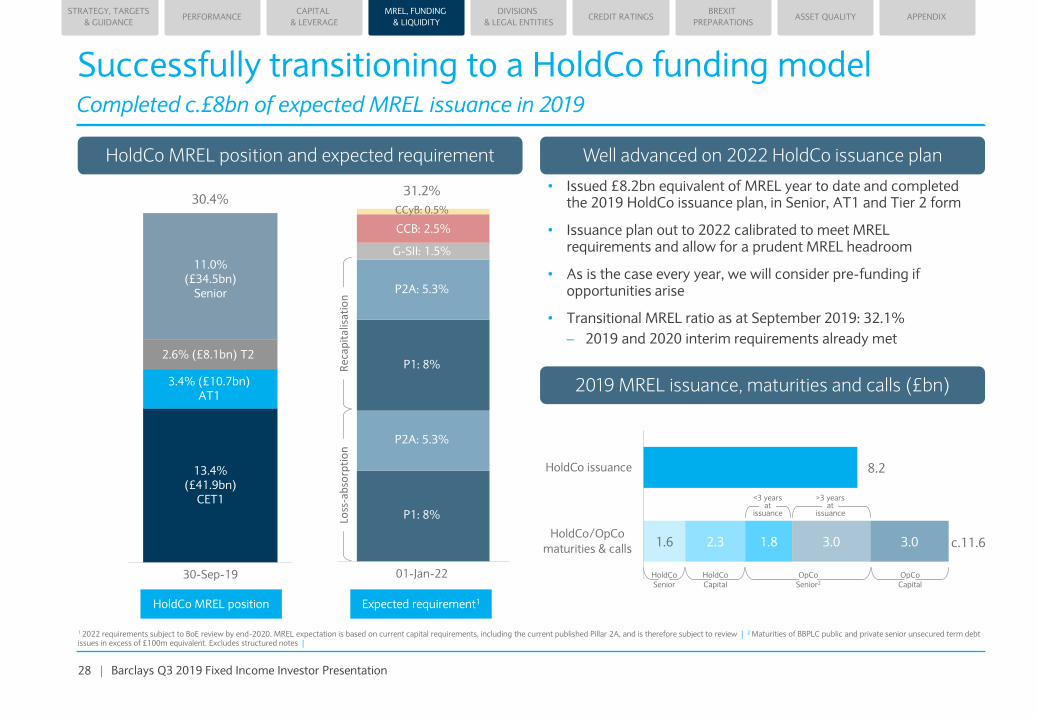
• Issued £8.2bn equivalent of MREL year to date and completed the 2019 HoldCo issuance plan, in Senior, AT1 and Tier 2 form
• Issuance plan out to 2022 calibrated to meet MREL requirements and allow for a prudent MREL headroom
• As is the case every year, we will consider pre-funding if opportunities arise
• Transitional MREL ratio as at September 2019: 32.1%
– 2019 and 2020 interim requirements already met
Successfully transitioning to a HoldCo funding modelCompleted c.£8bn of expected MREL issuance in 2019
1 2022 requirements subject to BoE review by end-2020. MREL expectation is based on current capital requirements, including the current published Pillar 2A, and is therefore subject to review | 2 Maturities of BBPLC public and private senior unsecured term debt issues in excess of £100m equivalent. Excludes structured notes |
HoldCo MREL position Expected requirement1
Recapitalisation
Loss-absorption
31.2%
P2A: 5.3%
P1: 8%
P1: 8%
P2A: 5.3%
CCB: 2.5%
G-SII: 1.5%
CCyB: 0.5%
30-Sep-19 01-Jan-22
30.4%
13.4% (£41.9bn)
CET1
3.4% (£10.7bn) AT1
2.6% (£8.1bn) T2
11.0%(£34.5bn)
Senior
MREL, FUNDING
& LIQUIDITY
HoldCo MREL position and expected requirement Well advanced on 2022 HoldCo issuance plan
2019 MREL issuance, maturities and calls (£bn)
8.2
1.6 2.3 1.8 3.0 3.0
HoldCo issuance
HoldCo/OpCo
maturities & calls
<3 yearsat
issuance
>3 yearsat
issuance
HoldCoSenior
HoldCoCapital
OpCoSenior2
OpCoCapital
c.11.6
28

| Barclays Q3 2019 Fixed Income Investor Presentation
BASSET QUALITY APPENDIX
MREL, FUNDING
& LIQUIDITY
CAPITAL
& LEVERAGE
BREXIT
PREPARATIONS
DIVISIONS
& LEGAL ENTITIES
STRATEGY, TARGETS
& GUIDANCE PERFORMANCE CREDIT RATINGS
5.4
1.1 2.5 1.9
3.5
1.8
1.7
2.9 1.2
6.2
9.3 6.1
10.2 3.5
13.4 12.1
11.5 12.2
8.2
As at
2015
2016 2017 2018 2019
YTD
USD
EUR
GBP
JPY
AUD
SGD
Other
Continued progress in HoldCo issuance
1 Annual issuance balances based on FX rate at end of respective periods for debt accounted instruments and historical transaction rates for equity accounted instruments | 2 FX rates as at respective period ends | 3 Excludes private placements | Note: Charts may not sum due to rounding |
Currency split of HoldCo issuance by period2
Tier 2AT1 Senior unsecured
May: GBP 600m Senior
June: AUD 800m Senior
May: USD 2bn Senior
June: USD 1.5bn Tier 2
April: USD 750m Senior tap
March: USD 2bn AT1
June: GBP 1bn AT1
201739% 45%
15%
1%
2018
13%61%
12%
9%
3%2%
2016
1%
11%
21%
66%
1%
21%2019YTD
60%
6%
32%
2%
MREL, FUNDING
& LIQUIDITY
September: GBP 1bn AT1
HoldCo issuance by year1 (£bn)
Diversified currency of HoldCo issued instruments
2019 YTD HoldCo issuance by currency3
29

| Barclays Q3 2019 Fixed Income Investor Presentation
BASSET QUALITY APPENDIX
MREL, FUNDING
& LIQUIDITY
CAPITAL
& LEVERAGE
BREXIT
PREPARATIONS
DIVISIONS
& LEGAL ENTITIES
STRATEGY, TARGETS
& GUIDANCE PERFORMANCE CREDIT RATINGS
0.8
2.1
7.9
2019 2020 2021 2022 2023+
66%
15%
20%
Balanced HoldCo funding profile by debt class and tenor
1 Prepared on nominal basis which will not reconcile with regulatory or accounting bases due to adjustments | Note: Charts may not sum due to rounding |
2.7
1.1
4.3
2019 2020 2021 2022 2023+
1.6 1.2
4.7
0.9
13.6
5.9
8.4
2019 2020 2021 2022 2023+
By product£55bn
SeniorAT1 Tier 2
First call date By next call date as applicableBy contractual maturity as applicable
MREL, FUNDING
& LIQUIDITY
Barclays PLC
BPLC AT1 capital as at 30 September 20191
BPLC Tier 2 capitalas at 30 September 20191
BPLC Senior unsecured debt as at 30 September 20191
30

| Barclays Q3 2019 Fixed Income Investor Presentation
BASSET QUALITY APPENDIX
MREL, FUNDING
& LIQUIDITY
CAPITAL
& LEVERAGE
BREXIT
PREPARATIONS
DIVISIONS
& LEGAL ENTITIES
STRATEGY, TARGETS
& GUIDANCE PERFORMANCE CREDIT RATINGS
Liquiditypool1 (£bn)
131%
154%169%
156% 151%
31-Dec-16 31-Dec-17 31-Dec-18 30-Jun-19 30-Sep-19
165 220 238
Minimum requirement:
100%
227 226
High quality liquidity positionConservatively positioned liquidity pool, LDR and lower reliance on short-term wholesale funding
1 Liquidity pool as per the Barclays Group’s Liquidity Risk Appetite (LRA) | 2 Loan: deposit ratio is calculated as loans and advances at amortised cost divided by deposits at amortised cost. Additionally, 1-Jan-18, 31-Dec-18, 30-Jun-19 and 30-Sep-19 reflect the impact of IFRS 9 | 3 At amortised cost |
348 317 326 339 345391 380 395 414 421
31-Dec-16 1-Jan-18 31-Dec-18 30-Jun-19 30-Sep-19
83% 83% 83% 82% 82%
Liquidity Coverage Ratio (LCR)
• Liquidity pool was £226bn at the quarter end, down £12bn QoQ
• LCR remained well above the 100% regulatory requirements at 151%, equivalent to a surplus of £77bn
• Quality of the liquidity pool remains high, with the majority held in cash and deposits with central banks, and highly rated government bonds
• Liquidity pool continues to be conservatively positioned to meet the changing geopolitical and market environment, using cost efficient sources of funding
• NSFR continues to exceed expected future minimum requirements
Dec 13:44%
<1month 1-3 months 3-6 months 6-12 months
1-2 years 2-5 years >5 years
• Lower reliance on <1 year wholesale funding with the ratio improving to 32% of total wholesale funding as at June 2019 from 44% as at December 2013
Jun 19:32%
LDRDeposits3 (£bn)L&A3 (£bn)
MREL, FUNDING
& LIQUIDITY
Highly liquid, comfortably exceeding minimum requirement Conservative loan: deposit ratio2
Lower reliance on <1 year wholesale funding
• Loan: deposit ratio of 82% as at 30 September 2019, stable QoQ as loans and advances increased commensurately with deposits during the quarter
31

| Barclays Q3 2019 Fixed Income Investor Presentation
BASSET QUALITY APPENDIX
MREL, FUNDING
& LIQUIDITY
CAPITAL
& LEVERAGE
BREXIT
PREPARATIONS
DIVISIONS
& LEGAL ENTITIES
STRATEGY, TARGETS
& GUIDANCE PERFORMANCE CREDIT RATINGS
MREL, FUNDING
& LIQUIDITY
Illu
stra
tive
H
old
Co
loss
Illustrative UK approach to resolution1
1 The illustration on this slide is subject to and should be read in conjunction with applicable regulation and supporting guidance from time to time published by the regulatory authorities (see the Important Notice for further details). The implementation of an actual resolution exercise may operate differently and/or have differing consequences to those described in the above illustration. This example based on Barclays expectations of the creditor hierarchy in a possible resolution scenario to demonstrate so-called “single-point-of-entry” in the UK in a situation where a HoldCo has more than one subsidiary, based on the assumptions that follow. This illustration assumes that losses occur at the OpCo, rather than the HoldCo, and that no additional incremental losses arise at the HoldCo whether due to losses occurring or stability actions taken elsewhere in the Group or arising directly at the HoldCo for additional Group recapitalisation. Each layer absorbs losses to the extent of its capacity, following which any recapitalisation of the entity requires write-down/conversion of more senior layers in accordance with the creditor hierarchy. In a situation where all losses can be absorbed within equity, existing shareholders would be diluted but not wiped out, and more senior layers of the hierarchy would be written down to recapitalise the failing firm | 2 The illustration on this slide assumes that the point of non-viability trigger for internal and external OpCo instruments of the same ranking is equivalent, whether via statutory powers or by regulatory direction, such that the "pari passu" principle is respected in resolution |
1
2
3
4
5
LO
SS
AB
SO
RB
TIO
N
HoldCo LiabilitiesOpCo Liabilities HoldCo Investments in OpCo
LO
SS
AB
SO
RB
TIO
N
Illu
stra
tive
Op
Co
loss
Equity
Additional Tier 1
Tier 2
Senior Unsecured
Equity investment
AT1 investment
Tier 2 investment
“Tier 3” investment
Equity
Inter-company “Tier 3”
Senior Unsecured
ExternalTier 2
Intercompany Tier 2
ExternalTier 1
Intercompany AT1
Equity
Intercompany “Tier 3”
Senior Unsecured
Intercompany AT1
Intercompany Tier 2
OpCo 2In resolution
OpCo 1Not in resolution
Loss allocation
OpCo waterfall Intercompany investments HoldCo waterfall
ST
EP
2
• Total OpCo losses which exceed its equity capacity are allocated to OpCo investors in accordance with the OpCo creditor hierarchy
• Each class of instrument should rank pari passu irrespective of holder, therefore PD/LGD of external and internal instruments of the same class are expected to be the same2
ST
EP
1
• Losses are transmitted to HoldCo through write-down of its intercompany investments in line with the OpCo’s creditor hierarchy
• The HoldCo’s investments are impaired and/or written down to reflect the losses on each of the intercompany investments
ST
EP
3
• The loss on HoldCo’s investment from step 2 is allocated to the HoldCo’s investors in accordance with the HoldCo creditor hierarchy
• The HoldCo creditor hierarchy remains intact and demonstrates that the LGD for an OpCo instrument class could be different to that of the same class at the HoldCo where the diversification of a banking group is retained
32

BASSET QUALITY APPENDIX
MREL, FUNDING
& LIQUIDITY
CAPITAL
& LEVERAGE
BREXIT
PREPARATIONS
DIVISIONS
& LEGAL ENTITIES
STRATEGY, TARGETS
& GUIDANCE PERFORMANCE CREDIT RATINGS
Divisions and Legal Entities
DIVISIONS
& LEGAL ENTITIES

| Barclays Q3 2019 Fixed Income Investor Presentation
BASSET QUALITY APPENDIX
MREL, FUNDING
& LIQUIDITY
CAPITAL
& LEVERAGE
BREXIT
PREPARATIONS
DIVISIONS
& LEGAL ENTITIES
STRATEGY, TARGETS
& GUIDANCE PERFORMANCE CREDIT RATINGS
DIVISIONS
& LEGAL ENTITIES
Legal entity structure of the Group since April 2018
1 The Head Office division materially remains in Barclays Bank PLC and incorporates re-integrated Non-Core assets and businesses. The residual holding in BAGL (full regulatory deconsolidation effective 30 June 2018) is held in Barclays Principal Investments Limited as a direct subsidiary of BPLC |
Market leading UK retail bank, combining digital innovation and scale, with 24 million customers
Barclays UK
Barclays Bank UK PLC
Total assets: £260bn as at H119
Le
ga
l e
nti
tie
s
Multiple entities
Barclays Bank
IrelandUS IHC
Barclays International and Head Office1
Diversified bank across Cards & Payments, Corporate & Investment Banking and Private Banking
Div
isio
ns
Consumer, Cards & Payments
Corporate & Investment Bank
Head Office
Personal Banking
Barclaycard Consumer UK
Business BankingBarclays Execution Services
(BX)
Barclays Execution
Services Limited
Strategically integrated service company, providing scale and
efficiency, enabling growth and delivering world-class shared services to Barclays UK and
Barclays International
Barclays Bank PLC(and subsidiaries)
Total assets: £969bn as at H119
Barclays PLC
34

| Barclays Q3 2019 Fixed Income Investor Presentation
BASSET QUALITY APPENDIX
MREL, FUNDING
& LIQUIDITY
CAPITAL
& LEVERAGE
BREXIT
PREPARATIONS
DIVISIONS
& LEGAL ENTITIES
STRATEGY, TARGETS
& GUIDANCE PERFORMANCE CREDIT RATINGS
63%
8%4%
11%
4%
9%
2% Barclays Bank PLC 3Barclays Bank UK PLC 3
Diversified funding sources across all legal entities1
Majority of funding within legal entities through deposits
1 The funding sources presented include external deposits at amortised cost, wholesale funding including public benchmark and privately placed senior unsecured notes, certificates of deposits, commercial paper, covered bonds, asset backed securities, subordinated debt, participation in Bank of England’s Term Funding Scheme, Additional Tier 1 capital instruments and shareholders’ equity | 2 Excludes derivative financial instruments, repurchase agreements and other similar secured borrowing, trading portfolio liabilities, cash collateral and settlement balances and other liabilities | 3 Barclays Bank PLC and Barclays Bank UK PLC funding profile includes subsidiaries | 4 OpCo unsecured short-term funding consists of certificates of deposit and commercial paper |5 OpCo secured funding includes asset backed commercial paper, covered bonds and asset backed securities | 6 HoldCo MREL downstreamed to BBUKPLC, BBPLC, and other subsidiaries, including Barclays Execution Services Limited and Barclays Principal Investments Limited | Note: Charts may not sum due to rounding |
Barclays PLC
H119:£659bn2
20180%
6%
1%
4%
4%
4%
H119:£250bn2 54%
11%
8%
18%
1%
8%0%
H119:£402bn2
OpCo unsecured short-term funding4
OpCo unsecured term funding
Deposits
OpCo secured funding5
HoldCo issued instruments (MREL)6
Bank of England’s Term Funding Scheme
Shareholders’ equity
Key:
414
55
28
71
23
56
13
15 2
10
11
11
215
43
26
71
13
331
DIVISIONS
& LEGAL ENTITIES
Slide as presented at the H1 2019 results announcement on 1 August 201935

| Barclays Q3 2019 Fixed Income Investor Presentation
BASSET QUALITY APPENDIX
MREL, FUNDING
& LIQUIDITY
CAPITAL
& LEVERAGE
BREXIT
PREPARATIONS
DIVISIONS
& LEGAL ENTITIES
STRATEGY, TARGETS
& GUIDANCE PERFORMANCE CREDIT RATINGS
Deposit and wholesale funding sources of Barclays Bank UK PLC and Barclays Bank PLC
1 Excludes participation in other central bank facilities | 2 BBPLC deposits include deposits from other Barclays entities |
H119 FY18 H119 FY18
External funding sources1
(£bn)
Deposit funding2
Personal Banking 156
201
154
197
Corporate and Investment Bank 145
215
136
199
Business Banking 45 43 Consumer, Cards & Payments 67 61
Operational funding (externally
issued)
Certificates of depositsand commercial paper
2
2
1
1
Certificates of deposit, commercial paper and asset-backed commercial paper
33
61
29
58
Senior unsecured debt ≤3 year - - Senior unsecured debt ≤3 year 28 29
Term fundingSecured funding (e.g. covered bonds and asset-backed securities)
10 10 10 10
Secured funding (e.g. asset-backed securities)
6
48
6
46Residual outstanding BBPLC externally issued debt capital and term senior unsecured debt (including structured notes)
42 40
OtherBank of England’s Term Funding Scheme
11 11 11 11Bank of England’s Term Funding Scheme
1 1 1 1
Internal MREL(£bn)
Internal funding of equity, debt capital and term senior unsecured debt downstreamed from Barclays PLC (allocation to entities broadly determined by RWA size)
11 11 10 10
Internal funding of equity, debt capital and term senior unsecured debt downstreamed from Barclays PLC (allocation to entities broadly determined by RWA size)
33 33 28 28
Barclays Bank UK PLC Barclays Bank PLC (and subsidiaries)
Barclays PLC
DIVISIONS
& LEGAL ENTITIES
Slide as presented at the H1 2019 results announcement on 1 August 201936
| Barclays Q3 2019 Fixed Income Investor Presentation
BASSET QUALITY APPENDIX
MREL, FUNDING
& LIQUIDITY
CAPITAL
& LEVERAGE
BREXIT
PREPARATIONS
DIVISIONS
& LEGAL ENTITIES
STRATEGY, TARGETS
& GUIDANCE PERFORMANCE CREDIT RATINGS
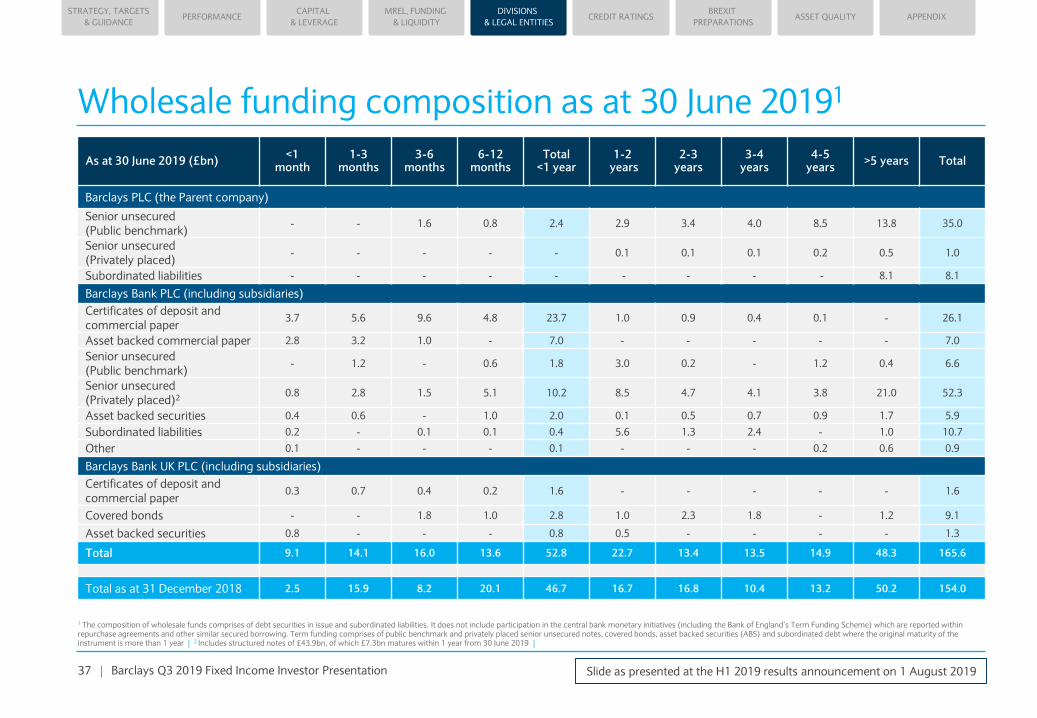
Wholesale funding composition as at 30 June 20191
1 The composition of wholesale funds comprises of debt securities in issue and subordinated liabilities. It does not include participation in the central bank monetary initiatives (including the Bank of England’s Term Funding Scheme) which are reported within repurchase agreements and other similar secured borrowing. Term funding comprises of public benchmark and privately placed senior unsecured notes, covered bonds, asset backed securities (ABS) and subordinated debt where the original maturity of the instrument is more than 1 year | 2 Includes structured notes of £43.9bn, of which £7.3bn matures within 1 year from 30 June 2019 |
As at 30 June 2019 (£bn)<1
month1-3
months3-6
months6-12
monthsTotal
<1 year1-2
years2-3
years3-4
years4-5
years>5 years Total
Barclays PLC (the Parent company)
Senior unsecured(Public benchmark)
- - 1.6 0.8 2.4 2.9 3.4 4.0 8.5 13.8 35.0
Senior unsecured(Privately placed)
- - - - - 0.1 0.1 0.1 0.2 0.5 1.0
Subordinated liabilities - - - - - - - - - 8.1 8.1
Barclays Bank PLC (including subsidiaries)
Certificates of deposit and commercial paper
3.7 5.6 9.6 4.8 23.7 1.0 0.9 0.4 0.1 - 26.1
Asset backed commercial paper 2.8 3.2 1.0 - 7.0 - - - - - 7.0
Senior unsecured(Public benchmark)
- 1.2 - 0.6 1.8 3.0 0.2 - 1.2 0.4 6.6
Senior unsecured(Privately placed)2
0.8 2.8 1.5 5.1 10.2 8.5 4.7 4.1 3.8 21.0 52.3
Asset backed securities 0.4 0.6 - 1.0 2.0 0.1 0.5 0.7 0.9 1.7 5.9
Subordinated liabilities 0.2 - 0.1 0.1 0.4 5.6 1.3 2.4 - 1.0 10.7
Other 0.1 - - - 0.1 - - - 0.2 0.6 0.9
Barclays Bank UK PLC (including subsidiaries)
Certificates of deposit and commercial paper
0.3 0.7 0.4 0.2 1.6 - - - - - 1.6
Covered bonds - - 1.8 1.0 2.8 1.0 2.3 1.8 - 1.2 9.1
Asset backed securities 0.8 - - - 0.8 0.5 - - - - 1.3
Total 9.1 14.1 16.0 13.6 52.8 22.7 13.4 13.5 14.9 48.3 165.6
Total as at 31 December 2018 2.5 15.9 8.2 20.1 46.7 16.7 16.8 10.4 13.2 50.2 154.0
DIVISIONS
& LEGAL ENTITIES
Slide as presented at the H1 2019 results announcement on 1 August 201937

BASSET QUALITY APPENDIX
MREL, FUNDING
& LIQUIDITY
CAPITAL
& LEVERAGE
BREXIT
PREPARATIONS
DIVISIONS
& LEGAL ENTITIES
STRATEGY, TARGETS
& GUIDANCE PERFORMANCE CREDIT RATINGS
Credit Ratings
CREDIT RATINGS

| Barclays Q3 2019 Fixed Income Investor Presentation
BASSET QUALITY APPENDIX
MREL, FUNDING
& LIQUIDITY
CAPITAL
& LEVERAGE
BREXIT
PREPARATIONS
DIVISIONS
& LEGAL ENTITIES
STRATEGY, TARGETS
& GUIDANCE PERFORMANCE CREDIT RATINGS
Current Senior Long andShort Term ratings
Standard & Poor’s Fitch Moody’s
Barclays PLC Neg
Barclays Bank PLC (BBPLC)
Neg
Barclays Bank UK PLC(BBUKPLC)
Ratings remain a key priorityFocus on strategy execution and achieving performance targets to improve ratings
1 Deposit rating |
We solicit ratings from S&P, Fitch and Moody’s for the HoldCo and both its OpCos that sit immediately beneath it
• S&P affirmed all ratings for Barclays PLC, BBPLC and BBUKPLC in June 2019. They rate BBUKPLC and BBPLC in line with the Group’s credit profile of A/A-1, as these subsidiaries are designated “core” status relative to the Group
• Fitch affirmed all ratings for Barclays PLC, BBPLC and BBUKPLC in June 2019. They placed the outlooks of all entities on Rating Watch Negative (RWN) in March 2019, alongside UK peers to reflect their expectation that they would revise the outlooks to negative under a disruptive no deal Brexit scenario
• Moody’s ratings outlooks of Barclays PLC and BBPLC were revised from stable to positive in May 2019
A2Positive
P-1
A11
Stable
P-1
Baa3Positive
P-3
Counterparty risk assessment
A2/P-1 (cr)
Counterparty risk assessment
Aa2/P-1 (cr)
ARWN
F1
A+RWN
F1
A+RWN
F1
Derivative counterparty rating
A+/Stable (dcr)
Derivative counterparty rating
A+/Stable (dcr)
AStable
A-1
AStable
A-1
BBBStable
A-2
Resolution counterparty rating
A+/A-1
CREDIT RATINGS
39
| Barclays Q3 2019 Fixed Income Investor Presentation
BASSET QUALITY APPENDIX
MREL, FUNDING
& LIQUIDITY
CAPITAL
& LEVERAGE
BREXIT
PREPARATIONS
DIVISIONS
& LEGAL ENTITIES
STRATEGY, TARGETS
& GUIDANCE PERFORMANCE CREDIT RATINGSCREDIT RATINGS
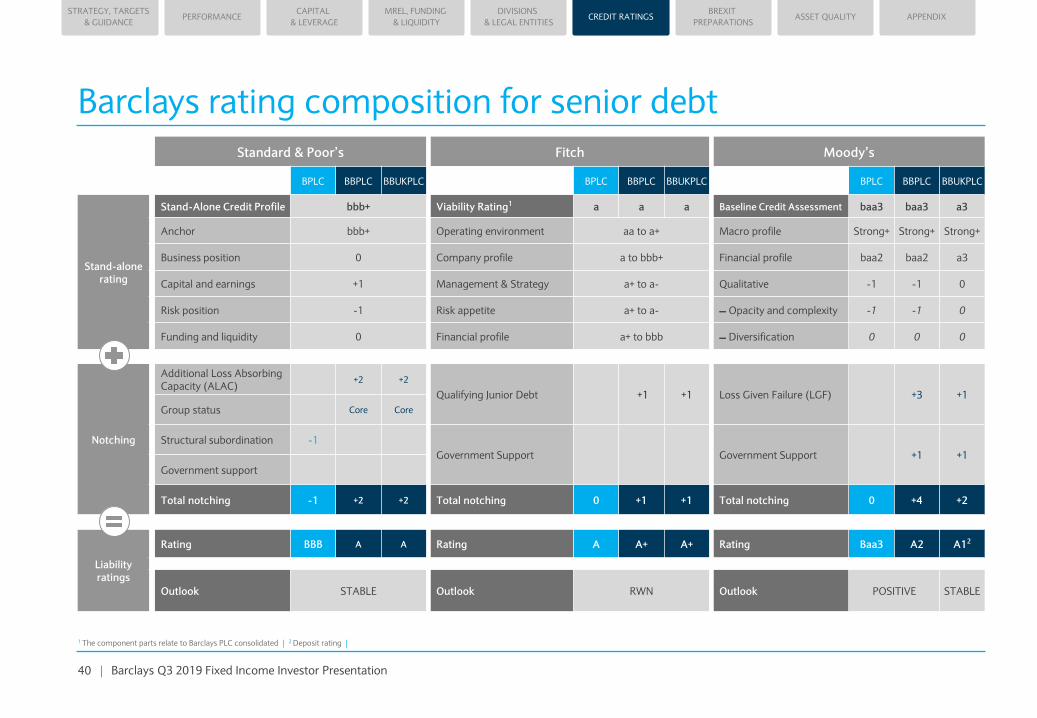
Barclays rating composition for senior debt
1 The component parts relate to Barclays PLC consolidated | 2 Deposit rating |
Standard & Poor’s Fitch Moody’s
BPLC BBPLC BBUKPLC BPLC BBPLC BBUKPLC BPLC BBPLC BBUKPLC
Stand-alonerating
Stand-Alone Credit Profile bbb+ Viability Rating1 a a a Baseline Credit Assessment baa3 baa3 a3
Anchor bbb+ Operating environment aa to a+ Macro profile Strong+ Strong+ Strong+
Business position 0 Company profile a to bbb+ Financial profile baa2 baa2 a3
Capital and earnings +1 Management & Strategy a+ to a- Qualitative -1 -1 0
Risk position -1 Risk appetite a+ to a- – Opacity and complexity -1 -1 0
Funding and liquidity 0 Financial profile a+ to bbb – Diversification 0 0 0
Notching
Additional Loss Absorbing Capacity (ALAC)
+2 +2
Qualifying Junior Debt +1 +1 Loss Given Failure (LGF) +3 +1
Group status Core Core
Structural subordination -1
Government Support Government Support +1 +1
Government support
Total notching -1 +2 +2 Total notching 0 +1 +1 Total notching 0 +4 +2
Liabilityratings
Rating BBB A A Rating A A+ A+ Rating Baa3 A2 A12
Outlook STABLE Outlook RWN Outlook POSITIVE STABLE
40

| Barclays Q3 2019 Fixed Income Investor Presentation
BASSET QUALITY APPENDIX
MREL, FUNDING
& LIQUIDITY
CAPITAL
& LEVERAGE
BREXIT
PREPARATIONS
DIVISIONS
& LEGAL ENTITIES
STRATEGY, TARGETS
& GUIDANCE PERFORMANCE CREDIT RATINGS
Barclays rating composition for subordinated debt
CREDIT RATINGS
Standard & Poor’s Fitch Moody’s
Stand-alone rating
Stand-Alone Credit Profile bbb+
Viability Rating a a
Baseline Credit
Assessmentbaa3 baa3
Notching
BPLC BBPLC BPLC BBPLC BPLC BBPLC
T2 AT1T2
CocoLT2 UT2 T1 T2 AT1
T2 Coco
LT2 UT2 T1 T2 AT1T2
CocoLT2 UT2 T1
(cum)
Contractual subordination
-1 -1 -1 -1 -1 -1
Loss severity
-1 -2 -2 -1 -1 -2
LGF -1 -1 -1 -1
Bail-in feature
-1 -1 -1 -1 -1 -1Coupon skip risk
(cum)-1 -1
Bufferto trigger
-1 -1Coupon skip risk
(non-cum)
Coupon skip risk
-2 -1 -2Non-
performancerisk
-3 -2 -2/-3
Model based outcome with
legacy T1 rating cap
-3Structural
subordination-1 -1
Totalnotching
-3 -6 -3 -2 -3 -4Total
notching-1 -5 -2 -1 -3 -4/-5
Totalnotching
-1 -3 -1 -2 -2
Liability ratings
Rating BB+ B+ BB+ BBB- BB+ BB Rating A- BB+ BBB+ A- BBBBBB-/BB+
Rating Ba1 Ba3 n/a Ba1 Ba2 Ba2
41

BASSET QUALITY APPENDIX
MREL, FUNDING
& LIQUIDITY
CAPITAL
& LEVERAGE
BREXIT
PREPARATIONS
DIVISIONS
& LEGAL ENTITIES
STRATEGY, TARGETS
& GUIDANCE PERFORMANCE CREDIT RATINGS
Brexit Preparations
BREXIT
PREPARATIONS
| Barclays Q3 2019 Fixed Income Investor Presentation
BASSET QUALITY APPENDIX
MREL, FUNDING
& LIQUIDITY
CAPITAL
& LEVERAGE
BREXIT
PREPARATIONS
DIVISIONS
& LEGAL ENTITIES
STRATEGY, TARGETS
& GUIDANCE PERFORMANCE CREDIT RATINGS
18%
8%
6%
15%9%
12%
11%
20%
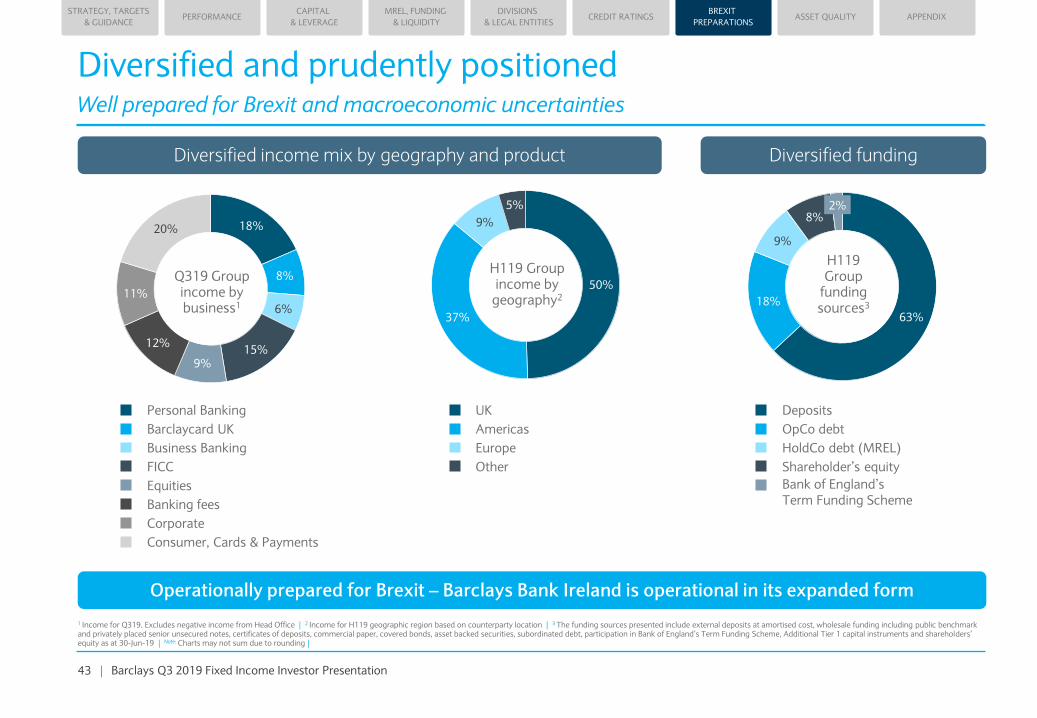
Diversified and prudently positionedWell prepared for Brexit and macroeconomic uncertainties
1 Income for Q319. Excludes negative income from Head Office | 2 Income for H119 geographic region based on counterparty location | 3 The funding sources presented include external deposits at amortised cost, wholesale funding including public benchmark and privately placed senior unsecured notes, certificates of deposits, commercial paper, covered bonds, asset backed securities, subordinated debt, participation in Bank of England’s Term Funding Scheme, Additional Tier 1 capital instruments and shareholders’ equity as at 30-Jun-19 | Note: Charts may not sum due to rounding |
H119 Groupincome by
geography2
H119Group
fundingsources3
Q319 Group income by business1
63%
18%
9%
8%2%
50%
37%
9%
5%
UK
Americas
Europe
Other
Deposits
OpCo debt
HoldCo debt (MREL)
Shareholder’s equity
Bank of England’s Term Funding Scheme
Diversified fundingDiversified income mix by geography and product
Personal Banking
Barclaycard UK
Business Banking
FICC
Equities
Banking fees
Corporate
Consumer, Cards & Payments
Operationally prepared for Brexit – Barclays Bank Ireland is operational in its expanded form
43
BREXIT
PREPARATIONS

| Barclays Q3 2019 Fixed Income Investor Presentation
BASSET QUALITY APPENDIX
MREL, FUNDING
& LIQUIDITY
CAPITAL
& LEVERAGE
BREXIT
PREPARATIONS
DIVISIONS
& LEGAL ENTITIES
STRATEGY, TARGETS
& GUIDANCE PERFORMANCE CREDIT RATINGS
Preparation for continuity of business in the event of BrexitPlans have been implemented to support activity with European clients through expanded Barclays Bank Ireland
1 The activity also incorporates a legacy Italian mortgage portfolio | 2 Refer to the disclaimer at the end of this document for the basis of preparation and the key assumptions related to the illustrative financial information contained herein |
Indicative BBI as at 31 December 20182
Total external assets £126bn
Total assets Including internal transactions with Group entities
£161bn
Derivatives/total assets and liabilitiesIncluding internal derivative transactions
53%
Funded balance sheetExcluding trading book gross-ups
£32bn
Shareholders’ equity £4bn
PBTIf transfer occurred on 1 January 2018
£0.5bn
• Barclays Bank Ireland (BBI) is now fully operational and significant activity with European clients has now been migrated
• BBI obtained all regulatory authorisations and licences for its expanded activity in 2018 and is regulated by the Single Supervisory Mechanism of the ECB
• Operates a branch network across Europe; migration of all European branches has now been completed
• Rated in line with BBPLC at A+/RWN/F1 by Fitch and A/Stable/A-1 by S&P
• Expanded activity consists of Corporate, Investment and Private Banking activity and Barclaycard business in Germany1
• Diversified, well balanced funding sources and strong liquidity ratios. MREL and capital provided from within the Group
• Anticipate CET1 and CRR leverage ratios to be broadly in line with those of BBPLC and the Group
BREXIT
PREPARATIONS
Slide as presented at the H1 2019 results announcement on 1 August 201944

BASSET QUALITY APPENDIX
MREL, FUNDING
& LIQUIDITY
CAPITAL
& LEVERAGE
BREXIT
PREPARATIONS
DIVISIONS
& LEGAL ENTITIES
STRATEGY, TARGETS
& GUIDANCE PERFORMANCE CREDIT RATINGS
Asset Quality
ASSET QUALITY

| Barclays Q3 2019 Fixed Income Investor Presentation
BASSET QUALITY APPENDIX
MREL, FUNDING
& LIQUIDITY
CAPITAL
& LEVERAGE
BREXIT
PREPARATIONS
DIVISIONS
& LEGAL ENTITIES
STRATEGY, TARGETS
& GUIDANCE PERFORMANCE CREDIT RATINGS
2.7% 2.7% 2.6% 2.4% 2.6%
1.4% 1.4% 1.4% 1.3% 1.3%
Prudently managing credit risk in both the UK and USConservatively positioned in the face of Brexit and the consumer credit cycle in the US
• Reduced delinquency rates in UK unsecured lending portfolios
• Taken prudent risk actions such as reducing limits and closing dormant accounts
• 0% BTs follow prudent lending criteria, with most of the balances having a duration of <24 months
UKUnsecured
£15.3bn £15.0bn£15.3bn £15.1bn £14.9bn
1.8% 1.8% 1.9% 1.8% 1.7%
0.9% 0.9% 0.9% 0.9% 0.8%
Q418 Q219
• Diversified portfolio across segments with good risk/return balance
• Growing book in prime partnership portfolios, within risk appetite
• Delinquency trends have improved, with lower arrears rates YoY
USCards
$25.5bn $26.9bn $26.2bn $26.7bn
• Focus on growing mortgage book within risk appetite
• c.50% average LTV of mortgage book stock
• Buy-to-Let mortgages represent only 13% of the book
UKSecured
£134.4bn
Q318 Q119
£136.5bn
Q319
64.4% 65.4% 67.1%
49.6% 48.9% 50.1%
Average LTV on flow Average LTV on stock Gross L&A
30 day arrears 90 day arrears Net receivables
30 day arrears 90 day arrears Net receivables
UK mortgagebalancegrowth
UK cardsarrears
ratesreduced
Underlying US Card balances
increased with improved
arrears rates
$26.5bn
£138.3bn
Q418 Q219Q318 Q119 Q319
H118 FY18 H119
46
ASSET QUALITY

BASSET QUALITY APPENDIX
MREL, FUNDING
& LIQUIDITY
CAPITAL
& LEVERAGE
BREXIT
PREPARATIONS
DIVISIONS
& LEGAL ENTITIES
STRATEGY, TARGETS
& GUIDANCE PERFORMANCE CREDIT RATINGS
Appendix
APPENDIX
| Barclays Q3 2019 Fixed Income Investor Presentation
BASSET QUALITY APPENDIX
MREL, FUNDING
& LIQUIDITY
CAPITAL
& LEVERAGE
BREXIT
PREPARATIONS
DIVISIONS
& LEGAL ENTITIES
STRATEGY, TARGETS
& GUIDANCE PERFORMANCE CREDIT RATINGS
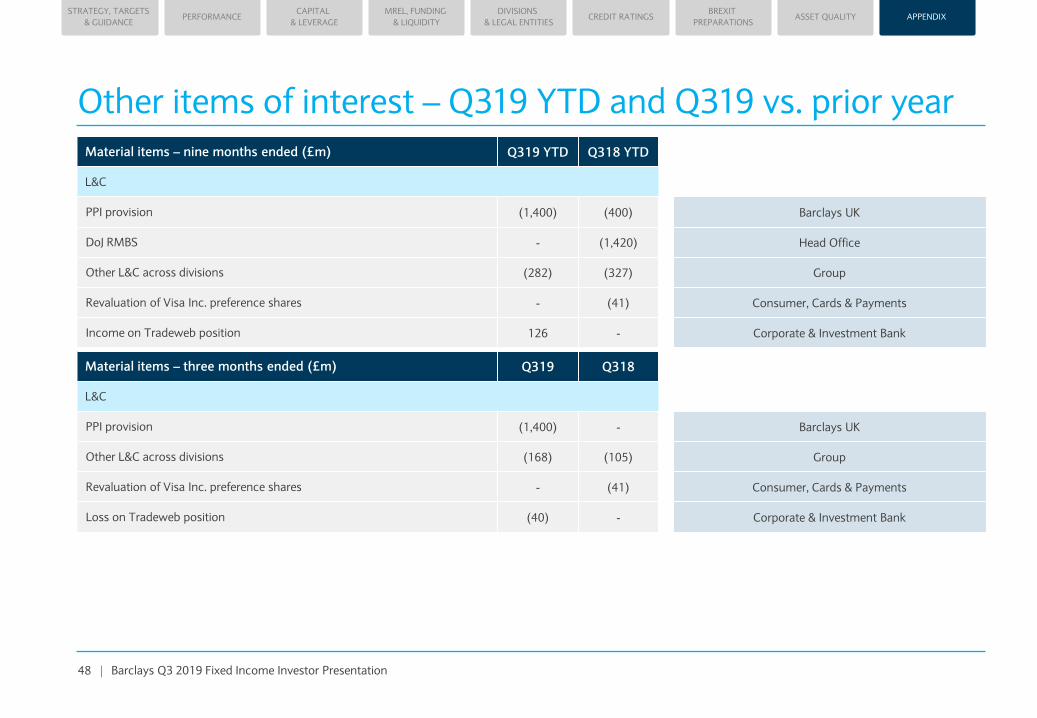
Other items of interest – Q319 YTD and Q319 vs. prior year
Material items – three months ended (£m) Q319 Q318
L&C
PPI provision (1,400) - Barclays UK
Other L&C across divisions (168) (105) Group
Revaluation of Visa Inc. preference shares - (41) Consumer, Cards & Payments
Loss on Tradeweb position (40) - Corporate & Investment Bank
Material items – nine months ended (£m) Q319 YTD Q318 YTD
L&C
PPI provision (1,400) (400) Barclays UK
DoJ RMBS - (1,420) Head Office
Other L&C across divisions (282) (327) Group
Revaluation of Visa Inc. preference shares - (41) Consumer, Cards & Payments
Income on Tradeweb position 126 - Corporate & Investment Bank
48
APPENDIX

| Barclays Q3 2019 Fixed Income Investor Presentation
BASSET QUALITY APPENDIX
MREL, FUNDING
& LIQUIDITY
CAPITAL
& LEVERAGE
BREXIT
PREPARATIONS
DIVISIONS
& LEGAL ENTITIES
STRATEGY, TARGETS
& GUIDANCE PERFORMANCE CREDIT RATINGS
Nine months ended (£m) Sep-19 Sep-18 % change
Income 16,331 16,063 2%
Impairment (1,389) (825) (68%)
– Operating costs (10,051) (10,003)
– Litigation and conduct (1,682) (2,147) 22%
Total operating expenses (11,733) (12,150) 3%
Other net income 51 32 59%
Profit before tax 3,260 3,120 4%
Tax charge1 (814) (836) 3%
Profit after tax 2,446 2,284 7%
NCI (38) (151) 75%
Other equity instrument holders (628) (522) (20%)
Attributable profit 1,780 1,611 10%
Performance measures
Basic earnings per share 10.4p 9.4p
RoTE 5.1% 4.9%
Cost: income ratio 72% 76%
LLR 53bps 33bps
Balance sheet (£bn)
RWAs 313.3 316.2
Q319 YTD Group
1 From 2019, due to an IAS 12 update, the tax relief on payments in relation to Additional Tier 1 instruments has been recognised in the tax charge of the income statement, whereas it was previously recorded in retained earnings. Comparatives have been restated. This change does not impact earnings per share or return on average tangible shareholders’ equity |
Excluding L&C – nine months ended (£m) Sep-19 Sep-18 % change
Profit before tax 4,942 5,267 (6%)
Attributable profit 3,391 3,685 (8%)
Performance measures
Basic earnings per share 19.7p 21.6p
RoTE 9.7% 11.1%
Cost: income ratio 62% 62%
49
APPENDIX

| Barclays Q3 2019 Fixed Income Investor Presentation
BASSET QUALITY APPENDIX
MREL, FUNDING
& LIQUIDITY
CAPITAL
& LEVERAGE
BREXIT
PREPARATIONS
DIVISIONS
& LEGAL ENTITIES
STRATEGY, TARGETS
& GUIDANCE PERFORMANCE CREDIT RATINGS
Three months ended (£m) Sep-19 Sep-18 % change
Income 5,541 5,129 8%
Impairment (461) (254) (81%)
– Operating costs (3,293) (3,329) 1%
– Litigation and conduct (1,568) (105)
Total operating expenses (4,861) (3,434) (42%)
Other net income 27 20 35%
Profit before tax 246 1,461 (83%)
Tax charge1 (269) (192) (40%)
Profit after tax (23) 1,269
NCI (4) (43) 91%
Other equity instrument holders (265) (176) (51%)
Attributable (loss)/profit (292) 1,050
Performance measures
Basic (loss)/earnings per share (1.7p) 6.1p
RoTE (2.4%) 9.4%
Cost: income ratio 88% 67%
LLR 52bps 30bps
Balance sheet (£bn)
RWAs 313.3 316.2
Q319 Group
1 From 2019, due to an IAS 12 update, the tax relief on payments in relation to Additional Tier 1 instruments has been recognised in the tax charge of the income statement, whereas it was previously recorded in retained earnings. Comparatives have been restated. This change does not impact earnings per share or return on average tangible shareholders’ equity |
Excluding L&C – three months ended (£m) Sep-19 Sep-18 % change
Profit before tax 1,814 1,566 16%
Attributable profit 1,233 1,135 9%
Performance measures
Basic earnings per share 7.2p 6.6p
RoTE 10.2% 10.2%
Cost: income ratio 59% 65%
50
APPENDIX
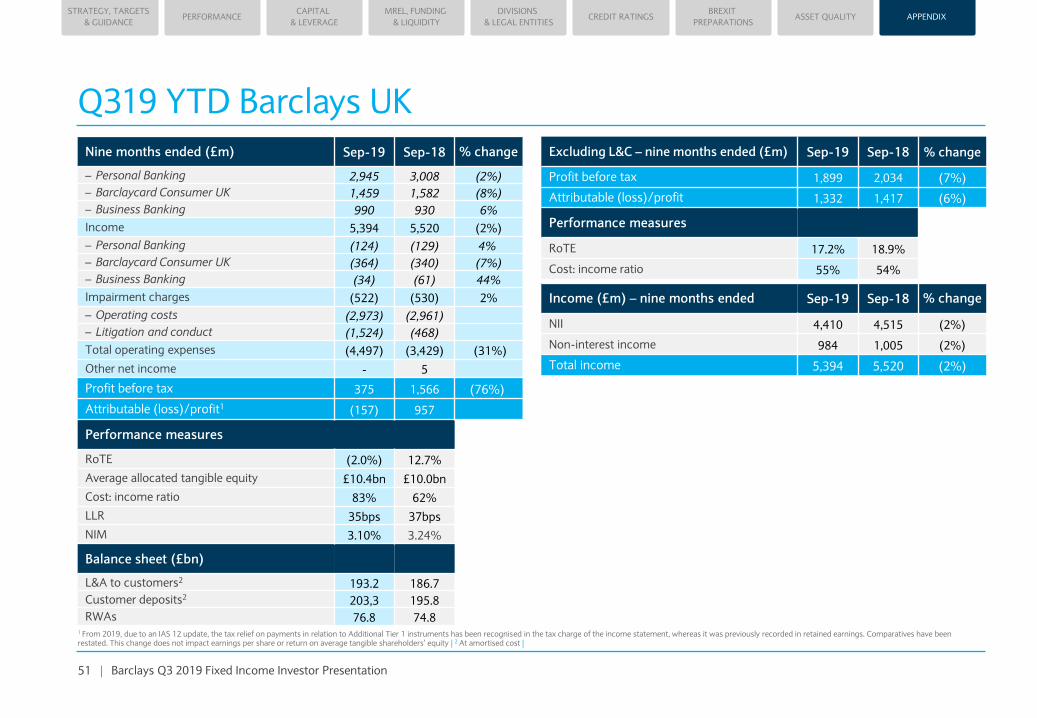
| Barclays Q3 2019 Fixed Income Investor Presentation
BASSET QUALITY APPENDIX
MREL, FUNDING
& LIQUIDITY
CAPITAL
& LEVERAGE
BREXIT
PREPARATIONS
DIVISIONS
& LEGAL ENTITIES
STRATEGY, TARGETS
& GUIDANCE PERFORMANCE CREDIT RATINGS
Q319 YTD Barclays UK
1 From 2019, due to an IAS 12 update, the tax relief on payments in relation to Additional Tier 1 instruments has been recognised in the tax charge of the income statement, whereas it was previously recorded in retained earnings. Comparatives have been restated. This change does not impact earnings per share or return on average tangible shareholders’ equity | 2 At amortised cost |
Nine months ended (£m) Sep-19 Sep-18 % change
– Personal Banking 2,945 3,008 (2%)
– Barclaycard Consumer UK 1,459 1,582 (8%)
– Business Banking 990 930 6%
Income 5,394 5,520 (2%)
– Personal Banking (124) (129) 4%
– Barclaycard Consumer UK (364) (340) (7%)
– Business Banking (34) (61) 44%
Impairment charges (522) (530) 2%
– Operating costs (2,973) (2,961)
– Litigation and conduct (1,524) (468)
Total operating expenses (4,497) (3,429) (31%)
Other net income - 5
Profit before tax 375 1,566 (76%)
Attributable (loss)/profit1 (157) 957
Performance measures
RoTE (2.0%) 12.7%
Average allocated tangible equity £10.4bn £10.0bn
Cost: income ratio 83% 62%
LLR 35bps 37bps
NIM 3.10% 3.24%
Balance sheet (£bn)
L&A to customers2 193.2 186.7
Customer deposits2 203,3 195.8
RWAs 76.8 74.8
Excluding L&C – nine months ended (£m) Sep-19 Sep-18 % change
Profit before tax 1,899 2,034 (7%)
Attributable (loss)/profit 1,332 1,417 (6%)
Performance measures
RoTE 17.2% 18.9%
Cost: income ratio 55% 54%
Income (£m) – nine months ended Sep-19 Sep-18 % change
NII 4,410 4,515 (2%)
Non-interest income 984 1,005 (2%)
Total income 5,394 5,520 (2%)
51
APPENDIX

| Barclays Q3 2019 Fixed Income Investor Presentation
BASSET QUALITY APPENDIX
MREL, FUNDING
& LIQUIDITY
CAPITAL
& LEVERAGE
BREXIT
PREPARATIONS
DIVISIONS
& LEGAL ENTITIES
STRATEGY, TARGETS
& GUIDANCE PERFORMANCE CREDIT RATINGS
Q319 Barclays UK
1 From 2019, due to an IAS 12 update, the tax relief on payments in relation to Additional Tier 1 instruments has been recognised in the tax charge of the income statement, whereas it was previously recorded in retained earnings. Comparatives have been restated. This change does not impact earnings per share or return on average tangible shareholders’ equity | 2 At amortised cost |
Three months ended (£m) Sep-19 Sep-18 % change
– Personal Banking 1,035 1,021 1%
– Barclaycard Consumer UK 472 551 (14%)
– Business Banking 339 324 5%
Income 1,846 1,896 (3%)
– Personal Banking (36) (8)
– Barclaycard Consumer UK (49) (88) 44%
– Business Banking (16) (19) 16%
Impairment charges (101) (115) 12%
– Operating costs (952) (988) 4%
– Litigation and conduct (1,480) (54)
Total operating expenses (2,432) (1,042)
Other net income - 1
(Loss)/profit before tax (687) 740
Attributable (loss)/profit1 (907) 510
Performance measures
RoTE (34.9%) 20.1%
Average allocated tangible equity £10.4bn £10.1bn
Cost: income ratio 132% 55%
LLR 20bps 24bps
NIM 3.10% 3.22%
Balance sheet (£bn)
L&A to customers2 193.2 186.7
Customer deposits2 203.3 195.8
RWAs 76.8 74.8
Excluding L&C – three months ended (£m) Sep-19 Sep-18 % change
Profit before tax 793 794
Attributable profit 550 558 (1%)
Performance measures
RoTE 21.2% 22.0%
Cost: income ratio 52% 52%
Income (£m) – three months ended Sep-19 Sep-18 % change
NII 1,503 1,529 (2%)
Non-interest income 343 367 (7%)
Total income 1,846 1,896 (3%)
52
APPENDIX

| Barclays Q3 2019 Fixed Income Investor Presentation
BASSET QUALITY APPENDIX
MREL, FUNDING
& LIQUIDITY
CAPITAL
& LEVERAGE
BREXIT
PREPARATIONS
DIVISIONS
& LEGAL ENTITIES
STRATEGY, TARGETS
& GUIDANCE PERFORMANCE CREDIT RATINGS
Q319 YTD Barclays International
1 From 2019, due to an IAS 12 update, the tax relief on payments in relation to Additional Tier 1 instruments has been recognised in the tax charge of the income statement, whereas it was previously recorded in reserves. Comparatives have been restated. Thischange does not impact earnings per share or return on average tangible shareholders’ equity |
Nine months ended (£m) Sep-19 Sep-18 % change
– CIB 7,917 7,614 4%
– CC&P 3,306 3,191 4%
Income 11,223 10,805 4%
– CIB (127) 185
– CC&P (717) (489) (47%)
Impairment charges (844) (304)
– Operating costs (6,923) (6,883) (1%)
– Litigation and conduct (30) (94) 68%
Total operating expenses (6,953) (6,977)
Other net income 52 36 44%
Profit before tax 3,478 3,560 (2%)
Attributable profit1 2,419 2,620 (8%)
Performance measures
RoTE 10.3% 11.3%
Average allocated tangible equity £31.2bn £30.9bn
Cost: income ratio 62% 65%
LLR 80bps 30bps
NIM 4.00% 4.15%
Balance sheet (£bn)
RWAs 223.1 214.6
Excluding L&C – nine months ended (£m) Sep-19 Sep-18 % change
Profit before tax 3,508 3,654 (4%)
Attributable profit 2,445 2,692 (9%)
Performance measures
RoTE 10.4% 11.6%
Cost: income ratio 62% 64%
53
APPENDIX

| Barclays Q3 2019 Fixed Income Investor Presentation
BASSET QUALITY APPENDIX
MREL, FUNDING
& LIQUIDITY
CAPITAL
& LEVERAGE
BREXIT
PREPARATIONS
DIVISIONS
& LEGAL ENTITIES
STRATEGY, TARGETS
& GUIDANCE PERFORMANCE CREDIT RATINGS
Q319 Barclays International
1 From 2019, due to an IAS 12 update, the tax relief on payments in relation to Additional Tier 1 instruments has been recognised in the tax charge of the income statement, whereas it was previously recorded in reserves. Comparatives have been restated. Thischange does not impact earnings per share or return on average tangible shareholders’ equity |
Three months ended (£m) Sep-19 Sep-18 % change
– CIB 2,617 2,235 17%
– CC&P 1,133 1,055 7%
Income 3,750 3,290 14%
– CIB (31) 3
– CC&P (321) (146)
Impairment charges (352) (143)
– Operating costs (2,282) (2,277)
– Litigation and conduct - (32)
Total operating expenses (2,282) (2,309) 1%
Other net income 21 12 75%
Profit before tax 1,137 850 34%
Attributable profit1 799 687 16%
Performance measures
RoTE 9.9% 8.8%
Average allocated tangible equity £32.2bn £31.1bn
Cost: income ratio 61% 70%
LLR 99bps 41bps
NIM 4.10% 3.87%
Balance sheet (£bn)
RWAs 223.1 214.6
Excluding L&C – three months ended (£m) Sep-19 Sep-18 % change
Profit before tax 1,137 882 29%
Attributable profit 801 713 12%
Performance measures
RoTE 10.0% 9.2%
Cost: income ratio 61% 69%
54
APPENDIX
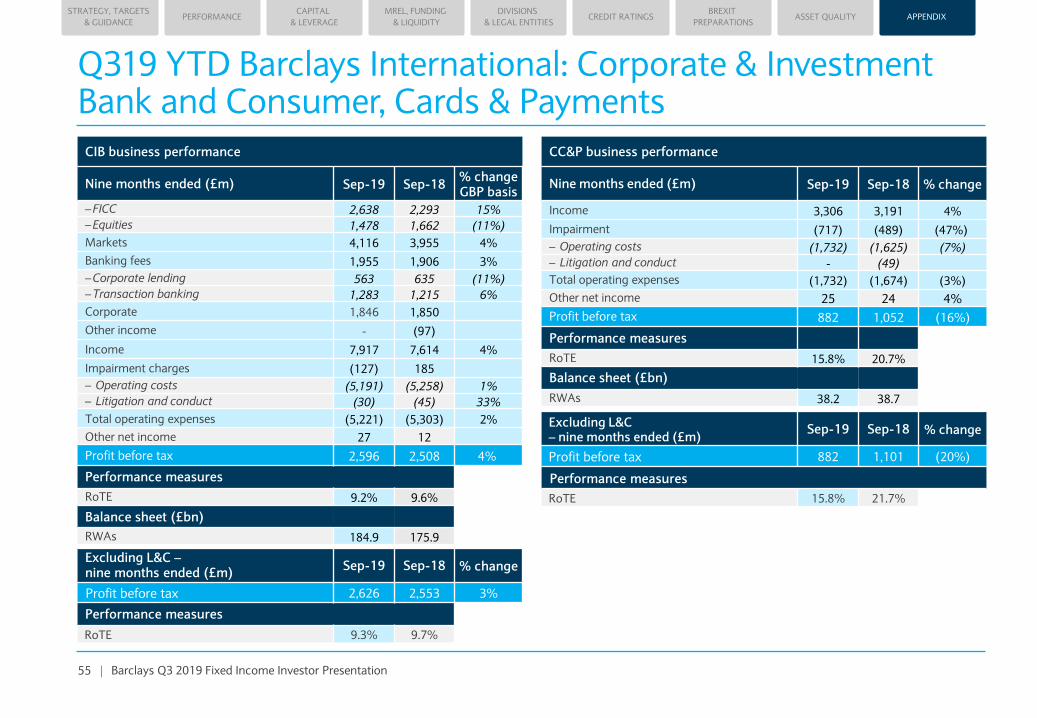
| Barclays Q3 2019 Fixed Income Investor Presentation
BASSET QUALITY APPENDIX
MREL, FUNDING
& LIQUIDITY
CAPITAL
& LEVERAGE
BREXIT
PREPARATIONS
DIVISIONS
& LEGAL ENTITIES
STRATEGY, TARGETS
& GUIDANCE PERFORMANCE CREDIT RATINGS
CIB business performance
Nine months ended (£m) Sep-19 Sep-18% change GBP basis
– FICC 2,638 2,293 15%
– Equities 1,478 1,662 (11%)
Markets 4,116 3,955 4%
Banking fees 1,955 1,906 3%
– Corporate lending 563 635 (11%)
– Transaction banking 1,283 1,215 6%
Corporate 1,846 1,850
Other income - (97)
Income 7,917 7,614 4%
Impairment charges (127) 185
– Operating costs (5,191) (5,258) 1%
– Litigation and conduct (30) (45) 33%
Total operating expenses (5,221) (5,303) 2%
Other net income 27 12
Profit before tax 2,596 2,508 4%
Performance measures
RoTE 9.2% 9.6%
Balance sheet (£bn)
RWAs 184.9 175.9
Excluding L&C –nine months ended (£m)
Sep-19 Sep-18 % change
Profit before tax 2,626 2,553 3%
Performance measures
RoTE 9.3% 9.7%
Q319 YTD Barclays International: Corporate & Investment Bank and Consumer, Cards & Payments
CC&P business performance
Nine months ended (£m) Sep-19 Sep-18 % change
Income 3,306 3,191 4%
Impairment (717) (489) (47%)
– Operating costs (1,732) (1,625) (7%)
– Litigation and conduct - (49)
Total operating expenses (1,732) (1,674) (3%)
Other net income 25 24 4%
Profit before tax 882 1,052 (16%)
Performance measures
RoTE 15.8% 20.7%
Balance sheet (£bn)
RWAs 38.2 38.7
Excluding L&C – nine months ended (£m)
Sep-19 Sep-18 % change
Profit before tax 882 1,101 (20%)
Performance measures
RoTE 15.8% 21.7%
55
APPENDIX

| Barclays Q3 2019 Fixed Income Investor Presentation
BASSET QUALITY APPENDIX
MREL, FUNDING
& LIQUIDITY
CAPITAL
& LEVERAGE
BREXIT
PREPARATIONS
DIVISIONS
& LEGAL ENTITIES
STRATEGY, TARGETS
& GUIDANCE PERFORMANCE CREDIT RATINGS
CIB business performance
Three months ended (£m) Sep-19 Sep-18% change GBP basis
% change USD basis
– FICC 816 688 19% 11%
– Equities 494 471 5% (1%)
Markets 1,310 1,159 13% 6%
Banking fees 688 519 33% 24%
– Corporate lending 195 197 (1%)
– Transaction banking 424 416 2%
Corporate 619 613 1%
Other income - (56)
Income 2,617 2,235 17%
Impairment charges (31) 3
– Operating costs (1,712) (1,712)
– Litigation and conduct (4) (32) 88%
Total operating expenses (1,716) (1,744) 2%
Other net income 12 4
Profit before tax 882 498 77%
Performance measures
RoTE 9.1% 6.6%
Balance sheet (£bn)
RWAs 184.9 175.9
Excluding L&C –three months ended (£m)
Sep-19 Sep-18 % change
Profit before tax 886 530 67%
Performance measures
RoTE 9.2% 7.0%
Q319 Barclays International: Corporate & Investment Bank and Consumer, Cards & Payments
CC&P business performance
Three months ended (£m) Sep-19 Sep-18 % change
Income 1,133 1,055 7%
Impairment (321) (146)
– Operating costs (570) (565) (1%)
– Litigation and conduct 4 -
Total operating expenses (566) (565)
Other net income 9 8 13%
Profit before tax 255 352 (28%)
Performance measures
RoTE 14.2% 19.8%
Balance sheet (£bn)
RWAs 38.2 38.7
Excluding L&C –three months ended (£m)
Sep-19 Sep-18 % change
Profit before tax 251 352 (29%)
Performance measures
RoTE 14.0% 19.9%
56
APPENDIX

| Barclays Q3 2019 Fixed Income Investor Presentation
BASSET QUALITY APPENDIX
MREL, FUNDING
& LIQUIDITY
CAPITAL
& LEVERAGE
BREXIT
PREPARATIONS
DIVISIONS
& LEGAL ENTITIES
STRATEGY, TARGETS
& GUIDANCE PERFORMANCE CREDIT RATINGS
Head Office – Q319 YTD and Q319
1 From 2019, due to an IAS 12 update, the tax relief on payments in relation to Additional Tier 1 instruments has been recognised in the tax charge of the income statement, whereas it was previously recorded in retained earnings. Comparatives have been restated. This change does not impact earnings per share or return on average tangible shareholders’ equity |
Nine months ended (£m) Sep-19 Sep-18
Income (286) (262)
Impairment charges (23) 9
– Operating costs (155) (159)
– Litigation and conduct (128) (1,585)
Operating expenses (283) (1,744)
Other net expenses (1) (9)
Loss before tax (593) (2,006)
Performance measures (£bn)
Average allocated tangible equity 5.0 3.2
Balance sheet (£bn)
RWAs 13.4 26.8
Excluding L&C – nine months ended (£m) Sep-19 Sep-18
Loss before tax (465) (421)
Attributable loss1 (386) (424)
Three months ended (£m) Sep-19 Sep-18
Income (55) (57)
Impairment charges (8) 4
– Operating costs (59) (64)
– Litigation and conduct (88) (19)
Operating expenses (147) (83)
Other net income 6 7
Loss before tax (204) (129)
Performance measures (£bn)
Average allocated tangible equity 5.8 3.4
Balance sheet (£bn)
RWAs 13.4 26.8
Excluding L&C – three months ended (£m) Sep-19 Sep-18
Loss before tax (116) (110)
Attributable loss1 (118) (136)
57
APPENDIX
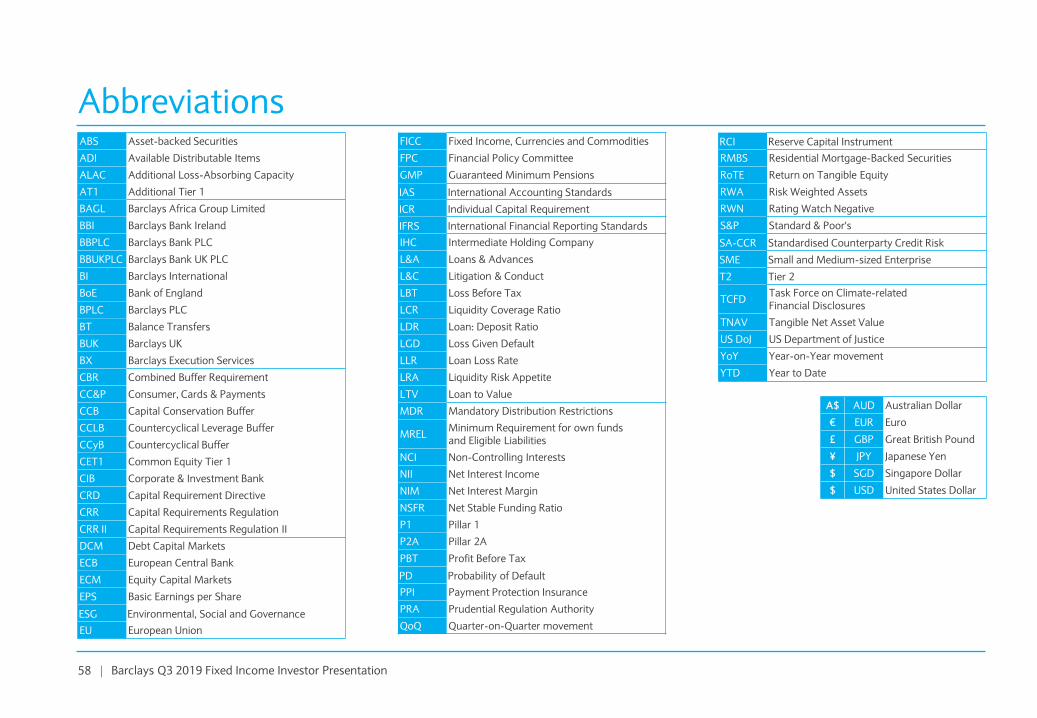
| Barclays Q3 2019 Fixed Income Investor Presentation
BASSET QUALITY APPENDIX
MREL, FUNDING
& LIQUIDITY
CAPITAL
& LEVERAGE
BREXIT
PREPARATIONS
DIVISIONS
& LEGAL ENTITIES
STRATEGY, TARGETS
& GUIDANCE PERFORMANCE CREDIT RATINGS
Abbreviations
A$ AUD Australian Dollar
€ EUR Euro
£ GBP Great British Pound
¥ JPY Japanese Yen
$ SGD Singapore Dollar
$ USD United States Dollar
ABS Asset-backed Securities
ADI Available Distributable Items
ALAC Additional Loss-Absorbing Capacity
AT1 Additional Tier 1
BAGL Barclays Africa Group Limited
BBI Barclays Bank Ireland
BBPLC Barclays Bank PLC
BBUKPLC Barclays Bank UK PLC
BI Barclays International
BoE Bank of England
BPLC Barclays PLC
BT Balance Transfers
BUK Barclays UK
BX Barclays Execution Services
CBR Combined Buffer Requirement
CC&P Consumer, Cards & Payments
CCB Capital Conservation Buffer
CCLB Countercyclical Leverage Buffer
CCyB Countercyclical Buffer
CET1 Common Equity Tier 1
CIB Corporate & Investment Bank
CRD Capital Requirement Directive
CRR Capital Requirements Regulation
CRR II Capital Requirements Regulation II
DCM Debt Capital Markets
ECB European Central Bank
ECM Equity Capital Markets
EPS Basic Earnings per Share
ESG Environmental, Social and Governance
EU European Union
FICC Fixed Income, Currencies and Commodities
FPC Financial Policy Committee
GMP Guaranteed Minimum Pensions
IAS International Accounting Standards
ICR Individual Capital Requirement
IFRS International Financial Reporting Standards
IHC Intermediate Holding Company
L&A Loans & Advances
L&C Litigation & Conduct
LBT Loss Before Tax
LCR Liquidity Coverage Ratio
LDR Loan: Deposit Ratio
LGD Loss Given Default
LLR Loan Loss Rate
LRA Liquidity Risk Appetite
LTV Loan to Value
MDR Mandatory Distribution Restrictions
MRELMinimum Requirement for own funds and Eligible Liabilities
NCI Non-Controlling Interests
NII Net Interest Income
NIM Net Interest Margin
NSFR Net Stable Funding Ratio
P1 Pillar 1
P2A Pillar 2A
PBT Profit Before Tax
PD Probability of Default
PPI Payment Protection Insurance
PRA Prudential Regulation Authority
QoQ Quarter-on-Quarter movement
RCI Reserve Capital Instrument
RMBS Residential Mortgage-Backed Securities
RoTE Return on Tangible Equity
RWA Risk Weighted Assets
RWN Rating Watch Negative
S&P Standard & Poor's
SA-CCR Standardised Counterparty Credit Risk
SME Small and Medium-sized Enterprise
T2 Tier 2
TCFDTask Force on Climate-related Financial Disclosures
TNAV Tangible Net Asset Value
US DoJ US Department of Justice
YoY Year-on-Year movement
YTD Year to Date
58

| Barclays Q3 2019 Fixed Income Investor Presentation
BASSET QUALITY APPENDIX
MREL, FUNDING
& LIQUIDITY
CAPITAL
& LEVERAGE
BREXIT
PREPARATIONS
DIVISIONS
& LEGAL ENTITIES
STRATEGY, TARGETS
& GUIDANCE PERFORMANCE CREDIT RATINGS
Contact – Debt Investor Relations Team
James Cranstoun
+44 (0)20 7773 1630
Dan Colvin
+44 (0)20 7116 6533
Version 1
Lis Nguyen
+44 (0)20 7116 1065
Robert Georgiou
+44 (0)20 7116 0446
59

| Barclays Q3 2019 Fixed Income Investor Presentation
BASSET QUALITY APPENDIX
MREL, FUNDING
& LIQUIDITY
CAPITAL
& LEVERAGE
BREXIT
PREPARATIONS
DIVISIONS
& LEGAL ENTITIES
STRATEGY, TARGETS
& GUIDANCE PERFORMANCE CREDIT RATINGS
DisclaimerImportant NoticeThe terms Barclays or Barclays Group refer to Barclays PLC together with its subsidiaries. The information, statements and opinions contained in this presentation do not constitute a public offer under any applicable legislation, an offer to sell or solicitation of anyoffer to buy any securities or financial instruments, or any advice or recommendation with respect to such securities or other financial instruments.Information relating to:
• regulatory capital, leverage, liquidity and resolution is based on Barclays’ interpretation of applicable rules and regulations as currently in force and implemented in the UK, including, but not limited to, CRD IV (as amended by CRD V applicable as at thereporting date) and CRR (as amended by CRR II applicable as at the reporting date) texts and any applicable delegated acts, implementing acts or technical standards. All such regulatory requirements are subject to change;
• MREL is based on Barclays’ understanding of the Bank of England’s policy statement on “The Bank of England’s approach to setting a minimum requirement for own funds and eligible liabilities (MREL)” published in June 2018, updating the Bank ofEngland’s November 2016 policy statement, and the non-binding indicative MREL requirements communicated to Barclays by the Bank of England. Binding future MREL requirements remain subject to change including at the conclusion of thetransitional period, as determined by the Bank of England, taking into account a number of factors as described in the policy statement and as a result of the finalisation of international and European MREL/TLAC requirements;
• future regulatory capital, liquidity, funding and/or MREL, including forward-looking illustrations, are provided for illustrative purposes only and are not forecasts of Barclays’ results of operations or capital position or otherwise. Illustrations regarding thecapital flight path, end-state capital evolution and expectations and MREL build are based on certain assumptions applicable at the date of publication only which cannot be assured and are subject to change, including amongst others, holding constantthe Pillar 2A requirement at the level Barclays has most recently announced has been communicated to it despite it being subject to at least annual review and assumed CRD buffers, which are also subject to change.
The information set out in slide 44 (the “Illustrative Financial Information”) is for illustrative purposes only and is subject to change. The Illustrative Financial Information, including indications of total assets, revenue, funding, balance sheet estimations and ratioshas been compiled as if the following activities, customers and clients (“In-Scope Business”) were comprised in the businesses of Barclays Bank Ireland (“BBI”) as at 31 December 2018:
i. all regulated activity and client base of the European branches of Barclays Bank PLC (“BBPLC”) as at 31 December 2018; and
ii. all regulated activity of European clients of BBPLC who were located within the EEA (excluding the UK) as at 31 December 2018.
The Illustrative Financial Information represents a modelled view including estimates based on Barclays’ current planning assumptions for the business and operating model for BBI, and is presented to show the possible effect of the proposed business transfers asif they had occurred on 31 December 2018. In addition to this, certain of the Illustrative Financial Information has been sourced from the BBI 2018 statutory accounts, management accounts of BBI up to 31 December 2018 and also the general ledger. TheIllustrative Financial Information has not been independently verified. While Barclays’ plans for an expanded BBI in response to the UK’s withdrawal from the EU are well progressed, they remain subject to the outcome of the political negotiation, ongoing regulatoryengagement and management discretion, and so are subject to changes which may be significant. Among other variables, the actual amount of In-Scope Business that may ultimately transfer to (including, but not limited to, as a result of what activity is finallydetermined to be regulated activity) and/or continue to trade with BBI in the future may differ significantly from the assumptions used in producing the Illustrative Financial Information. The Illustrative Financial Information is therefore provided for illustrativepurposes only and is not a forecast of present or future financial condition or performance of BBPLC or BBI. Whilst all reasonable care has been taken in providing the Illustrative Financial Information no responsibility or liability is or will be accepted by Barclays PLCand any of its subsidiaries, affiliates or associated companies or any of their respective officers, employees or agents in relation to the adequacy, accuracy, completeness or reasonableness of the Illustrative Financial Information or for any action taken in relianceupon that information by any party whether customer, client, counterparty, investor or otherwise. Nothing in the relevant slide should be taken as (or is) a representation or warranty, express or implied, as to any of the matters presented.
Forward-looking StatementsThis document contains certain forward-looking statements within the meaning of Section 21E of the US Securities Exchange Act of 1934, as amended, and Section 27A of the US Securities Act of 1933, as amended, with respect to the Barclays Group. Barclays cautions readers that no forward-looking statement is a guarantee of future performance and that actual results or other financial condition or performance measures could differ materially from those contained in the forward-looking statements. These forward-looking statements can be identified by the fact that they do not relate only to historical or current facts. Forward-looking statements sometimes use words such as ‘may’, ‘will’, ‘seek’, ‘continue’, ‘aim’, ‘anticipate’, ‘target’, ‘projected’, ‘expect’, ‘estimate’, ‘intend’, ‘plan’, ‘goal’, ‘believe’, ‘achieve’ or other words of similar meaning. Forward-looking statements can be made in writing but also may be made verbally by members of the management of the Barclays Group (including, without limitation during management presentations to financial analysts) in connection with this document. Examples of forward-looking statements include, among others, statements or guidance regarding or relating to the Barclays Group’s future financial position, income growth, assets, impairment charges, provisions, business strategy, capital, leverage and other regulatory ratios, payment of dividends (including dividend payout ratios and expected payment strategies), projected levels of growth in the banking and financial markets, projected costs or savings, any commitments and targets, estimates of capital expenditures, plans and objectives for future operations, projected employee numbers, IFRS impacts and other statements that are not historical fact. By their nature, forward-looking statements involve risk and uncertainty because they relate to future events and circumstances. The forward-looking statements speak only as at the date on which they are made and such statements may be affected by changes in legislation, the development of standardsand interpretations under IFRS, including evolving practices with regard to the interpretation and application of accounting and regulatory standards, the outcome of current and future legal proceedings and regulatory investigations, future levels of conduct provisions, the policies and actions of governmental and regulatory authorities, geopolitical risks and the impact of competition. In addition, factors including (but not limited to) the following may have an effect: capital, leverage and other regulatory rules applicable to past, current and future periods; UK, US, Eurozone and global macroeconomic and business conditions; the effects of any volatility in credit markets; market related risks such as changes in interest rates and foreign exchange rates; effects of changes in valuation of credit market exposures; changes in valuation of issued securities; volatility in capital markets; changes in credit ratings of any entity within the Barclays Group or any securities issued by such entities; the potential for one or more countries exiting the Eurozone; instability as a result of the exit by the UK from the European Union and the disruption that may subsequently result in the UK and globally; and the success of future acquisitions, disposals and other strategic transactions. A number of these influences and factors are beyond the Barclays Group’s control. As a result, the Barclays Group’s actual financial position, future results, dividend payments, capital, leverage or other regulatory ratios or other financial and non-financial metrics or performance measures may differ materially from the statements or guidance set forth in the Barclays Group’s forward-looking statements. Additional risks and factors which may impact the Barclays Group’s future financial condition and performance are identified in ourfilings with the SEC (including, without limitation, our Annual Report on Form 20-F for the fiscal year ended 31 December 2018), which are available on the SEC’s website at www.sec.gov.
Subject to our obligations under the applicable laws and regulations of any relevant jurisdiction, (including, without limitation, the UK and the US), in relation to disclosure and ongoing information, we undertake no obligation to update publicly or revise any forward-looking statements, whether as a result of new information, future events or otherwise.
Non-IFRS Performance MeasuresThis presentation includes certain non-IFRS performance measures, such as income statement and financial performance measures excluding litigation and conduct. These measures are defined and reconciliations to the nearest IFRS measures are available in theappendix to Barclays Group’s results announcement for the period ended 30 September 2019.
60
Recommended


