Barclays PLC Q1 2015 Results Announcement 29 April 2015

Tushar Morzaria Barclays Group Finance Director

3 | Barclays Q1 2015 Results | 29 April 2015
Q1 financial highlights
Building capital: CET1 ratio increased to 10.6% and leverage ratio maintained at 3.7%
Core business continued to performed well with PBT of £2.1bn and RoE of 10.9%
Group adjusted costs of £4.1bn, down 7%, delivering positive jaws
Further progress on shrinking Non-Core and releasing capital; RWAs down to £65bn
Increased adjusted pre-tax profits by 9% – Core up 14%
GROUP CORE NON-CORE CONCLUSION

4 | Barclays Q1 2015 Results | 29 April 2015
Financial performance
• Adjusted profit before tax increased 9%
• Adjusted income decreased 3%, due to Non-Core run-down, while impairment reduced 13%
• Total adjusted operating expenses decreased 7% to £4.1bn driven by savings from Transform programmes and lower costs to achieve Transform
• Adjusted attributable profit was £1.1bn, resulting in EPS of 6.5p
• Group RoE was 7.6%, with Core RoE of 10.9%
• Dilution on Group RoE from Barclays Non-Core was 3.3%
• Statutory attributable profit was £465m:
− Further provisions of £800m for investigations and litigation primarily relating to Foreign Exchange
− Additional PPI redress provision of £150m
− Gain of £429m recognised as valuation of a component of the defined retirement benefit liability was aligned to statutory provisions
− Loss of £118m relating to completion of the Spanish business sale
Summary Group financials: Adjusted profits up 9%
GROUP CORE NON-CORE CONCLUSION
1 EPS and RoE calculations are based on adjusted attributable profit, also taking into account tax credits on AT1 coupons |
Three months ended – March (£m) 2014 2015 % change
Income 6,650 6,430 (3%)
Impairment (548) (477) 13%
Total operating expenses (4,435) (4,124) 7%
– Costs to achieve Transform (CTA) (240) (120) 50%
Adjusted profit before tax 1,693 1,848 9%
Tax (561) (529) 6%
NCI and other equity interests (250) (260) (4%)
Adjusted attributable profit 882 1,059 20%
Ad
just
me
nts
– Provisions for investigations and litigation primarily relating to Foreign Exchange
– (800)
– Provisions for PPI redress – (150)
– Gain on valuation of a component of the defined retirement benefit
– 429
– Loss on sale of Spanish business – (118)
– Own credit 119 128
Statutory profit before tax 1,812 1,337 (26%)
Statutory attributable profit 965 465 (52%)
Basic earnings per share1 5.5p 6.5p
Return on average equity1 6.5% 7.6%
Dividend per share 1.0p 1.0p

5 | Barclays Q1 2015 Results | 29 April 2015
• Progressive strengthening of key balance sheet metrics
• CET1 capital increased to £42bn and RWAs reduced to £396bn, improving the CET1 ratio to 10.6%
• Leverage exposure increased slightly to £1,255bn (Dec 2014: £1,233bn), mainly as a result of seasonal effects, but the leverage ratio was maintained at 3.7%
• TNAV rose to 288p (Dec 2014: 285p)
• Liquidity position remains robust with liquidity pool of £148bn and LCR of 122%
• Funding profile remains conservative and well diversified
• Overall funding requirements expected to reduce as Non-Core is run down
• Further progress on proactive transition towards holding company capital and funding model:
− Raised £2bn of senior unsecured debt at Barclays PLC which was used to subscribe for senior unsecured debt at Barclays Bank PLC
• Proxy TLAC ratio4 of 24%, well positioned to meet future TLAC requirement
Leverage ratio2
Fully Loaded CET1 ratio1
Liquidity and funding
Strengthening key financial metrics
9.1% 9.5% 9.9% 10.2% 10.3% 10.6%
FY 13 Q1 14 H1 14 Q3 14 FY 14 Q1 15
3.0% 3.1% 3.4% 3.5% 3.7% 3.7%
FY 13 Q1 14 H1 14 Q3 14 FY 14 Q1 15
351 349 347 321 309 310
FY 13 FY 14 Q1 15
Deposits from customers L&A to customers
91% 89% 89% LDR3
Highlights
1 Based on Barclays interpretation of the final CRD IV text and latest EBA technical standards | 2 Mar-15 based on end-point CRR definition of Tier 1 capital for the numerator and the CRR definition of leverage exposure as adopted by the European Union delegated act. This is broadly consistent with the BCBS 270 definition, which was the basis of Jun-14, Sep-14 and Dec-14 comparatives. Dec-13 and Mar-14 not comparable to the estimates as of Jun-14 onwards due to different basis of preparation: estimated ratio and T1 capital based on PRA leverage ratio calculated as fully loaded CRD IV T1 capital adjusted for certain PRA defined deductions, and a PRA adjusted leverage exposure measure. | 3 Loan: deposit ratio for PCB, Barclaycard, Africa Banking and Non-Core retail | 4 Based on certain assumptions, which are set out in more detail on slide 32 |
GROUP CORE NON-CORE CONCLUSION
149 148 Liquidity
pool (bn)
Estimated CRD IV liquidity
coverage ratio 124% 122%
FY 14 Q1 15

6 | Barclays Q1 2015 Results | 29 April 2015
Financial performance
• PBT up 14% at £2.1bn:
− PCB profits up 14%
− Investment Bank profits up 37%
− Africa Banking profits up 23%
− Barclaycard profits were down 1%
• Income increased 2% to £6.4bn, with non-investment banking businesses up 4%
• Impairment improved 7%, principally reflecting the improving UK economic environment benefitting PCB
• Operating expenses reduced 2% to £3.9bn reflecting Transform savings across the businesses
• Attributable profit was £1.3bn with EPS of 7.7p
• RoE excluding CTA was 11.6% on average allocated equity of £47bn, up £7bn year on year
Core business performing well: Positive jaws and PBT up 14%
GROUP CORE NON-CORE CONCLUSION
Three months ended – March (£m) 2014 2015 % change
Income 6,277 6,420 2%
Impairment (481) (448) 7%
Total operating expenses (3,969) (3,885) 2%
– Costs to achieve Transform (CTA)
(216) (109) 50%
Adjusted profit before tax 1,847 2,104 14%
Tax (589) (615) (4%)
NCI and other equity interests (205) (231) (13%)
Adjusted attributable profit 1,053 1,258 19%
Adjusted financial performance measures
Average allocated equity £40bn £47bn
Return on average tangible equity 13.2% 13.2%
Return on average equity 10.7% 10.9%
Cost:income ratio 63% 61%
Basic EPS contribution 6.6p 7.7p
Dec-14 Mar-15
CRD IV RWAs £327bn £331bn
Leverage exposure £956bn £1,019bn

7 | Barclays Q1 2015 Results | 29 April 2015
Core income: Growth in net interest income and margin
• Improved income performance across all businesses
• NII for our retail and corporate businesses2 grew 6%, reflecting an increase in customer assets and NIM:
− PCB grew NII 5% driven by lending and deposit growth and margin improvement
− Barclaycard grew NII 10% driven by volume growth
− Africa Banking income was up 8%, with NII up 6%
GROUP CORE NON-CORE CONCLUSION
1 Includes Head Office income | 2 For Personal and Corporate Banking, Barclaycard and Africa Banking |
Average customer assets and liabilities2 (£bn)
• NIM increased to 414bps, measured across PCB, Barclaycard and Africa Banking
− PCB NIM improved to 3.02% (Q1 14: 2.99%)
Net interest margin2 (bps)
• Average customer assets increased 5% to £289bn, with growth in PCB, Barclaycard, and Africa Banking
• Average customer liabilities increased 2% to £333bn, with growth in all three businesses
Total income NII
Three months ended – March 2014 2015 2014 2015 ∆
Personal and Corporate Banking 2,173 2,174 1,528 1,601 5%
Barclaycard 1,042 1,135 746 821 10%
Africa Banking 878 948 503 533 6%
Investment Bank 2,103 2,149
Total Core1 6,277 6,420
410 414
Mar-14 Mar-15
275 289 325 333
0
50
100
150
200
250
300
350
400
Mar-14 Mar-15
Customer assets Customer liabilities
Core income (£m)

8 | Barclays Q1 2015 Results | 29 April 2015
481 448
Q1 14 Q1 15
Impairment charge (£m)
Continued strong Core asset quality
GROUP CORE NON-CORE CONCLUSION
Highlights
135
79
Q1 14 Q1 15
269 290
Q1 14 Q1 15
96 90
Q1 14 Q1 15
Personal and Corporate Banking Barclaycard Africa Banking
Impairment (£m)
41% (8%) 6%
• Credit impairment improved 7% to £448m, principally reflecting lower impairments in PCB
• PCB benefitted from the improving economic environment in the UK, resulting in lower default rates and charges in corporate
• Barclaycard impairment increased 8% and was accompanied by loans and advances growth of 15%. The loan loss rate reduced 20bps to 305bps
• Africa Banking impairment improved 6% to £90m principally due to reduced charges in South Africa mortgages
7%

9 | Barclays Q1 2015 Results | 29 April 2015
Core operating costs1 (£bn)
Core operating costs
Highlights
1.36 1.31
Q1 14 Q1 15
0.42 0.49
Q1 14 Q1 15
0.55 0.57
Q1 14 Q1 15
1.63 1.49
Q1 14 Q1 15
Personal and Corporate Banking Barclaycard Africa Banking Investment Bank
Operating costs (£bn)
3%
• Core operating costs decreased by 2% year on year driven by savings from Transform programmes principally in the Investment Bank and PCB, as well as lower CTA spend, partially offset by adverse FX movements
• Transform initiatives continued to drive significant and sustainable cost reductions by focusing on restructuring, business exits, industrialisation, innovation and property exits
• Investment Bank reduced operating costs year on year predominately driven by front office restructuring and operational streamlining
• Barclaycard operating costs increased primarily reflecting business growth
2.5 2.4
1.2 1.3
0.2 0.1
Q1 14 Q1 15
Staff costs Other operating costs Costs to achieve Transform
2% 4.0 3.9
(18%) (3%) 9%
GROUP CORE NON-CORE CONCLUSION
1 Totals in graph reflect rounding |

10 | Barclays Q1 2015 Results | 29 April 2015
PCB: Profits up 14%
GROUP CORE NON-CORE CONCLUSION
1 Q1 15 CIR excluding CTA was 58% |
• Income was in line at £2,174m:
− Personal income reduced 2% driven by a reduction in fee income and mortgage margin pressure from existing customer rate switching, partially offset by improved deposit margins
− Corporate income increased 3% due to improved deposit margins and balance growth in both lending and deposits, partially offset by reduced margins in the lending business
− Wealth income reduced 4% to £258m
• Net interest margin improved to 3.02% primarily due to the revised overdraft proposition and higher savings and deposit margins in personal and corporate businesses, partially offset by margin compression in mortgages and the corporate lending business
• Credit impairment charges improved 41% due to the positive economic environment in the UK resulting in lower default rates and charges in corporate, with a resulting loan loss rate of 14bps
• Costs reduced 3% reflecting savings from Transform programmes, including headcount reductions and branch network rationalisation
• Positive jaws contributed to an increased RoE of 12.9%, while RoTE improved to 17.1%
Three months ended – March (£m) 2014 2015 % change
– Personal 1,026 1,009 (2%)
– Corporate 879 907 3%
– Wealth 268 258 (4%)
Income 2,173 2,174 -
Impairment (135) (79) 41%
Total operating expenses (1,355) (1,310) 3%
– Costs to achieve Transform (57) (42) 26%
Profit before tax 688 787 14%
Financial performance measures
Average allocated equity £17.4bn £18.1bn
Return on average tangible equity 14.7% 17.1%
Return on average equity 11.1% 12.9%
Cost:income ratio1 62% 60%
Loan loss rate 25bps 14bps
Net interest margin 2.99% 3.02%
Mar-14 Mar-15
Loans and advances to customers £215.5bn £219.0bn
Customer deposits £297.2bn £298.1bn
CRD IV RWAs £116.1bn £122.5bn
Financial performance

11 | Barclays Q1 2015 Results | 29 April 2015
• Income increased 9% to £1,135m driven by US cards and Barclaycard Business Solutions
− Net interest margin reduced to 8.78% (Q1 14: 9.19%) due to change in product mix with relatively stronger growth in the lower margin US cards and Barclays Partner Finance businesses, but strongly up from 8.13% reported for Q4 14
− Non-interest income increased 6% to £314m due to growth in US cards and Barclaycard Business Solutions, partially offset by the impact of interchange fee reductions in Europe
• Credit impairment charges increased 8% to £290m and was accompanied by loans and advances growth of 15%. The loan loss rate reduced 20bps to 305bps
• Costs increased 18% reflecting organic business growth and portfolio acquisitions, primarily in the US, in addition to increased CTA spend
• PBT decreased slightly to £366m and attributable profit rose to £259m (Q1 14: £254m)
Barclaycard: Income up 9% and RoE of nearly 17%
GROUP CORE NON-CORE CONCLUSION
Three months ended – March (£m) 2014 2015 % change
Income 1,042 1,135 9%
Impairment (269) (290) (8%)
Total operating expenses (415) (490) (18%)
– Costs to achieve Transform (13) (25) (92%)
Profit before tax 368 366 (1%)
Financial performance measures
Average allocated equity £5.6bn £6.3bn
Return on average tangible equity 22.6% 21.0%
Return on average equity 18.2% 16.6%
Cost:income ratio 40% 43%
Loan loss rate 325bps 305bps
Net interest margin 9.19% 8.78%
Mar-14 Mar-15
Loans and advances to customers £31.9bn £36.8bn
Customer deposits £5.8bn £8.0bn
CRD IV RWAs £36.4bn £39.9bn
Financial performance

12 | Barclays Q1 2015 Results | 29 April 2015
Currency movements had a limited effect on Q1 year on year comparisons. Discussion of business performance is therefore based on reported results in GBP:
• PBT increased 23%, driven by 8% income growth exceeding 3% cost growth
• Net interest income increased 6% to £533m, driven by higher loans to customers in Corporate and Investment Banking (CIB) and customer deposits in Retail and Business Banking
• Non-interest income increased 11% to £415m, reflecting transactional income growth in South Africa and trading income in CIB
• Credit impairment charges decreased 6% to £90m, driven by reduced impairments in the South Africa mortgages portfolio and business banking
• Costs increased 3% reflecting inflationary pressures, resulting in higher staff costs, partially offset by the benefits of Transform programmes
• RoE was 10.8% and RoTE was 14.7%
Africa Banking: Profits up 23%
GROUP CORE NON-CORE CONCLUSION
1 Africa Banking business unit performance based on BAGL results, including Egypt and Zimbabwe | 2 Barclays share of the statutory equity of the BAGL entity (together with that of the Barclays Egypt and Zimbabwe businesses which remain outside the BAGL corporate entity), as well as the Barclays’ goodwill on acquisition of these businesses. The tangible equity for RoTE uses the same basis but excludes both the Barclays’ goodwill on acquisition and the goodwill and intangibles held within the BAGL statutory equity |
Three months ended – March (£m) 2014 2015 % change
Income 878 948 8%
Impairment (96) (90) 6%
Total operating expenses (546) (565) (3%)
– Costs to achieve Transform (9) (6) 33%
Profit before tax 240 295 23%
Financial performance measures
Average allocated equity2 £3.7bn £4.1bn
Return on average tangible equity2 15.5% 14.7%
Return on average equity2 11.1% 10.8%
Cost:income ratio 62% 60%
Loan loss rate 104bps 94bps
Net interest margin 5.91% 5.91%
Mar-14 Mar-15
Loans and advances to customers £35.0bn £35.7bn
Customer deposits £34.0bn £35.0bn
CRD IV RWAs £36.6bn £39.3bn
Financial performance1

13 | Barclays Q1 2015 Results | 29 April 2015
Q4 14 % change
638 (1)%
1,028 48%
• PBT rose 37% driven by income up 2% and costs down 9%
• RoE improved to 9.1%, or 9.6% excluding CTA
• Income increased 2% to £2,149m:
− Banking increased 3% driven by higher debt and equity underwriting fees, partially offset by a decrease in advisory fees and lending
− Macro increased 13% due to higher income in rates and currency products, reflecting increased client activity and market volatility
− Credit decreased 21% driven by lower income in distressed credit, but recovered strongly from Q4 14 due to increased client activity
− Equities increased 5% driven by cash equities and equity financing, partially offset by equity derivatives
• Costs decreased 9% due to lower CTA and compensation costs, as well as savings from Transform programmes, including business restructuring and operational streamlining
Investment Bank: Profits up 37%
GROUP CORE NON-CORE CONCLUSION
Three months ended – March (£m) 2014 2015 % change
Banking 616 632 3%
Markets 1,489 1,517 2%
– Credit 346 274 (21%)
– Equities 591 619 5%
– Macro 552 624 13%
Income1 2,103 2,149 2%
Impairment release 19 11 (42%)
Total operating expenses (1,631) (1,485) 9%
– Costs to achieve Transform (130) (31) 76%
Profit before tax 491 675 37%
Financial performance measures
Average allocated equity £15.4bn £15.4bn
Return on average tangible equity 6.4% 9.7%
Return on average equity 6.1% 9.1%
Cost:income ratio 78% 69%
Mar-14 Mar-15
CRD IV RWAs £125.2bn £123.0bn
Financial performance – Q1 15 vs. Q1 14
1 Includes ‘Other’ income |

14 | Barclays Q1 2015 Results | 29 April 2015
• Period end equity reduced by £5.2bn to £9.7bn, including a £1.3bn reduction in Q1
• RWAs reduced £41bn to £65bn, with a reduction of £10bn in Q1, including the completion of the sale of the Spanish business
• Income reduced £363m to £10m, reflecting sales of income generating assets
• Credit impairment improved to £29m, driven by the impact of sale of the Spanish business and improved performance in European retail
• Costs reduced 49% to £239m due to savings from Transform programmes, including non-retail headcount reductions, and savings from the sale of the Spanish and UAE businesses
• Attributable loss was £199m, but with the reduction in allocated equity the Non-Core dilution on Group RoE was 3.3%
Barclays Non-Core: Continued shrinkage and capital recycling
GROUP CORE NON-CORE CONCLUSION
Three months ended – March (£m) 2014 2015
– Businesses 301 122
– Securities and Loans 87 (73)
– Derivatives (15) (39)
Income 373 10
Impairment (67) (29)
Total operating expenses (466) (239)
– Costs to achieve Transform (CTA) (24) (11)
Loss before tax (154) (256)
Tax credit 28 86
NCI and other equity interests (45) (29)
Attributable loss (171) (199)
Financial performance measures
Average allocated equity £15.2bn £10.3bn
Period end allocated equity £14.9bn £9.7bn
Return on average equity drag1 (4.2%) (3.3%)
Basic EPS contribution (1.1p) (1.2p)
CRD IV RWAs £75bn £65bn
Highlights
1 Return on average equity and average tangible equity for Barclays Non-Core represents its impact on the Group, being the difference between Barclays Group returns and Barclays Core returns. This does not represent the return on average equity and average tangible equity of the Non-Core business |
15 | Barclays Q1 2015 Results | 29 April 2015
481 464 456 419 441
321 329 219
Q2 13 Q3 13 Q4 13 Q1 14 Q2 14 Q3 14 Q4 14 Q1 15
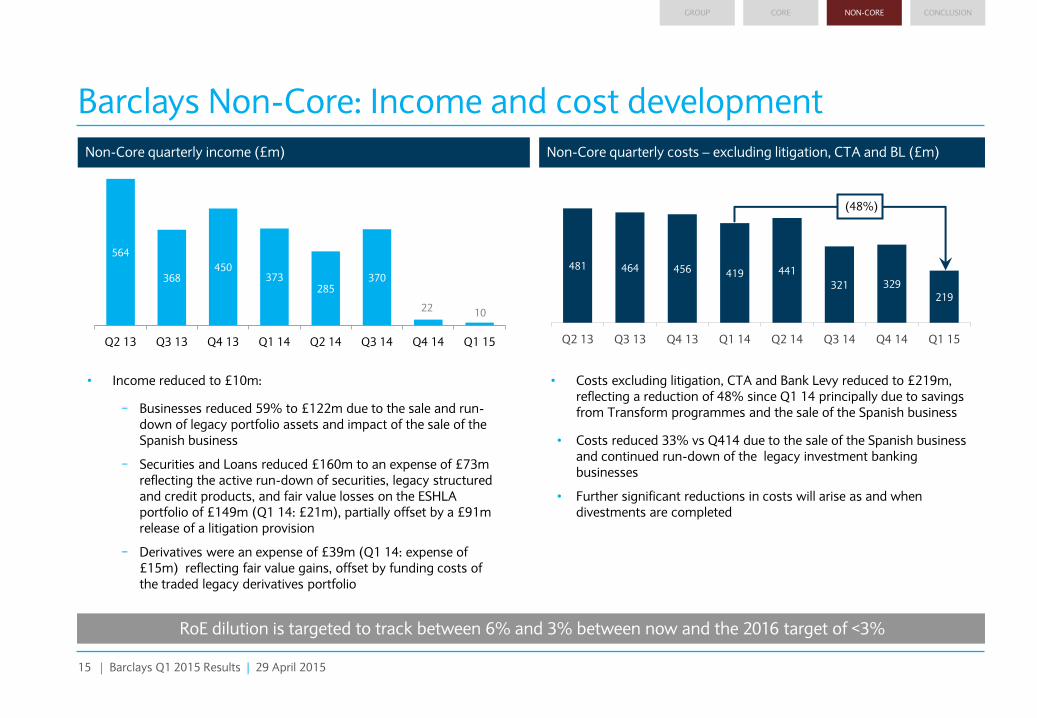
Non-Core quarterly income (£m) Non-Core quarterly costs – excluding litigation, CTA and BL (£m)
Barclays Non-Core: Income and cost development
RoE dilution is targeted to track between 6% and 3% between now and the 2016 target of <3%
GROUP CORE NON-CORE CONCLUSION
(48%)
564
368 450
373 285
370
22 10
Q2 13 Q3 13 Q4 13 Q1 14 Q2 14 Q3 14 Q4 14 Q1 15
• Income reduced to £10m:
− Businesses reduced 59% to £122m due to the sale and run-down of legacy portfolio assets and impact of the sale of the Spanish business
− Securities and Loans reduced £160m to an expense of £73m reflecting the active run-down of securities, legacy structured and credit products, and fair value losses on the ESHLA portfolio of £149m (Q1 14: £21m), partially offset by a £91m release of a litigation provision
− Derivatives were an expense of £39m (Q1 14: expense of £15m) reflecting fair value gains, offset by funding costs of the traded legacy derivatives portfolio
• Costs excluding litigation, CTA and Bank Levy reduced to £219m, reflecting a reduction of 48% since Q1 14 principally due to savings from Transform programmes and the sale of the Spanish business
• Costs reduced 33% vs Q414 due to the sale of the Spanish business and continued run-down of the legacy investment banking businesses
• Further significant reductions in costs will arise as and when divestments are completed
16 | Barclays Q1 2015 Results | 29 April 2015
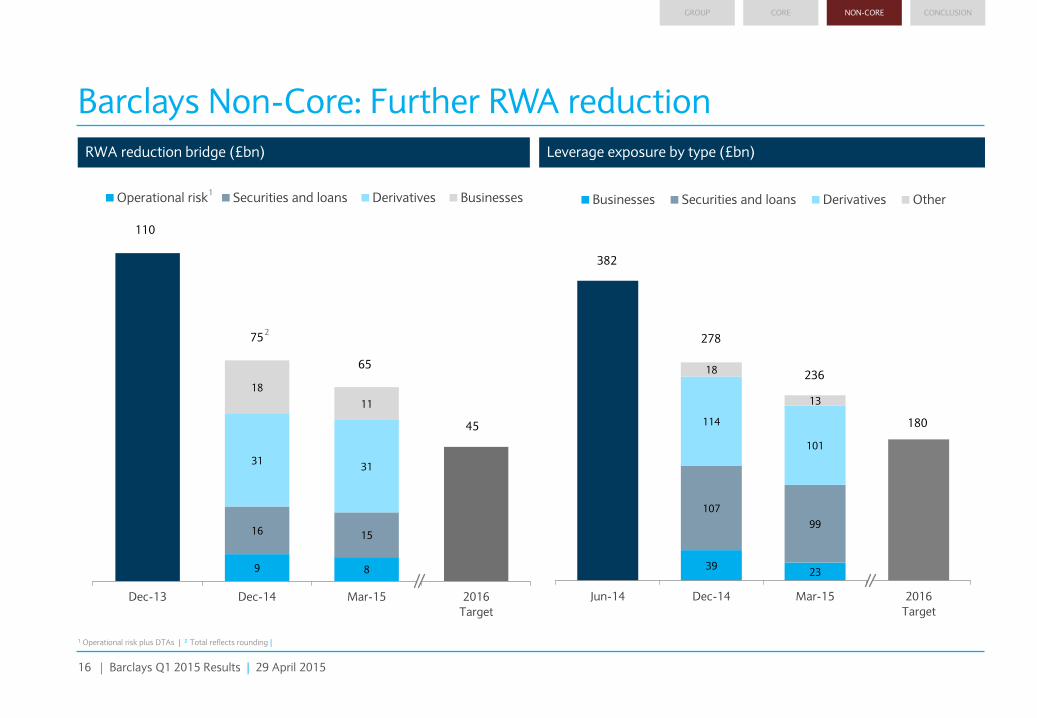
RWA reduction bridge (£bn) Leverage exposure by type (£bn)
Barclays Non-Core: Further RWA reduction
GROUP CORE NON-CORE CONCLUSION
9 8
16 15
31 31
18
11
Dec-13 Dec-14 Mar-15 2016
Target
Operational risk Securities and loans Derivatives Businesses
39 23
107
99
114
101
18
13
180
Jun-14 Dec-14 Mar-15 2016
Target
Businesses Securities and loans Derivatives Other
278
236
1 Operational risk plus DTAs | 2 Total reflects rounding |
1
2
382
110
45
75
65

17 | Barclays Q1 2015 Results | 29 April 2015
2016 Transform targets
Returns
Cost
Barclays Core
Adjusted RoE >12%
Adjusted operating expenses <£14.5bn
Leverage
Dividend
Capital
Group Leverage ratio >4.0%
Payout ratio 40-50%
CRD IV FL CET1 ratio >11.0%
Returns Barclays Non-Core Drag on adjusted RoE <(3%)
GROUP CORE NON-CORE CONCLUSION
11.6%2
£3.8bn3
3.7%
1p1
10.6%
(3.3%)
Q1 2015
1 Dividend per share paid for the quarter - payout ratio is not meaningful at Q1 | 2 Excluding CTA. Adjusted RoE including CTA is 10.9% | 3 Excluding CTA. Bank Levy is accounted for in Q4 each year |
2016 Target

Barclays PLC Q1 2015 Results Announcement 29 April 2015

19 | Barclays Q1 2015 Results | 29 April 2015
Legal Disclaimer Important Notice
The information, statements and opinions contained in this document do not constitute a public offer under any applicable legislation or an offer to sell or solicitation of any offer to buy any securities or financial instruments or any advice or recommendation with respect to such securities or other financial instruments.
Forward-looking Statements
This document contains certain forward-looking statements within the meaning of Section 21E of the US Securities Exchange Act of 1934, as amended, and Section 27A of the US Securities Act of 1933, as amended, with respect to certain of the Group’s plans and its current goals and expectations relating to its future financial condition and performance. Barclays cautions readers that no forward-looking statement is a guarantee of future performance and that actual results could differ materially from those contained in the forward-looking statements. These forward-looking statements can be identified by the fact that they do not relate only to historical or current facts. Forward-looking statements sometimes use words such as ‘may’, ‘will’, ‘seek’, ‘continue’, ‘aim’, ‘anticipate’, ‘target’, ‘projected’, ‘expect’, ‘estimate’, ‘intend’, ‘plan’, ‘goal’, ‘believe’, ‘achieve’ or other words of similar meaning. Examples of forward-looking statements include, among others, statements regarding the Group’s future financial position, income growth, assets, impairment charges and provisions, business strategy, capital, leverage and other regulatory ratios, payment of dividends (including dividend pay-out ratios), projected levels of growth in the banking and financial markets, projected costs or savings, original and revised commitments and targets in connection with the Transform Programme and Group Strategy Update, run-down of assets and businesses within Barclays Non-Core, estimates of capital expenditures and plans and objectives for future operations, projected employee numbers and other statements that are not historical fact. By their nature, forward-looking statements involve risk and uncertainty because they relate to future events and circumstances. These may be affected by changes in legislation, the development of standards and interpretations under International Financial Reporting Standards (IFRS), evolving practices with regard to the interpretation and application of accounting and regulatory standards, the outcome of current and future legal proceedings and regulatory investigations, future levels of conduct provisions, the policies and actions of governmental and regulatory authorities, geopolitical risks and the impact of competition. In addition, factors including (but not limited to) the following may have an effect: capital, leverage and other regulatory rules (including with regard to the future structure of the Group) applicable to past, current and future periods; UK, US, Africa, Eurozone and global macroeconomic and business conditions; the effects of continued volatility in credit markets; market related risks such as changes in interest rates and foreign exchange rates; effects of changes in valuation of credit market exposures; changes in valuation of issued securities; volatility in capital markets; changes in credit ratings of the Group; the potential for one or more countries exiting the Eurozone; the impact of EU and US sanctions on Russia; the implementation of the Transform Programme; and the success of future acquisitions, disposals and other strategic transactions. A number of these influences and factors are beyond the Group’s control. As a result, the Group’s actual future results, dividend payments, and capital and leverage ratios may differ materially from the plans, goals, and expectations set forth in the Group’s forward-looking statements. Additional risks and factors are identified in our filings with the SEC, including our Annual Report on Form 20-F for the fiscal year ended 31 December 2014 (“2014 20-F”), which are available on the SEC’s website at http://www.sec.gov.
Any forward-looking statements made herein speak only as of the date they are made and it should not be assumed that they have been revised or updated in the light of new information or future events. Except as required by the Prudential Regulation Authority, the Financial Conduct Authority, the London Stock Exchange plc (the LSE) or applicable law, Barclays expressly disclaims any obligation or undertaking to release publicly any updates or revisions to any forward-looking statements contained herein to reflect any change in Barclays’ expectations with regard thereto or any change in events, conditions or circumstances on which any such statement is based. The reader should, however, consult any additional disclosures that Barclays has made or may make in documents it has published or may publish via the Regulatory News Service of the LSE and/or has filed or may file with the SEC, including the 2014 20-F.

Appendix

21 | Barclays Q1 2015 Results | 29 April 2015
Simpler, focused and balanced structure
Barclays Non-Core
LBT £256m
RWAs £65bn
Barclaycard
PBT £366m
RWAs £40bn
Personal and Corporate Banking
PBT £787m
RWAs £123bn
Africa Banking
PBT £295m
RWAs £39bn
Investment Bank
PBT £675m
RWAs £123bn
Barclays Group
Adjusted results1
Income £6.4bn Risk weighted assets (RWA) £331bn
Impairment £(0.4bn) Average allocated equity £47bn
Operating expenses £(3.9bn) Return on average equity (RoE) 10.9%
Profit before tax £2.1bn Return on tangible equity (RoTE) 13.2%
RoE drag (3.3%)
1 Includes Head Office as part of Core, representing £6bn RWAs and £19m loss before tax |
All figures for quarter ended Q1 2015

22 | Barclays Q1 2015 Results | 29 April 2015
7.6%
(5.6%)
13.2%
0.9%
6.4%
15.5%
22.6%
14.7%
6.5%
(4.2%)
10.7%
0.5%
6.1%
11.1%
18.2%
11.1%
Adjusted return on average equity (RoE)
RoE and RoTE – Three months ended – March 2015 RoE and RoTE – Three months ended – March 2014
Personal and Corporate Banking
Investment Bank
Africa Banking
Barclaycard
Head Office impact1
Barclays Non-Core drag1
Group
Core
8.8%
(4.4%)
13.2%
(1.2%)
9.7%
14.7%
21.0%
17.1%
7.6%
(3.3%)
10.9%
(1.0%)
9.1%
10.8%
16.6%
12.9%
1 Return on average equity and average tangible equity for Head Office and Barclays Non-Core represents their impact on Barclays Core and the Group respectively. This does not represent the return on average equity and average tangible equity of Head Office or the Non-Core business |
RoTE
RoE

23 | Barclays Q1 2015 Results | 29 April 2015
Impact of costs to achieve Transform
Three months ended – March 2015
Adjusted performance measures by business Costs to achieve
Transform (£m)
Profit/(loss) before tax1
(£m)
Return on average equity1,2
(%)
Cost: income ratio1 (%)
Personal and Corporate Banking 42 829 13.6% 58%
Barclaycard 25 391 17.8% 41%
Africa Banking 6 301 11.2% 59%
Investment Bank 31 706 9.6% 68%
Head Office 5 (14) (1.0%) n/a
Total Core 109 2,213 11.6% 59%
Barclays Non-Core 11 (245) (3.4%) n/a
Group 120 1,968 8.2% 62%
1 Excluding CTA | 2 Return on average equity for Head Office and Barclays Non-Core represents their impact on Barclays Core and the Group respectively. This does not represent the return on average equity of Head Office or the Non-Core business |
24 | Barclays Q1 2015 Results | 29 April 2015
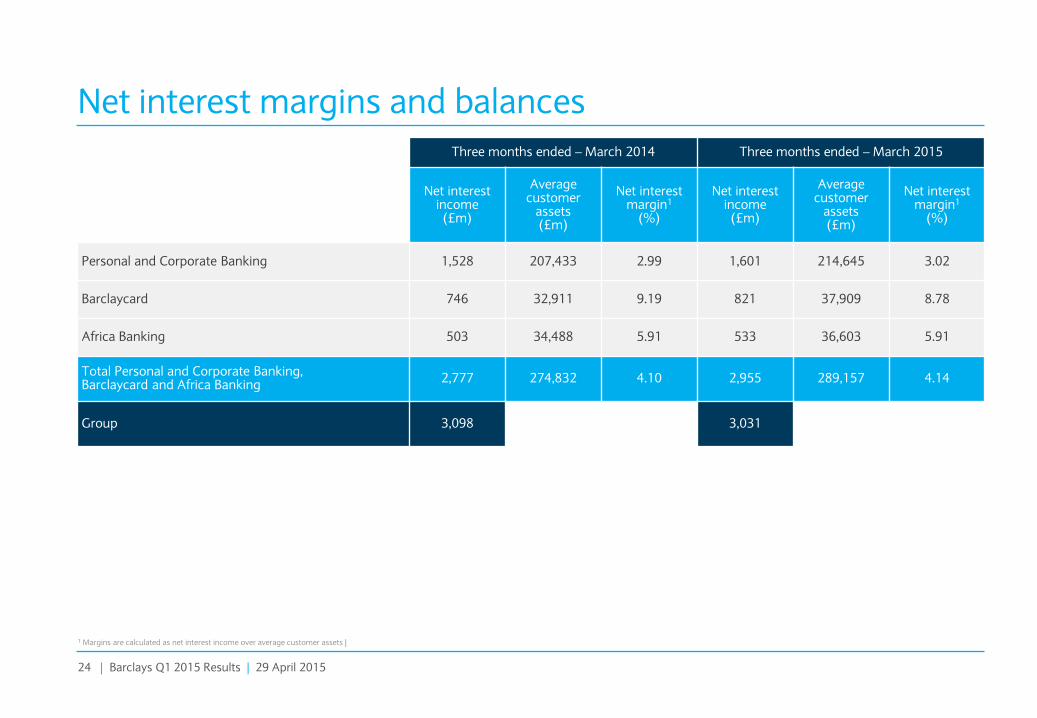
Net interest margins and balances
Three months ended – March 2014 Three months ended – March 2015
Net interest income
(£m)
Average customer
assets (£m)
Net interest margin1
(%)
Net interest income
(£m)
Average customer
assets (£m)
Net interest margin1
(%)
Personal and Corporate Banking 1,528 207,433 2.99 1,601 214,645 3.02
Barclaycard 746 32,911 9.19 821 37,909 8.78
Africa Banking 503 34,488 5.91 533 36,603 5.91
Total Personal and Corporate Banking, Barclaycard and Africa Banking
2,777 274,832 4.10 2,955 289,157 4.14
Group 3,098 3,031
1 Margins are calculated as net interest income over average customer assets |

25 | Barclays Q1 2015 Results | 29 April 2015
Tangible net asset value (pence per share) Highlights
• TNAV per share increased 3p from December 2014 to 288p, driven by:
− The strengthening of USD against GBP led to a £0.8bn increase in the currency translation reserve and a 5p per share improvement
− Adjusted profits in the quarter contributed 7p per share
− Additional provisions for investigations and litigation primarily relating to Foreign Exchange reduced TNAV by 5p per share
− Other adjusting items had a net 1p favourable impact, including the gain on valuation of the defined retirement benefit liability
− Pension related reserve movements had a 2p negative impact
− Other items which adversely impacted TNAV in the quarter include the net impact of share schemes and an increase in goodwill and intangibles
Tangible Net Asset Value
285
288 1
5
7 1 5
2
3 1
31-Dec-14 Cash flow
hedging
reserve
Currency
translation
reserve
Adjusted
profit
Provisions
primarily
relating
to FX
Other
adjusting
items
Pension
reserve
movement
Net impact
of share
schemes
Other 31-Mar-15

26 | Barclays Q1 2015 Results | 29 April 2015
18.7
16.9
c.16.3
FY13 FY14 FY15 Target
Group and Core cost targets Group cost guidance1 (£bn) Core cost target1 (£bn)
1 Excludes provisions for PPI, IRHP and FX redress, goodwill impairment and CTA | 2 2016 CTA target of c.£0.2bn |
16.4
15.1
<14.5
FY13 FY14 FY16 Target
Costs to achieve Transform (CTA)
£1.2bn c.£0.7bn2 £1.2bn
Revised Guidance = £17bn
Original Guidance = £17.5bn

27 | Barclays Q1 2015 Results | 29 April 2015
9.1% 10.3% 10.6%
>11%
Dec-13 Dec-14 Mar-15 2016
Target
Fully loaded (FL) CRD IV CET1 ratio progression1 RWA reduction (£bn)1
442
402 396 c.400
Dec-13 Dec-14 Mar-15 2016
Guidance
Continued progress on CET1 ratio despite adjusting items
• FL CRD IV CET1 ratio up 30bps demonstrating good progress towards 2016 Transform target of greater than 11%, absorbing significant litigation provisions
• Continued capital build as FL CRD IV CET1 capital grew by £0.4bn to £41.8bn, despite absorbing net adjusting items of £0.6bn
• Confident that our planned trajectory positions us well to meet future regulatory requirements
• RWAs reduced by £6bn, mainly driven by a £10bn reduction in Non-Core to £65bn including the sale of the Spanish business and the run-down of legacy structured and credit products
• Decreases in Non-Core were recycled into Core business growth
+30bps
40 41 42 CET1 Capital
(1%)
1 Based on Barclays interpretation of the final CRD IV text and latest EBA technical standards. Following the full implementation of CRD IV reporting in 2014, the previously reported 31 December 2013 RWAs were revised by £6.9bn to £442bn and fully loaded CET1 ratio by (0.2%) to 9.1% |

28 | Barclays Q1 2015 Results | 29 April 2015
RWAs (£bn) Highlights
• RWAs reduced by £6bn reflecting continued progress on the run-down of Non-Core, and growth in Core businesses
• Core business growth of £7bn driven by growth in PCB due to increased corporate and mortgage lending
• Net Non-Core run-down of £10bn, reflecting the sale of the Spanish business and reduction in legacy structures and credit products
• Model and methodology driven updates resulted in a net £5bn reduction in RWAs driven by improved market risk diversification methodology and a credit and counterparty risk model update
RWAs: Closely managed to support business growth and capital ratio accretion
1 Excludes model and methodology driven movements | 2 Includes foreign exchange movements of £0.5bn. This does not include movements for modelled counterparty risk or modelled market risk |
7
1
9
5
Dec-14 Core business
growth
BNC
run-down
Net model and
methodology
updates
Other Mar-151
396
1
1
402
2

29 | Barclays Q1 2015 Results | 29 April 2015
4.5%
7.0%
4.5%
1.6%
4.5%
Progressive implementation of CET1 requirements
Regulatory CET1 targets Key assumptions in this illustration
• CET1 minimum requirements per PRA implementation of Capital Requirements Regulation (CRR)
• Pillar 2A, met with CET1 capital, for Q1 15, is 1.6% of RWAs; subject to at least annual review. We hold it constant in 2019 for illustrative purposes
• Combined buffer requirement (and associated rules for mandatory distribution restrictions), consisting of 2.5% capital conservation buffer and 2% G-SII buffer, transitions in from 1 January 2016 at 25% per annum
• In 2019, we have assumed that the PRA buffer will be less than 4.5% combined buffer requirement; however, this may not be the case
• Countercyclical (CCCB), other systemic and sectoral buffers are currently assumed to be zero2
• Prudent internal management buffer above minimum requirement in 2019
10.6%
CRD IV regulatory minimum
Pillar 2A met with CET1 capital (varies annually)
Fully loaded combined buffer requirement, excluding CCCB
Barclays fully loaded CRD IV CET1 ratio progression
1 Being the higher of 7% PRA expectation and CRD IV capital requirements | 2 These buffers could be applied at the Group level, or at a legal entity, sub-consolidated or portfolio level |
2
c.610bps c.360bps
PRA regulatory minimum1
Mar 2015 2019
Estimated c.12%
c.150bps Management buffer

30 | Barclays Q1 2015 Results | 29 April 2015
3.0%
3.7% 3.7% >4%
Dec-13 Dec-14 Mar-15 2016Target
Leverage ratio progression1 Leverage exposure (£trn)1
Leverage ratio on track for 2016 target
• Leverage ratio at 3.7% well on track to meet 2016 Transform target of in excess of 4%
• The ratio was maintained as £0.3bn of T1 capital growth was offset by a £22bn increase in leverage exposure
• Leverage ratio already in line with expected minimum end-state requirement of 3.7% as outlined by the Financial Policy Committee
• Leverage exposure increased by £22bn in Q1 2015, mainly due to fluctuations in settlement balances
• Non-Core leverage exposure reduced by £41bn to £236bn primarily driven by the sale of the Spanish business, as well as continued reduction in derivatives exposure reflecting maturities and trade compressions
• Core leverage exposure increased by £63bn driven by an increase in loans and advances and other assets due to the seasonal increase in settlement balances
41 46 46 T1 Capital
1
BCBS 270 impact
1 Mar-15 based on end-point CRR definition of Tier 1 capital for the numerator and the CRR definition of leverage exposure as adopted by the European Union delegated act. This is broadly consistent with the BCBS 270 definition, which was the basis of Jun-14 and Dec-14 comparatives. Dec-13 not comparable to the estimates as of Jun-14 onwards due to different basis of preparation: estimated ratio and T1 capital based on PRA leverage ratio calculated as fully loaded CRD IV T1 capital adjusted for certain PRA defined deductions, and a PRA adjusted leverage exposure measure. |
1.36 1.35
1.23 1.26
Dec-13 Jun-14 Dec-14 Mar-15
31 | Barclays Q1 2015 Results | 29 April 2015
732 690 709
288 271 262
228 157 170
105
115 114
Jun-14 Dec-14 Mar-15
3.4% 3.7% 3.7%
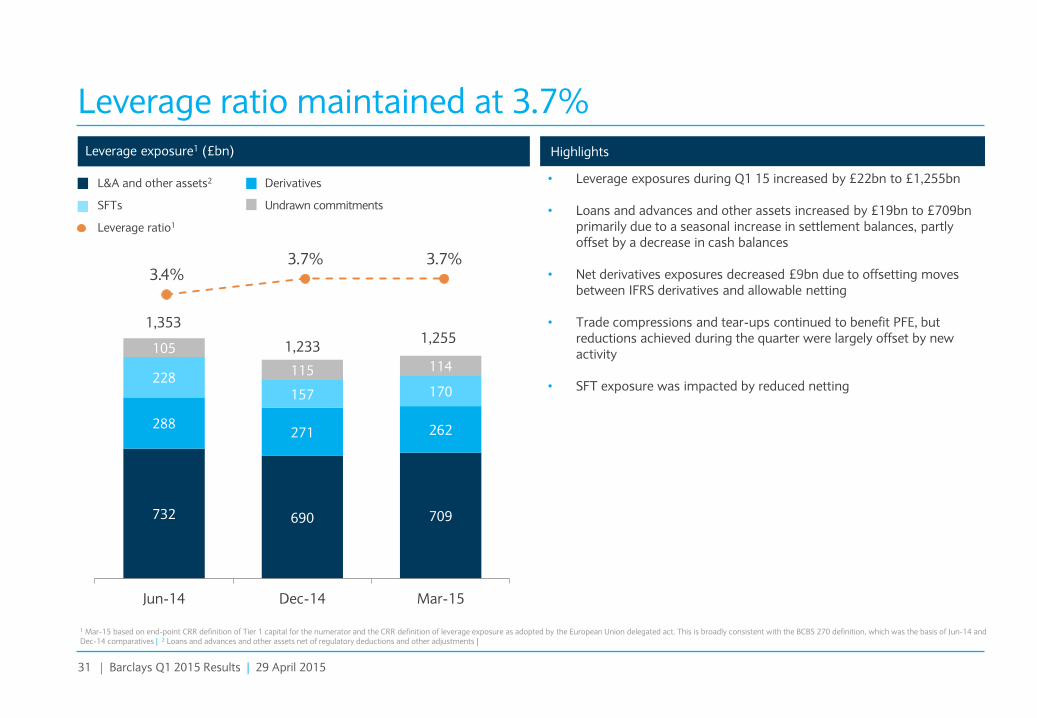
Leverage exposure1 (£bn) Highlights
Leverage ratio maintained at 3.7%
1,353
1,233
L&A and other assets2
SFTs Undrawn commitments
Derivatives
Leverage ratio1
1,255
• Leverage exposures during Q1 15 increased by £22bn to £1,255bn
• Loans and advances and other assets increased by £19bn to £709bn primarily due to a seasonal increase in settlement balances, partly offset by a decrease in cash balances
• Net derivatives exposures decreased £9bn due to offsetting moves between IFRS derivatives and allowable netting
• Trade compressions and tear-ups continued to benefit PFE, but reductions achieved during the quarter were largely offset by new activity
• SFT exposure was impacted by reduced netting
1 Mar-15 based on end-point CRR definition of Tier 1 capital for the numerator and the CRR definition of leverage exposure as adopted by the European Union delegated act. This is broadly consistent with the BCBS 270 definition, which was the basis of Jun-14 and Dec-14 comparatives | 2 Loans and advances and other assets net of regulatory deductions and other adjustments |

32 | Barclays Q1 2015 Results | 29 April 2015
• Proactive transition towards a HoldCo funding and capital model positions us well to meet potential future TLAC requirements
• While requirements remain to be set, Barclays current expectation is a multi-year conformance period
• Majority portion of OpCo term senior unsecured debt maturing before 2019 which can be refinanced from HoldCo
• Based on Barclays current interpretation of TLAC requirements, proxy TLAC ratio at 24%4 on the assumption that Barclays Bank PLC term non-structured senior unsecured debt is refinanced from HoldCo and subordinated to OpCo excluded liabilities
• Currently do not intend to use HoldCo senior unsecured debt proceeds to subscribe for OpCo liabilities on a subordinated basis until required to do so
• The future TLAC-ratio will further benefit from CET1 capital growth and AT1 issuance towards end-state expectations
• As TLAC rules are finalised, and as we approach implementation date, we will assess the appropriate composition and quantum of our future TLAC stack
Proxy Total Loss Absorbing Capacity (TLAC)1
(£bn) Mar-15
PRA transitional Common Equity Tier 1 capital 42
PRA transitional Additional Tier 1 regulatory capital 11
Barclays PLC (HoldCo) 4
Barclays Bank PLC (OpCo) 7
PRA transitional Tier 2 regulatory capital 14
Barclays PLC (HoldCo) 1
Barclays Bank PLC (OpCo) 13
PRA transitional total regulatory capital 67
HoldCo term non-structured senior unsecured debt2 4
OpCo term non-structured senior unsecured debt3 26
Total term non-structured senior unsecured debt 97
RWAs 396
Leverage exposure 1,255
Proxy risk-weighted TLAC ratio ~ 24%
Proxy leverage based TLAC ratio ~ 8%
1 For illustrative purposes only reflecting Barclays interpretation of the FSB Consultative Document on “Adequacy of loss-absorbing capacity of global systemically important banks in resolution”, published 10 November 2014, including certain assumptions on the inclusion or exclusion of certain liabilities where further regulatory guidance is necessary. Evolving regulation, including the implementation of MREL beginning 1 Jan 2016 and any subsequent regulatory policy interpretations, may require a change to the current approach | 2 Barclays PLC issued senior unsecured term debt assumed to qualify for consolidated TLAC purposes I 3 Comprise all outstanding Barclays Bank PLC issued public and private term senior unsecured debt, regardless of residual maturity. This excludes £35bn of notes issued under the structured notes programmes | 4 Including the 4.5% combined buffer requirement which needs to be met in CET1. The combined buffer requirement comprises a 2% G-SII buffer and 2.5% capital conservation buffer on a fully phased in basis.

33 | Barclays Q1 2015 Results | 29 April 2015
Balance sheet
2014 Q1 15
Notes £m £m
Assets
Investment in subsidiary 33,743 33,743
Loans and advances to subsidiary 2,866 4,927
Derivative financial instrument 313 232
Other assets 174 1,221
Total assets 37,096 40,123
Liabilities
Deposits from banks 528 561
Subordinated liabilities 810 839
Debt securities in issue 2,056 4,088
Other liabilities 10 453
Total liabilities 3,404 5,941
Shareholders’ equity
Called up share capital 4,125 4,179
Share premium account 16,684 17,202
Other equity instruments 4,326 4,326
Capital redemption reserve 394 394
Retained earnings 8,163 8,081
Total shareholders’ equity 33,692 34,182
Total liabilities and shareholders’ equity 37,096 40,123
Barclays PLC parent company balance sheet Notes
• Barclays PLC is the holding company (HoldCo) of the Barclays Group
• The HoldCo’s primary assets currently are its investments in, and loans and advances made to, its sole subsidiary, Barclays Bank PLC, the operating company (OpCo)
• As Barclays is committed to issuing most capital and term senior unsecured debt out of the HoldCo going forward, the HoldCo balance sheet is expected to increase
Barclays PLC parent company accounts
Notes to the parent company balance sheet Investment in subsidiary The investment in subsidiary of £33,743m (2014: £33,743m) represents investments made into Barclays Bank PLC, including £4,326m (2014: £4,326m) of Additional Tier 1 (AT1) securities. Loans and advances to subsidiary and debt securities in issue During the quarter, Barclays PLC issued £2,032m equivalent of Fixed Rate Senior Notes accounted for as debt securities in issue. The proceeds raised through these transactions were used to make £2,032m equivalent of Fixed Rate Senior Loans to Barclays Bank PLC, with a ranking corresponding to the notes issued by Barclays PLC.
34 | Barclays Q1 2015 Results | 29 April 2015
Barclays'
'target' end-state
capital structure
Barclays Q1 15
capital structure
(PRA Transitional)
10.6% (£41.8bn)
CET1
1.1% (£4.2bn) AT1
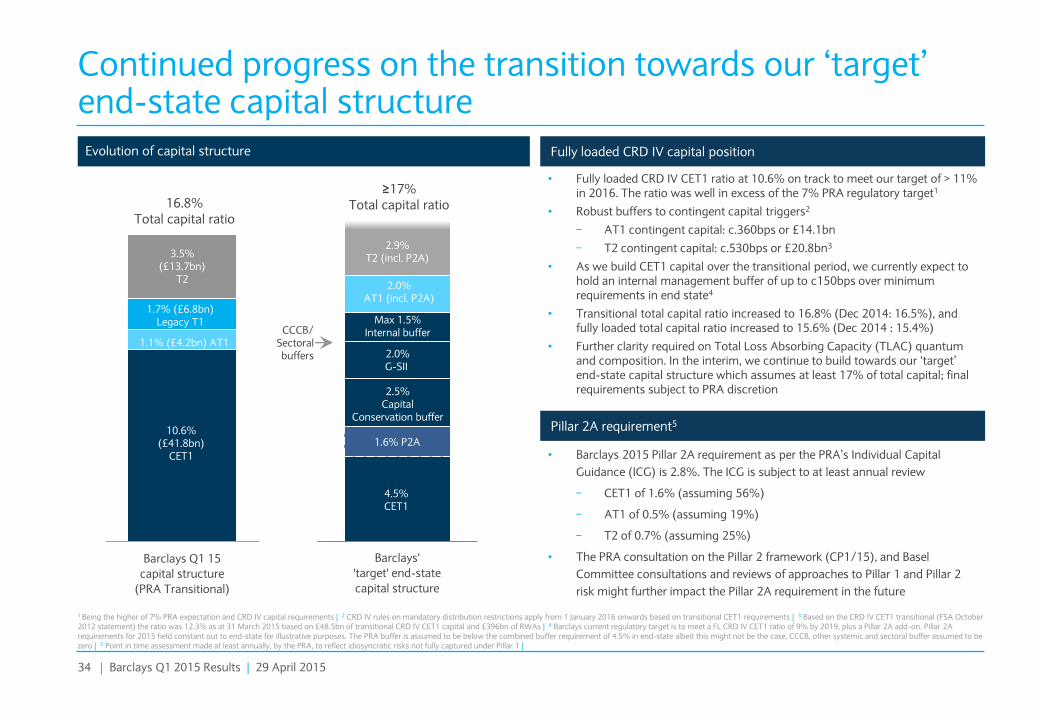
Continued progress on the transition towards our ‘target’ end-state capital structure
Evolution of capital structure Fully loaded CRD IV capital position
• Fully loaded CRD IV CET1 ratio at 10.6% on track to meet our target of > 11% in 2016. The ratio was well in excess of the 7% PRA regulatory target1
• Robust buffers to contingent capital triggers2
− AT1 contingent capital: c.360bps or £14.1bn
− T2 contingent capital: c.530bps or £20.8bn3
• As we build CET1 capital over the transitional period, we currently expect to hold an internal management buffer of up to c150bps over minimum requirements in end state4
• Transitional total capital ratio increased to 16.8% (Dec 2014: 16.5%), and fully loaded total capital ratio increased to 15.6% (Dec 2014 : 15.4%)
• Further clarity required on Total Loss Absorbing Capacity (TLAC) quantum and composition. In the interim, we continue to build towards our ‘target’ end-state capital structure which assumes at least 17% of total capital; final requirements subject to PRA discretion
• Barclays 2015 Pillar 2A requirement as per the PRA’s Individual Capital
Guidance (ICG) is 2.8%. The ICG is subject to at least annual review
− CET1 of 1.6% (assuming 56%)
− AT1 of 0.5% (assuming 19%)
− T2 of 0.7% (assuming 25%)
• The PRA consultation on the Pillar 2 framework (CP1/15), and Basel
Committee consultations and reviews of approaches to Pillar 1 and Pillar 2
risk might further impact the Pillar 2A requirement in the future
3.5% (£13.7bn)
T2
≥17% Total capital ratio
CCCB/ Sectoral buffers
16.8% Total capital ratio
1.6% P2A
Pillar 2A requirement5
4.5% CET1
1.7% (£6.8bn) Legacy T1
1 Being the higher of 7% PRA expectation and CRD IV capital requirements | 2 CRD IV rules on mandatory distribution restrictions apply from 1 January 2016 onwards based on transitional CET1 requirements | 3 Based on the CRD IV CET1 transitional (FSA October 2012 statement) the ratio was 12.3% as at 31 March 2015 based on £48.5bn of transitional CRD IV CET1 capital and £396bn of RWAs | 4 Barclays current regulatory target is to meet a FL CRD IV CET1 ratio of 9% by 2019, plus a Pillar 2A add-on. Pillar 2A requirements for 2015 held constant out to end-state for illustrative purposes. The PRA buffer is assumed to be below the combined buffer requirement of 4.5% in end-state albeit this might not be the case. CCCB, other systemic and sectoral buffer assumed to be zero | 5 Point in time assessment made at least annually, by the PRA, to reflect idiosyncratic risks not fully captured under Pillar 1 |
2.5% Capital
Conservation buffer
Max 1.5% Internal buffer
2.0% AT1 (incl. P2A)
2.9% T2 (incl. P2A)
2.0% G-SII

35 | Barclays Q1 2015 Results | 29 April 2015
Capital resources1
1 The Capital Requirements Regulation and Capital Requirements Directive implemented Basel 3 within the EU (collectively known as CRD IV) on 1 January 2014. The rules are supplemented by Regulatory Technical Standards and the PRA’s rulebook, including the implementation of transitional rules | 2 The CRD IV CET1 ratio (FSA October 2012 transitional statement) as applicable to Barclays’ Tier 2 Contingent Capital Notes was 12.3% based on £48.5bn of transitional CRD IV CET1 capital and £396bn RWAs |
(£m) 31 December 2014 31 March 2015
Shareholders' equity (excluding non controlling interests) per the balance sheet 59,567 60,693
Less: other equity instruments (recognised as AT1 capital) (4,322) (4,323)
Adjustment to retained earnings for foreseeable dividends (615) (981)
Minority interests (amount allowed in consolidated CET1) 1,227 1,249
Other regulatory
adjustments and
deductions
Additional value adjustments (PVA) (2,199) (1,984)
Goodwill and intangible assets (8,127) (8,255)
Deferred tax assets that rely on future profitability excluding temporary differences (1,080) (1,180)
Fair value reserves related to gains or losses on cash flow hedges (1,814) (2,029)
Negative amounts resulting from the calculation of expected loss amounts (1,772) (1,727)
Gains or losses on liabilities at fair value resulting from own credit 658 497
Direct and indirect holdings by an institution of own CET1 instruments (25) (56)
Other regulatory adjustments (45) (72)
Fully loaded Common Equity Tier 1 capital 41,453 41,833
Regulatory adjustments relating to unrealised gains (583) -
PRA Transitional Common Equity Tier 1 capital 40,870 41,833
CRD IV RWAs 401,900 395,899
Fully Loaded Common Equity Tier 1 ratio 10.3% 10.6%
PRA Transitional Common Equity Tier 1 ratio2 10.2% 10.6%

36 | Barclays Q1 2015 Results | 29 April 2015
Leverage exposure
(£bn) Leverage exposure1
31 December 2014 31 March 2015
Derivative financial instruments 440 480
Cash collateral 73 80
Reverse repurchase agreements 132 124
Loans and advances and other assets 713 732
Total IFRS assets 1,358 1,416
Regulatory consolidation adjustments (8) (8)
Derivatives netting (395) (436)
Adjustments to cash collateral (53) (63)
Net written credit protection 27 25
Potential Future Exposure on derivatives 179 176
Total derivatives adjustments (242) (298)
Securities financing transactions adjustments 25 46
Regulatory deductions and other adjustments (15) (15)
Weighted off balance sheet commitments 115 114
Total fully loaded leverage exposure 1,233 1,255
CRD IV Common Equity Tier 1 capital 41.5 41.8
CRD IV Additional Tier 1 capital 4.6 4.5
CRD IV Tier 1 capital 46.0 46.3
Fully loaded leverage ratio 3.7% 3.7%
1 Calculated based on end-point CRR definition of Tier 1 capital for the numerator and the CRR definition of leverage exposure as adopted by the European Union delegated act. This is broadly consistent with the BCBS 270 definition, which was the basis of Dec-14 comparatives |

37 | Barclays Q1 2015 Results | 29 April 2015
High quality liquidity pool (£bn) Key messages
• Stable liquidity position with the Group liquidity pool maintained at £148bn, providing a surplus to internal and external minimum requirements
• Quality of the pool remains high:
− 81% held in cash, deposits with central banks and high quality government bonds
− 94% of government bonds are securities issued by UK, US, Japanese, French, German, Danish, Swiss and Dutch sovereigns
• Even though not a regulatory requirement, the size of our liquidity pool is over 1.8x that of wholesale debt maturing in less than a year
• Additional significant sources of contingent funding in the form of high quality assets pre-positioned with central banks globally
Maintaining a robust liquidity position, with pool well in excess of internal and external minimum requirements
43 37 31
62 85 88
22
27 29
Dec-13 Dec-14 Mar-15
Cash & Deposits at Central Banks Government Bonds Other Available Liquidity
148
Estimated CRD IV/Basel 3 liquidity ratios
Metric Dec-14 Mar-15 Expected 100%
requirement date
LCR1 124% 122% 1 January 2018
Surplus £30bn £28bn
NSFR2 102% n/a 1 January 2018
Surplus to 30-day Barclays-specific LRA (as at 31 December14)
2013 2014
LRA 104% 124%
Surplus £5bn £29bn
149
127
1 LCR estimated based on the EU delegated act | 2 Estimated based on the final BCBS rules published in October 2014 |

38 | Barclays Q1 2015 Results | 29 April 2015
Broadly self-funded retail businesses1(£bn)
• Group Loan to Deposit Ratio (LDR) and the LDR for PCB, Barclaycard and Africa Banking at 101% and 89% respectively1
• Excess customer deposits in PCB, Barclaycard and Africa Banking predominantly used to fund the liquidity buffer requirements for these businesses, making them broadly self funded
• Overall funding requirements for the Group reducing as Non-Core assets are run down
Total funding (excluding BAGL, as at 31 December 14)
• We guided to issuance of a gross amount of £10-15bn in 2015 across public and private senior unsecured, secured and subordinated debt. This is materially below term maturities of £23bn in 2015, of which £14bn remaining this year
• In Q1 15, we issued £4bn publicly against this plan, including $3bn of senior unsecured debt from the HoldCo in two transactions, a £1bn covered bond from Barclays Bank PLC, and a $500m US cards securitisation from Barclays Bank Delaware
• We intend to maintain access to diverse sources of wholesale funding, through different products, currencies, maturities and channels
• We expect to be a regular issuer of AT1 securities over the next few years
We maintain access to stable and diverse sources of funding, across customer deposits and wholesale debt
Key messages
2015 Funding Plan
351 349 347 321 309 310
200
220
240
260
280
300
320
340
360
Dec-13 Dec-14 Mar-15
Deposits from customersRetail LDR L&A to customers
62% 61% 62%
4% 4% 4% 7% 7% 8% 14% 14% 13% 14% 13% 13%
2013 H1 14 2014
£508bn £522bn £521bn
Customer deposits Sub. debt Secured term funding
Short-term debt and other deposits Unsecured term funding
1 LDR for PCB, Barclaycard, Africa Banking and Non-Core retail |
91% 89% 89%
Recommended