1
Bacterial production and the cycling of DOC
What is bacterial production and how is it measured?
How is bacterial production related to DOC cycling?
What fraction of DOC do bacteria degradeand where does this DOC come from?
How is recalcitrant DOC degraded?
Reactivity and the cycling of DOC in seawater
Semi-reactive DOCΔ14C=modern
Non
reac
tive
DO
CΔ1
4 C =
ver
y ol
d
Very reactive DOCΔ14C=DIC
Carlson and Ducklow, DSR II v 42; 639-656
0o and 140 oW
Heterotrophic microbial production ??

2
CH3
O
HO
CH2 CH2
Humic substances ProteinsPolysaccharidesBiopolymers…80-90% of cell C-N-P
O
-C-N-O
-C-N-O
-C-N-
O
-C-N-O
-C-N-O
-C-N-
Free amino acidsSimple sugarsUrea…etc.10-20% of cell C-N-P
Non-reactive DOM Semi-reactive DOM Very reactive DOM
Humic substances ProteinsPolysaccharidesBiopolymers…80-90% of cell C-N-P
Free amino acidsSimple sugarsUrea…etc.10-20% of cell C-N-P
Non-reactive DOM Semi-reactive DOM Very reactive DOM
Inventory = 650 GT C 30-50 GT C 0.1- 1 GT C
Concentration = 40 µM 25-40 µM 100 nm-1µM (?)
Δ14C= -400 to -600‰ Δ14C= +70-90‰ (?) Δ14C= +70-90‰
Annual flux = 0.1 GTC Moderate to large ? Large?

3
CO2 + Nuts (N, P, Si)
Phytoplankton(PP)
grazers(g)
Grazers(G)
The marine food chain circa 1960s(when life was simple)
Carbon flowNutrient flow
CO2 + Nuts (N, P, Si)
Phytoplankton(PP)
grazers(g)
Grazers(G)
The marine food web circa 1980Introduction of the “microbial loop” concept
DOC
Bacteriagrazers
(g)
Carbon flowNutrient flow

4
CO2 + Nuts (N, P, Si)
Phytoplankton(PP)
grazers(g)
Grazers(G)
The marine food web circa >1990s
DOC
BacteriaViruses
Viruses
grazers(g)
Carbon flowNutrient flowgrazers
(g)
What is bacterial production?
gross production = total carbon taken up by bacteria, it is used in thesynthesis of new biomass, and includes both the new biomass and
carbon respired during biomass production.
net production = new bacterial biomass over a set period of time. Bacterial production measurements almost always measure net production.
Gross production = net production + respiration
Gross production is also referred to as bacterial carbon demand (BCD)and is related to net production through the growth efficiency or fractional
growth yield:
Gross production = (net production) x (growth yield)

5
How is bacterial production measured?
1) Increase in the number of cells over time
2) 3H-adenine incorporation (DNA synthesis)
3) 3H-thymidine incorporation (DNA synthesis)
4) 3H-leucine incorporation (protein synthesis)
All methods measure net production only (!!!) and require empirically derived conversion factors. Need bacterial growthefficiencies to determine gross production (BCD)
6
Comparison of bacterial and primary production in different ocean basins
BATS DOC (µM C)
Hansell and Carlson
7
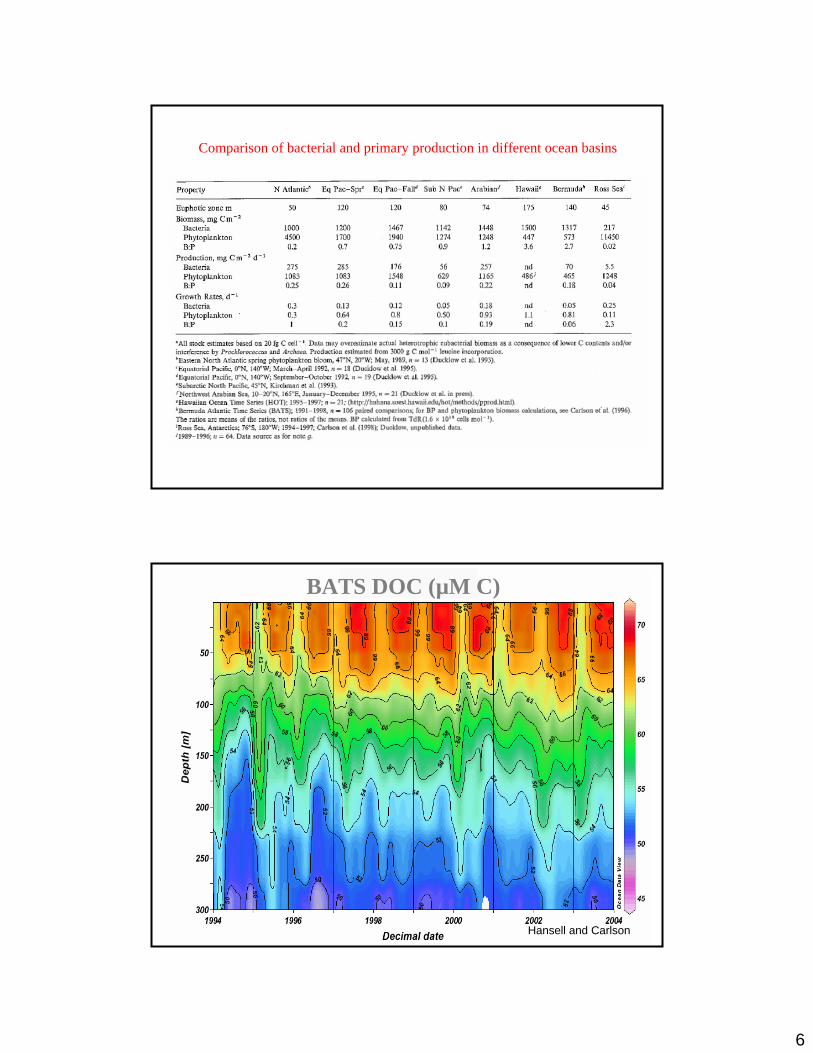
BATS DOC (µM C)
Hansell and Carlson
DO13C
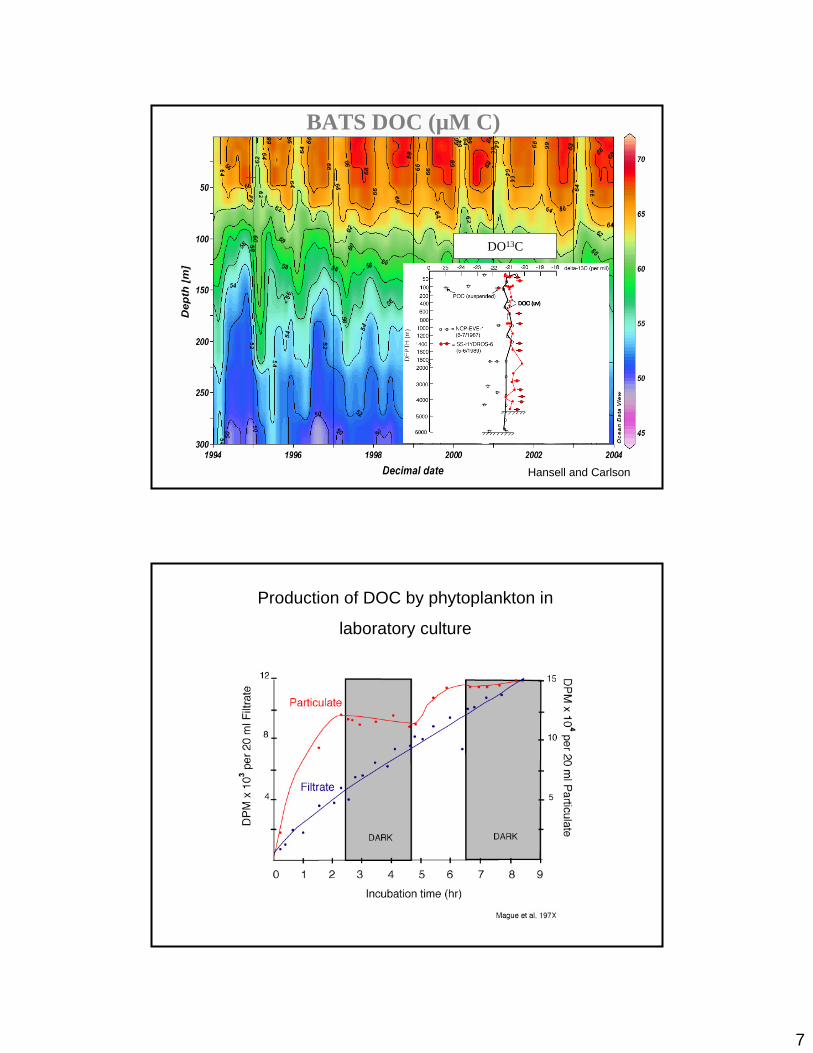
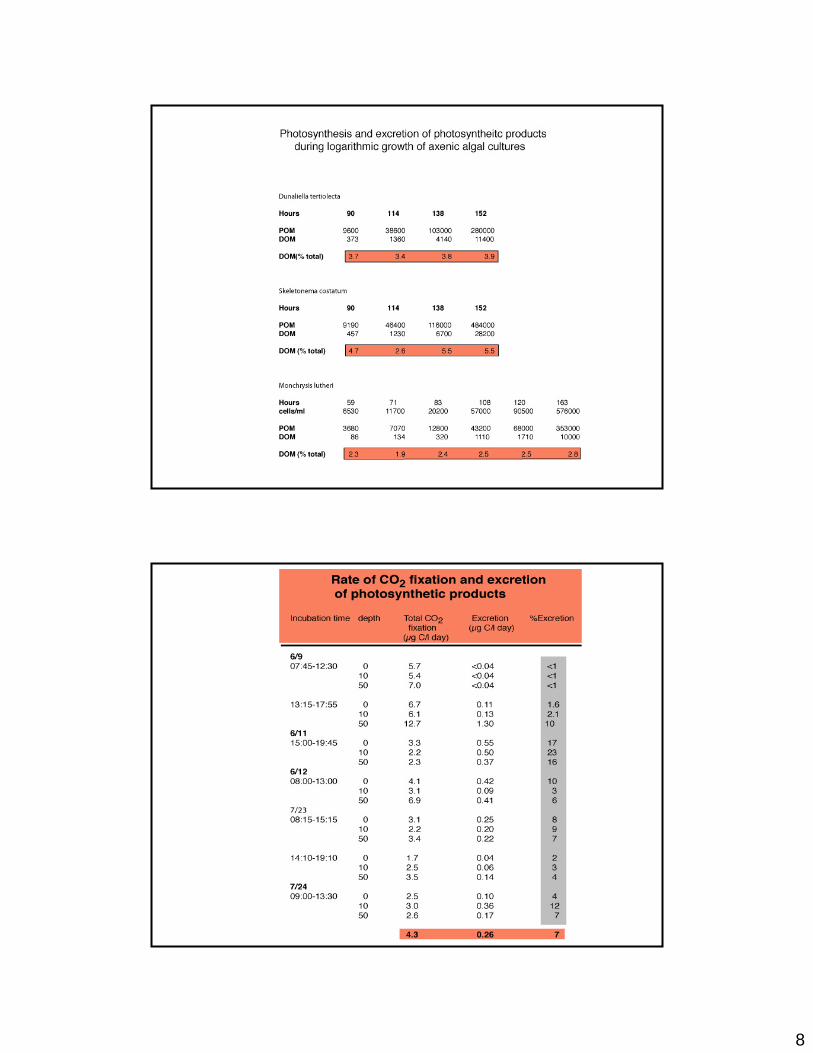
Production of DOC by phytoplankton in
laboratory culture
8

9
Production of DOC during grazing by macrozooplankton
Viruses in seawater- can be host specific infecting both eukaryotesand prokaryotes. They cause the cells to burst and release DOM
Large cells are procaryotes about 0.5 µm in diameter labeled with sybergreen.Small cells are viruses. From Jed Furhman’s lab at USC (furhmanlab.usc.edu)
10
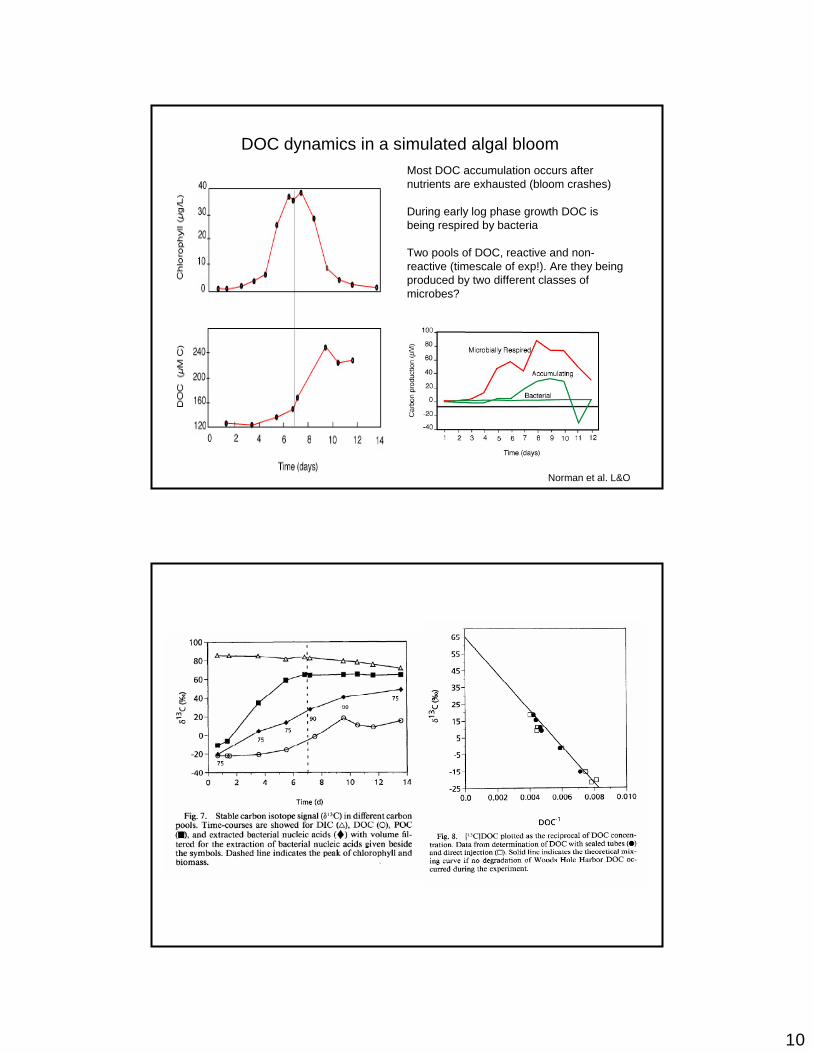
DOC dynamics in a simulated algal bloomMost DOC accumulation occurs after nutrients are exhausted (bloom crashes)
During early log phase growth DOC is being respired by bacteria
Two pools of DOC, reactive and non-reactive (timescale of exp!). Are they being produced by two different classes of microbes?
Norman et al. L&O
11
CO2
O2
DOCr DOCsr
DOCsr
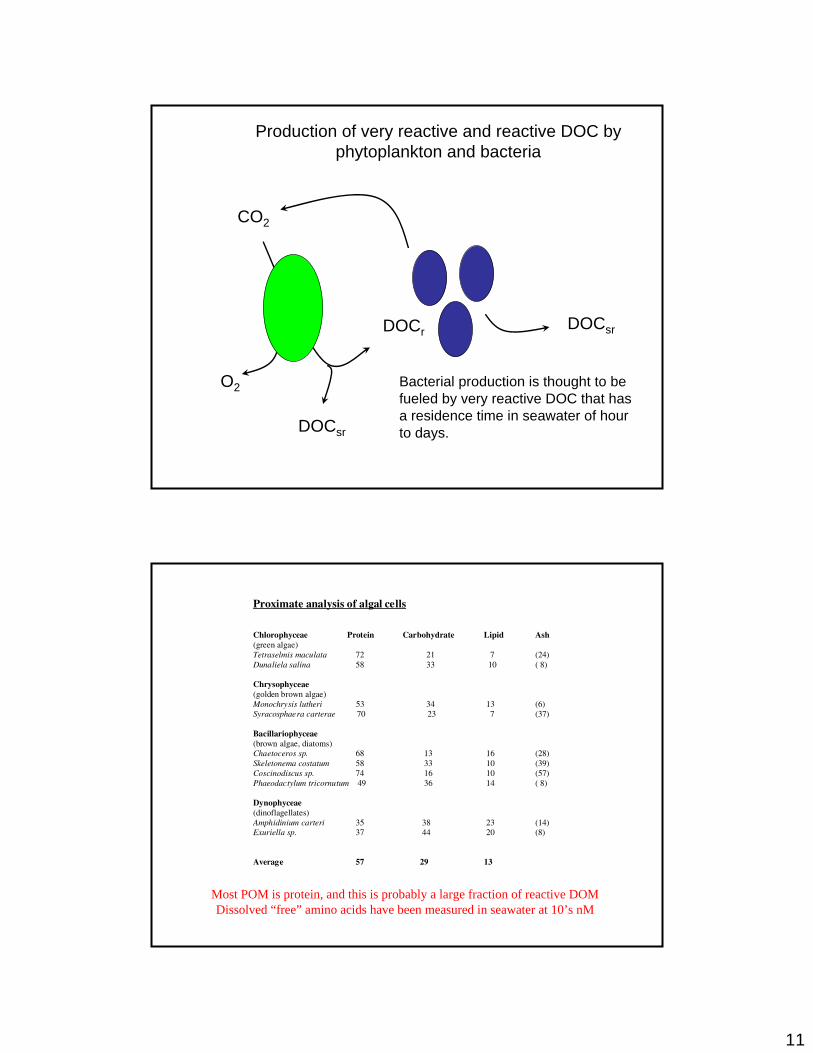
Production of very reactive and reactive DOC byphytoplankton and bacteria
Bacterial production is thought to be fueled by very reactive DOC that has a residence time in seawater of hour to days.
Proximate analysis of algal cells
Chlorophyceae Protein Carbohydrate Lipid Ash(green algae)Tetraselmis maculata 72 21 7 (24)Dunaliela salina 58 33 10 ( 8)
Chrysophyceae(golden brown algae)Monochrysis lutheri 53 34 13 (6)Syracosphaera carterae 70 23 7 (37)
Bacillariophyceae(brown algae, diatoms)Chaetoceros sp. 68 13 16 (28)Skeletonema costatum 58 33 10 (39)Coscinodiscus sp. 74 16 10 (57)Phaeodactylum tricornutum 49 36 14 ( 8)
Dynophyceae(dinoflagellates)Amphidinium carteri 35 38 23 (14)Exuriella sp. 37 44 20 (8)
Average 57 29 13
Most POM is protein, and this is probably a large fraction of reactive DOMDissolved “free” amino acids have been measured in seawater at 10’s nM

12
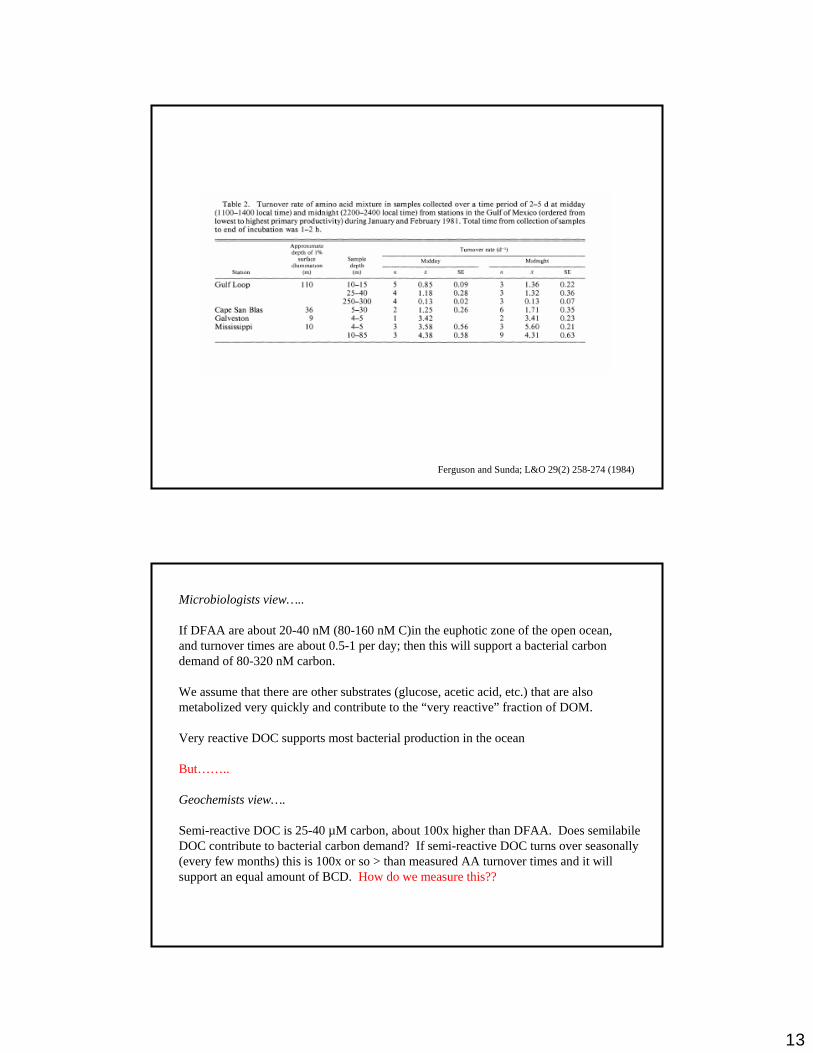
Ferguson and Sunda; L&O 29(2) 258-274 (1984)
Measuring the uptake of DFAA using tritiated AA
Seawater(DFAA)
Particulate *AA
1) Add 0.1-1 nM tritiated (*) AA2) Incubate 1-4 hr
Measure total DFAA (typically 30-50 nM)
count filter count filtrate
count residue(respired AA)
Ferguson and Sunda; L&O 29(2) 258-274 (1984)
13
Ferguson and Sunda; L&O 29(2) 258-274 (1984)
Microbiologists view…..
If DFAA are about 20-40 nM (80-160 nM C)in the euphotic zone of the open ocean,and turnover times are about 0.5-1 per day; then this will support a bacterial carbondemand of 80-320 nM carbon.
We assume that there are other substrates (glucose, acetic acid, etc.) that are alsometabolized very quickly and contribute to the “very reactive” fraction of DOM.
Very reactive DOC supports most bacterial production in the ocean
But……..
Geochemists view….
Semi-reactive DOC is 25-40 µM carbon, about 100x higher than DFAA. Does semilabileDOC contribute to bacterial carbon demand? If semi-reactive DOC turns over seasonally (every few months) this is 100x or so > than measured AA turnover times and it willsupport an equal amount of BCD. How do we measure this??

14
…the SAR11 clade represents as much as 50% of the total surface communityand 25% of the subeuphotic microbial community…The biogeochemical role
of SAR 11 clade remains uncertain……”
15
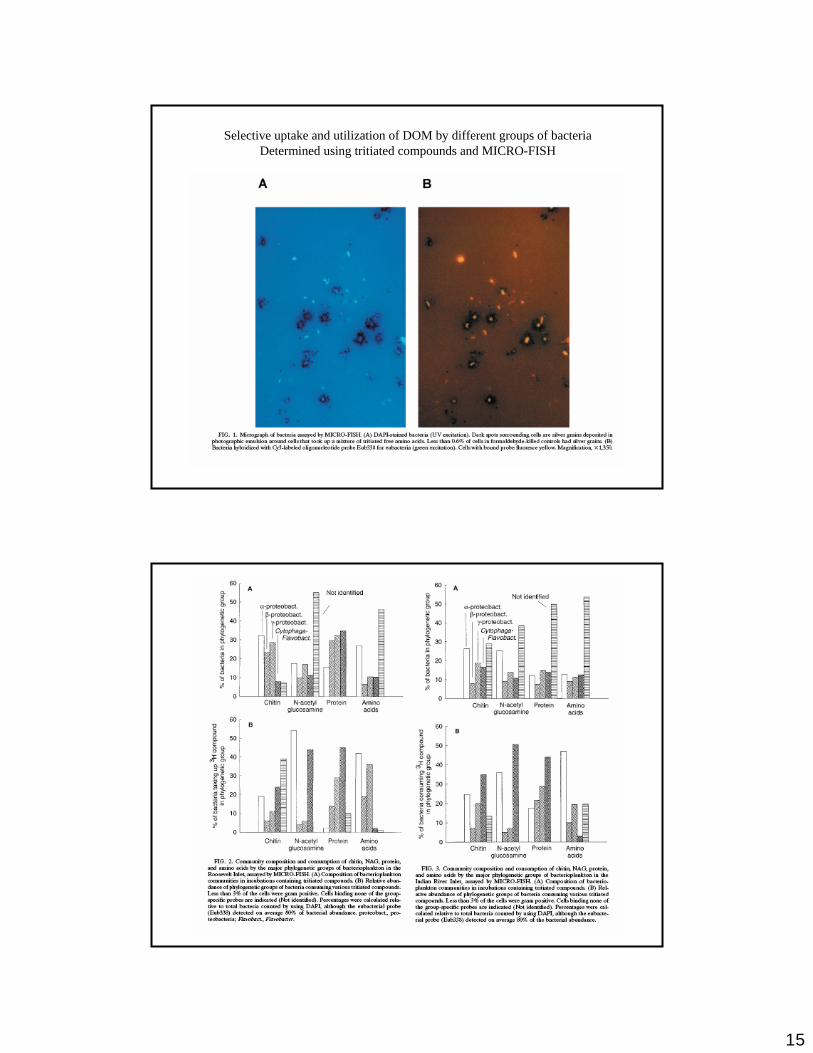
Selective uptake and utilization of DOM by different groups of bacteriaDetermined using tritiated compounds and MICRO-FISH

16
• Shelf– depths < 60 m
• Slope– depths < 445 m
• Offshore– depths < 2900 m
Sampling off the Oregon coast
Krista Longnecker et al, AEM; 2005, 2006; DSR 2006
Krista Longnecker et al, AEM; 2005, 2006; DSR 2006

17
Shelf Slope Basin
Abundance of leucine assimilatingProkaryotes in the upper 50m of the water
column using MICRO-FISH
Krista Longnecker et al, AEM; 2005, 2006; DSR 2006
Who are the Bacteria?
K. Longnecker, B. F. Sherr and E. B. Sherr (2005). Activity and phylogenetic diversity of bacterial cells with high and low nucleic acid content and electron transport system activity in an upwelling ecosystem. Applied and Environmental Microbiology. 71(12):7737-7749.
18
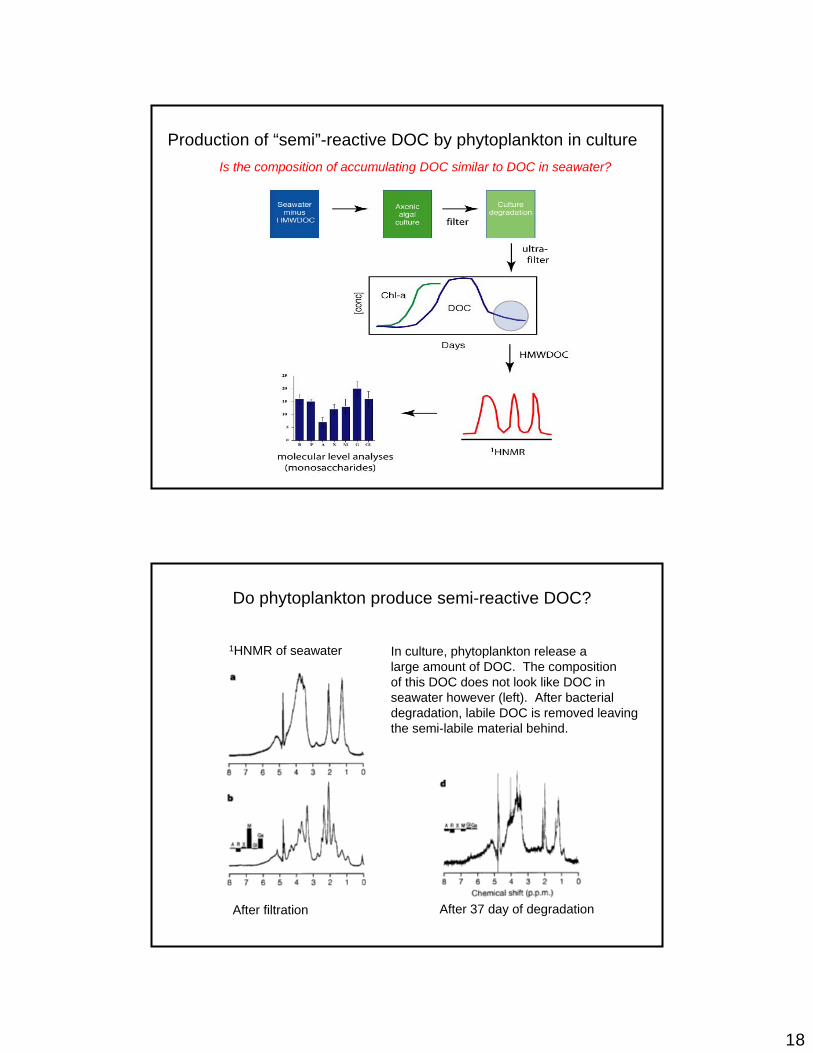
Production of “semi”-reactive DOC by phytoplankton in cultureIs the composition of accumulating DOC similar to DOC in seawater?
1HNMR of seawater
After filtration After 37 day of degradation
Do phytoplankton produce semi-reactive DOC?
In culture, phytoplankton release alarge amount of DOC. The compositionof this DOC does not look like DOC inseawater however (left). After bacterialdegradation, labile DOC is removed leavingthe semi-labile material behind.

19
The effect of bacterial community structure on DOM degradation
Each year DOC is produced in the surface water during the spring/summerand exported into the mesopelagic ocean, where it is degraded. Why is it
Degraded in the mesopelagic ocean?
Surface seawater
Surface bacteria
Deep seawater
Deep bacteria
Measure DOC degradation and bacterial growth
50
55
60
65
70
150
55
60
65
70
1
50
55
60
65
70
1
Carlson et al. L&O 2004
Cel
l C (µ
mol
/L)
0
0.05
0.1
0.15
0.2
0.25
0.3
1 2 3 4 5 6 7 8 9 10 11 12
0
0.05
0.1
0.15
0.2
0.25
0.3
1 2 3 4 5 6 7 8 9 10 11 12
Day
Surface water/surface inoculum
Deep water/deep inoculum
Surface water/deep inoculum
Surface/surface Deep/deep
Surface/deep
In situ
0 days
7 days
37 daysCel
l C (µ
mol
/L)
The effect of bacterial community structure on DOM degradation
20
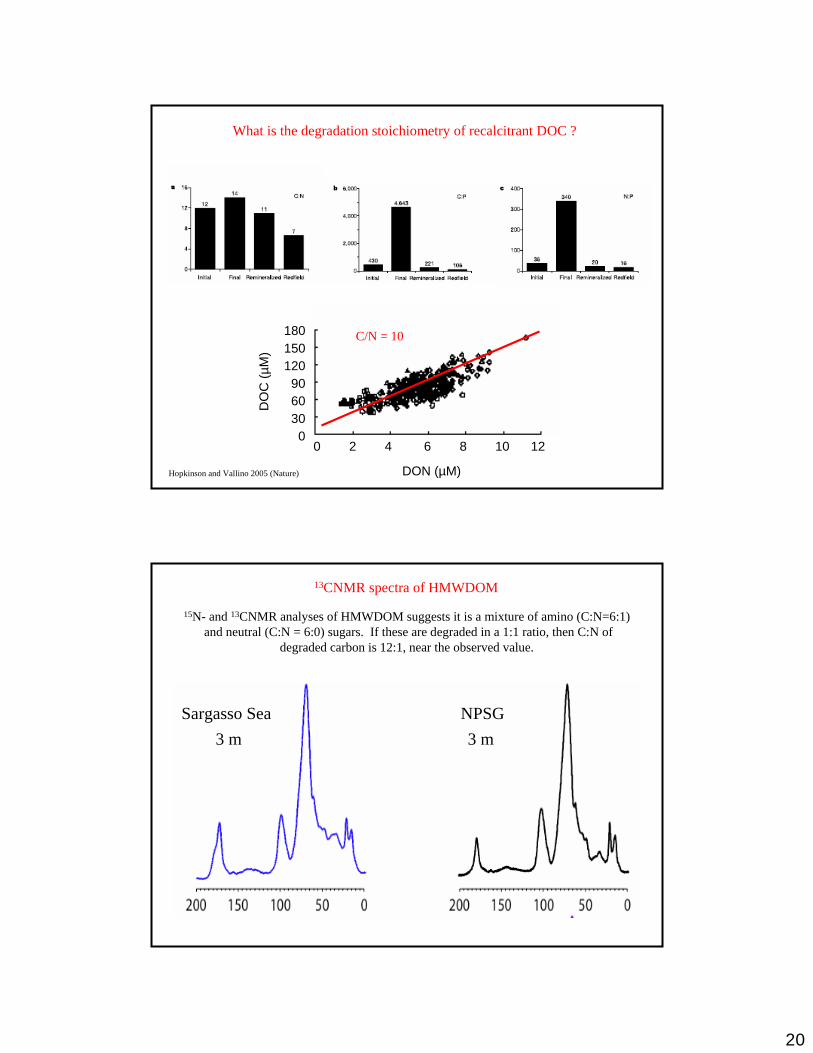
What is the degradation stoichiometry of recalcitrant DOC ?
1801501209060300
DO
C (µ
M)
0 2 4 6 8 10 12
DON (µM)
C/N = 10
Hopkinson and Vallino 2005 (Nature)
3 m 3 mSargasso Sea NPSG
13CNMR spectra of HMWDOM
15N- and 13CNMR analyses of HMWDOM suggests it is a mixture of amino (C:N=6:1)and neutral (C:N = 6:0) sugars. If these are degraded in a 1:1 ratio, then C:N of
degraded carbon is 12:1, near the observed value.

21
Summary
DOC serves as the substrate for heterotrophic bacterial production in the ocean.
Bacterial (net) production (BP) is measured through the uptake of tritiated substratesor from changes in bacterial cell numbers- large uncertainties (10x) in BP, BCD, GE.
On average BP = 15-20% of PP, or about 10-15 GT C yr-1. At least this amountof carbon must be processed through the microbial loop.
BP measurements are intimately coupled to protein synthesis, and it is believed thatBP production is fueled through the uptake of very reactive DOM (free amino acids,
peptides, small sugars, urea, etc.).
Very reactive DOM is introduced into the water column via direct release,grazing,viral lysis, etc.
The role of semi-reactive DOM in BP production is not clear. We still don’t knowHow quickly it is cycled, how it impacts bacterial diversity, or how it is degraded.
Recommended