Oregon Public Utility Commission
Attn: Filing Center
P.O. Box 1088
Salem, OR 97308-1088
RE: UM 1354 –
Dear Filing Center:
Enclosed for filing please find
Corporation d/b/a CenturyLink QC’s Reply Testimony of
Victoria M. Hunnicutt, along with a certificate of service
Confidential pages 11 and 12 , and Exhibit CTL/201, of Mr. Felz’s
Testimony are printed on yellow paper and will be provided on hard copy, and
sent via U.S. Mail.
If you have any questions, please contact me at your earliest convenience.
Enclosures
cc: Service List
310 SW Park Ave., 11
April 23, 2014
Oregon Public Utility Commission
– Price Plan
Enclosed for filing please find an original and five (5) copies of Qwest
Corporation d/b/a CenturyLink QC’s Reply Testimony of John M. Felz
along with a certificate of service.
Confidential pages 11 and 12 , and Exhibit CTL/201, of Mr. Felz’s
Testimony are printed on yellow paper and will be provided on hard copy, and
If you have any questions, please contact me at your earliest convenience.
Sincerely,
Carla M. Butler
Paralegal
310 SW Park Ave., 11th Flr.
Portland, OR 97205
Tel. 503.242.5420
Fax. 503.242.8589
CARLA M. BUTLER
an original and five (5) copies of Qwest
John M. Felz and
Confidential pages 11 and 12 , and Exhibit CTL/201, of Mr. Felz’s
Testimony are printed on yellow paper and will be provided on hard copy, and
If you have any questions, please contact me at your earliest convenience.

BEFORE THE PUBLIC UTILITY COMMISSION OF OREGON
DOCKET NO. UM 1354
In the Matter of the Petition of QWEST
CORPORATION d/b/a CenturyLink QC for
Approval of Price Plan Pursuant to ORS 759.255
REPLY TESTIMONY
OF
JOHN M. FELZ
ON BEHALF OF
CENTURYLINK QC
APRIL 23, 2014
i
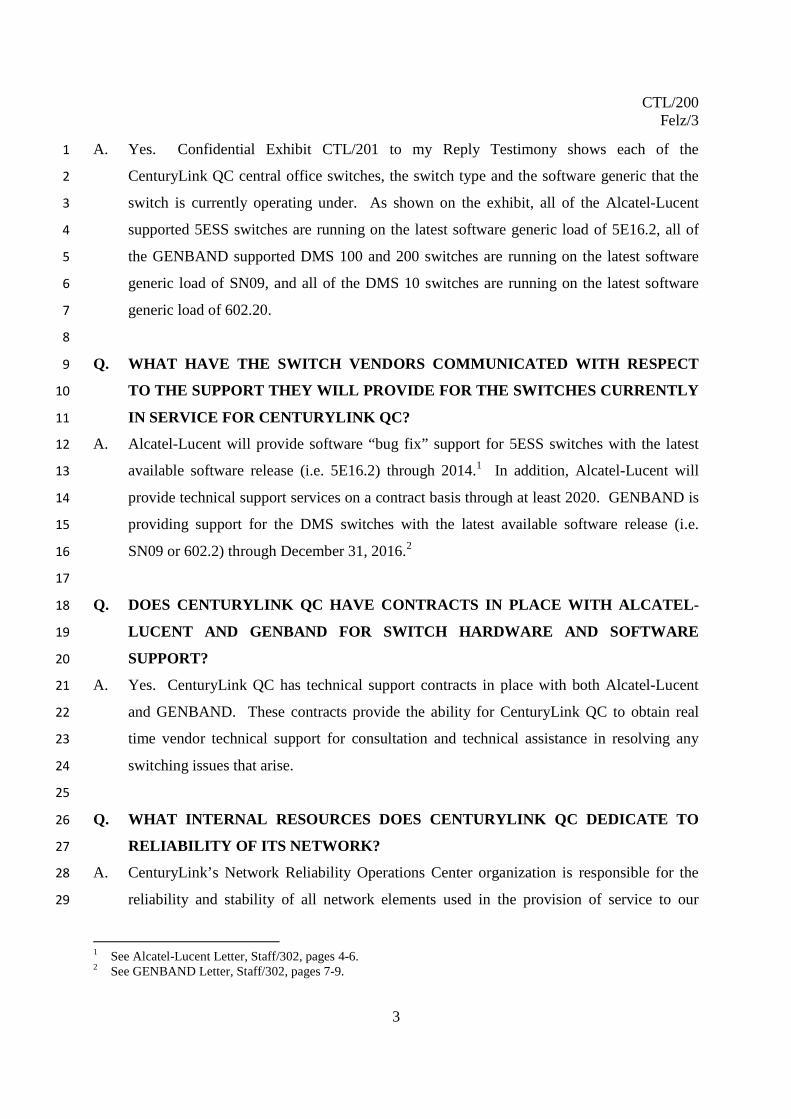
TABLE OF CONTENTS
Page
I. IDENTIFICATION OF WITNESS ...................................................................... 1
II. PURPOSE OF TESTIMONY.............................................................................. 1
III. SERVICE QUALITY ........................................................................................ 1
IV. COMPETITION ............................................................................................... 10
V. PRICING FLEXIBILITY .................................................................................. 16
VI. WAIVERS OF RULES AND STATUTES ............................................................ 24
VII. SUMMARY …………………………………………………………………. 29

CTL/200Felz/1
1
I. IDENTIFICATION OF WITNESS1
2
Q. PLEASE STATE YOUR NAME AND BUSINESS ADDRESS.3
A. My name is John M. Felz and my business address is 5454 W. 110th Street, Overland4
Park, KS.5
6
Q. WHO IS YOUR EMPLOYER AND WHAT IS YOUR POSITION?7
A. I am employed by CenturyLink as Director – State Regulatory Operations.8
9
Q. ARE YOU THE SAME JOHN M. FELZ WHO SUPPLIED DIRECT TESTIMONY10
IN THIS PROCEEDING ON JANUARY 23, 2014?11
A. Yes.12
13
II. PURPOSE OF TESTIMONY14
15
Q. WHAT IS THE PURPOSE OF YOUR REPLY TESTIMONY?16
A. The purpose of my reply testimony is to respond to the opening testimonies of the17
following parties: Staff witnesses Mr. Bruce Hellebuyck, Ms. Malia Brock and Mr. Mitch18
Moore; Integra witness Mr. Douglas Denney; and Citizens’ Utility Board of Oregon19
(“CUB”) witness Mr. Bob Jenks. I will respond to issues raised by these parties with20
respect to CenturyLink QC’s Amended Petition for Revision of Price Plan filed in this21
docket on January 23, 2014 and my Direct Testimony supporting the Petition. My22
testimony is organized into sections to address issues in the other parties’ testimonies23
related to Service Quality, Competition, Pricing Flexibility and Waivers of Rules and24
Statutes.25
26
III. SERVICE QUALITY27
Q. WHAT MODIFICATIONS TO SERVICE QUALITY REPORTING DID28
CENTURYLINK QC SEEK IN ITS MODIFIED PRICE PLAN PETITION?29
A. CenturyLink QC affirmed that it will continue to be subject to the Retail30
Telecommunications Service Standards for Large Telecommunications Utilities identified31

CTL/200Felz/2
2
in OAR 860-023-055. However, CenturyLink QC sought the following exceptions from1
the rule with respect to reporting requirements:2
1. CenturyLink QC will provide reports on a quarterly basis instead of monthly.3
2. CenturyLink QC will provide only exception information for any measures that did not4
meet the established standard during the quarter.5
6
Q. SO CENTURYLINK QC IS NOT SEEKING ANY CHANGES TO COMMISSION7
SERVICE QUALITY STANDARDS OR RELIEF FROM COMPLYING WITH8
THOSE STANDARDS?9
A. No. CenturyLink QC is not seeking any modifications to the Commission’s service quality10
standards specified in OAR 860-023-055. Nor is CenturyLink QC seeking relief from11
complying with the standards that exist. Rather, CenturyLink QC was simply seeking to12
streamline its service quality reporting by providing exception only reports on a quarterly13
basis.14
15
Q. COULD YOU PLEASE RESPOND TO THE CONCERNS RAISED BY STAFF16
WITNESS BROCK CONCERNING VENDOR SUPPORT FOR CENTURYLINK17
QC’S CENTRAL OFFICE SWITCHES (STAFF 300/BROCK/20-22)?18
A. Staff produced letters from the vendors supporting the central office switches currently19
deployed in CenturyLink QC’s Oregon network – Nortel switches supported by20
GENBAND and Lucent switches supported by Alcatel – Lucent. These letters outline the21
current status of hardware and software support available for each vendor’s switches. Staff22
is concerned that the changes to ongoing support of switch hardware and software outlined23
in the vendor letters could hamper CenturyLink QC’s ability to provide adequate service24
going forward. While CenturyLink QC appreciates Staff’s concerns, the company has25
taken measures to ensure the necessary support is in place for its switches to allow26
continued provision of high quality service to customers for the foreseeable future.27
28
Q. ARE CENTURYLINK QC’S OREGON CENTRAL OFFICES OPERATING ON29
THE LATEST SOFTWARE RELEASE AVAILABLE FROM THE SWITCH30
VENDORS?31
CTL/200Felz/3
3
A. Yes. Confidential Exhibit CTL/201 to my Reply Testimony shows each of the1
CenturyLink QC central office switches, the switch type and the software generic that the2
switch is currently operating under. As shown on the exhibit, all of the Alcatel-Lucent3
supported 5ESS switches are running on the latest software generic load of 5E16.2, all of4
the GENBAND supported DMS 100 and 200 switches are running on the latest software5
generic load of SN09, and all of the DMS 10 switches are running on the latest software6
generic load of 602.20.7
8
Q. WHAT HAVE THE SWITCH VENDORS COMMUNICATED WITH RESPECT9
TO THE SUPPORT THEY WILL PROVIDE FOR THE SWITCHES CURRENTLY10
IN SERVICE FOR CENTURYLINK QC?11
A. Alcatel-Lucent will provide software “bug fix” support for 5ESS switches with the latest12
available software release (i.e. 5E16.2) through 2014.1 In addition, Alcatel-Lucent will13
provide technical support services on a contract basis through at least 2020. GENBAND is14
providing support for the DMS switches with the latest available software release (i.e.15
SN09 or 602.2) through December 31, 2016.216
17
Q. DOES CENTURYLINK QC HAVE CONTRACTS IN PLACE WITH ALCATEL-18
LUCENT AND GENBAND FOR SWITCH HARDWARE AND SOFTWARE19
SUPPORT?20
A. Yes. CenturyLink QC has technical support contracts in place with both Alcatel-Lucent21
and GENBAND. These contracts provide the ability for CenturyLink QC to obtain real22
time vendor technical support for consultation and technical assistance in resolving any23
switching issues that arise.24
25
Q. WHAT INTERNAL RESOURCES DOES CENTURYLINK QC DEDICATE TO26
RELIABILITY OF ITS NETWORK?27
A. CenturyLink’s Network Reliability Operations Center organization is responsible for the28
reliability and stability of all network elements used in the provision of service to our29
1 See Alcatel-Lucent Letter, Staff/302, pages 4-6.2 See GENBAND Letter, Staff/302, pages 7-9.
CTL/200Felz/4
4
customers. Through this organization and other technical support personnel throughout the1
company’s Network organization, CenturyLink QC resources are well equipped to provide2
the expertise to ensure network reliability. In fact, CenturyLink QC’s switching assets are3
primarily supported internally, with vendor support only utilized when additional expertise4
is needed.5
6
Q. CAN YOU RESPOND TO STAFF’S CONCERNS ABOUT THE AVAILABILITY7
OF REPLACEMENT PARTS FOR SWITCH COMPONENTS THAT FAIL?8
A. Yes. CenturyLink QC has several options available to replace failed switch components9
including:10
1) Although the vendors have discontinued manufacture of new switches, many new11
Original Equipment Manufacturer (OEM) switch hardware components can still be12
ordered from Alcatel-Lucent or GENBAND.13
2) Alcatel-Lucent refurbishes used switch components and applies a like new warranty on14
that equipment.15
3) CenturyLink maintains its own internal inventory of switch component parts from16
switches that have been retired or replaced across the company’s service territory.17
4) Numerous third-party vendors make switch component parts available for the Alcatel-18
Lucent and GENBAND switches utilized by CenturyLink QC in Oregon.19
20
Q. HAVE BOTH SWITCH VENDORS RECOGNIZED THAT CARRIERS WILL21
NEED TIME TO MOVE FROM AN EXISTING TDM NETWORK TO AN IP22
NETWORK?23
A. Yes. Alcatel-Lucent states:24
“ALU understands our customers require their 5ESS Switches to effectively operate25
in the North American wireline telecommunications network for the foreseeable26
future.”327
And GENBAND states:28
“GENBAND is committed to seamless transformation to IP networks . . . and we29
are already working with many customers in implementing their migration. This30
3 See Alcatel-Lucent Letter, Staff/302, pages 4-6.

CTL/200Felz/5
5
includes carrying forward the DMS . . . line peripherals into these transformations1
. . . to allow our carrier customers time, and a phased capital outlay, to implement2
a universal all-IP subscriber access network.”43
4
Q. DID STAFF EXPRESS CONCERN OVER THE COMPANY’S INVESTMENT AND5
EXPENSE SPENDING TRENDS IN OREGON?6
A. Yes. Staff witness Mr. Hellebuyck presents an analysis of the company’s 1) capital7
additions, 2) operating and maintenance expense, and 3) depreciation expense from 20038
through 2013. Mr. Hellebuyck presents a graph of these three components and suggests9
that the reductions in capital spending and operating and maintenance expenses are10
indicative of “obsolescence” of CenturyLink QC’s Oregon network.11
12
Q. HOW DO YOU RESPOND TO THE CONCERNS RAISED BY MR.13
HELLEBUYCK REGARDING THE LEVELS OF INVESTMENT AND EXPENSES14
CENTURYLINK QC HAS COMMITTED TO IN OREGON?15
A. While CenturyLink QC acknowledges that the absolute levels of capital additions,16
expenses and depreciation have declined during the period 2003 to 2013, the company17
disagrees with the conclusion that this is indicative of obsolescence in the company’s18
Oregon network for the following reasons:19
1) The analysis does not consider the impacts of declines in CenturyLink QC’s20
customer base during the period analyzed.21
2) The analysis does not consider the extent to which improvements in technology,22
productivity and automation may have positively impacted capital additions and23
operating expenses, resulting in lower costs.24
3) The depreciation expense analysis does not recognize that a significant change in25
depreciation rates occurred during the period analyzed that impacted the trend.26
4) Several categories of expenses that were included in Staff’s expense analysis are27
not related to network or customer service and should therefore not be considered in28
any analysis of whether the company is devoting adequate resources to the29
provision of quality service.30
4 See GENBAND Letter, Staff/302, pages 7-9.

CTL/200Felz/6
6
I explain each of these reasons in greater detail below.1
2
Q. HOW DOES CENTURYLINK QC’S DECLINING CUSTOMER BASE IMPACT3
THE LEVELS OF CAPITAL ADDITIONS AND OPERATING EXPENSES IN4
OREGON?5
A. During the period from 2003 to 2013 reflected in Mr. Hellebuyck’s analysis of capital6
additions and operating expenses, CenturyLink QC has experienced a decline of 63.6% in7
its retail access lines. This significant loss of customers means that the company has fewer8
trouble reports to respond to, fewer service orders to fulfill and as a result, it has9
necessarily taken steps to adjust its resources to align with its smaller customer base. It is10
an unreasonable expectation that a company would continue to direct the same level of11
resources as if it were experiencing no changes in demand. A more appropriate analysis of12
capital additions and operating expenses would consider the trend in these costs on a per13
access line basis. I will provide such an analysis in my testimony below.14
15
Q. ARE THERE OTHER FACTORS THAT MAY HAVE CONTRIBUTED TO THE16
DECLINING TREND IN CENTURYLINK QC’S CAPITAL ADDITIONS AND17
OPERATING EXPENSES IN OREGON?18
A. Yes. Improvements in technology, productivity and automation can result in efficiencies19
and be a driver for cost reductions. Lower vendor costs for certain equipment, increased20
productivity from new or enhanced computer systems and increased automation of21
functions drive reductions in costs. Mr. Hellebuyck’s analysis focuses on the absolute22
reductions in capital additions and operating expense and does not consider the impact to23
which the efficiencies discussed here may have contributed to the highlighted trend.24
25
Q. WERE THERE CHANGES THAT IMPACTED THE DEPRECIATION EXPENSE26
TREND INCLUDED IN STAFF’S ANALYSIS?27
A. Yes. In 2006, CenturyLink QC implemented changes in certain depreciation rates resulting28
in a significant reduction in depreciation expense levels in 2006 as compared with the 200529
level. After this reduction in depreciation expense experienced in 2006, and a small30
increase in 2007 as depreciation rates were refined, the depreciation expense level31
CTL/200Felz/7
7
remained consistent. The reductions in depreciation expense during the period analyzed by1
Mr. Hellebuyck are largely the result of depreciation rate changes and not a reflection of2
obsolescence as suggested by Mr. Hellebuyck.3
4
Q. IS MR. HELLEBUYCK’S ANALYSIS OF TOTAL OPERATING EXPENSES A5
VALID APPROACH FOR EVALUATING THEIR CONCERNS ABOUT6
“EXPENDITURE RELATED OBSOLESCENCE”?7
A. No. A significant portion of the expenses included in Mr. Hellebuyck’s expense analysis8
are not related to network or customer service functions that Mr. Hellebuyck seems to be9
concerned about. Specifically, the total operating expense used in Mr. Hellebuyck’s10
analysis includes amounts for access expense, depreciation and amortization expense,11
corporate operations expense and other operating expense which are not related to network,12
maintenance or customer service functions. Including these expense categories, which13
reflect significant declines during the period analyzed for entirely appropriate reasons,14
distorts the analysis and contributes to an incorrect conclusion that the company is reducing15
expenses associated with its network and customer service functions. Specifically, noted16
below are the expense categories that should be excluded from Mr. Hellebuyck’s analysis17
and the rationale for such exclusion. I have included Exhibit CTL/205 with my testimony18
that documents the analysis presented in this discussion.19
20
Access expense, which represents amounts paid by CenturyLink QC to other carriers21
for termination of local and long distance traffic, declined by 66.5% during the period22
from 2003 to 2013 due to changes in intercarrier compensation resulting from the23
FCC’s Transformation Order. The trend of access expense provides no meaningful24
information about whether CenturyLink QC is committing resources to maintain its25
network and customer service functions and should be excluded from Mr. Hellebuyck’s26
analysis.27
Depreciation and amortization expense declined by 54.3% during the period from 200328
to 2013 principally due to changes in depreciation rates as explained above.29
Depreciation and amortization are non-cash expenses and as such, should be analyzed30
separately from other operating expenses.31

CTL/200Felz/8
8
Corporate operations and other operating expenses declined by 61.9% during the period1
from 2003 to 2013. Since all of the costs in these expense categories are by definition2
general and administrative type costs, they are not network or customer service related3
costs and should not be included in Mr. Hellebuyck’s analysis.4
5
Q. IF THE EXPENSE CATEGORIES YOU JUST DISCUSSED ARE REMOVED6
FROM MR. HELLEBUYCK’S ANALYSIS, CAN YOU COMMENT ON THE7
REMAINING EXPENSE CATEGORIES?8
A. Yes. The expense categories remaining include plant specific expenses, provisioning and9
network operations expenses and customer operations expenses. CenturyLink QC offers10
the following analysis of the trends reflected in these expense categories:11
Plant specific expenses, which include the bulk of the costs most directly related to12
maintenance and operation of the company’s network, declined by only 17% during13
the period from 2003 to 2013. When these expenses are viewed on a per line basis14
that takes into account CenturyLink QC’s declining access line counts, the analysis15
demonstrates that CenturyLink QC has increased spending on plant related expenses16
by 127.9% on a per line basis when comparing 2013 with 2003.17
Provisioning and network operations expenses, which also include costs related to18
maintenance and operation of the company’s network, declined by only 1.2% during19
the period from 2003 to 2013. When these expenses are viewed on a per line basis20
that takes into account CenturyLink QC’s declining access line counts, the analysis21
demonstrates that CenturyLink QC has increased spending on provisioning and22
network operations expenses by 171.4% on a per line basis when comparing 201323
with 2003.24
Customer operations expenses, which include the costs of performing customer25
related activities, declined by 41.9% during the period from 2003 to 2013. When26
these expenses are viewed on a per line basis that takes into account CenturyLink27
QC’s declining access line counts, the analysis demonstrates that CenturyLink QC28
has increased spending on customer related expenses by 59.7% on a per line basis29
when comparing 2013 with 2003.30
31

CTL/200Felz/9
9
Q. WHAT DO THE TRENDS IN CAPITAL ADDITIONS DEMONSTRATE WHEN1
ANALYZED ON A PER LINE BASIS?2
A. Capital additions measured on a per access line reflect variations from year to year, but3
generally reflect a relatively consistent level of new investment considering the dynamics4
of the marketplace that CenturyLink QC operates in. When comparing 2013 capital5
additions on a per access line basis to the same measure from 2003, CenturyLink QC’s6
spending actually increased by nearly 30%.7
8
Q. IS THERE ADDITIONAL EVIDENCE THAT CENTURYLINK IS COMMITTED9
TO INVESTING IN ITS NETWORK IN OREGON?10
A. Yes. In conjunction with the merger of CenturyLink and Qwest, the company committed11
to spend $45 million in broadband deployment over a five year period ending December12
31, 2015. CenturyLink followed through on its commitment, completing the initial $4513
commitment in only 18 months. And, CenturyLink has not stopped there – it has spent14
nearly $100 million on broadband expansion for the three year period from 2011 through15
2013, more than doubling its initial commitment. While the focus of this investment is16
broadband expansion, there are network upgrades that result such as extension of fiber17
facilities deeper in the network and increased capacity on transport routes that are18
beneficial for all CenturyLink customers, even if they choose not to subscribe to19
broadband.20
21
Q. COULD YOU SUMMARIZE YOUR TESTIMONY RESPONDING TO STAFF’S22
“OBSOLESENCE” CONCERNS?23
A. Yes. CenturyLink QC switches have the latest software load and the necessary support to24
ensure continued operation of the network is in place to support the continued provision of25
quality service to the company’s Oregon customers. CenturyLink QC has extensive26
internal resources with the necessary training and experience to provide the primary27
support for the company’s network and has the necessary arrangements in place for vendor28
support to supplement its internal resources when required. In addition, CenturyLink QC29
has multiple options available for replacement hardware when required. CenturyLink QC’s30
capital addition and operating expense trends are the result of rational business practices31

CTL/200Felz/10
10
and are not reflective of obsolescence in the company’s Oregon network as suggested by1
Staff. Finally, CenturyLink QC is not seeking any modifications to the Commission’s2
service quality standards nor is the company seeking relief from complying with the3
standards. Rather, CenturyLink QC is only seeking to streamline its service quality4
reporting.5
6
IV. COMPETITION7
8
Q. WHAT IS THE PURPOSE OF THIS SECTION OF YOUR TESTIMONY?9
A. In this section of my testimony, I will address the testimonies of Staff witness Mr. Moore10
and CUB witness Mr. Jenks with respect to competition.11
12
Q. HOW WOULD YOU CHARACTERIZE MR. MOORE'S POSITION WITH13
RESPECT TO THE NATURE AND EXTENT OF COMPETITION IN14
CENTURYLINK QC’S OREGON SERVICE TERRITORY?15
A. While Mr. Moore recognizes that “. . .many consumers have choices for their16
telecommunications needs and that many are taking advantage of those options. . .”5 he17
nonetheless focuses significant portions of his testimony on attempting to demonstrate that18
some subset of CenturyLink QC’s customers have limited or no competitive alternatives.19
Mr. Moore offers the following conclusion with respect to his analysis of competitive20
options available to residential customers:21
“Essentially, most customers may choose between Qwest and a single cable company22
for landline service, and, if they are inclined to see wireless as a substitutable service,23
many have several wireless options. However, the data show that in rural areas a24
significant number of consumers are without a landline alternative and many without25
a wireless alternative. In addition, there are consumers without any alternative to26
Qwest service at all.”627
28
Q. PLEASE RESPOND TO MR. MOORE'S DISCUSSION OF CENTURYLINK QC’S29
ACCESS LINES TRENDS?30
5 See Staff/400, Moore/29, lines 8-9.6 Staff/400, Moore/29, lines 11-17.

CTL/200Felz/11
11
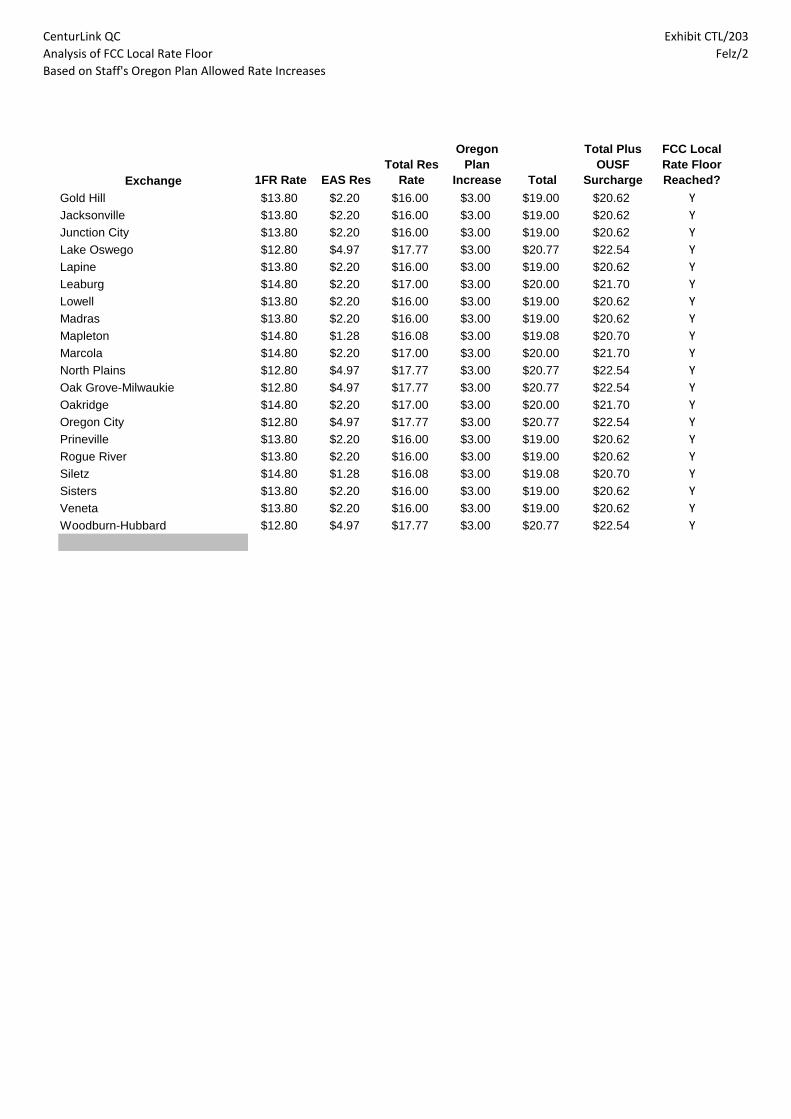
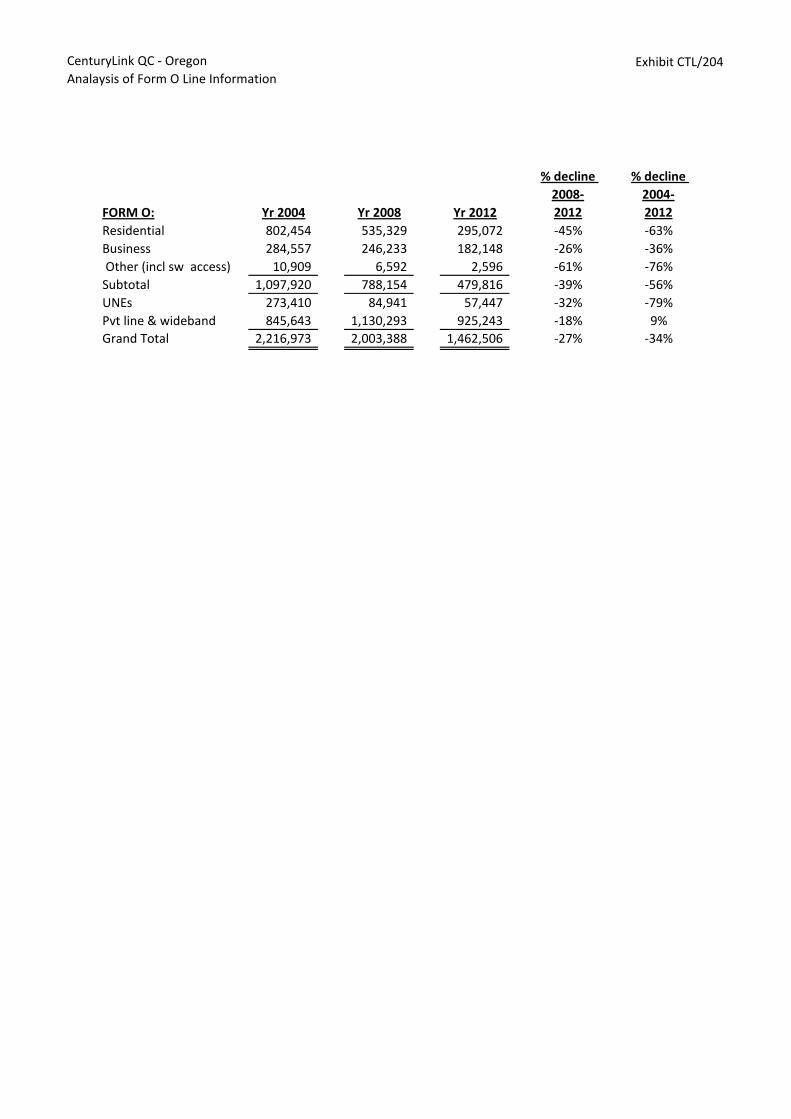
A. Mr. Moore presents an analysis of access lines that includes residential, business, other,1
unbundled network elements, and private line and wideband for 2002, 2008 and 2012.72
Staff concludes that total access lines decreased by only 5% between 2002 and 2012. This3
assessment largely results from the inclusion of private line and wideband data information4
which according to Mr. Moore’s analysis increased from 232,363 in 2002 to 925,243 in5
2012. Based on this analysis, Mr. Moore suggests that many of CenturyLink QC’s lines6
are just shifting to new product categories and do not represent competitive losses.7
CenturyLink has two concerns with Mr. Moore’s analysis and conclusion. First, Mr.8
Moore’s inclusion of private line and wideband data quantities with traditional voice access9
lines assumes that services like a DS1 or DS3 are comparable to a residential or business10
voice line when they are clearly not. Second, CenturyLink QC is not able to verify the11
private line and wideband data presented in Mr. Moore’s analysis for 2002 as the company12
did not file data for private line, special access or wideband data in the Form O for either13
2002 or 2003 and has been unable to locate this information in its records. However, based14
on a comparison to information available for 2004, the private line and wideband data for15
2002 presented in Mr. Moore’s analysis appears unreasonably low. Additionally,16
CenturyLink noted differences between the company’s Form O information for 2008 and17
Staff’s analysis for several line items. I have completed an analysis (see Exhibit CTL/204)18
similar to that provided in Mr. Moore’s testimony using information from CenturyLink19
QC’s Form O for 2004, 2008 and 2012. Although CenturyLink QC does not agree that20
inclusion of private line and wideband data in the analysis is appropriate, the information21
presented in Exhibit CTL/204 reflects a 34% decline in lines from 2004 to 2012 compared22
to Mr. Moore’s analysis suggesting only a 5% decrease.23
24
Q. HOW DO YOU RESPOND TO STAFF’S DISCUSSION OF THE LIVING UNIT25
ANALYSIS PRESENTED IN CENTURYLINK QC’S OPENING TESTIMONY?26
A. In my opening testimony, I provided in Exhibit CTL/102 an analysis of the living units that27
CenturyLink QC has facilities deployed to and is “ready to serve” compared to the living28
units with CenturyLink voice service. This analysis demonstrated that CenturyLink QC is29
providing voice service to only XXX% of the living units that it is ready to serve. Mr.30
7 Staff/400, Moore 17.
CTL/200Felz/12
12
Moore takes issue with this analysis arguing that it is “likely that many” of the businesses1
included in the living unit counts purchase some alternative CenturyLink service that2
provides them with voice service.8 Mr. Moore provides only a single example of how the3
Commission’s voice service is provided via a DS1 facility to suggest that CenturyLink4
QC’s analysis masks the extent of CenturyLink QC’s market share in the business markets.5
This single example provided by Mr. Moore does not discount CenturyLink’s QC’s6
analysis that demonstrates it is providing voice service to only XXX% of the locations to7
which it has deployed facilities.8
9
Q. MR. MOORE'S TESTIMONY INCLUDES A MAP WHICH OVERLAYS10
CENTURYLINK QC EXCHANGE BOUNDARIES ON THE OREGON11
BROADBAND MAP CABLE COMPANY DATA. COULD YOU COMMENT ON12
MR. MOORE’S CONCLUSION FROM THE MAP?13
A. Mr. Moore asserts that the map shows there are “significant areas within Qwest’s service14
territory that are not served by a competing landline provider.”9 While CenturyLink15
acknowledges the map shows areas that are not served by a cable company, the map16
provides no information about the households that exist in those areas shown as not served17
by a cable company. In other words, while there are areas that are without a cable18
company providing voice service, there are likely few customers in many of these areas.19
Therefore, definitive conclusions about the availability of cable telephony alternatives in20
CenturyLink QC’s serving area cannot be reached without also understanding where the21
potential customers are located.22
23
Q. DO YOU HAVE A CONCERN WITH STAFF’S EVAULATION OF LANDLINE24
COMPETITIVE ALTERNATIVES?25
A. Based on several statements in Staff witness Moore’s testimony, it appears Staff has an26
expectation that multiple landline competitors need to be available for a market to be27
considered competitive.28
8 Staff/400, Moore/17, lines 7-11.9 Staff/400, Moore/28, lines 3-5.
CTL/200Felz/13
13
“While there are a number of cable providers operating in Qwest’s service territory,1
these providers do not overlap territories and compete with each other, leaving2residential and business customers with only one landline alternative.”103
4
“Qwest’s data shows that out of 82 wire centers, only eight of them have more than5
one cable provider. Even in the eight wire centers with more than one cable provider,6
it is not likely that individual consumers have more than one alternative to choose7
from since cable providers do not generally have overlapping service.”118
9
Q. IS IT A REASONABLE EXPECTATION THAT ONE OR MORE LANDLINE10
COMPETITIVE ALTERNATIVES ARE GOING TO BE AVAILABLE TO ALL11
AREAS OF CENTURYLINK QC’S SERVICE TERRITORY?12
A. No. Investment economics makes ubiquitous competing wireline networks impossible and13
Staff acknowledges that competitors must make investments that will turn a profit:14
“The cost of providing service dictates where competitors will go to offer service.15Competitive providers are not providing service in areas where the cost of providing the16
service makes selling the service unprofitable.”1217
18
In spite of this recognition, Staff nonetheless appears to be holding CenturyLink QC to a19
standard of demonstrating competition in every area of its service territory, even in those20
areas that it acknowledges competitors are unlikely to enter. This expectation completely21
ignores the capital intensive economics of telecommunications networks.22
23
It is axiomatic that rational investors invest only where they believe the investment will24
generate enough revenue to pay for itself and generate a profit commensurate with the25
investment risk. Consequently, non-incumbent carriers and cable companies build their26
networks where they believe they can attract sufficient customers purchasing sufficient27
services at sufficient rates that the network will pay for itself and generate a profit28
appropriate to the risk of not recovery the investment. They will not build where too few29
customers will buy service or the customers buying service won’t pay enough for services30
to pay for the network and the risk of investing in it. A corollary of this axiom is that a31
competitor will not overbuild CenturyLink’s network with a new network unless the32
competitor is convinced the over-build will pay for itself and make an appropriate profit.33
10 Staff/400, Moore/13, lines 10-13.11 Staff/400, Moore/26, lines 12-16.12 Staff/400, Moore/11, lines 1-4.
CTL/200Felz/14
14
1
Q. COULD YOU RESPOND TO MR. MOORE’S POSITION WITH RESPECT TO2
WHETHER WIRELESS SERVICE CAN BE CONSIDERED A REASONABLE3
SUBSTITUTE FOR LANDLINE SERVICE?4
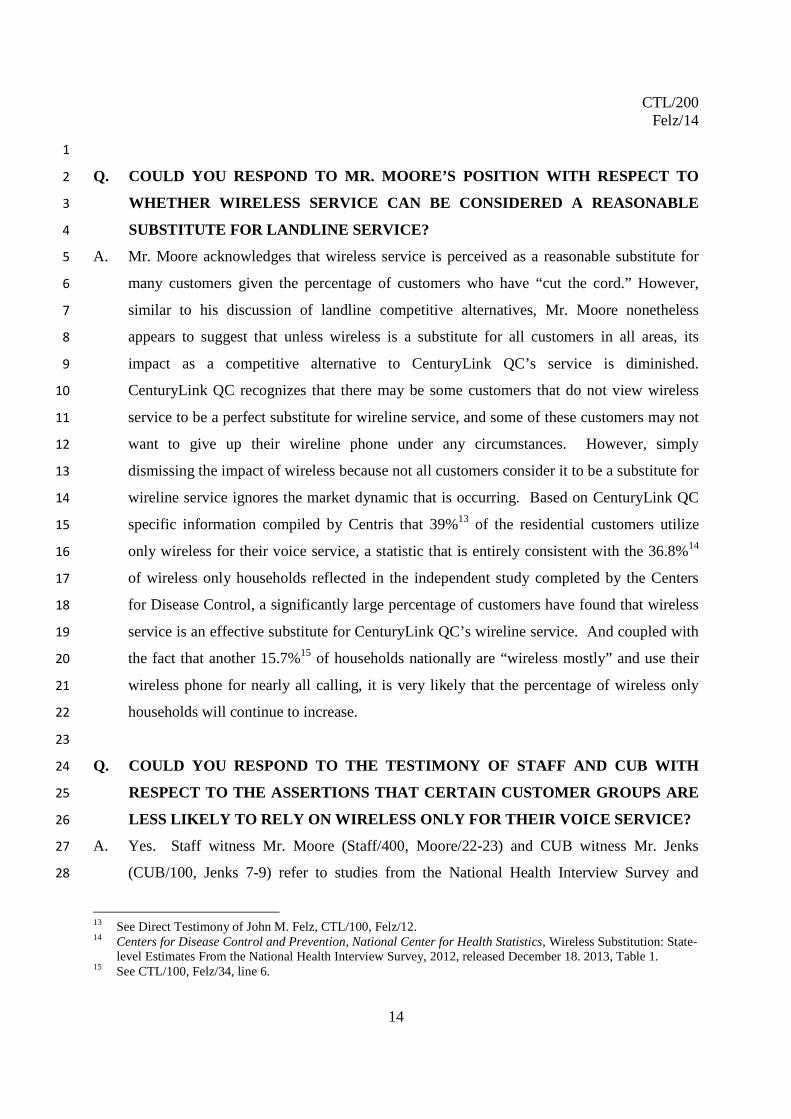
A. Mr. Moore acknowledges that wireless service is perceived as a reasonable substitute for5
many customers given the percentage of customers who have “cut the cord.” However,6
similar to his discussion of landline competitive alternatives, Mr. Moore nonetheless7
appears to suggest that unless wireless is a substitute for all customers in all areas, its8
impact as a competitive alternative to CenturyLink QC’s service is diminished.9
CenturyLink QC recognizes that there may be some customers that do not view wireless10
service to be a perfect substitute for wireline service, and some of these customers may not11
want to give up their wireline phone under any circumstances. However, simply12
dismissing the impact of wireless because not all customers consider it to be a substitute for13
wireline service ignores the market dynamic that is occurring. Based on CenturyLink QC14
specific information compiled by Centris that 39%13 of the residential customers utilize15
only wireless for their voice service, a statistic that is entirely consistent with the 36.8%1416
of wireless only households reflected in the independent study completed by the Centers17
for Disease Control, a significantly large percentage of customers have found that wireless18
service is an effective substitute for CenturyLink QC’s wireline service. And coupled with19
the fact that another 15.7%15 of households nationally are “wireless mostly” and use their20
wireless phone for nearly all calling, it is very likely that the percentage of wireless only21
households will continue to increase.22
23
Q. COULD YOU RESPOND TO THE TESTIMONY OF STAFF AND CUB WITH24
RESPECT TO THE ASSERTIONS THAT CERTAIN CUSTOMER GROUPS ARE25
LESS LIKELY TO RELY ON WIRELESS ONLY FOR THEIR VOICE SERVICE?26
A. Yes. Staff witness Mr. Moore (Staff/400, Moore/22-23) and CUB witness Mr. Jenks27
(CUB/100, Jenks 7-9) refer to studies from the National Health Interview Survey and28
13 See Direct Testimony of John M. Felz, CTL/100, Felz/12.14 Centers for Disease Control and Prevention, National Center for Health Statistics, Wireless Substitution: State-
level Estimates From the National Health Interview Survey, 2012, released December 18. 2013, Table 1.15 See CTL/100, Felz/34, line 6.

CTL/200Felz/15
15
AARP to suggest that the likelihood of customers willing to disconnect wireline service in1
favor of wireless declines by demographic age group. While CenturyLink QC has no basis2
to dispute the data presented in these studies, even assuming that more elderly customers3
are less inclined to “cut the cord,” the percentage of customers who have chosen to do so is4
so significant that it cannot be ignored. Staff and CUB’s position suggests that a5
competitive analysis needs to be completed by demographic market segment and if6
competition is not even across demographic segments, it somehow invalidates or7
diminishes the overall conclusion of the nature and extent of competition. Customers8
value different aspects of competitive alternatives that may be available to them for their9
voice service, and differences in value across customer segments should not be a reason to10
suggest that the market is not competitive.11
12
Q. DOES CUB PRESENT OTHER CONCERNS ABOUT THE NATURE AND13
EXTENT OF COMPETITIVE ALTERNATIVES PRESENTED BY14
CENTURYLINK QC?15
A. Yes. CUB witness Mr. Jenks asserts that CenturyLink QC “. . . is actually involved in two16
telecommunications markets – the competitive market, which is where most customers17
participate and which is not regulated by this Commission, and the legacy monopoly18
market.” CUB further states that its concerns are for the residential customers “. . . that are19
participating in the legacy monopoly market, who are not exercising their consumer choice20
in the competitive marketplace. . .” CUB concludes that because all customers are not21
willing or able to be part of the competitive marketplace, they need the protection of22
traditional price cap regulation.23
24
Q. DOES CENTURYLINK QC AGREE WITH CUB’S POSITION THAT THE25
COMPANY OPERATES IN A MONOPOLY ENVIRONMENT?26
A. No. Mr. Jenks references to “monopoly” markets and “regulatory compact” are concepts27
that at one time served as effective models for telecommunications regulation, but are no28
longer relevant in today’s competitive marketplace. The regulatory compact allowed the29
achievement of universal service policy goals through a “compact” between regulators and30
utilities that the utilities would construct and operate telephone networks to provide service31

CTL/200Felz/16
16
universally throughout their “monopoly” franchised territories and in turn would be1
provided the opportunity to recover their costs of providing service and earn a reasonable2
rate of return on their investment. Regulators used their authority over the monopolies’3
ratemaking to establish rate structures that created “implicit subsidies” that allowed the4
provision of universal service at an affordable rate.5
6
However, with the advent of competition, fostered through the Telecommunications Act of7
1996, the regulatory compact is no longer an effective mechanism for regulating companies8
like CenturyLink QC. The concept of a monopoly for telecommunications service is no9
longer valid, and the regulatory rate structures based on implicit subsidies that worked in a10
monopoly environment are being eroded with the continued expansion of competitors into11
CenturyLink QC’s markets.12
13
The assertion by CUB that CenturyLink QC operates in monopoly market and should be14
subject to monopoly era pricing controls is simply not borne out by the extent and impact15
of competition that is outlined in my Direct Testimony. The fact that there may be some16
small subset of customers that have few or no competitive alternatives for CenturyLink17
QC’s voice services should not result in the application of restrictive pricing regulation for18
the company.19
20
V. PRICING FLEXIBILITY21
22
Q. HOW WOULD YOU SUMMARIZE STAFF’S POSITION ON THE COMPANY’S23
PROPOSAL TO ELIMINATE PRICE CAPS IN ITS PRICE PLAN?24
A. Staff opposes CenturyLink QC’s proposal to eliminate price caps in its modified Price25
Plan. Staff’s position is generally represented in the following statements from Staff26
witness Mr. Hellebuyck:27
“While the market is becoming more competitive, not all customers have access to a28
range of competitive alternatives for all the services they need due to geographic,29
demographic, and other differences among customers.”1630
31
16 See Staff/100, Hellebuyck/7, lines 15-18.

CTL/200Felz/17
17
“Rather than leap to a total reliance on competition to provide price safeguards as the1
Company advocates, the Commission should adopt a plan which contains safeguards2(e.g., price caps) which will ensure that the plan is operating in the public interest.”173
4
Q. DOES CENTURYLINK QC AGREE WITH STAFF’S ASSESSMENT THAT5
COMPETITION HAS NOT YET DEVELOPED TO A LEVEL THAT SUPPORTS6
ELIMINATION OF PRICE CAPS?7
A. No. CenturyLink QC has presented information that demonstrates competitive alternatives8
to the company’s regulated voice services are available from numerous providers across the9
majority of CenturyLink QC’s Oregon serving territory. Nonetheless, Staff concludes that10
not “all” customers in CenturyLink QC’s territory have access to a range of competitive11
alternatives and therefore, price caps are necessary to discipline CenturyLink QC’s pricing.12
While CenturyLink QC recognizes that there are areas within its Oregon service territory13
where customers may have few or no competitive voice options, the pervasive competition14
throughout the state provides protection for customers for all areas, even those with more15
limited competition.16
17
Q. HOW DOES THE PRESENCE OF MUTLIPLE ALTERNATIVE PROVIDERS IN18
AN AREA THAT MIGHT BE CONSIDERED SUFFICIENTLY COMPETITIVE BY19
STAFF PROVIDE DISCIPLINE OVER CENTURYLINK’S PRICING ACTIONS IN20
AN AREA WITH FEW OR NO ALTERNATIVE VOICE SERVICE OPTIONS?21
A. The discipline provided in the more competitive area limits CenturyLink QC’s market22
power and constrains its prices throughout the state, including the areas with more limited23
competition. This concept is reinforced by CenturyLink QC’s Price Plan commitment that24
it will not geographically deaverage the rates for basic service under the plan any further25
than they were on the effective date of the plan.18 Since CenturyLink QC’s current rate26
structure for basic service reflects three rate groups with a limited price range between the27
lowest and highest rates, this commitment would prevent CenturyLink QC from increasing28
rates in the less competitive areas by a different amount than it applies to the competitive29
areas. Further, this commitment would prevent CenturyLink QC from considering any30
17 See Staff/100, Hellebuyck/7, line 21 to Hellebuyck/8, line 1.18 See CTL/109, Felz/3, Section III.B.3 of CenturyLink QC’s modified Price Plan.

CTL/200Felz/18
18
pricing initiative that would seek to apply different rate changes within an exchange, such1
as differentiating prices between the more populated central area of the exchange and the2
more sparsely populated areas within an exchange.3
4
Q. HOW DOES COMPETITION DISCIPLINE CENTURYLINK QC’S PRICING?5
A. If customers are unhappy with CenturyLink QC prices or service quality, they may easily6
move to a competitor’s services—whether cable, another CLEC, wireless or VoIP. This is7
the way competitive markets work, and this disciplines CenturyLink QC’s prices. If8
CenturyLink QC sets rates too high or provides poor service quality, then customers will9
simply leave CenturyLink QC for another option. In this way, the competitive market10
protects Oregon retail consumers.11
12
For example, the threat of a customer “cutting the cord” constrains CenturyLink QC’s local13
exchange prices. If CenturyLink QC sets local exchange rates too high, many customers14
will simply disconnect their wireline phone and use their wireless phones for all calls.15
Many customers already use their wireless phone for most calls, and a rate increase that16
consumers perceive to be unreasonable would cause CenturyLink QC to lose more17
customers to the competition, exerting pressure on CenturyLink QC to provide a18
competitive response, including the consideration of a reduction of rates. As a result,19
competition protects CenturyLink QC’s Oregon customers from unreasonable rate20
increases, where “unreasonable” is determined by the market.21
22
Q. STAFF STATES THAT A PRICE PLAN WITHOUT PRICE CAPS WOULD NOT23
ENSURE JUST AND REASONABLE RATES. DOES CENTURYLINK QC24
AGREE?25
A. No. There are adequate controls in place to ensure rates remain just and reasonable without26
rate caps. First, as discussed previously, CenturyLink QC faces significant competition to27
its regulated voice services from a variety of alternative providers across most of its28
Oregon service territory and there is every expectation that the competition will continue to29
intensify. The company’s commitment to maintain the existing levels of deaveraging30
ensures the market disciplines CenturyLink QC’s pricing initiatives across its entire service31
CTL/200Felz/19
19
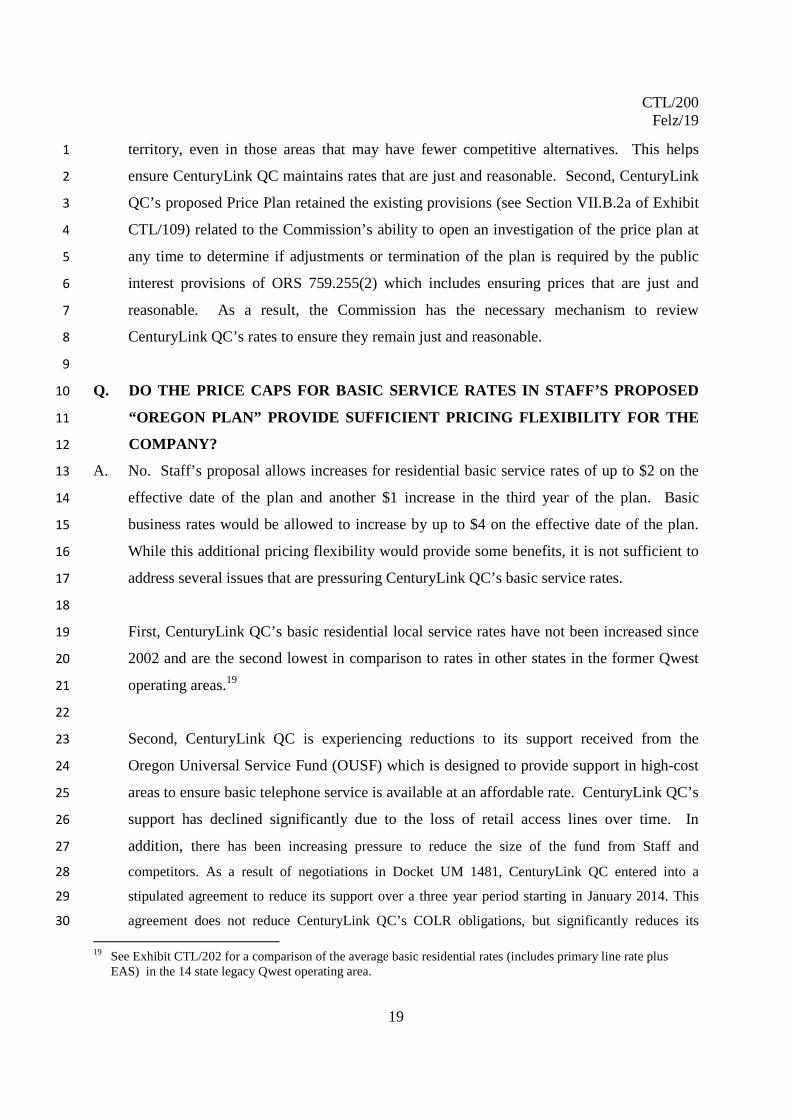
territory, even in those areas that may have fewer competitive alternatives. This helps1
ensure CenturyLink QC maintains rates that are just and reasonable. Second, CenturyLink2
QC’s proposed Price Plan retained the existing provisions (see Section VII.B.2a of Exhibit3
CTL/109) related to the Commission’s ability to open an investigation of the price plan at4
any time to determine if adjustments or termination of the plan is required by the public5
interest provisions of ORS 759.255(2) which includes ensuring prices that are just and6
reasonable. As a result, the Commission has the necessary mechanism to review7
CenturyLink QC’s rates to ensure they remain just and reasonable.8
9
Q. DO THE PRICE CAPS FOR BASIC SERVICE RATES IN STAFF’S PROPOSED10
“OREGON PLAN” PROVIDE SUFFICIENT PRICING FLEXIBILITY FOR THE11
COMPANY?12
A. No. Staff’s proposal allows increases for residential basic service rates of up to $2 on the13
effective date of the plan and another $1 increase in the third year of the plan. Basic14
business rates would be allowed to increase by up to $4 on the effective date of the plan.15
While this additional pricing flexibility would provide some benefits, it is not sufficient to16
address several issues that are pressuring CenturyLink QC’s basic service rates.17
18
First, CenturyLink QC’s basic residential local service rates have not been increased since19
2002 and are the second lowest in comparison to rates in other states in the former Qwest20
operating areas.1921
22
Second, CenturyLink QC is experiencing reductions to its support received from the23
Oregon Universal Service Fund (OUSF) which is designed to provide support in high-cost24
areas to ensure basic telephone service is available at an affordable rate. CenturyLink QC’s25
support has declined significantly due to the loss of retail access lines over time. In26
addition, there has been increasing pressure to reduce the size of the fund from Staff and27
competitors. As a result of negotiations in Docket UM 1481, CenturyLink QC entered into a28
stipulated agreement to reduce its support over a three year period starting in January 2014. This29
agreement does not reduce CenturyLink QC’s COLR obligations, but significantly reduces its30
19 See Exhibit CTL/202 for a comparison of the average basic residential rates (includes primary line rate plusEAS) in the 14 state legacy Qwest operating area.
CTL/200Felz/20
20
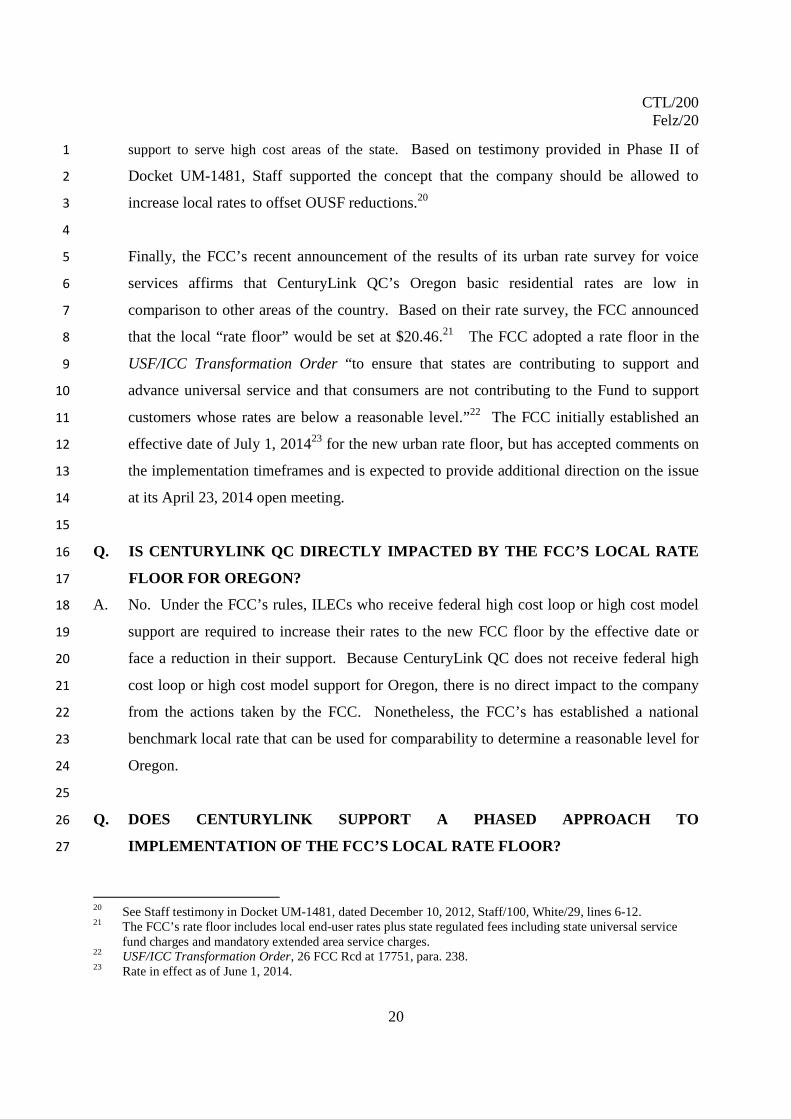
support to serve high cost areas of the state. Based on testimony provided in Phase II of1
Docket UM-1481, Staff supported the concept that the company should be allowed to2
increase local rates to offset OUSF reductions.203
4
Finally, the FCC’s recent announcement of the results of its urban rate survey for voice5
services affirms that CenturyLink QC’s Oregon basic residential rates are low in6
comparison to other areas of the country. Based on their rate survey, the FCC announced7
that the local “rate floor” would be set at $20.46.21 The FCC adopted a rate floor in the8
USF/ICC Transformation Order “to ensure that states are contributing to support and9
advance universal service and that consumers are not contributing to the Fund to support10
customers whose rates are below a reasonable level.”22 The FCC initially established an11
effective date of July 1, 201423 for the new urban rate floor, but has accepted comments on12
the implementation timeframes and is expected to provide additional direction on the issue13
at its April 23, 2014 open meeting.14
15
Q. IS CENTURYLINK QC DIRECTLY IMPACTED BY THE FCC’S LOCAL RATE16
FLOOR FOR OREGON?17
A. No. Under the FCC’s rules, ILECs who receive federal high cost loop or high cost model18
support are required to increase their rates to the new FCC floor by the effective date or19
face a reduction in their support. Because CenturyLink QC does not receive federal high20
cost loop or high cost model support for Oregon, there is no direct impact to the company21
from the actions taken by the FCC. Nonetheless, the FCC’s has established a national22
benchmark local rate that can be used for comparability to determine a reasonable level for23
Oregon.24
25
Q. DOES CENTURYLINK SUPPORT A PHASED APPROACH TO26
IMPLEMENTATION OF THE FCC’S LOCAL RATE FLOOR?27
20 See Staff testimony in Docket UM-1481, dated December 10, 2012, Staff/100, White/29, lines 6-12.21 The FCC’s rate floor includes local end-user rates plus state regulated fees including state universal service
fund charges and mandatory extended area service charges.22 USF/ICC Transformation Order, 26 FCC Rcd at 17751, para. 238.23 Rate in effect as of June 1, 2014.
CTL/200Felz/21
21
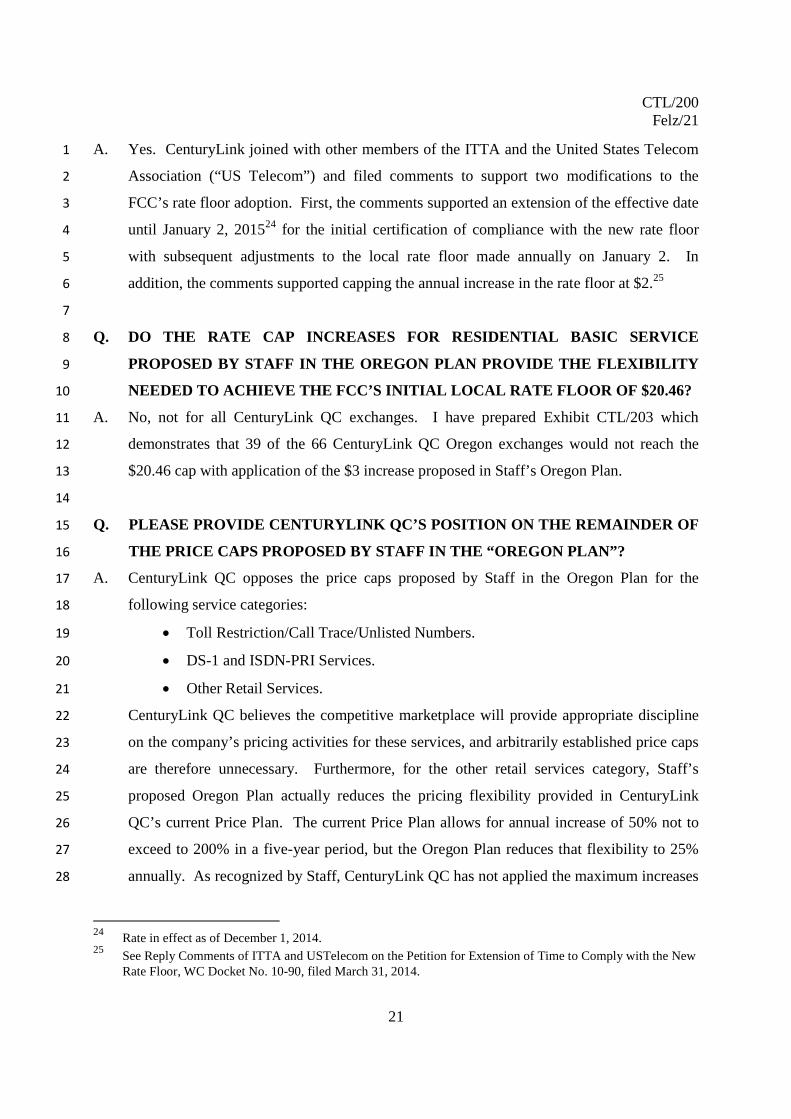
A. Yes. CenturyLink joined with other members of the ITTA and the United States Telecom1
Association (“US Telecom”) and filed comments to support two modifications to the2
FCC’s rate floor adoption. First, the comments supported an extension of the effective date3
until January 2, 201524 for the initial certification of compliance with the new rate floor4
with subsequent adjustments to the local rate floor made annually on January 2. In5
addition, the comments supported capping the annual increase in the rate floor at $2.256
7
Q. DO THE RATE CAP INCREASES FOR RESIDENTIAL BASIC SERVICE8
PROPOSED BY STAFF IN THE OREGON PLAN PROVIDE THE FLEXIBILITY9
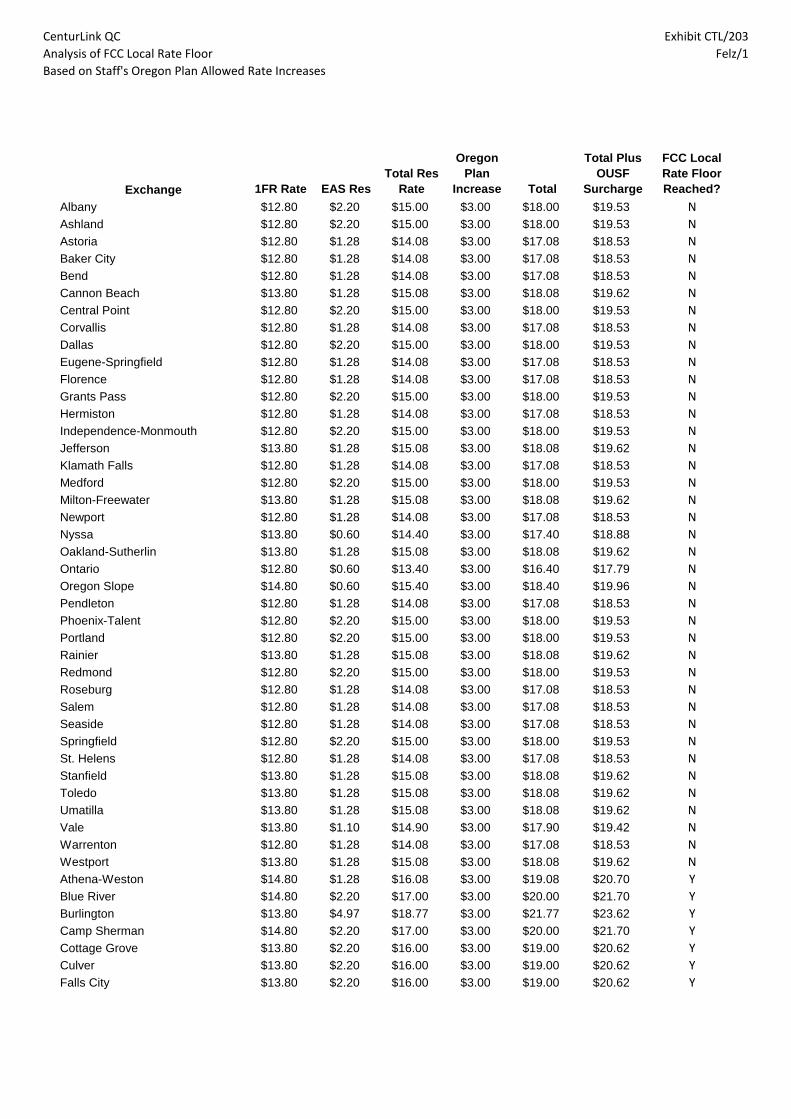
NEEDED TO ACHIEVE THE FCC’S INITIAL LOCAL RATE FLOOR OF $20.46?10
A. No, not for all CenturyLink QC exchanges. I have prepared Exhibit CTL/203 which11
demonstrates that 39 of the 66 CenturyLink QC Oregon exchanges would not reach the12
$20.46 cap with application of the $3 increase proposed in Staff’s Oregon Plan.13
14
Q. PLEASE PROVIDE CENTURYLINK QC’S POSITION ON THE REMAINDER OF15
THE PRICE CAPS PROPOSED BY STAFF IN THE “OREGON PLAN”?16
A. CenturyLink QC opposes the price caps proposed by Staff in the Oregon Plan for the17
following service categories:18
Toll Restriction/Call Trace/Unlisted Numbers.19
DS-1 and ISDN-PRI Services.20
Other Retail Services.21
CenturyLink QC believes the competitive marketplace will provide appropriate discipline22
on the company’s pricing activities for these services, and arbitrarily established price caps23
are therefore unnecessary. Furthermore, for the other retail services category, Staff’s24
proposed Oregon Plan actually reduces the pricing flexibility provided in CenturyLink25
QC’s current Price Plan. The current Price Plan allows for annual increase of 50% not to26
exceed to 200% in a five-year period, but the Oregon Plan reduces that flexibility to 25%27
annually. As recognized by Staff, CenturyLink QC has not applied the maximum increases28
24Rate in effect as of December 1, 2014.
25See Reply Comments of ITTA and USTelecom on the Petition for Extension of Time to Comply with the NewRate Floor, WC Docket No. 10-90, filed March 31, 2014.

CTL/200Felz/22
22
allowed in this category, and in doing so has demonstrated that it is the market that drives1
its pricing decisions and not the establishment of arbitrarily determined rate caps.2
CenturyLink QC believes rather than further restricting pricing flexibility in this category,3
the Commission should eliminate the price cap as it is no longer needed to discipline the4
company’s pricing for these services.5
6
Q. ARE YOU AWARE OF STUDIES THAT HAVE EVALUATED IMPACTS IN7
OTHER STATES WHERE THE TYPE OF PRICING FLEXIBILITY PROPOSED8
BY CENTURYLINK QC IN THIS CASE HAS BEEN GRANTED?9
A. Yes. A study of telecommunications deregulation across the country was completed by the10
National Regulatory Research Institute (NRRI) and published in April 2013.26 The key11
conclusion of the study is found in the following quote:12
13
“It is too early to judge accurately the long-term effects of deregulation on carriers14
and consumers, but the early experience from the states that deregulated between15
2006 and 2012 shows that, with some exceptions, the dire impacts on pricing and16
service availability forecasted by opponents of the legislation have not yet appeared.17
While there have been some reports of price increases by deregulated carriers and18
reductions in service quality as carriers reduce the maintenance of their embedded19
copper plant, the vast majority of consumers still have access to local and long-20
distance calling services from a variety of carriers, using multiple access21
technologies.”2722
The NRRI study also provides an important finding from a Cato Institute study:23
“A Cato Institute study published in the fall 2012 issue of Regulation points out that24
while critics have argued that the monopoly power of the incumbent providers would25
result in large price increases should state laws remove commission oversight of retail26
pricing, these dire predictions have not materialized.27
Trends in telephone price indices show that state regulators were correct in28
concluding that competition would discipline the price of telephone service. Indeed,29
prices for telephone service, including both wireless service (which has never been30
26 See Telecommunications Deregulation: Updating the Scorecard for 2013, Sherry Lichtenberg, Ph.D., NationalRegulatory Research Institute, April 2013 (NRRI Telecommunications Deregulation Report – 2013 Scorecard”;available at http://www.nrri.org/documents/317330/0e3a5988-6f57-492d-8ce5-70926cfe68f4?version=1.5).
27 NRRI Telecommunications Deregulation Report – 2013 Scorecard, page 34, emphasis added.

CTL/200Felz/23
23
subject to price controls) and landline service, have fallen consistently in real terms1
since the mid-1990s.282
3
Q. DID THE NRRI STUDY PROVIDE AN ASSESSMENT OF RECENT STATE4
DEREGULATION INITIATIVES?5
A. Yes. Following are quotes from the study relative to impacts of recent specific6
deregulation initiatives in Florida and Wisconsin and more general information on survey7
results from other states:8
“The impact of the reduction of telecommunications oversight on Florida consumers9appears to have been minor so far. According to Beth Salak, Director of the Office of10Telecommunications, "We have seen no significant negative impacts from the11commission's changed responsibilities." The primary ILEC in Florida, AT&T, has12continued to offer basic service, although prices have increased. Prices for Lifeline13service have also increased, due to reductions in the amount carriers receive from the14FCC and reductions in Universal Service Funding. Carriers have not left the state or15reduced service.”29
1617
“As in Florida, Wisconsin has seen few (if any) consumer problems caused by the18
deregulation of telecommunications. Commission staff continues to monitor the19
number and type of complaints received but has seen no increase in volumes or types20
of concerns. Carriers have not left the market or dropped basic landline service or21
required customers to purchase product bundles rather than standalone local wireline22
service in rural or hard-to-serve portions of the state.”3023
“The 35 states/municipalities responding to the NRRI survey reported experiences24
similar to those of Florida and Wisconsin, primarily minor price increases and the25elimination of some basic service requirements. No state reported that a carrier had26
withdrawn service from a location they deemed "unprofitable" or had forced27
customers to move from traditional wireline service to wireless only or to another28
carrier. Finally, there has been no spike in customer complaints, including29
complaints regarding slamming, billing, or failure to provide service.”3130
31
Q. DID THE NRRI STUDY COMMENT ON THE EXPERIENCE IN CALIFORNIA32
AFTER PRICING REGULATION WAS REMOVED THAT WAS RAISED AS A33
CONCERN IN THE TESTIMONIES OF STAFF AND CUB?34
28 Jeffrey A. Eisenach and Kevin M. Caves, What Happens When Local Phone Service is Deregulated? Fall 2012,available at http://www.aei.org/files/2012/09/26/-eisenach-cato-phone-deregulation-paper_09341082848.pdf
29 NRRI Telecommunications Deregulation Report – 2013 Scorecard, page 36.30 NRRI Telecommunications Deregulation Report – 2013 Scorecard, page 37.31 NRRI Telecommunications Deregulation Report – 2013 Scorecard, page 38.

CTL/200Felz/24
24
A. Yes. The NRRI study presents the California situation as an aberration from the general1
experience described in the quotes above:2
“On the opposite side of the equation, wireline prices in California have increased3dramatically since the state's major wireline carriers were price deregulated in 2006.4According to a 2010 report by the California Public Utility Commission (CPUC), the rate5for basic service has increased over 100% in the course of five years, going from $10.946in 2005 to $23.00 in 2010.”32
7
8
Q. CAN YOU RESPOND TO CUB’S POSITION THAT CENTURYLINK SHOULD9
PROIVDE CUSTOMER BENEFITS TO OFFSET RISING10
TELECOMMUNICATIONS COSTS?11
A. CUB’s position is that the company be required to provide a public benefit offset for its12
proposed pricing flexibility33 is not a requirement of the statute governing price regulation13
plans (ORS 759.255). CenturyLink is seeking additional pricing flexibility based on a14
demonstration that it operates in a competitive market and its pricing should be disciplined15
by that competitive marketplace and not by regulation. To require that CenturyLink QC16
essentially “buy” pricing flexibility through offsetting public benefits applies a requirement17
that is not contemplated by the Oregon statutes.18
19
VI. WAIVERS OF RULES AND STATUTES20
21
Q. WHAT IS THE PURPOSE OF THIS SECTION OF YOUR TESTIMONY?22
A. In this section of my testimony, I will respond to the positions of Staff and Integra on23
several CenturyLink QC’s proposed waivers of statutes and rules. I will address only the24
proposed statute and rule waivers for which parties oppose CenturyLink QC’s proposed25
waivers.26
27
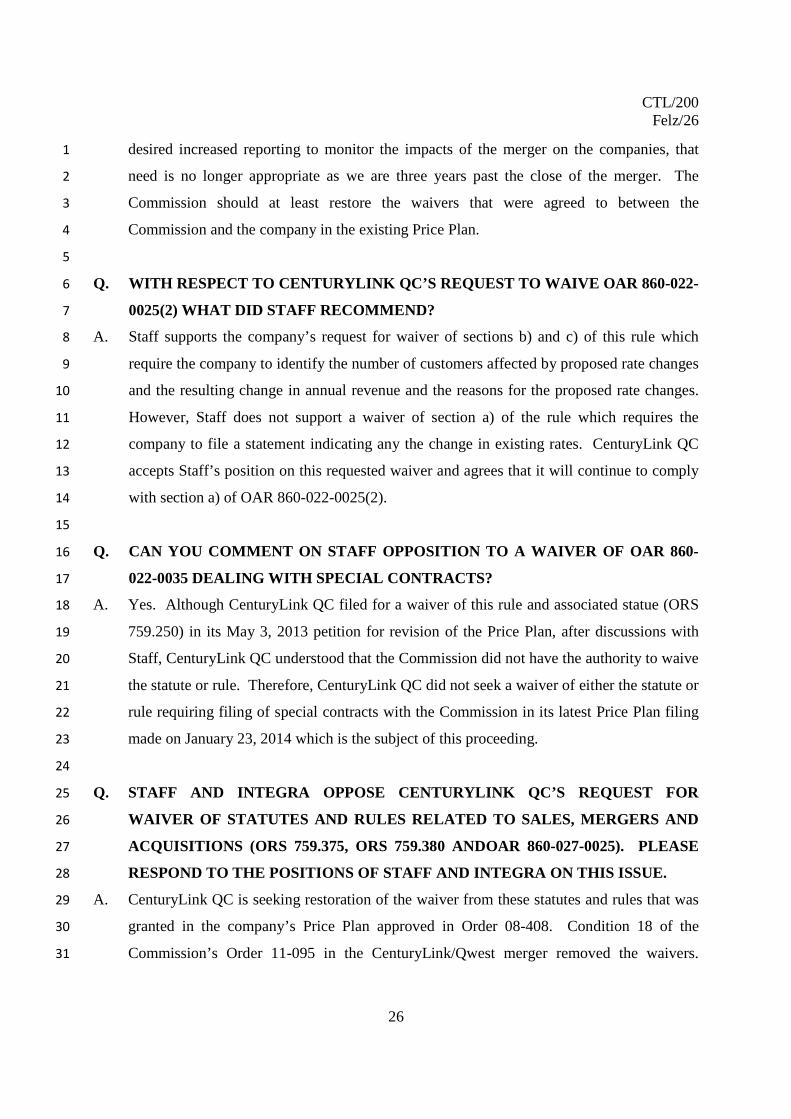
Q. PLEASE COMMENT ON STAFF’S POSITION REGARDING CENTURYLINK28
QC’S REQUEST TO WAIVE SEVERAL FINANCIAL REPORTING STATUTES29
AND RULES?30
32 NRRI Telecommunications Deregulation Report – 2013 Scorecard, page 35.33 See CUB/100, Jenks/4, lines 5-11.

CTL/200Felz/25
25
A. CenturyLink QC sought waivers from the following related statutes and rules associated1
with financial reporting:2
ORS 759.120 Form and manner of accounts prescribed by Commission.3
ORS 759.125 Records and accounts prescribed by Commission.4
ORS 759.130 Closing date of accounts.5
Condition 11 in Commission Order No. 11-095 – Form O and Form I6
OAR 860-027-0050 Uniform system of accounts for large telecommunications7
utilities.8
OAR 860-027-0070 Annual report requirements for electric, large9
telecommunications, gas, and steam heat utilities.10
11
Staff’s general position on these statutes and rules is that CenturyLink QC should continue12
to file the Commission’s Annual Report Form O annually and the Oregon Separated13
Results of Operations Report Form I every three years. Staff explains that they use the14
information from the Form O “ . . . to determine applicable OUSF support; monitor and15
observe the current state and health of the Company and the network; respond to fact-based16
inquiries from Commissioners; and make recommendations regarding the continued17
suitability of the Price Plan.” They also assert that the reporting is not burdensome for the18
company because the company must maintain the same information for its own purposes in19
managing its business.20
21
As documented in its initial Price Plan, CenturyLink QC had at least partial waivers for22
several of these statutes and rules resulting from Commission Order No. 06-514 or23
correspondence between CenturyLink QC and the Commission from May 4, 2004 through24
December 21, 2004. Included were waivers of sections of Form O and agreements25
allowing replacement of other Form O sections and the entire Form I reporting. However,26
as a condition of merger approval, the Commission reimposed in merger condition 11 the27
requirement to provide the standard Form O and Form I reports. While Commission Staff28
has subsequently stated that Form I will only be required every three years, the net result of29
these actions has been to reimpose much of the regulatory burden that the company and the30
Commission had previously agreed was not necessary. To the extent the Commission31
CTL/200Felz/26
26
desired increased reporting to monitor the impacts of the merger on the companies, that1
need is no longer appropriate as we are three years past the close of the merger. The2
Commission should at least restore the waivers that were agreed to between the3
Commission and the company in the existing Price Plan.4
5
Q. WITH RESPECT TO CENTURYLINK QC’S REQUEST TO WAIVE OAR 860-022-6
0025(2) WHAT DID STAFF RECOMMEND?7
A. Staff supports the company’s request for waiver of sections b) and c) of this rule which8
require the company to identify the number of customers affected by proposed rate changes9
and the resulting change in annual revenue and the reasons for the proposed rate changes.10
However, Staff does not support a waiver of section a) of the rule which requires the11
company to file a statement indicating any the change in existing rates. CenturyLink QC12
accepts Staff’s position on this requested waiver and agrees that it will continue to comply13
with section a) of OAR 860-022-0025(2).14
15
Q. CAN YOU COMMENT ON STAFF OPPOSITION TO A WAIVER OF OAR 860-16
022-0035 DEALING WITH SPECIAL CONTRACTS?17
A. Yes. Although CenturyLink QC filed for a waiver of this rule and associated statue (ORS18
759.250) in its May 3, 2013 petition for revision of the Price Plan, after discussions with19
Staff, CenturyLink QC understood that the Commission did not have the authority to waive20
the statute or rule. Therefore, CenturyLink QC did not seek a waiver of either the statute or21
rule requiring filing of special contracts with the Commission in its latest Price Plan filing22
made on January 23, 2014 which is the subject of this proceeding.23
24
Q. STAFF AND INTEGRA OPPOSE CENTURYLINK QC’S REQUEST FOR25
WAIVER OF STATUTES AND RULES RELATED TO SALES, MERGERS AND26
ACQUISITIONS (ORS 759.375, ORS 759.380 ANDOAR 860-027-0025). PLEASE27
RESPOND TO THE POSITIONS OF STAFF AND INTEGRA ON THIS ISSUE.28
A. CenturyLink QC is seeking restoration of the waiver from these statutes and rules that was29
granted in the company’s Price Plan approved in Order 08-408. Condition 18 of the30
Commission’s Order 11-095 in the CenturyLink/Qwest merger removed the waivers.31

CTL/200Felz/27
27
CenturyLink QC agreed to be subject to the Commission’s review of the1
CenturyLink/Qwest merger because the acquiring company, CenturyLink did not have a2
waiver from these statutes and rules. Further, CenturyLink understood that the relative size3
of the entities involved in the merger introduced a level of uncertainty on the part of the4
Commission and other parties. The Commission ultimately approved the merger, subject5
to a number of conditions. In the three years since the merger closed, the former Qwest,6
Embarq and CenturyTel entities are fully integrated into a consolidated CenturyLink that7
has satisfied all the applicable Oregon merger conditions and has demonstrated that it is8
committed to serving its Oregon customers. Therefore, CenturyLink believes the9
uncertainties that existed at the time of the CenturyLink/Qwest merger have been addressed10
and there is no reason not to eliminate Condition 18 and return this waiver to the Price11
Plan. Moreover, CenturyLink’s competitors that now garner larger shares of the voice12
telephony market are not subject to this requirement.13
14
Q. STAFF AND INTEGRA OPPOSE CENTURYLINK QC’S REQUEST FOR15
WAIVERS OF AFFILIATE INTEREST CONTRACT REQUIREMENTS (ORS16
759.390, ORS 759.393, AND OAR 860-027-0100). PLEASE RESPOND TO STAFF’S17
POSITION.18
A. The Commission previously granted CenturyLink QC waivers of affiliate interest statutes19
and rules in the current Price Plan and the company is simply proposing to continue those20
waivers. Both Staff and Integra express concern that wholesale contracts between21
CenturyLink QC and its CLEC affiliates for services such as interconnection, traffic22
exchange, tandem switching, transport and special access, should be available for23
Commission review. The fact is that CenturyLink QC is obligated under Section 252 of the24
Telecommunications Act of 1996 (Act) to file interconnection agreements with the25
Commission for approval. The Act also requires that CenturyLink offer terms for26
interconnection services on a non-discriminatory basis. Finally, for services that are27
tariffed, such as special access, any such services that CenturyLink QC provides to its28
affiliates, must be provided on the same tariffed rates, terms and conditions that it makes29
available to all other customers of the service.30
31

CTL/200Felz/28
28
Q. STAFF OPPOSES CENTURYLINK QC’S PROPOSED WAIVER OF OAR 860-023-1
0055 - RETAIL TELECOMMUNICATIONS SERVICE STANDARDS FOR LARGE2
TELECOMMUNICATIONS UTILITIES. PLEASE RESPOND TO STAFF’S3
POSITION ON THIS PROPOSED WAIVER.4
A. CenturyLink QC would like to clarify that its proposal was for a partial waiver of this rule5
related only to reporting. CenturyLink QC affirmed that it will continue to be subject to the6
specific service standards identified in OAR 860-023-055. However, CenturyLink QC7
sought exceptions from the reporting requirements of the rule to allow reporting on a8
quarterly basis instead of monthly, and reporting of exceptions only. CenturyLink QC’s9
rationale for its proposed partial waiver of this rule is provided in the service quality10
section of my testimony.11
12
Q. DID INTEGRA EXPRESS CONCERNS ABOUT CENTURYLINK QC’S13
PROPOSED RULE WAIVER FOR RETAIL SERVICE QUALITY REPORTING?14
A. Yes. Integra wants to ensure that CenturyLink QC’s proposed retail service quality15
reporting changes do not impact wholesale service quality reporting. CenturyLink QC16
affirms that nothing in its proposed modifications to retail service quality reporting will17
impact its wholesale service quality reporting. As Integra notes, CenturyLink’s obligations18
with respect to wholesale service quality reporting are governed by the CenturyLink19
Performance Assurance Plan (“CPAP”) that cannot be modified without negotiations with20
its wholesale customers and Commission approval. CenturyLink’s proposed modifications21
to retail service quality reporting will not impact its ability to provide monthly wholesale22
service quality reporting, including incorporation of required retail comparables.23
24
Q. COULD YOU ADDRESS INTEGRA’S CONCERNS ABOUT CENTURYLINK25
QC’S PROPOSED RULE WAIVER OF OAR 860-022-0042(4) ASSOCIATED WITH26
THE PRIVILEGE TAX?27
A. Yes. Integra wants to ensure that if CenturyLink QC’s waiver request is granted, and the28
company is allowed to fully pass through government imposed privilege taxes, Integra’s29
wholesale rates would not increase. It is my understanding that the current wholesale rates30
do not include a mark-up for recovery of privilege taxes of 4% or less. However,31

CTL/200Felz/29
29
CenturyLink QC does apply privilege taxes in excess of 4% to wholesale services which1
meet the definition of “local exchange access.” Therefore, if CenturyLink QC’s waiver is2
granted, CenturyLink QC would not seek to increase wholesale rates but would apply the3
full privilege tax for wholesale services purchased in those areas with tax rates greater than4
4%.5
6
VII. SUMMARY7
8
Q. COULD YOU PLEASE SUMMARIZE YOUR REPLY TESTIMONY?9
A. Yes. CenturyLink QC’s proposed Price Plan modifications seeking elimination of price10
caps is supported by the pervasive competition documented in my Direct Testimony.11
Although Staff and CUB argue that competitive alternatives are not available to all12
customers in specific geographic or demographic market segments, the pervasive13
competition throughout CenturyLink QC’s service territory provides protection for14
customers for all areas, even those with more limited competition. The pricing discipline15
provided in the more competitive areas limits CenturyLink QC’s market power and16
constrains its prices throughout the state. This concept is reinforced with CenturyLink17
QC’s commitment that it will not geographically deaverage the rates for basic service under18
the plan any further than they were on the effective date of the plan. The combination of19
pricing discipline provided by competition and the commitment to maintaining a local rate20
structure that reflects the same level of geographic deaveraging helps ensure that rates will21
remain just and reasonable without the imposition of price caps. Further, CenturyLink22
QC’s modified Price Plan retains the existing provision that allows the Commission to open23
an investigation of the Price Plan at any time to determine if adjustments or termination of24
the plan is required by the public interest provisions of ORS 759.255(2).25
26
Q. DOES THIS CONCLUDE YOUR REPLY TESTIMONY?27
A. Yes, it does.28

Legacy Qwest
Residential Local Rates by StateExhibit CTL/202
$25
Residential Rate Comparison*
$20
$25
18.9719.96 20.1
21.25
22.4523.1
$15
$20
14.73 14.93 15 15.16
16.81 17 17.0818.07
18.97
$10
$5
$0
MT OR WA AZ NM CO MN UT ND NE IA SD ID WY
CenturLink QC
Analysis of FCC Local Rate Floor
Based on Staff's Oregon Plan Allowed Rate Increases
Exhibit CTL/203
Felz/1
Exchange 1FR Rate EAS Res
Total Res
Rate
Oregon
Plan
Increase Total
Total Plus
OUSF
Surcharge
FCC Local
Rate Floor
Reached?
Albany $12.80 $2.20 $15.00 $3.00 $18.00 $19.53 N
Ashland $12.80 $2.20 $15.00 $3.00 $18.00 $19.53 N
Astoria $12.80 $1.28 $14.08 $3.00 $17.08 $18.53 N
Baker City $12.80 $1.28 $14.08 $3.00 $17.08 $18.53 N
Bend $12.80 $1.28 $14.08 $3.00 $17.08 $18.53 N
Cannon Beach $13.80 $1.28 $15.08 $3.00 $18.08 $19.62 N
Central Point $12.80 $2.20 $15.00 $3.00 $18.00 $19.53 N
Corvallis $12.80 $1.28 $14.08 $3.00 $17.08 $18.53 N
Dallas $12.80 $2.20 $15.00 $3.00 $18.00 $19.53 N
Eugene-Springfield $12.80 $1.28 $14.08 $3.00 $17.08 $18.53 N
Florence $12.80 $1.28 $14.08 $3.00 $17.08 $18.53 N
Grants Pass $12.80 $2.20 $15.00 $3.00 $18.00 $19.53 N
Hermiston $12.80 $1.28 $14.08 $3.00 $17.08 $18.53 N
Independence-Monmouth $12.80 $2.20 $15.00 $3.00 $18.00 $19.53 N
Jefferson $13.80 $1.28 $15.08 $3.00 $18.08 $19.62 N
Klamath Falls $12.80 $1.28 $14.08 $3.00 $17.08 $18.53 N
Medford $12.80 $2.20 $15.00 $3.00 $18.00 $19.53 N
Milton-Freewater $13.80 $1.28 $15.08 $3.00 $18.08 $19.62 N
Newport $12.80 $1.28 $14.08 $3.00 $17.08 $18.53 N
Nyssa $13.80 $0.60 $14.40 $3.00 $17.40 $18.88 N
Oakland-Sutherlin $13.80 $1.28 $15.08 $3.00 $18.08 $19.62 N
Ontario $12.80 $0.60 $13.40 $3.00 $16.40 $17.79 N
Oregon Slope $14.80 $0.60 $15.40 $3.00 $18.40 $19.96 N
Pendleton $12.80 $1.28 $14.08 $3.00 $17.08 $18.53 N
Phoenix-Talent $12.80 $2.20 $15.00 $3.00 $18.00 $19.53 N
Portland $12.80 $2.20 $15.00 $3.00 $18.00 $19.53 N
Rainier $13.80 $1.28 $15.08 $3.00 $18.08 $19.62 N
Redmond $12.80 $2.20 $15.00 $3.00 $18.00 $19.53 N
Roseburg $12.80 $1.28 $14.08 $3.00 $17.08 $18.53 N
Salem $12.80 $1.28 $14.08 $3.00 $17.08 $18.53 N
Seaside $12.80 $1.28 $14.08 $3.00 $17.08 $18.53 N
Springfield $12.80 $2.20 $15.00 $3.00 $18.00 $19.53 N
St. Helens $12.80 $1.28 $14.08 $3.00 $17.08 $18.53 N
Stanfield $13.80 $1.28 $15.08 $3.00 $18.08 $19.62 N
Toledo $13.80 $1.28 $15.08 $3.00 $18.08 $19.62 N
Umatilla $13.80 $1.28 $15.08 $3.00 $18.08 $19.62 N
Vale $13.80 $1.10 $14.90 $3.00 $17.90 $19.42 N
Warrenton $12.80 $1.28 $14.08 $3.00 $17.08 $18.53 N
Westport $13.80 $1.28 $15.08 $3.00 $18.08 $19.62 N
Athena-Weston $14.80 $1.28 $16.08 $3.00 $19.08 $20.70 Y
Blue River $14.80 $2.20 $17.00 $3.00 $20.00 $21.70 Y
Burlington $13.80 $4.97 $18.77 $3.00 $21.77 $23.62 Y
Camp Sherman $14.80 $2.20 $17.00 $3.00 $20.00 $21.70 Y
Cottage Grove $13.80 $2.20 $16.00 $3.00 $19.00 $20.62 Y
Culver $13.80 $2.20 $16.00 $3.00 $19.00 $20.62 Y
Falls City $13.80 $2.20 $16.00 $3.00 $19.00 $20.62 Y
CenturLink QC
Analysis of FCC Local Rate Floor
Based on Staff's Oregon Plan Allowed Rate Increases
Exhibit CTL/203
Felz/2
Exchange 1FR Rate EAS Res
Total Res
Rate
Oregon
Plan
Increase Total
Total Plus
OUSF
Surcharge
FCC Local
Rate Floor
Reached?
Gold Hill $13.80 $2.20 $16.00 $3.00 $19.00 $20.62 Y
Jacksonville $13.80 $2.20 $16.00 $3.00 $19.00 $20.62 Y
Junction City $13.80 $2.20 $16.00 $3.00 $19.00 $20.62 Y
Lake Oswego $12.80 $4.97 $17.77 $3.00 $20.77 $22.54 Y
Lapine $13.80 $2.20 $16.00 $3.00 $19.00 $20.62 Y
Leaburg $14.80 $2.20 $17.00 $3.00 $20.00 $21.70 Y
Lowell $13.80 $2.20 $16.00 $3.00 $19.00 $20.62 Y
Madras $13.80 $2.20 $16.00 $3.00 $19.00 $20.62 Y
Mapleton $14.80 $1.28 $16.08 $3.00 $19.08 $20.70 Y
Marcola $14.80 $2.20 $17.00 $3.00 $20.00 $21.70 Y
North Plains $12.80 $4.97 $17.77 $3.00 $20.77 $22.54 Y
Oak Grove-Milwaukie $12.80 $4.97 $17.77 $3.00 $20.77 $22.54 Y
Oakridge $14.80 $2.20 $17.00 $3.00 $20.00 $21.70 Y
Oregon City $12.80 $4.97 $17.77 $3.00 $20.77 $22.54 Y
Prineville $13.80 $2.20 $16.00 $3.00 $19.00 $20.62 Y
Rogue River $13.80 $2.20 $16.00 $3.00 $19.00 $20.62 Y
Siletz $14.80 $1.28 $16.08 $3.00 $19.08 $20.70 Y
Sisters $13.80 $2.20 $16.00 $3.00 $19.00 $20.62 Y
Veneta $13.80 $2.20 $16.00 $3.00 $19.00 $20.62 Y
Woodburn-Hubbard $12.80 $4.97 $17.77 $3.00 $20.77 $22.54 Y
CenturyLink QC - Oregon
Analaysis of Form O Line InformationExhibit CTL/204
FORM O: Yr 2004 Yr 2008 Yr 2012
% decline
2008-
2012
% decline
2004-
2012
Residential 802,454 535,329 295,072 -45% -63%
Business 284,557 246,233 182,148 -26% -36%
Other (incl sw access) 10,909 6,592 2,596 -61% -76%
Subtotal 1,097,920 788,154 479,816 -39% -56%
UNEs 273,410 84,941 57,447 -32% -79%
Pvt line & wideband 845,643 1,130,293 925,243 -18% 9%
Grand Total 2,216,973 2,003,388 1,462,506 -27% -34%

Exhibit CTL/205
CenturyLink QC Oregon Expense and Capital Additions Analysis
2003 2004 2005 2006 2007 2008 2009 2010 2011 2012 2013
%
Increase
(Decrease)
Expenses:
Plant Specific Expenses $113,404,359 $131,608,454 $139,093,526 $129,034,152 $110,011,350 $100,595,824 $95,489,059 $89,747,240 $82,937,762 $96,397,584 $94,081,095 -17.0%
Provisioning/Network Ops $45,409,711 $44,900,802 $43,091,442 $41,128,032 $40,758,014 $45,743,154 $39,079,912 $33,906,001 $33,988,037 $42,444,152 $44,858,164 -1.2%
Access Expense $40,168,071 $38,127,911 $39,461,707 $37,880,702 $35,878,622 $37,219,903 $34,979,634 $30,179,673 $14,257,738 $15,445,745 $13,471,689 -66.5%
Depr & Amort Expense $251,918,645 $255,507,390 $255,729,991 $148,179,820 $158,678,520 $156,052,084 $144,665,523 $140,895,325 $143,266,134 $144,638,747 $115,146,589 -54.3%
Customer Ops Expense $123,356,895 $116,109,627 $116,436,146 $112,456,943 $109,052,787 $112,541,848 $103,159,847 $89,426,381 $82,649,108 $74,411,138 $71,696,494 -41.9%
Corp Ops/Other Op Expense $113,692,302 $77,880,062 $71,764,130 $69,921,247 $67,344,587 $50,593,720 $52,094,441 $60,348,332 $64,022,404 $48,496,289 $43,296,294 -61.9%
Total $687,949,983 $664,134,246 $665,576,942 $538,600,896 $521,723,880 $502,746,533 $469,468,416 $444,502,952 $421,121,183 $421,833,656 $382,550,324 -44.4%
Capital Additions $118,091,927 $96,625,725 $77,076,105 $75,012,124 $63,472,510 $75,745,105 $45,259,777 $52,997,918 $75,321,710 $59,675,710 $55,749,192 -52.8%
YE Retail Access Lines 1,141,521 1,062,063 1,022,236 955,226 873,001 773,869 674,271 596,992 528,333 469,335 415,550 -63.6%
Per YE retail Access Line:
Plant Specific Expenses $99 $124 $136 $135 $126 $130 $142 $150 $157 $205 $226 127.9%
Provisioning/Network Ops $40 $42 $42 $43 $47 $59 $58 $57 $64 $90 $108 171.4%
Customer Ops Expense $108 $109 $114 $118 $125 $145 $153 $150 $156 $159 $173 59.7%
Capital Additions $103 $91 $75 $79 $73 $98 $67 $89 $143 $127 $134 29.7%

BEFORE THE PUBLIC UTILITY COMMISSION OF OREGON
DOCKET NO. UM 1354
IN THE MATTER OF THE PETITION OF QWEST |CORPORATION D/B/A CENTURYLINK QC FOR |APPROVAL OF PRICE PLAN PURSUANT TO |ORS 759.255 |
|
REPLY TESTIMONY
OF
VICTORIA HUNNICUTT
ON BEHALF OF
CENTURYLINK QC
April 23, 2014
TABLE OF CONTENTS
I. IDENTIFICATION OF WITNESS ..............................................................1
II. PURPOSE OF DIRECT TESTIMONY .......................................................3
III. RETAIL SERVICE QUALITY STANDARDS.............................................4
A. Commitments Met.......................................................................................................................... 4
B. Provisioning .................................................................................................................................... 6
C. Primary Held Orders ..................................................................................................................... 8
D. Trouble Reports............................................................................................................................ 11
E. Repair Clearing Time .................................................................................................................. 18
F. Business Office and Repair Service Access Time ...................................................................... 25
IV. SERVICE QUALITY REPORTING .........................................................29
V. PERFORMANCE PLAN...........................................................................30
VI. SERVICE RELATED CUSTOMER COMPLAINTS.................................32
VII. SUMMARY OF TESTIMONY..................................................................33
VIII. CONCLUSION .........................................................................................36
TABLE OF FIGURES
Figure 1: Commitments Met Performance................................................................................................ 5
Figure 2: Provisioning Performance ........................................................................................................ 7
Figure 3: Percent Held Orders > 30 Days Performance with Standard ..........................................................10
Figure 4: Percent Primary Held Orders > 30 Days Performance..................................................................10
Figure 5: Wire Centers Missing the TRR Standard by Year with Linear Trend Line .......................................14
Figure 6: Trouble Report Rate (State Level Performance) .........................................................................15
Figure 7: Repair Clearance Time Summarized at the State Level ................................................................24
Figure 8: Trouble Report Rate Performance Summarize at the State Level ...................................................25
Figure 9: Repair Access and Business Office Access Met Rate by Year .......................................................26

CTL/300Hunnicutt/1
I. IDENTIFICATION OF WITNESS1
2
Q. PLEASE STATE YOUR NAME, BUSINESS ADDRESS AND POSITION WITH3
CENTURYLINK QC.4
A. My name is Victoria Hunnicutt. My business address is 1801 California Street, Denver,5
Colorado. I am employed by CenturyLink QC as a Director supporting retail service6
quality advocacy.7
8
Q. PLEASE SUMMARIZE YOUR FORMAL EDUCATIONAL BACKGROUND.9
A. I have earned a Bachelor of Science in Electrical Engineering from the University of10
Virginia. In addition, I have taken numerous telecommunications seminars and classes11
including graduate courses in Telecommunications Management.12
13
Q. PLEASE SUMMARIZE YOUR EMPLOYMENT EXPERIENCE WITH14
CENTURYLINK QC.15
A. I have been employed by CenturyLink QC (formerly, Qwest Corporation and USWest)16
since 1998. My original position was with the transport modeling team in the Pricing and17
Regulatory Matters department as a Cost Analyst. In 1999, I assumed responsibility for the18
Collocation Cost Model, programming the model and producing the cost studies for the19
various CenturyLink QC cost dockets. In 2003, I began working on analyses and20
documentation as part of the Loop Modeling team. In 2004, I began work as a technical21
analyst and developer in the Public Policy department. Starting in 2006, I began providing22
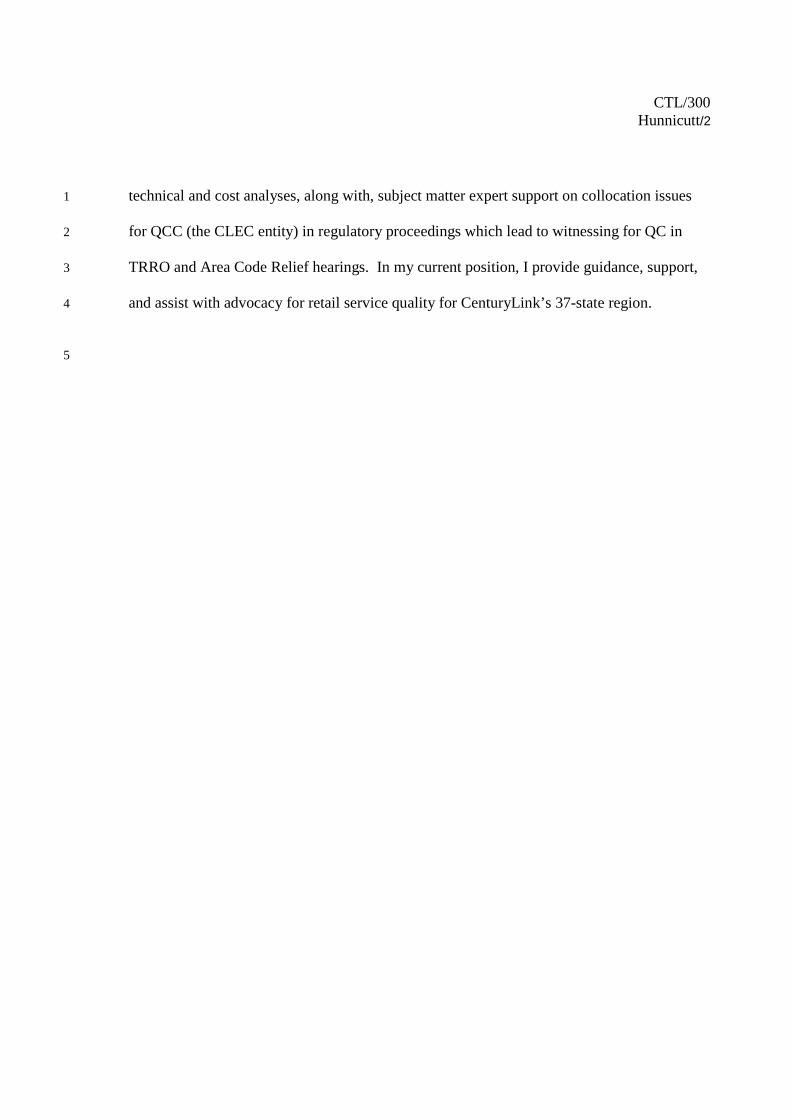
CTL/300Hunnicutt/2
technical and cost analyses, along with, subject matter expert support on collocation issues1
for QCC (the CLEC entity) in regulatory proceedings which lead to witnessing for QC in2
TRRO and Area Code Relief hearings. In my current position, I provide guidance, support,3
and assist with advocacy for retail service quality for CenturyLink’s 37-state region.4
5
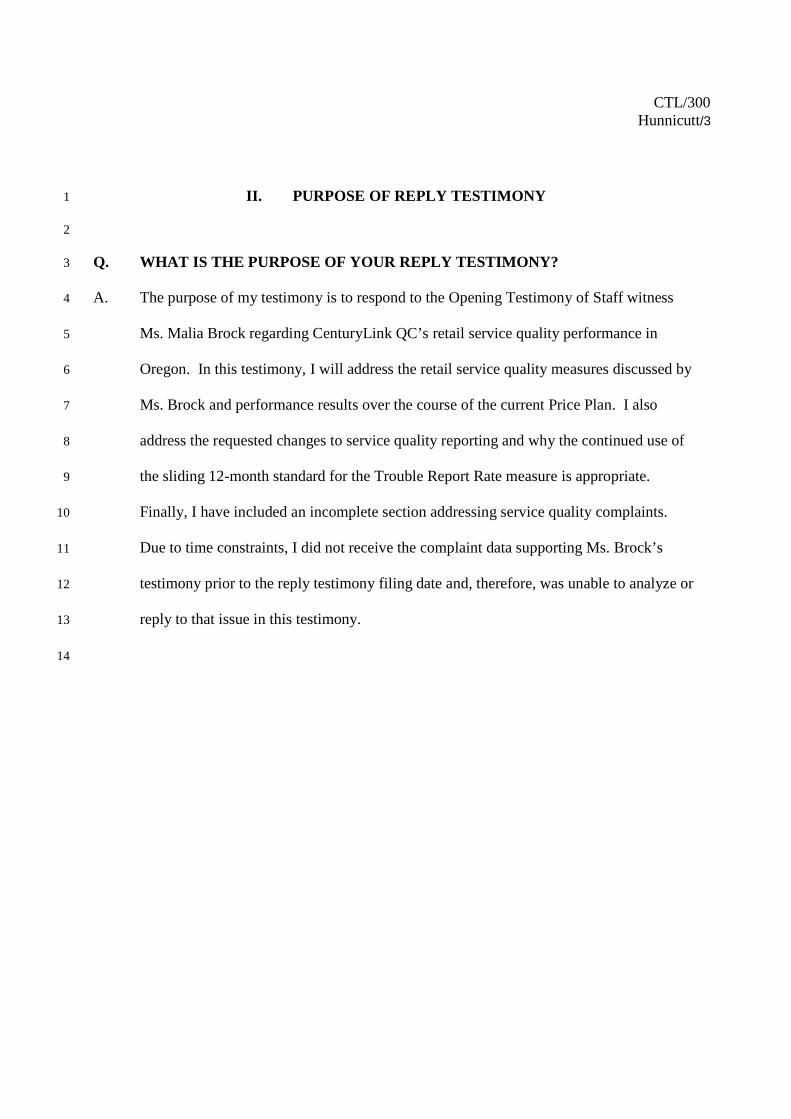
CTL/300Hunnicutt/3
II. PURPOSE OF REPLY TESTIMONY1
2
Q. WHAT IS THE PURPOSE OF YOUR REPLY TESTIMONY?3
A. The purpose of my testimony is to respond to the Opening Testimony of Staff witness4
Ms. Malia Brock regarding CenturyLink QC’s retail service quality performance in5
Oregon. In this testimony, I will address the retail service quality measures discussed by6
Ms. Brock and performance results over the course of the current Price Plan. I also7
address the requested changes to service quality reporting and why the continued use of8
the sliding 12-month standard for the Trouble Report Rate measure is appropriate.9
Finally, I have included an incomplete section addressing service quality complaints.10
Due to time constraints, I did not receive the complaint data supporting Ms. Brock’s11
testimony prior to the reply testimony filing date and, therefore, was unable to analyze or12
reply to that issue in this testimony.13
14

CTL/300Hunnicutt/4
III. RETAIL SERVICE QUALITY STANDARDS1
2
Q. WHAT IS THE PURPOSE OF THIS SECTION OF YOUR TESTIMONY?3
A. In this section I will reply to Ms. Brock’s assertions including her interpretations of the4
measures, her assessment of CenturyLink QC’s performance, and her performance trending5
analyses.6
A. Commitments Met7
Q. DO YOU CONCUR WITH MS. BROCK’S DESCRIPTION OF THE8
COMMITMENTS MET MEASURE (BROCK PAGE 6 LINE 3)?9
A. Yes, I agree that the Commitments Met for Service measure is a good indicator of10
technician staffing levels.11
Q. WITH RESPECT TO THE COMMITMENTS MET PERFORMANCE, DO YOU12
AGREE WITH MS. BROCK’S COUNTER TO CENTURYLINK QC’S13
“ASSERTION THAT IT IS EXCEEDING THE COMMISSION’S STANDARDS IN14
MANY SERVICE QUALITY MEASURES” [STAFF/300, BROCK/10, LINE 14]?15
A. No, I do not agree. CenturyLink QC consistently exceeded the standard during the date16
range of the current Price Plan as demonstrated by the chart, below. A number of other17
measures, discussed herein, are also exceeding the Commission’s standard.18

CTL/300Hunnicutt/5
1
Figure 1: Commitments Met Performance2
The performance results range from 99.34% to 99.93% (tenths and hundredths digits3
displayed to show the minute change in performance over the five year period).4
Q. WHAT DOES THE COMMITMENTS MET PERFORMANCE CHART, ABOVE,5
INDICATE ABOUT CENTURYLINK QC’S SERVICE QUALITY IN THIS AREA?6
A. As Ms. Brock stated, the Commitments Met for Service metric is a good indicator of7
technician staffing levels. If the 90% standard indicates adequate staffing levels, then the8
staffing levels indicated by a consistent, greater-than-99% performance result exceeds9
expectations.10
Q. DOES MS. BROCK AGREE WITH YOUR POSITION THAT CENTURYLINK11
QC’S PERFORMANCE EXCEEDS THE STANDARDS FOR THIS MEASURE?12
A. Yes, although Ms. Brock does not elaborate on how good CenturyLink QC performance is13
with respect to this measure, she simply acknowledges that CenturyLink QC’s14
“performance in relation to standards surrounding Provisioning, Commitments Met, and15

CTL/300Hunnicutt/6
Held Orders have continued to meet or exceed standards” [Staff/300, Brock/11, lines 12 -1
15].2
B. Provisioning3
Q. DO YOU CONCUR WITH MS. BROCK’S DESCRIPTION OF THE4
PROVISIONING MEASURE (BROCK PAGE 6 LINE 10)?5
A. Yes, I believe that the Provisioning measure is a good indicator of staffing levels, as well6
as, infrastructure availability.7
Q. WITH RESPECT TO THE COMMITMENTS MET PERFORMANCE, DO YOU8
AGREE WITH MS. BROCK’S COUNTER TO CENTURYLINK QC’S9
“ASSERTION THAT IT IS EXCEEDING THE COMMISSION’S STANDARDS IN10
MANY SERVICE QUALITY MEASURES” [STAFF/300, BROCK/10, LINE 14]?11
A. No, I do not agree. This is another measure where CenturyLink QC has consistently12
exceeded the standard during the date range of the current Price Plan as demonstrated by13
the chart, below.14

CTL/300Hunnicutt/7
1
Figure 2: Provisioning Performance2
Q. WHAT DOES THE PROVISIONING PERFORMANCE CHART, ABOVE,3
INDICATE ABOUT CENTURYLINK QC’S SERVICE QUALITY IN THIS AREA?4
A. As Ms. Brock stated, the Provisioning measure is a good indicator of staffing levels, as5
well as, infrastructure availability. During the six year period since the adoption of the6
current Price Plan, the number of held orders (less than 31 days) in one month ranged from7
a maximum of 49 (less than one-third of the standard) down to a minimum of 7 (less than8
5% of the standard). If the 162 count standard indicates adequate staffing levels and9
infrastructure availability, then the consistently low count exceeds staffing and10
infrastructure expectations.11

CTL/300Hunnicutt/8
Q. DOES MS. BROCK AGREE WITH YOUR POSITION THAT CENTURYLINK1
QC’S PERFORMANCE EXCEEDS THE COMMISSION’S STANDARDS FOR2
THIS MEASURE?3
A. Yes, in passing. Ms. Brock does not go into the same detail on those measures where4
CenturyLink QC’s performance excels, but simply acknowledges that the company’s5
“performance in relation to standards surrounding Provisioning, Commitments Met, and6
Held Orders have continued to meet or exceed standards” [Staff/300, Brock/11, lines 12 -7
15] possibly indicating little to no significance for these three measures in relation to the8
other stipulated measures.9
C. Primary Held Orders10
Q. DO YOU CONCUR WITH MS. BROCK’S DESCRIPTION OF THE PRIMARY11
HELD ORDERS GREATER THAN 30 DAYS MEASURE (BROCK PAGE 6 LINE12
10)?13
A. No, I do not agree that Primary Held Order Greater than 30 Days measure is a good14
indicator of technician staffing levels, but rather a reflection of facility availability.15
Q. DO YOU AGREE WITH MS. BROCK’S DESCRIPTION OF THE STANDARD16
FOR THE PRIMARY HELD ORDER GREATER THAN 30 DAYS MEASURE17
[STAFF/300, BROCK/6, LINE 17]?18
A. No. Ms. Brock’s description of the standard for this measure does not correlate with Staff19
Exhibit 301 at page 5 where the rule states the number of primary held orders must not20

CTL/300Hunnicutt/9
exceed a standard of 10% of the total monthly held orders for lack of facilities [OAR 860-1
023-0055(4)(b)(B)(ii)].2
Q. WITH RESPECT TO THE PRIMARY HELD ORDERS PERFORMANCE, DO3
YOU AGREE WITH MS. BROCK’S COUNTER TO CENTURYLINK QC’S4
“ASSERTION THAT IT IS EXCEEDING THE COMMISSION’S STANDARDS IN5
MANY SERVICE QUALITY MEASURES” [STAFF/300, BROCK/10, LINE 14]?6
A. No, I do not agree. This is another measure where CenturyLink QC has consistently7
exceeded the standard during the date range of the current Price Plan as demonstrated by8
the charts, below.9
Q. HAS CENTURYLINK QC MET THIS 10% STANDARD FOR THE PRIMARY10
HELD ORDER GREATER THAN 30 DAYS MEASURE?11
A. Yes, CenturyLink QC did better than meeting the standard, the company consistently12
exceeded the standard as demonstrated by the chart, below.13
14

CTL/300Hunnicutt/10
Figure 3: Percent Held Orders > 30 Days Performance with Standard1
In order to discern the lines in the chart, above, the scale of the vertical axis must be2
dropped from the 10% standard to 0.5% (1/2 of 1 percent) as in the chart, below.3
4
Figure 4: Percent Primary Held Orders > 30 Days Performance5
Q. WHAT DO THE PRIMARY HELD ORDER PERFORMANCE CHARTS, ABOVE,6
INDICATE ABOUT CENTURYLINK QC’S SERVICE QUALITY IN THIS AREA?7
A. As Ms. Brock stated, the Provisioning and Held Order measures are good indicators of8
infrastructure availability. During the six year period, the number of held orders (less than9
31 days) in one month ranged from a maximum of 49 (less than one-third of the standard)10
down to a minimum of 7 (less than 5% of the standard). If the 162 count standard (two per11
wire center per month) [OAR 860-023-0055(4)(b)(B)(i)] indicates adequate infrastructure12
availability, then the consistently low count exceeds infrastructure expectations.13

CTL/300Hunnicutt/11
Q. DOES MS. BROCK AGREE WITH YOUR POSITION THAT CENTURYLINK1
QC’S PERFORMANCE EXCEEDS THE COMMISSION’S STANDARDS FOR2
THIS MEASURE?3
A. Yes, Ms. Brock leaves open to interpretation whether CenturyLink QC has met or exceeded4
the standard without any data to support any interpretation. Although Ms. Brock does not5
elaborate on how well CenturyLink QC performance is with respect to this measure, she6
simply acknowledges that CenturyLink QC’s “performance in relation to standards7
surrounding Provisioning, Commitments Met, and Held Orders have continued to meet or8
exceed standards”. [Staff/300, Brock/11, lines 12 - 15]9
D. Trouble Reports10
Q. DO YOU CONCUR WITH MS. BROCK’S DESCRIPTION OF THE TROUBLE11
REPORT RATE (TRR) MEASURE [STAFF/300, BROCK/7, BEGINNING AT LINE12
16]?13
A. I agree with some of her statements regarding the Trouble Report Rate measure including14
her paraphrased summary of the wire center level thresholds as a function of the in-service15
access line counts, as well as, the service level objective (standard) of less than four missed16
thresholds within the last twelve months to assess whether the service provider meets the17
standard. Further, I agree that the TRR performance is a good indicator of the overall18
health of the network. But, I do not agree with Ms. Brock’s assertion that the TRR19
thresholds and standard levels are used to gauge staffing levels.20
CTL/300Hunnicutt/12
Q. COULD YOU ELABORATE AS TO WHY YOU DO NOT AGREE WITH MS.1
BROCK’S CORRELATION OF TRR PERFORMANCE TO STAFFING LEVELS?2
A. Yes. Beginning with the definition of “Trouble Report” [OAR 860-023-0055(1)(n)] which3
states it is a “report of a malfunction that affects the functionality and reliability of retail4
telecommunications service on existing access lines, switching equipment, circuits, or5
features made up to and including the network interface, to a large telecommunications6
utility by or on behalf of that large telecommunications utility’s customer.” It follows that7
the Trouble Report Rate is the rate at which these malfunction reports occur. To maintain8
an apples-to-apples comparison across the state, this rate is per 100 working access lines.9
To extend this rate calculation to “gauge staffing levels” would be a misuse of the10
calculation. As Ms. Brock stated, the rate of troubles in the network is a function of the11
equipment and facilities currently comprising the network irrespective and independent of12
the number of technicians currently employed by the service provider. For example, if the13
equipment were not robust and the overall health and stability of the network was poor,14
there would be a significant number of trouble reports generated by the unstable and15
unreliable network if there were only one technician for the whole state of Oregon or if16
there were one technician per access line. There is no correlation between the level of17
staffing and the rate at which trouble reports are received.18
CTL/300Hunnicutt/13
Q. WITH RESPECT TO THE TROUBLE REPORT RATE MEASURE, DO YOU1
AGREE WITH MS. BROCK’S ASSESSMENT OF CENTURYLINK QC’S TRR2
PERFORMANCE [STAFF/300, BROCK/13, BEGINNING AT LINE 9]?3
A. No, I do not. After admonishing CenturyLink QC’s for analyzing of Repair Clearing Time4
performance results at the state level [Staff/300, Brock/12, lines 11-12], which is not the5
basis for the service level objective assessment per the rule and, therefore, not reported at6
that level, Ms. Brock similarly analyzes CenturyLink QC’s TRR on a basis other than how7
the measure is evaluated and reported. Specifically, Ms. Brock states that the “number of8
wire centers exceeding the monthly Trouble Report Rate (TRR) over the length of the9
Current [Plan] was higher than Staff anticipated” [Staff/300, Brock/13, lines 8-11] when10
the basis for the service level objective assessment is not the mere count of missed months11
but the number of wire center level misses in a sliding 12-month period as stated by Ms.12
Brock. [Staff/300, Brock/8, lines 3-7]13
Q. IN MS. BROCK’S EXHIBIT AND TESTIMONY, WHAT IS THE SERVICE14
LEVEL OBJECTIVE FOR THE TROUBLE REPORTS [STAFF/301, BROCK/6]?15
A. The Trouble Reports Service Level Objective [OAR 860-023-0055(5)(b)(A&B) states that16
a large telecommunications utility must maintain the monthly trouble report rate so that it17
does not exceed the threshold (2 per 100 working lines for wire centers with more than18
1,000 access lines, or 3 per 100 working lines for wire centers with 1,000 or less access19
lines) more than three times during a sliding 12-month period. [emphasis added]20
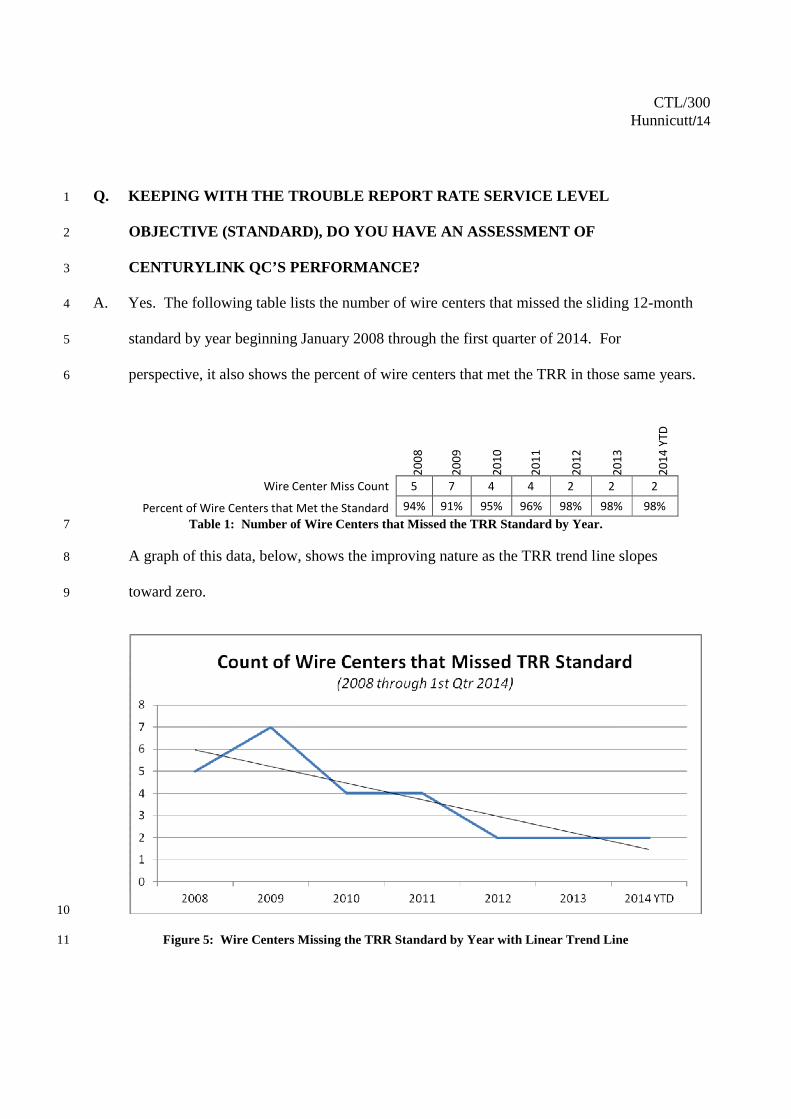
CTL/300Hunnicutt/14
Q. KEEPING WITH THE TROUBLE REPORT RATE SERVICE LEVEL1
OBJECTIVE (STANDARD), DO YOU HAVE AN ASSESSMENT OF2
CENTURYLINK QC’S PERFORMANCE?3
A. Yes. The following table lists the number of wire centers that missed the sliding 12-month4
standard by year beginning January 2008 through the first quarter of 2014. For5
perspective, it also shows the percent of wire centers that met the TRR in those same years.6
200
8
200
9
201
0
201
1
201
2
201
3
201
4YT
D
Wire Center Miss Count 5 7 4 4 2 2 2
Percent of Wire Centers that Met the Standard 94% 91% 95% 96% 98% 98% 98%
Table 1: Number of Wire Centers that Missed the TRR Standard by Year.7
A graph of this data, below, shows the improving nature as the TRR trend line slopes8
toward zero.9
10
Figure 5: Wire Centers Missing the TRR Standard by Year with Linear Trend Line11
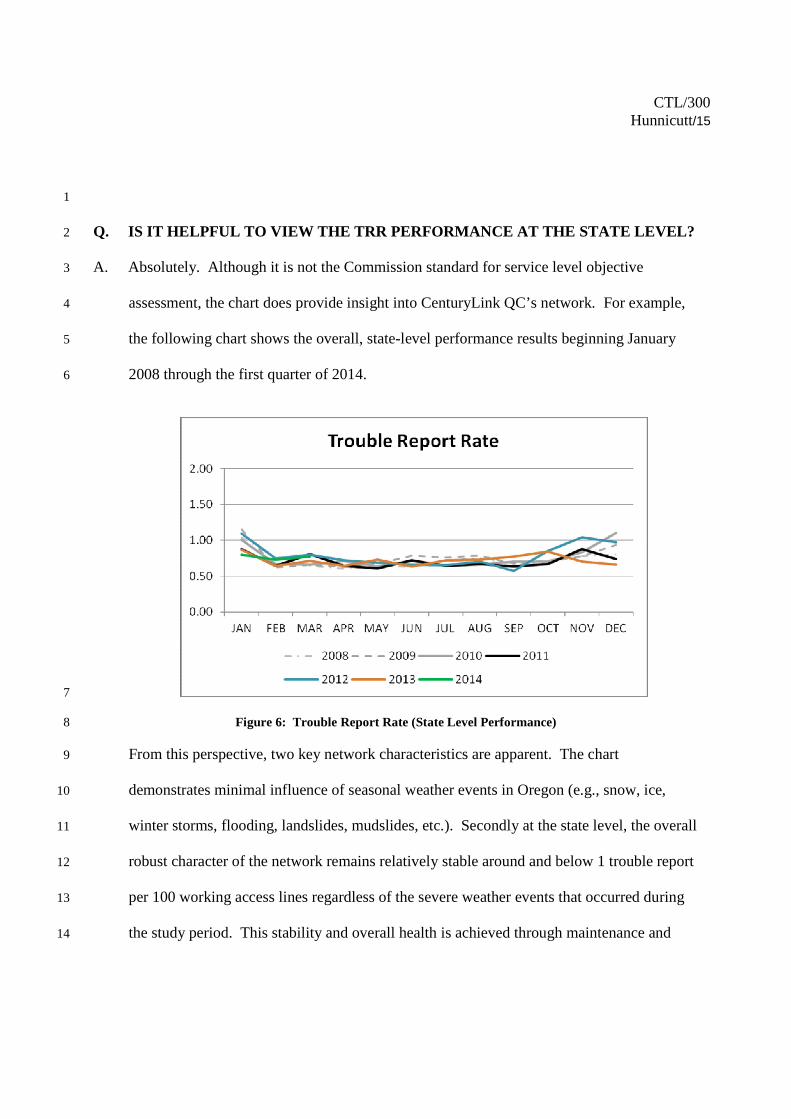
CTL/300Hunnicutt/15
1
Q. IS IT HELPFUL TO VIEW THE TRR PERFORMANCE AT THE STATE LEVEL?2
A. Absolutely. Although it is not the Commission standard for service level objective3
assessment, the chart does provide insight into CenturyLink QC’s network. For example,4
the following chart shows the overall, state-level performance results beginning January5
2008 through the first quarter of 2014.6
7
Figure 6: Trouble Report Rate (State Level Performance)8
From this perspective, two key network characteristics are apparent. The chart9
demonstrates minimal influence of seasonal weather events in Oregon (e.g., snow, ice,10
winter storms, flooding, landslides, mudslides, etc.). Secondly at the state level, the overall11
robust character of the network remains relatively stable around and below 1 trouble report12
per 100 working access lines regardless of the severe weather events that occurred during13
the study period. This stability and overall health is achieved through maintenance and14
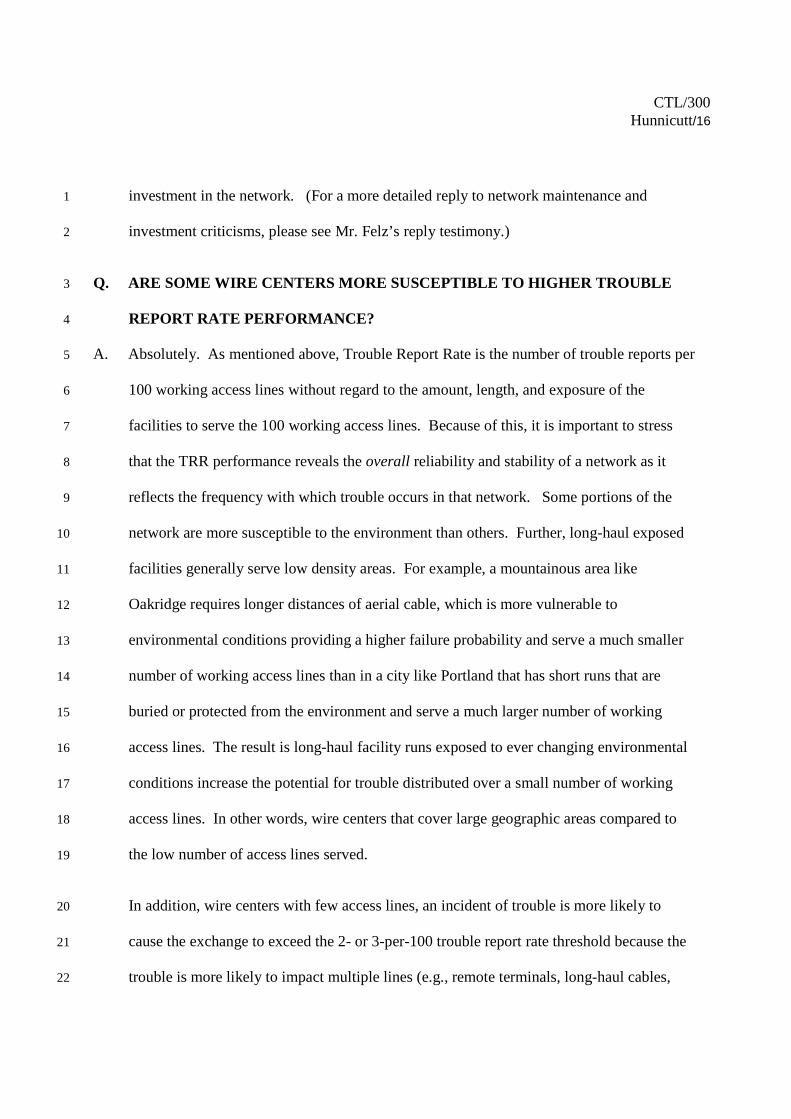
CTL/300Hunnicutt/16
investment in the network. (For a more detailed reply to network maintenance and1
investment criticisms, please see Mr. Felz’s reply testimony.)2
Q. ARE SOME WIRE CENTERS MORE SUSCEPTIBLE TO HIGHER TROUBLE3
REPORT RATE PERFORMANCE?4
A. Absolutely. As mentioned above, Trouble Report Rate is the number of trouble reports per5
100 working access lines without regard to the amount, length, and exposure of the6
facilities to serve the 100 working access lines. Because of this, it is important to stress7
that the TRR performance reveals the overall reliability and stability of a network as it8
reflects the frequency with which trouble occurs in that network. Some portions of the9
network are more susceptible to the environment than others. Further, long-haul exposed10
facilities generally serve low density areas. For example, a mountainous area like11
Oakridge requires longer distances of aerial cable, which is more vulnerable to12
environmental conditions providing a higher failure probability and serve a much smaller13
number of working access lines than in a city like Portland that has short runs that are14
buried or protected from the environment and serve a much larger number of working15
access lines. The result is long-haul facility runs exposed to ever changing environmental16
conditions increase the potential for trouble distributed over a small number of working17
access lines. In other words, wire centers that cover large geographic areas compared to18
the low number of access lines served.19
In addition, wire centers with few access lines, an incident of trouble is more likely to20
cause the exchange to exceed the 2- or 3-per-100 trouble report rate threshold because the21
trouble is more likely to impact multiple lines (e.g., remote terminals, long-haul cables,22

CTL/300Hunnicutt/17
etc.) in a low access line count base. These characteristics associated with some Oregon1
wire centers make the 3-per-100 threshold exceedingly difficult to achieve every month.2
Q. DO YOU HAVE ANY ADDITIONAL COMMENTS RELATING TO THE3
TROUBLE REPORT MEASURE AND THE COMPANY’S NETWORK?4
A. Yes. As mentioned, above, the trend since 2008 of the number of wire centers missing the5
TRR standard is decreasing demonstrating improvements in the network. The following6
graph of access line loss versus trouble reports also indicates the network improvements by7
demonstrating the trouble report reduction trend exceeds that of the company’s access line8
loss.9
10
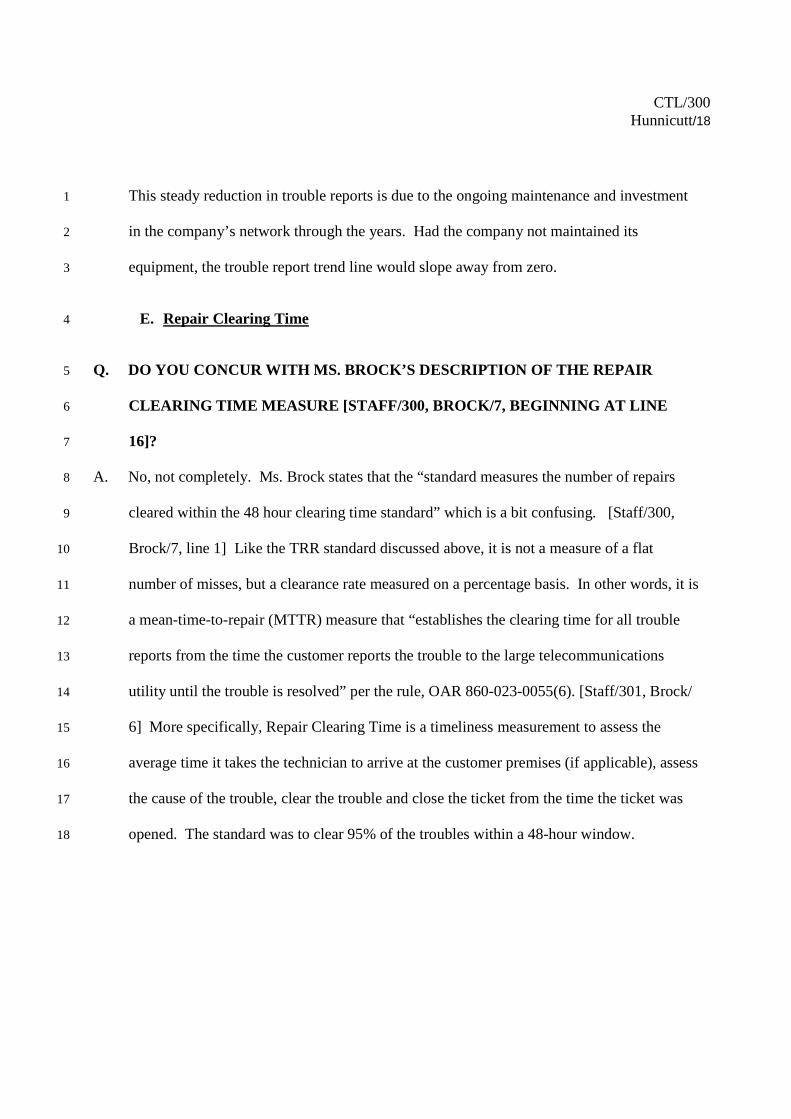
CTL/300Hunnicutt/18
This steady reduction in trouble reports is due to the ongoing maintenance and investment1
in the company’s network through the years. Had the company not maintained its2
equipment, the trouble report trend line would slope away from zero.3
E. Repair Clearing Time4
Q. DO YOU CONCUR WITH MS. BROCK’S DESCRIPTION OF THE REPAIR5
CLEARING TIME MEASURE [STAFF/300, BROCK/7, BEGINNING AT LINE6
16]?7
A. No, not completely. Ms. Brock states that the “standard measures the number of repairs8
cleared within the 48 hour clearing time standard” which is a bit confusing. [Staff/300,9
Brock/7, line 1] Like the TRR standard discussed above, it is not a measure of a flat10
number of misses, but a clearance rate measured on a percentage basis. In other words, it is11
a mean-time-to-repair (MTTR) measure that “establishes the clearing time for all trouble12
reports from the time the customer reports the trouble to the large telecommunications13
utility until the trouble is resolved” per the rule, OAR 860-023-0055(6). [Staff/301, Brock/14
6] More specifically, Repair Clearing Time is a timeliness measurement to assess the15
average time it takes the technician to arrive at the customer premises (if applicable), assess16
the cause of the trouble, clear the trouble and close the ticket from the time the ticket was17
opened. The standard was to clear 95% of the troubles within a 48-hour window.18

CTL/300Hunnicutt/19
Q. DO YOU CONCUR WITH MS. BROCK’S ASSESSMENT THAT THE REPAIR1
CLEARANCE STANDARD CONVEYS ABOUT CENTURYLINK QC’S SERVICE2
QUALITY PERFORMANCE?3
A. No, I do not agree with all of the factors she lists. [Staff/300, Brock/7, line 11] She begins4
by correctly stating that the standard is indicative of “timely repairs”. But, maintenance5
levels, general condition of the plant, and the condition and maintenance of the central6
office switches have no correlation to how quickly the technician clears the trouble.7
Factors including maintenance levels, general condition of the plant, and the condition and8
maintenance of the central office switches are indicative to the number of trouble reports9
(TRR) and not the result of the calculation which is a time measure. Ms. Brock represented10
the conveyance of this measurement perfectly when she stated that the results were created11
to convey the “information regarding the timeliness of repairs.” [Staff/300, Brock/12, line12
8] [emphasis added] Timeliness of repairs conveys no information regarding general13
condition or maintenance of the plant either within the central office or out in the field.14
The only reason the number of troubles is included in this rate calculation is to average the15
number of troubles cleared within the time frame over the total numbers of troubles. From16
a mathematical point of view, with “troubles” in both the numerator and the denominator,17
“troubles” is cancelled out of both (numerator and denominator) leaving only the clearance18
rate within the designated window of time. When making a determination based upon19
performance results, it is imperative that the limitations of the result are understood.20

CTL/300Hunnicutt/20
Later in my reply testimony, I will discuss in detail how this time calculation not only1
conveys the technician’s timeliness of repairs but includes inherent impediments that are2
not within the control of the technician.3
Q. YOU STATE THAT THE STANDARD “WAS” TO CLEAR 95% OF THE4
TROUBLE WITHIN A 48-HOUR WINDOW. HAS THIS STANDARD BEEN5
MODIFIED?6
A. Yes, the change was effective the last week in January 2014. The current standard is to7
clear 90% of the troubles within two business days which allows for some weekend relief.8
Q. GIVEN THE RECENT CHANGE TO THE MEASUREMENT STANDARD AND9
THE WEEKEND RELIEF GRANTED FOR THE CALCULATION, IS IT10
APPROPRIATE TO ASSESS PERFORMANCE BASED UPON THE PREVIOUS11
ITERATION OF THE MEASUREMENT?12
A. Sure, as long as one is mindful that the outcome of these discussions is regarding service13
quality performance going forward. And, therefore, any assessment of historical14
performance should also take into consideration the impacts of the new standard and15
calculation change by applying it, to the extent it can be applied, to historical performance.16
Q. KEEPING WITH THE PREVIOUS AND CURRENT REPAIR CLEARING TIME17
STANDARDS, DO YOU HAVE AN ASSESSMENT OF CENTURYLINK QC’S18
PERFORMANCE?19
A. Yes. A 95% repair clearance in 48 hours is difficult to meet under the most optimum of20
circumstances. From 2008 through 1st quarter of 2014, CenturyLink QC met the rate21
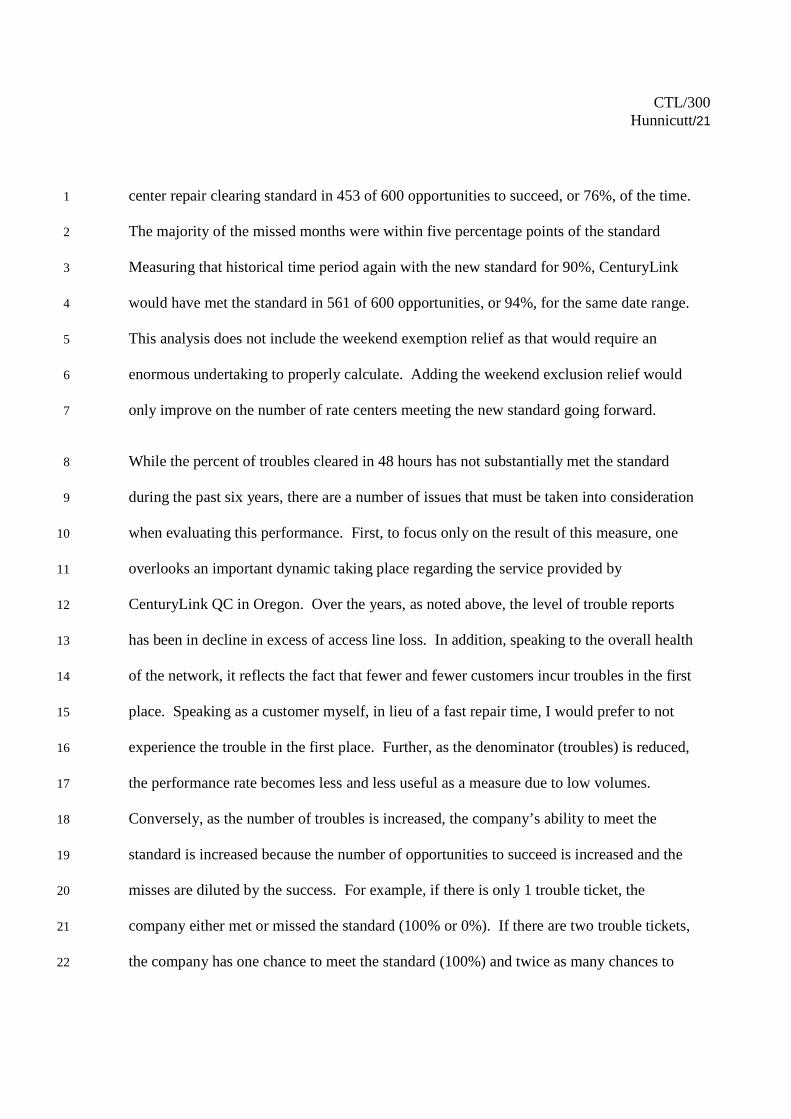
CTL/300Hunnicutt/21
center repair clearing standard in 453 of 600 opportunities to succeed, or 76%, of the time.1
The majority of the missed months were within five percentage points of the standard2
Measuring that historical time period again with the new standard for 90%, CenturyLink3
would have met the standard in 561 of 600 opportunities, or 94%, for the same date range.4
This analysis does not include the weekend exemption relief as that would require an5
enormous undertaking to properly calculate. Adding the weekend exclusion relief would6
only improve on the number of rate centers meeting the new standard going forward.7
While the percent of troubles cleared in 48 hours has not substantially met the standard8
during the past six years, there are a number of issues that must be taken into consideration9
when evaluating this performance. First, to focus only on the result of this measure, one10
overlooks an important dynamic taking place regarding the service provided by11
CenturyLink QC in Oregon. Over the years, as noted above, the level of trouble reports12
has been in decline in excess of access line loss. In addition, speaking to the overall health13
of the network, it reflects the fact that fewer and fewer customers incur troubles in the first14
place. Speaking as a customer myself, in lieu of a fast repair time, I would prefer to not15
experience the trouble in the first place. Further, as the denominator (troubles) is reduced,16
the performance rate becomes less and less useful as a measure due to low volumes.17
Conversely, as the number of troubles is increased, the company’s ability to meet the18
standard is increased because the number of opportunities to succeed is increased and the19
misses are diluted by the success. For example, if there is only 1 trouble ticket, the20
company either met or missed the standard (100% or 0%). If there are two trouble tickets,21
the company has one chance to meet the standard (100%) and twice as many chances to22

CTL/300Hunnicutt/22
miss (0%, 50%), etc. As the number of repair tickets increases, there is more opportunity1
to meet the standard. This is an adverse impact to a beneficial outcome in that the number2
of customers experiencing troubles in the first place is declining.3
Q. YOU MENTIONED THAT THE REPAIR CLEARING TIME REFLECTS THE4
AVERAGE TIME IT TAKES TO ARRIVE, ASSESS, CLEAR AND CLOSE THE5
TICKET. IS THIS AVERAGE TIME TO REPAIR PERFORMANCE6
ADVERSELY IMPACTED MORE SO IN RURAL AREAS VERSUS URBAN7
AREAS?8
A. Absolutely. Rural areas, as mentioned in the TRR Q&A section, have long hauls (for9
facilities and drive time) increasing the time to access and assess the troubles. Depending10
on the magnitude of the source of the trouble, the technician may have hours to travel to get11
replacement parts. In addition, long facility runs take longer to isolate the source of the12
trouble. Given this, it is understandable how the rural wire centers could have a longer13
mean-time-to-repair than urban high-density, short facility-run wire centers.14
Q. WHAT OTHER FACTORS ADVERSELY IMPACT REPAIR CLEARANCE TIME15
PERFORMANCE?16
A. There are a number of forces beyond the control of the technicians that adversely impact17
this measure’s performance results. This time-to-clear metric can be adversely impacted18
by weather events, road conditions or other circumstances beyond the control of the utility19
that delay or prevent the technician from reaching the customer premise and clearing the20
trouble within the specified timeframe. Additional not-so-obvious factors that impact21
response and clear times include drive time as a factor of distance, general road conditions,22
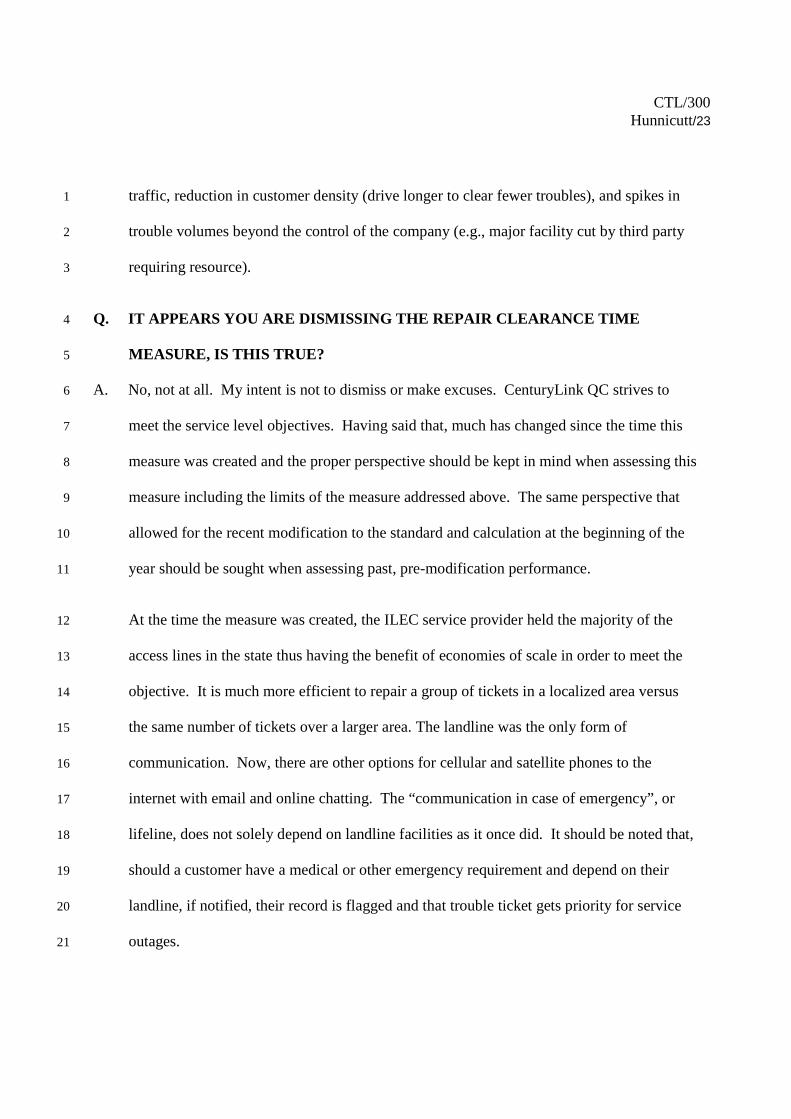
CTL/300Hunnicutt/23
traffic, reduction in customer density (drive longer to clear fewer troubles), and spikes in1
trouble volumes beyond the control of the company (e.g., major facility cut by third party2
requiring resource).3
Q. IT APPEARS YOU ARE DISMISSING THE REPAIR CLEARANCE TIME4
MEASURE, IS THIS TRUE?5
A. No, not at all. My intent is not to dismiss or make excuses. CenturyLink QC strives to6
meet the service level objectives. Having said that, much has changed since the time this7
measure was created and the proper perspective should be kept in mind when assessing this8
measure including the limits of the measure addressed above. The same perspective that9
allowed for the recent modification to the standard and calculation at the beginning of the10
year should be sought when assessing past, pre-modification performance.11
At the time the measure was created, the ILEC service provider held the majority of the12
access lines in the state thus having the benefit of economies of scale in order to meet the13
objective. It is much more efficient to repair a group of tickets in a localized area versus14
the same number of tickets over a larger area. The landline was the only form of15
communication. Now, there are other options for cellular and satellite phones to the16
internet with email and online chatting. The “communication in case of emergency”, or17
lifeline, does not solely depend on landline facilities as it once did. It should be noted that,18
should a customer have a medical or other emergency requirement and depend on their19
landline, if notified, their record is flagged and that trouble ticket gets priority for service20
outages.21

CTL/300Hunnicutt/24
Q. IS IT HELPFUL TO VIEW THE REPAIR CLEARING TIME PERFORMANCE AT1
THE STATE LEVEL?2
It is. Although it is not the Commission standard for service level objective assessment,3
there is much information about the impediments outside the control of the company that4
CenturyLink QC technicians have to overcome to meet the standard. In addition, due to5
these external forces that can impede or prevent the technician from getting to the customer6
premises, this measurement is adversely impacted by seasonal events unlike TRR.7
8
Figure 7: Repair Clearance Time Summarized at the State Level9
The low performance results during the 2008-2009 winter and January 2012 were a result10
of severe weather events that resulted in government disaster declarations. The trouble11
clearance rate during these two periods took a significant hit due to delays beyond the12
control of the company. As a result of the storms, the state-level performance result was13
significantly below the 95% threshold as were the performance results at the wire center14
level for those wire centers impacted by the storms.15
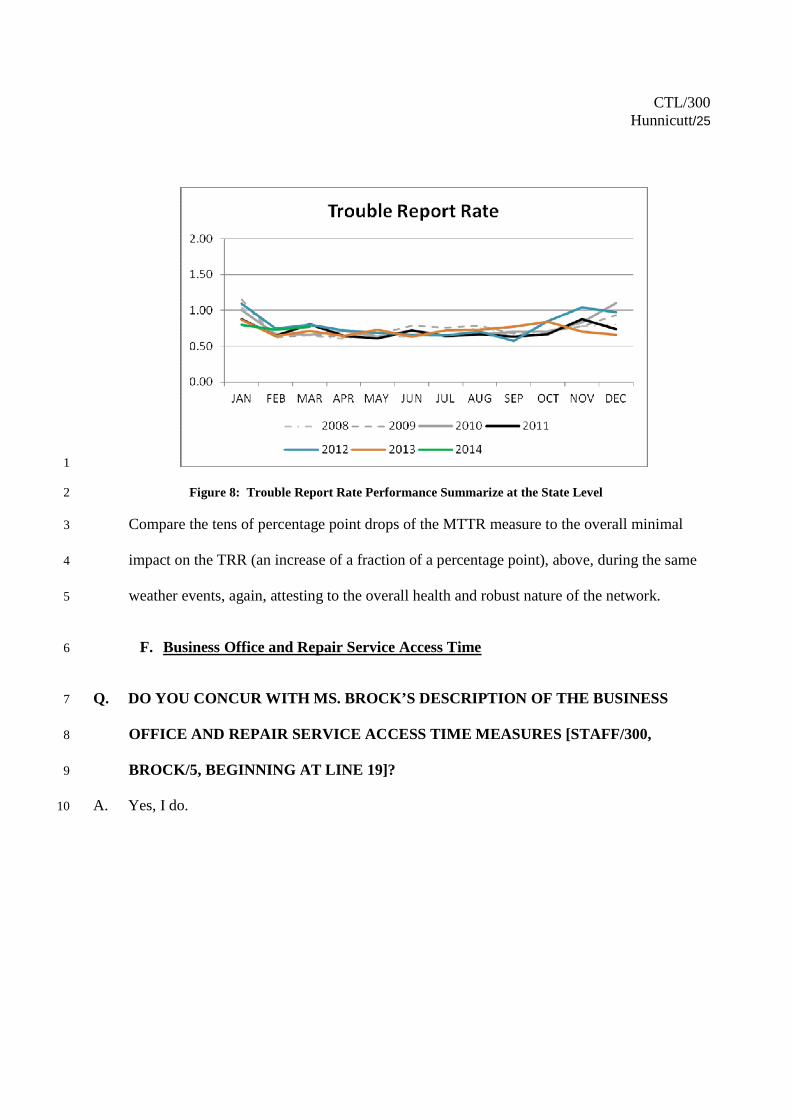
CTL/300Hunnicutt/25
1
Figure 8: Trouble Report Rate Performance Summarize at the State Level2
Compare the tens of percentage point drops of the MTTR measure to the overall minimal3
impact on the TRR (an increase of a fraction of a percentage point), above, during the same4
weather events, again, attesting to the overall health and robust nature of the network.5
F. Business Office and Repair Service Access Time6
Q. DO YOU CONCUR WITH MS. BROCK’S DESCRIPTION OF THE BUSINESS7
OFFICE AND REPAIR SERVICE ACCESS TIME MEASURES [STAFF/300,8
BROCK/5, BEGINNING AT LINE 19]?9
A. Yes, I do.10

CTL/300Hunnicutt/26
Q. DO YOU CONCUR WITH MS. BROCK’S DESCRIPTION OF THE BUSINESS1
OFFICE AND REPAIR SERVICE ACCESS TIME PERFORMANCE [STAFF/300,2
BROCK/11, BEGINNING AT LINE 21]?3
A. No, no entirely. Our calculations are close when stating the percent success rates of both4
measures at only 75% and 86% (Business Office and Repair, respectively.) Ms. Brock5
added a figure charting the annual performance from 2008 through 2013. But, there was an6
error that would not be worth mentioning but for the positive trend it obfuscates with7
respect to the Repair Service Access performance over that time period. There were two8
results that were simply transposed for the 2012 Repair Access and Business Office. The9
graph shows the 2012 Business Office performance meeting 92%, when it actually was10
75%. The opposite is true for the Repair Service graph. The correction results in the chart,11
below.12
13
Figure 9: Repair Access and Business Office Access Met Rate by Year14

CTL/300Hunnicutt/27
In this chart, one can clearly see that the Repair Service Access performance is trending1
toward 100%. In 2012 and 2013, the standard was missed only once each year. Both times2
were due to force majeure events in the CenturyLink QC region. For example, the missed3
performance result in September 2013 was a direct result of the influx of calls during the4
severe flooding in Colorado, New Mexico and Arizona. Some areas of Colorado are still5
recovering from that disaster.6
Business Office Access Time, on the other hand, has not been performing well and the7
trend shows a decline in performance. There are a number of issues that contribute to this8
performance concern and the company has been meeting to determine ways to mitigate the9
higher than standard Business Office average wait times. This performance measure10
contains an inherent penalty for long wait times to request service. Specifically, the11
company loses potential customers by choosing to take their business to a competitor.12
Q. WHAT ARE SOME CAUSES OF THE DECLINE IN BUSINESS OFFICE13
PERFORMANCE OVER THE YEARS?14
A. As with the Repair Clearance Time measure, a lot has changed since this measure was15
established. The most significant change is technological. At the inception of this16
measure, the only mode of communication with a service provider was over the telephone.17
Today, future subscribers can access product information and order services over the18
internet or chat with a representative via “live chat,” which is not included in the19
performance calculation. Many easy, quick questions and service options can be handled20
in this manner leaving the longer, more complex discussions for the measured telephone21
call. At inception, the majority of the calls were relatively simple limited to the number of22

CTL/300Hunnicutt/28
telephone lines and features. Now, the choices of services, bundles, features, etc. extend1
beyond the Plain Old Telephone Line (POTS) to include cellular telephones, high speed2
internet and “cable” television.3
4
5
CTL/300Hunnicutt/29
IV. SERVICE QUALITY REPORTING1
2
Q. WHAT IS THE PURPOSE OF THIS SECTION OF YOUR TESTIMONY?3
A. In this section I will reply to Ms. Brock’s concerns regarding retail service quality reporting4
relief. [Staff/300, Brock/24, line 9]5
Q. WHY IS CENTURYLINK QC REQUESTING RELAXING THE SERVICE6
QUALITY REPORTING SCHEDULE?7
A. Monthly filing of reports ties up resources that could be used more efficiently on other8
service quality tasks. CenturyLink QC is not asking to change the information reported for9
those measures that do not meet the standard, but rather is asking for approval to file four10
times per year versus 12.11
Q. HOW DOES CENTURYLINK QC’S EXCEPTION REPORTING BENEFIT ALL12
PARTIES?13
A. Exception reporting provides another impetus to meet the standards resulting in less detail14
to file and less detail to go through. Per the rules, if the Staff is concerned about the15
number of exception reporting, the Commission may request the company to submit16
additional reports on any item covered by the Retail Telecommunications Service17
Standards rule. [OAR 860-023-0055(3)] Further, by limiting the report to the exceptions,18
the misses are “for display” and not buried in a data-heavy, detailed report. Thus, allowing19
for straight-forward, efficient reporting reduces resource time allocation for both the Staff20
and CenturyLink QC.21
22

CTL/300Hunnicutt/30
V. PERFORMANCE PLAN1
2
Q. WHAT IS THE PURPOSE OF THIS SECTION OF YOUR TESTIMONY?3
A. In this section I will reply to Ms. Brock’s concerns regarding retail service quality4
performance plan “leniency”. [Staff/300, Brock/26, beginning at line 8]5
Q. IS CONTINUED “LENIENCY” OF THE CURRENT PLAN JUSTIFIED GOING6
FORWARD?7
A. Yes, I believe is justified. As demonstrated in my retail service quality measurement8
discussions, above, the telecommunications industry, both from a technology and9
competitive standpoints, has substantially changed. As a result, many states have10
deregulated basic telephone service at the state legislative level, such as Florida including11
elimination of service quality standards and reporting obligations. I agree with Ms. Brock12
when she states, “Florida provides a good model for Oregon”. [Staff/300, Brock/28, lines13
13-14] Some states have extended significant relief to service quality obligations at the14
Commission level by way of waiver or rule changes, such as Arizona, Idaho, and Utah.15
The standards in Oregon are quite stringent when compared to other states which is not in16
alignment with the competitive environment of today and likely served as enough17
justification for the modification of the Repair Clearance Time measurement as Ms. Brock18
alluded to [Staff/300, Brock/9, line 4].19
For purposes of comparison, at 2 per 100 working access lines, Oregon has the most20
stringent Trouble Report Rate threshold. No other state in CenturyLink’s territory has a21
TRR threshold or standard of 2. The next stringent is Minnesota with a 2.5 standard by22
CTL/300Hunnicutt/31
LATA, not wire center, which results in averaging the trouble reports over approximately1
799,000 average access lines per LATA versus approximately 4,400 average access lines2
per wire center in Oregon. California’s TRR standard is 10 for wire centers less than or3
equal to 1,000 lines. Most states range from 4 to 8 trouble reports per 100 access lines.4
An occasional miss of the threshold at the rate center level is not indicative of a problem5
especially at the threshold levels stipulated in Oregon. Some misses can be attributed to6
adherence to process (wrong codes used) and force majeure events. To have to chase down7
every result lower than the threshold would be an inefficient use of time for all parties8
involved. For the reasons discussed herein, the continued “leniency” is justifiable.9
10
Q. DOES CENTURYLINK MONITOR PERFORMANCE AND IMPLEMENT11
CORRECTIVE ACTION PLANS?12
A. Yes. CenturyLink QC’s Regulatory Operations personnel monitor performance results and13
reach out to impacted departments in the organization to mitigate service quality concerns.14
As mentioned above, CenturyLink is addressing the Business Office Access Time15
performance to see what options are available to mitigate the current average wait times.16
In a competitive environment to remain competitive, remedial action should be a business17
decision. As mentioned above, Business Office Access Time has an inherent penalty – if18
potential customers are unhappy with the service, they choose another service provider and19
CenturyLink QC bears the associated loss of revenue.20
21

CTL/300Hunnicutt/32
VI. SERVICE RELATED CUSTOMER COMPLAINTS1
2
Q. WHAT IS THE PURPOSE OF THIS SECTION OF YOUR TESTIMONY?3
A. This section is reserved to address Ms. Brock’s discussions on “service quality4
complaints”. [Staff/300, Brock/23, lines 4-11] Due to time constraints and confidentiality5
procedures, we did not receive any data behind Ms. Brock graph and, as a result, were6
unable to analyze her data. The data request response is not due until after the submission7
date of this Reply Testimony. Without additional complaint detail, it is not possible to8
determine if a comparison of service quality complaints to access lines is appropriate. For9
example, if included in the complaints are complaints specific to non-regulated products or10
issues not represented by the measures discussed herein, or if the complaints were not “at11
fault” service quality complaints, Figure 5 [Staff/300, Brock 23, line 11] would not be an12
appropriate comparison. I would like the opportunity to address these complaints in future13
testimony or a resubmission of this testimony.14
15

CTL/300Hunnicutt/33
VII. SUMMARY OF TESTIMONY1
2
Q. PLEASE PROVIDE A BRIEF SUMMARY OF YOUR TESTIMONY.3
A. I have addressed the service quality performance issues broached by Ms. Brock in her4
Opening Testimony [Staff/300]. In doing so, I have included more detail than Ms. Brock5
when covering those service quality performance measures where the company truly excels6
in order to show a more complete service quality picture. For a number of measures, Ms.7
Brock has incorrectly linked staffing levels to the performance measure result. In some8
instances, there is a correlation between staffing levels and performance results (e.g.,9
representative access time measures). The number of trouble reports per 100 working10
access lines reflects the quality, reliability, and hardiness of the equipment and facilities11
that comprise the network. Timely placement of the equipment and facilities, or12
Provisioning and Primary Held Orders measures, reflect the staffing levels. CenturyLink13
QC’s performance on the Provisioning measures, as acknowledged by Ms. Brocks14
[Staff/300, Brock/11, lines 12 - 15], continues to “meet or exceed standards”.15
When assessing performance results, it is important to determine what information is being16
conveyed by the result based upon the type of calculation and the purpose of each factor of17
the calculation. For each measure discussed by Ms. Brock, I have addressed her assertions18
as to what can be gleaned from the respective performance results and what cannot. I have19
also explained why certain conclusions cannot be gleaned from some of these performance20
calculations. When making a determination based upon performance results, it is21
imperative that one recognizes the limitations of the performance result.22

CTL/300Hunnicutt/34
1
I have addressed why CenturyLink QC’s Trouble Report Rate performance is good in2
Oregon. Since December of 2011, only three of 81 wire centers missed the standard for a3
96% success rate. Further, the number of wire centers missing the TRR standard over the4
life of the current plan has been trending downward.5
Regarding Repair Clearing Time, I have addressed Ms. Brock’s assertions that this6
timeliness to repair metric reflects the condition and maintenance of the network. I have7
shown mathematically, that no determination of network condition can be deduced from8
this repair timeliness calculation. Regarding Ms. Brock’s performance assessment of this9
measure, I address her concerns regarding the number of rate centers that missed the10
standard. Based upon the previous standard, CenturyLink QC came close to meeting the11
standard and, for the majority of instances, was just below 95%. Concerned about the12
stringent nature of the standard, CenturyLink QC requested and was granted relief for this13
measure. When reassessing the performance under the modified standard, CenturyLink14
QC met 561 of 600 opportunities for success, or 94%. In addition, the number of trouble15
reports has been and continues to be on the decline reflecting good network maintenance16
and investment. I believe CenturyLink customers prefer no troubles over timely trouble17
clearance.18
Average wait time for Repair Service representatives had performance issues back in 2008.19
Since that time, the performance has trended up and, with two exceptions associated with20
force majeure events that occurred during the reported month, has exceeded the standard.21
CTL/300Hunnicutt/35
Average wait times for Business Office representatives is an issue. As mentioned, we are1
working internally to mitigate this concern. The penalty for longer Business Office wait2
times is inherent in the performance in this competitive environment. If the customer is not3
satisfied with CenturyLink QC’s performance, they choose another provider.4
I also address the service quality reporting requested relief and continued sliding12-month5
standard for the TRR metric. A reduction in the number of reports submitted is more6
efficient and reduces resource time for both the Staff and CenturyLink QC.7
Finally, the continuation of the sliding 12-month standard for the TRR metric is a more8
efficient application of the standard by averaging out possible impacts due to force majeure9
events or adherence to process anomalies. An occasional miss of the threshold at the wire10
center level is not indicative of a problem especially at the threshold levels stipulated in11
Oregon. To have to chase down every result lower than the standard would be an12
inefficient use of time for all parties involved.13
The current competitive environment does not mirror the environment when the retail14
service quality measures were created. We are not asking for total service quality relief in15
this docket, but we are asking for a current-day mindset when addressing service quality16
assessment.17
18
CTL/300Hunnicutt/36
VIII. CONCLUSION1
2
Q. DOES THIS CONCLUDE YOUR TESTIMONY?3
A. Yes, this concludes my testimony with the exception noted in Section VI, Service Related4
Customer Complaints.5
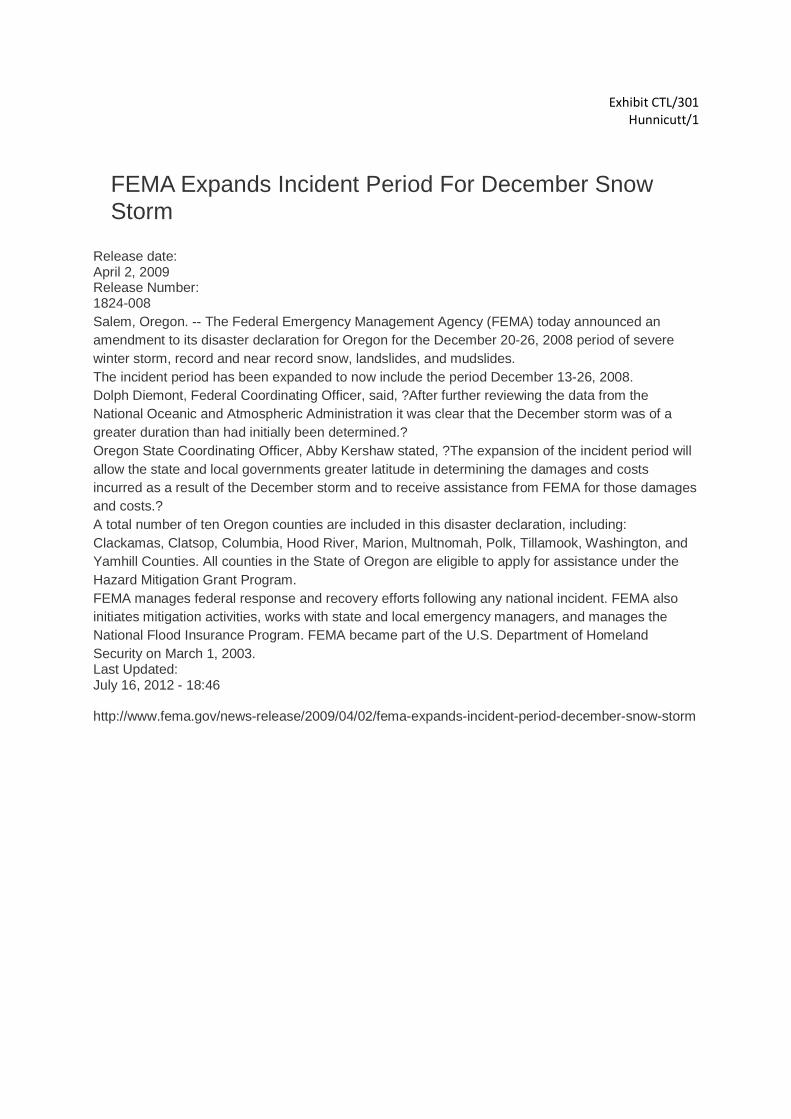
Exhibit CTL/301Hunnicutt/1
FEMA Expands Incident Period For December SnowStorm
Release date:April 2, 2009Release Number:1824-008
Salem, Oregon. -- The Federal Emergency Management Agency (FEMA) today announced an
amendment to its disaster declaration for Oregon for the December 20-26, 2008 period of severe
winter storm, record and near record snow, landslides, and mudslides.
The incident period has been expanded to now include the period December 13-26, 2008.
Dolph Diemont, Federal Coordinating Officer, said, ?After further reviewing the data from the
National Oceanic and Atmospheric Administration it was clear that the December storm was of a
greater duration than had initially been determined.?
Oregon State Coordinating Officer, Abby Kershaw stated, ?The expansion of the incident period will
allow the state and local governments greater latitude in determining the damages and costs
incurred as a result of the December storm and to receive assistance from FEMA for those damages
and costs.?
A total number of ten Oregon counties are included in this disaster declaration, including:
Clackamas, Clatsop, Columbia, Hood River, Marion, Multnomah, Polk, Tillamook, Washington, and
Yamhill Counties. All counties in the State of Oregon are eligible to apply for assistance under the
Hazard Mitigation Grant Program.
FEMA manages federal response and recovery efforts following any national incident. FEMA also
initiates mitigation activities, works with state and local emergency managers, and manages the
National Flood Insurance Program. FEMA became part of the U.S. Department of Homeland
Security on March 1, 2003.Last Updated:July 16, 2012 - 18:46
http://www.fema.gov/news-release/2009/04/02/fema-expands-incident-period-december-snow-storm

Exhibit CTL/301Hunnicutt/2
President Declares Disaster for Oregon
Release date:March 2, 2012Release Number:HQ-12-011
WASHINGTON, D.C. -- The U.S. Department of Homeland Security's Federal Emergency
Management Agency (FEMA) announced that federal aid has been made available for the state of
Oregon to supplement state and local recovery efforts in the area affected by a severe winter storm,
flooding, landslides, and mudslides during the period of January 17-21, 2012.
Federal funding is available to state and eligible local governments and certain private nonprofit
organizations on a cost-sharing basis for emergency work and the repair or replacement of facilities
damaged by the severe winter storm, flooding, landslides, and mudslides in the counties of Benton,
Columbia, Coos, Curry, Douglas, Hood River, Lane, Lincoln, Linn, Marion, Polk, and Tillamook.
Federal funding is also available on a cost-sharing basis for hazard mitigation measures statewide.
Dolph A. Diemont has been named Federal Coordinating Officer for federal recovery operations in
the affected area. Diemont said additional designations may be made at a later date if requested by
the state and warranted by the results of further damage assessments.
http://www.fema.gov/news-release/2012/03/02/president-declares-disaster-oregon

CERTIFICATE OF SERVICE
UM 1354
I hereby certify that on the 23rd day of April 2014, I served the foregoingQWEST CORPORATION D/B/A CENTURYLINK QCS’ REPLY TESTIMONY inthe above entitled docket on the following persons via means of e-mail transmission to thee-mail addresses listed below. Paper copies of only the Confidential material will be sentto those who are authorized to receive it.
*Robert Jenks*G. Catriona McCrackenCitizens’ Utility Board of Oregon610 SW Broadway, Suite 400Portland, OR [email protected]@[email protected]
Bryan ConwayOregon Public UtilityCommissionP.O. Box 2148Salem, OR [email protected]
*Arthur A. ButlerAter Wynne LLP601 Union StreetSuite 1501Seattle, WA [email protected]
*Lawrence ReichmanPerkins Coie LLP1120 NW Couch St., 10th Flr.Portland, OR [email protected]
*Mark P. TrincheroDavis Wright Tremaine LLP1300 SW Fifth AvenueSuite 2300Portland, OR [email protected]
Renee WillerFrontier Communications.20575 NW Von Neumann Dr.Beaverton, OR [email protected]
*Jason W. JonesDepartment of Justice1162 Court Street NESalem, OR [email protected]
*Michael T. WeirichDepartment of Justice1162 Court Street NESalem, OR [email protected]
Bill GarciaWindstream Communications1800 Old Pecos Trail, Suite JSanta Fe, NM [email protected]
*William E. HendricksCenturyLink902 Wasco StreetHood River, OR [email protected]
*Ron TrullingerCenturyLink310 SW Park Ave., 11th Flr.Portland, OR [email protected]
DATED this 23rd day of April, 2014.CENTURYLINK
By: Carla M. Butler310 SW Park Ave., 11th Flr.Portland, OR 97205Telephone: 503-242-5420Facsimile: 503-242-8589e-mail: [email protected] for CenturyLink
* Have signed Protective Order No. 08-116
Recommended