U.S. Government work not protected by U.S. copyright
Atmospheric Entry Studies for Venus Missions:
45° Sphere-Cone Rigid Aeroshells and Ballistic Entries Dinesh K. Prabhu
ERC, Inc./NASA Ames Res. Center
Mail Stop 229-1
Moffett Field, CA 94035
(650) 604-1145
Gary A. Allen, Jr.
ERC, Inc./NASA Ames Res. Center
Mail Stop 230-2
Moffett Field, CA 94035
(650) 604-4228
Gelsomina Cappuccio
NASA Ames Res. Center
Mail Stop 229-3
Moffett Field, CA 94035
(650) 604-1313
Thomas R. Spilker
Solar System Science & Exploration
457 Granite Avenue
Monrovia, CA 91016
Helen H. Hwang
NASA Ames Res. Center
Mail Stop 230-3
Moffett Field, CA 94035
(650) 604-1368
Robert W. Moses
NASA Langley Res. Center
Mail Stop 489
Hampton, VA 23681
(757) 864-8675
Abstract—The present study considers direct ballistic entries
into the atmosphere of Venus using a 45° sphere-cone rigid
aeroshell, a legacy shape that has been used successfully in the
past in the Pioneer Venus Multiprobe Mission. For a number
of entry mass and heatshield diameter combinations (i.e.,
various ballistic coefficients) and entry velocities, the trajectory
space in terms of entry flight path angles between skip out and
30° is explored with a 3DoF trajectory code, TRAJ. From these
trajectories, the viable entry flight path angle space is
determined through the use of mechanical and thermal
performance limits on the thermal protection material and
science payload; the thermal protection material of choice is
entry-grade carbon phenolic, for which a material thermal
response model is available. For mechanical performance, a
200 g limit is placed on the peak deceleration load experienced
by the science instruments, and 10 bar is assumed as the
pressure limit for entry-grade carbon-phenolic material. For
thermal performance, inflection points in the total heat load
distribution are used as cut off criteria. Analysis of the results
shows the existence of a range of “critical” ballistic coefficients
beyond which the steepest possible entries are determined by
the pressure limit of the material rather than the deceleration
load limit.
TABLE OF CONTENTS
1. INTRODUCTION ............................................. 1 2. METHODOLOGY ............................................ 3 3. ENTRY TRAJECTORY SPACE & CASE
MATRIX ................................................................. 5 4. CONSTRAINTS ................................................ 5 5. RESULTS & DISCUSSION ............................. 6 6. GROUND TEST CONSIDERATIONS ......... 14 7. SUMMARY ...................................................... 14 ACKNOWLEDGEMENTS ................................. 15 REFERENCES ..................................................... 15 BIOGRAPHIES .................................................... 16
1. INTRODUCTION
In its latest survey, titled “Visions and Voyages for
Planetary Science in the Decade 2013-2022,” [1] the
National Research Council (NRC) has recommended
several Flagship or New Frontiers class robotic missions to
various planetary destinations including Earth. The missions
to Venus and Saturn recommended in the Decadal Survey,
which have an atmospheric entry component in their
mission profiles, are based on the results of several concept
studies [2-6].
To further understand the entry technology needs of
Flagship and New Frontiers class missions to Venus and
Saturn recommended in the NRC Decadal Survey, NASA’s
In-Space Propulsion Technology (ISPT) program sponsored
a rapid study with a team drawn primarily from Ames and
Langley Research Centers (ARC and LaRC). The objectives
of the study team were: (i) to analyze which entry
technologies would be appropriate, (ii) to identify and/or
quantify gaps/shortfalls in these technologies, and (iii) to
explore whether any of the new technologies in which the
Space Technology Program (STP) of NASA has been
investing, could possibly enlarge entry trade space for these
missions.
To meet the stated objectives, the study team performed a
survey of past missions (actual or proposed) [2-9] to Venus
and the Outer Planets. Based on the information gathered
for Venus missions, the team then examined/analyzed three
entry scenarios for a rigid aeroshell atmospheric entry
probe: (i) direct entry vs. entry from orbit, (ii) ballistic vs.
lifting entry (including aerocapture), and (iii) low L/D vs.
mid-L/D entry with alternate shapes. The team did not
explore scenarios with new/emerging entry technologies,
which are still in early development. As such, the study
team decided that the short time available was best
expended in establishing performance baselines for
“traditional” entry configurations, i.e., rigid aeroshell
configurations with well-characterized thermal protection
materials, so that future comparisons with emerging
technologies could be made.
The three new Venus mission concepts (Flagship or New
Frontiers class) that provided inputs to the NRC Decadal
https://ntrs.nasa.gov/search.jsp?R=20130010987 2018-01-30T19:26:33+00:00Z

2
Survey are: (i) Venus Mobile Explorer (VME) [2], (ii) Venus
Intrepid Tessera Lander (VITaL) [3], and (iii) Venus
Climate Mission (VCM) [4]. All three concept missions,
like the Pioneer Venus mission, are predicated upon a 45°
sphere-cone rigid aeroshell geometry for the entry
probe/system. Some salient points of these concept designs
are:
(i) Maximum entry masses range from 850 kg (VCM) to
3000 kg (VITaL and VME).
(ii) Heatshield diameters range from 2.0 m (VCM) to 3.5 m
(VITaL and VME).
(iii) Estimated peak deceleration loads are under 200 g’s,
while entry flight path angles range from 19° (VCM
and VME) and 23.4° (VITaL).
(iv) The heatshields are made of high-density carbon
phenolic (combination of tape-wrapped and chop-
molded varieties).
(v) The backshells have a tiled thermal protection system
using PICA (Phenolic Impregnated Carbon Ablator).
Of particular interest to the present study is VITaL, which
has both in situ atmospheric measurements and surface
science in its mission objectives. Since VITaL’s mission
profile includes a lander, the entry probe is significantly
larger (3.5 m dia.) and heavier (2100 kg) than the largest
probe (1.4 m dia. and 316 kg) of the Pioneer Venus
Multiprobe mission. Furthermore, VITaL also includes
sensitive instruments, e.g., the Raman/Laser-Induced
Breakdown Spectroscopy or Raman/LIBS experiment, the
apparatus for which has not been qualified for deceleration
loads of the order of hundreds of Earth g’s (quite typical of
ballistic entries into Venus). Keeping deceleration loads
under a 200 g limit, so that flight qualification of the
scientific apparatus is not too expensive, is a key trade in the
design of the entry system for Venus.
Definitions
The entry ballistic coefficient, or simply EBC, is defined as:
E mECDAb
Ab 14 Db
2 (1)
where mE, Db, and Ab are respectively the mass, base
diameter, and base area of the heatshield. The hypersonic
drag coefficient, CD, is usually estimated from Newtonian
impact theory and is nearly constant in the hypersonic phase
of entry. However, the drag coefficient does depend on the
geometry of the heatshield, e.g., CD for a 45° sphere-cone is
1.05, while it is 1.7 for a 70° sphere-cone. Using Eq. 1, the
EBCs of PVLP and VITaL are 190 kg/m2 and 208 kg/m
2,
respectively.
The entry flight path angle, or simply EFPA, is the angle the
capsule’s velocity vector makes with the local horizon at
entry interface.
In an earlier survey of Venus entries, Venkatapathy et al.
[10] systematically explored the entry ballistic coefficient
(E) and entry flight path angle (E) space for 45° sphere-
cone heatshields derived from the Pioneer Venus Large
Probe (PVLP).
A key result from the survey of Venkatapathy et al. [10] is
reproduced here as Fig. 1, which shows the contour level
curves of peak stagnation point total heat flux (in W/cm2),
total heat load (in J/cm2), and peak deceleration loads (in
Earth g’s) for an entry velocity (VE) of 11.5 km/s.
Figure 1 (reproduced from Ref. 10). Contours of peak
total (convective and radiative) heat flux (blue lines),
total heat load (red lines), and peak deceleration load
(green lines) for PVLP-derived vehicles over a range of
entry flight path angles. Contours are for an entry
velocity of 11.5 km/s.
From Fig. 1 it is clear that to keep the deceleration loads
under 200 Earth g’s, it is necessary to constrain entry flight
path angles (EFPAs) to an interval between 25° and skip
out for entry ballistic coefficients up to 300 kg/m2.
The survey conducted by Venkatapathy et al. [10] did not
consider the thermal protection material for the heatshield,
and left that choice to be made based on the estimated peak
heat flux, as is the standard practice in early entry system
analysis. In contrast to the approach taken in the
aforementioned survey, the present study explores the entry
trajectory space for a prescribed thermal protection
material.
The material chosen here for the heatshield is high-density
entry-grade carbon phenolic. Within the context of NASA,
the term “high-density entry-grade carbon phenolic,” or
simply entry-grade carbon phenolic, refers to a material
manufactured to precise specification involving precursor
rayon material, carbonization, and processing. Further
details of carbon phenolic are outside the scope of this study
and are available elsewhere [11].

3
There are two varieties of this entry-grade carbon phenolic –
chop molded and tape wrapped – with the chop molded
variety being unique to NASA missions using the 45°
sphere-cone rigid aeroshell; the chop-molded variety is used
on the spherical nose cap. We note here that although there
are other commercially available carbon phenolics, such as
PICA (used in the Stardust and MSL/Mars Science
Laboratory missions, for example) and nozzle liner-grade
carbon phenolic (used in the Space Shuttle SRBs/Solid
Rocket Boosters, for example), these materials are not
considered and are beyond the scope of the present study.
Entry-grade carbon phenolic is a robust and flight-proven
thermal protection material that is capable of withstanding
the severe aerothermal environments (pressures of 8-17
bars, shear stresses of the order of 2-10 kPa, and heat fluxes
of the order 4-10 kW/cm2) associated with ballistic entries
into Venus. It has been used successfully in the Pioneer
Venus Multiprobe and Galileo missions, and in the
Hayabusa mission as well. Furthermore, the performance of
this material has been very well characterized through both
ground tests and flight (for both defense and civil
applications), and a calibrated thermal response model is
available [12] for it in FIAT [13], a NASA-developed one-
dimensional material response code.
The present study is a more focused examination of entry
parameters (velocity, ballistic coefficient and flight path
angle) and environments (deceleration loads, pressures, heat
fluxes, etc.) relevant to the new Venus Flagship and New
Frontiers missions. This detailed examination, in turn,
facilitates identification of technology gaps/shortfalls (if
any) in the mission design trade space for the legacy
architecture, i.e., a 45° sphere-cone rigid aeroshell with a
known thermal protection material. Furthermore, EFPA
baselines derived for the legacy architecture allow for
comparison with results from analyses for other rigid
aeroshell entry scenarios, such as lifting entries of different
probe geometries (70° sphere-cone, ellipsleds, or even
asymmetric shapes) and with alternate thermal protection
material. Such baselines could also be used to define
performance requirements for new deployable architectures,
and/or new thermal protection materials.
The primary objectives of the present study are: (i) to
develop the entry trajectory space – parameterized by VE,
E, and E – for direct ballistic entries into Venus with a 45°
sphere-cone rigid aeroshell geometry and entry-grade
carbon phenolic as the choice of heatshield material, and
(ii) to determine the range of E, for various VE and E
combinations, for which missions to Venus are viable using
a legacy entry system architecture. We do not consider
lifting entries in the present study. Details of such a study,
performed by another group within the larger team, will be
available in a forthcoming publication [14].
Having established the general context for exploration of an
entry trajectory space, we describe the methodology next.
We emphasize here that 3DoF flight trajectories are
independent of the choice of thermal protection material,
i.e., the predicted deceleration loads, pressures, heat fluxes,
and heat loads, do not depend on the choice of material. The
standard procedure is to develop flight trajectories (with
dispersions perhaps) and select the thermal protection
material that is appropriate to the margined predicted peak
heat flux. The selected material is then sized to the margined
total heat load for the worst-case trajectory. In the present
study, we have already made the choice of material – entry-
grade carbon phenolic – regardless of what deceleration
loads, or pressures, or heat fluxes are predicted by TRAJ. It is
on the databank of unconstrained trajectories developed here
that we impose performance constraints to determine the
viable entry trajectory space.
2. METHODOLOGY
The present paper makes no attempt to “design” a thermal
protection system. It merely attempts to establish the viable
entry trajectory space for a rigid aeroshell to which entry-
grade carbon phenolic (the basis for several New Frontiers
or Flagship class Venus mission concepts) is bonded. The
following ground rules, assumptions, and processes have
been used for the trajectory analyses to be presented here:
1. The heatshield configuration is a 45° sphere-cone for
which the hypersonic drag coefficient is 1.05. The
geometry and the four parameters – Rb, Rn, Rs, and c –
that completely describe it are shown in Fig. 2. The
nose and shoulder radii are often expressed as fractions
– Rn/Rb and Rs/Rb – of the base radius. For all cases in
the present study Rn/Rb = 0.5, and Rs/Rb = 0.
Figure 2. Geometry of a sphere-cone heatshield. The
axisymmetric geometry is described by four
parameters – (i) base radius, Rb, (ii) spherical nose
radius, Rn, (iii) a toroidal shoulder radius, Rs, and (iv)
the cone half angle, c.
2. The entry interface altitude at Venus is taken as 200
km.
3. The VIRA/VenusGRAM model [15] is used for the
atmosphere.
4. 3DoF flight trajectories are constructed using NASA
ARC’s in-house 3DoF code, TRAJ [16]. The input
variables used by TRAJ are: mE (entry mass), Rb (base

4
radius), CD (drag coefficient—computed using
Newtonian impact theory, if an experimental/flight drag
database is not readily available), Rn (nose radius), Rs
(shoulder radius), VE (inertial entry velocity), ψE
(inertial heading angle), γE (inertial EFPA), and E
(longitude).
5. The 3DoF simulations are terminated when the Mach
number reaches a value of 0.8 along the trajectory. It is
assumed that the heatshield is jettisoned and a
parachute deployed at Mach 0.8. 6. Aerothermal environments at the stagnation point are
estimated along a flight trajectory through correlations
that depend only on the freestream density (∞) and
flight velocity (V∞), and the nose radius (Rn) of the
heatshield. We have the following correlations:
pstag V
2
qstag,conv.CconvV
3.04
Rn
qstag,rad. Crad Rn
1.2Vb
(2)
where Cconv, Crad and b are constants. The stagnation
point convective heat flux correlation is a variant of the
Fay-Riddell correlation [17], and the stagnation point
radiative heat flux correlation is due to Tauber [18]. No
margins, to account for either atmospheric uncertainties
or uncertainties in aerothermal environments (pressure,
shear stress, and heat flux), are applied to the estimated
stagnation point values. Note: shear stress is not
considered in the present study – its value is zero at the
stagnation point, by definition. However, shear levels,
especially turbulent shear levels, can be large on the
conical frustum.
7. Peak values of radiative, convective, and total heating
at the stagnation point, the peak pressure at the
stagnation point, the peak deceleration loads, and total
heat load (integrated heat flux over the time of flight)
are recorded for each trajectory simulated.
8. The heatshield material is sized using the FIAT [13]
option integrated into TRAJ. It requires specification of
the material stack, initial temperature, and a bondline
temperature constraint. The material stack used in the
present study consists of 3 layers – (i) an outer layer of
entry-grade carbon phenolic (the thickness of this layer
is determined by FIAT), (ii) an intermediate layer of
RTV-560 (adhesive), and (iii) an inner layer of
aluminum (the carrier structure). The initial temperature
of the stack is set to 18 °C [19]. This material stack is
similar to that described in the the Pioneer Venus Large
and Small Probe Data Book [20] and the report of
Talley [21].
9. FIAT, a materials thermal response code, has a model
for entry-grade carbon phenolic [12]. Note: The present
work does not make any distinction between the chop-
molded and tape-wrapped varieties of entry-grade
carbon phenolic, insofar as their material thermal
properties are concerned. The thermal response of
carbon phenolic is computed for the total heat load
estimated from the 3DoF simulation and with the
specified stack. The material is sized to a bondline limit
temperature of 250 °C (a safe limit of RTV-560
adhesive [22]). Sizing is performed for the stagnation
point only.
10. Assuming uniform thickness, the mass of the thermal
protection system (TPS) or heatshield is determined
using the computed thickness (tCP) as:
mCP CPAwettCP (3)
where CP is the mass density of carbon phenolic and
Awet is the wetted area of the heatshield. No margins, to
account for uncertainties in material properties, are
applied to the computed thickness (often referred to as
the zero-margin thickness).
11. This TRAJ-FIAT process (Steps 4 through 10) is then
repeated for multiple values of E in the interval of
interest (from skip out to -30°). Note: there are no
margins on the entry flight path angles. Such margins
are necessary to account for atmospheric uncertainties
and interplanetary trajectory delivery errors [23].
12. Once a databank has been created for (i) trajectories,
(ii) environments along those trajectories, and (iii)
heatshield mass estimates for those environments, we
impose constraints a posteriori to determine the EFPA
window for a given entry mass and vehicle size for
which atmospheric entry is feasible.
We consider temporal variations of aerothermal
environments at one spatial location on the heatshield, viz.
the stagnation point. Strictly speaking, spatial distributions
of aerothermal environments are also needed since there
could be trajectory time periods where environments away
from the stagnation point could be higher. For instance, for
a 45° sphere-cone we expect flow transition to turbulence,
with consequent heating augmentation on the conical flank.
There are no built-in correlations currently in TRAJ [16] to
estimate this augmented heat flux, and the only way to do so
is to compute flow field solutions using numerical
simulation tools – DPLR [24] for convective heating and
NEQAIR [25] for radiative heating, for example. Such an
undertaking at this level of analysis was deemed
unnecessary, especially since literally thousands of flight
trajectories were generated for VE-E-E combinations.
Since the present work is focused on the stagnation point
alone, we have opted to assume a uniform thickness for the
heatshield. This assumption also appears to be consistent
with the mission concept studies presented in Refs. 2-4. We
note that the Pioneer Venus probes did not have uniformly
thick heatshields – the thickness of the spherical nose cap
(chop-molded carbon phenolic) was greater than that over
the conical flank (tape-wrapped carbon phenolic) [21].
Complicating matters further, the facesheet thicknesses in
the two regions were also different [21].
Finally, the present study does not consider the backshell in
the analysis, since the mass of the thermal protection system
(TPS) of the backshell is usually a small fraction (< 10%) of

5
the heatshield mass. For example, the mass of the thermal
protection system for the heatshield of PVLP was 27.3 kg
and that for the backshell was 1.51 kg (roughly 6% of the
total mass of the TPS) [20,21].
The strategy adopted in the present work is to first anchor
the methodology to Pioneer Venus – the sole source of
openly available engineering data. Replication of
unmargined thickness (at the stagnation points of the Large
Probe and the Day Probe) is then taken to be a measure of
success of our process.
3. ENTRY TRAJECTORY SPACE & CASE
MATRIX
As mentioned earlier, our development of atmospheric entry
trajectories explores a space parameterized by: (i) the
inertial entry velocity, VE, (ii) the entry ballistic coefficient,
E, and (iii) the inertial entry flight path angle, E. The
ranges of values for these parameters in the present study
are guided by the mission concept studies [2-4] performed
for the Decadal Survey.
Entry velocity
We assume that the inertial entry velocity (or a range of
velocities), VE, is provided by the interplanetary trajectories
developed using a combination of launch/arrival dates and
launch system. In the present study we consider three
representative entry velocities – 10.8, 11.2, and 11.6 km/s.
A velocity of 11.6 km/s is consistent with PVLP (11.54
km/s), and 11.2 km/s is consistent with the mission concept
studies [2-4].
Entry ballistic coefficient (EBC)
We have chosen to sample a small number of ballistic
coefficients between 100 kg/m2 and 400 kg/m
2, which are
respectively 0.5 and 2 that of PVLP.
We separate out the mass and heatshield size in the
definition of ballistic coefficient and consider 24
combinations—8 entry masses between 1500 kg to 2750 kg,
and 3 heatshield diameters of 2.5, 3.5, and 4.5 m.
The entry mass and heatshield diameter combination, along
with CD (=1.05) of the 45° sphere-cone, help fix the EBC
(Eq. 1). The EBCs for the various mE-Db combinations we
have chosen are shown in Table 1.
The 3.5 m-2000 kg combination has an EBC of 198 kg/m2,
which is close to that of VITaL (208 kg/m2) and PVLP (190
kg/m2).
We note here that some of the mE-Db combinations might
not be physically realizable, either because packing
becomes an issue or because the heatshield mass becomes
excessive. It is the latter issue that the present paper deals
with.
Table 1. Entry ballistic coefficients for various
heatshield configurations considered for Venus entry
Diameter, m
2.5 3.5 4.5
Mass, kg Ballistic coefficient, kg/m2
1500 291 148 90
1750 340 173 105
2000 388 198 120
2250 437 223 135
2750 534 272 165
.
Entry flight path angle (EFPA)
Depending on the entry velocity and ballistic coefficient,
there is a limiting shallow entry angle beyond which the
capsule will skip out of the atmosphere. Therefore, the
present study samples the entry angle variable at values
more negative than the skip out angle, i.e., for entries that
are steeper than skip out [23]. Further, to keep the
deceleration loads below 250 g (Fig. 1), the steepest EFPA
is 30°. Therefore, the EFPA interval considered in the
present study is between skip out and 30°. This interval is
divided into 0.5° sub-intervals for 3DoF trajectory
computations.
For each entry velocity and EBC combination, the TRAJ-
FIAT combination (Step 12 of the methodology outlined) is
used to develop flight trajectories for the range of entry
angles chosen and for each trajectory entry-grade carbon
phenolic is sized (without any margins) to the computed
heat load at the stagnation point. We then determine viable
entry flight path angle windows through a posteriori
application of constraints.
4. CONSTRAINTS
We categorize constraints into two types— mechanical, and
thermal. The former category includes deceleration loads
and pressures, while the latter includes heat fluxes and
heatshield mass estimates. Although the categorization is
simple and straightforward, there is subjectivity in the
choice of limiting values of some of these constraints.
Mechanical constraints
The mechanical performance constraints determine how
steeply an entry can be without violating either the specified
deceleration load limit or the stagnation point pressure limit.
Peak deceleration load limit: Peak deceleration load is a
mission specification, and is relevant to the science payload,
not the thermal protection material. It is a critical
performance parameter because it drives the
qualification/flight certification of science instruments. The
mission profiles of the concept studies [2-4] performed for
the Decadal Survey have peak deceleration loads between
150 to 200 g. It should be borne in mind that the
deceleration load limit is only on each science instrument
and not on the entire entry system. Presumably centrifuges
6
that can test up to these loads are available. Therefore, we
set the upper limit on deceleration load to 200 g.
Stagnation point pressure limit: If we knew the pressure at
which the char (due to ablation) of entry-grade carbon
phenolic fails mechanically (or spalls), then that pressure
value could be imposed as a constraint. Unfortunately,
however, this limit is not readily available in the open
literature, nor is there any NASA arc-jet test experience to
specify such a value. Therefore, the limit we have chosen
here is a subjective one, and is based on flight experience in
the Pioneer Venus and Galileo Jupiter missions. PVLP
experienced pressures slightly higher than 10 bars, as did
the Galileo probe to Jupiter [26]. However, we know that
the Night and North probes of Pioneer Venus experienced
pressures greater than 10 bars and survived the entry [27].
Erring on the side of caution, we impose a pressure limit of
10 bars for entry-grade carbon phenolic.
One question to ask here is whether constraints on peak
deceleration loads and peak loads can be active
simultaneously, or would the choice of one preclude the
other? We make an attempt to answer this question in the
Results section.
Thermal Performance Constraint
The thermal performance constraint, which is primarily the
total heat load (equivalently the estimated total mass of the
entry-grade carbon phenolic heatshield), determines how
shallow the EFPA can be. Strictly speaking, the EFPA
corresponding to skip out represents the closure of the
EFPA window at the shallow end. However, the high heat
loads at shallow EFPAs might result in prohibitively high
heatshield masses because of the lack of insulative
capability in entry-grade carbon phenolic.
Total heat load limit: Since for each VE-E combination, we
have estimates of total heat load (Q) as a function of EFPA
(E), we can determine the “knee in the curve,” i.e.,
determine the EFPA at which the curvature, (E),
E
d2Q
d E2
1dQ
d E
2
3
2
(4)
of the Q(E) distribution attains an extremum. A few things
to note in working with this criterion: (i) the total heat load
is independent of the choice of material, and (ii) the
distribution of Q with E is discrete and application of Eq. 4
requires evaluation of first and second derivatives. Since
numerical differentiation can be “noisy,” we fit the discrete
distributions with smooth curves and evaluate the extrema
analytically. This is discussed later in the Results section.
Mass fraction limit: The mass fraction of the heatshield is
defined as:
fCP mCPmE
(5)
where mCP is the mass of the heatshield assuming a uniform
thickness, and the thickness estimate is provided by
application of FIAT to TRAJ-predicted total heat loads.
The choice of a value for mass fraction limit is largely a
subjective one, and depends on the mission. The only two
openly available data points from Venus missions are from
the Large and Day probes of Pioneer Venus. The Night and
North probes of Pioneer Venus are not relevant because
their entries were considerably steeper than the -30° limit
we have imposed in the present study. For the Large Probe
(E = 32.5°), the mass fraction of the as-flown heatshield
was only 0.09, while it was 0.13 for the Day Probe (E =
25.4°). The differing mass fractions for the Large and Day
probes of Pioneer Venus suggest a dependence on EFPA.
However, the North and Night Probes, which were identical
to the Day Probe, had the same mass fraction despite
significant differences in their entry flight path angles.
The mass fraction estimates provided by the concept studies
[2-4] are greater than 0.13 – the reports provide an estimate
of the thickness of the heatshield material, which can be
converted to a mass equivalent using Eq. 2.
In the present work, we leave open the choice of mass
fraction, preferring instead to examine instead the effects of
making various choices. Furthermore, we assume that this
mass fraction value is a constant across the entire viable
EFPA space.
5. RESULTS & DISCUSSION
Process Verification
We first verify our procedure outlined in the Methodology
section. Two good candidates for verification are: (i) PVLP
(316.5 kg, 1.42 m dia., 45° sphere-cone), which had an EBC
of 190 kg/m2, an entry velocity of 11.54 km/s, and an EFPA
of 32.4° [26], and (ii) Pioneer Venus Day Probe (91 kg,
0.76 m dia., 45° sphere-cone), which had an EBC of 190
kg/m2, an entry velocity of 11.54 km/s, and an EFPA of
25.4° [26].
Applying our procedure to these two cases yielded the
following results:
1. PVLP: The simulated thickness (for the material stack
shown in Table 1) was 0.79 cm, while the unmargined
thickness reported in Ref. 20 was 0.762 cm at the
stagnation point.
2. Day Probe: The simulated thickness (for the material
stack shown in Table 1) was 0.87 cm, while the
unmargined thickness reported in Ref. 20 was 0.864
cm.
The agreement between results of the current methodology
and the unmargined thicknesses of the Pioneer Venus

7
program is fortuitous, given the differences in materials of
the carrier structure and the adhesives [20,21]. Nevertheless,
the results give us confidence in sizing at the stagnation
point.
Having anchored the methodology against PVLP, we
present results for the nominal cases, i.e., a 2000 kg entry
mass for three entry velocities – 10.8, 11.2, and 11.6 km/s –
and EFPAs ranging from skip out to -30°.
Nominal Cases: Mechanical constraint (peak deceleration
load)
Figure 3 shows the variation with EFPA of peak
deceleration loads for an entry mass of 2000 kg. Curves are
shown for all three entry velocities and three EBCs – 120,
198, and 388 kg/m2 (a factor of 3 spread between low and
high). We observe the following:
(i) Peak deceleration loads increase with increasing EFPA
for all entry velocities and ballistic coefficients, which
is as expected.
(ii) For a given EBC (curves of one family—solid, or
dashed, or dash-dotted) the highest deceleration loads
correspond to the highest entry velocity (11.6 km/s).
Between the highest and lowest entry velocities, the
deceleration loads at an EFPA of 30° differ by no
more than 15%.
(iii) For a given entry velocity (curves of one color – red, or
green, or blue) the highest deceleration loads
correspond to the lowest ballistic coefficient (120
kg/m2). Between the highest and lowest ballistic
coefficients, the maximum difference in deceleration
loads at an EFPA of 30° is less than 12%.
(iv) The small box (0.5° 10 g) shown in Fig. 3 represents
the region where the peak deceleration load is nearly
independent of entry velocity and ballistic coefficient.
Since the highest deceleration loads occur for the highest
entry velocity of 11.6 km/s for all three ballistic coefficients,
it is sufficient to work with curves corresponding to this
entry velocity to determine the steepest entry angles for a
prescribed deceleration load limit.
Dashed horizontal lines at 100 and 200 g are also shown in
Fig. 3. The intersections of these lines with the peak
deceleration curves for the highest entry velocity (11.6
km/s) are shown as dashed vertical lines in the plot. The
arrows indicate the direction in which the vertical lines
move with decreasing deceleration load limits to suggest
that the deceleration load limit determines the steepest entry
flight path angle.
If the deceleration load limit is 200 g, then the steepest
EFPA is roughly -23.5° for an EBC of 388 kg/m2, and
21.5° for an EBC of 120 kg/m2, which is only a 2° interval
for a factor of 3 difference in ballistic coefficients. If
deceleration loads cannot exceed 100 g (because either
instruments cannot be qualified beyond this value or it
becomes exceedingly expensive to qualify instruments
beyond this value), then the steepest EFPA is 13.25° for a
ballistic coefficient of 388 kg/m2, and -12.5° for an EBC of
120 kg/m2, which is now only a 0.75° interval. Therefore, as
the deceleration load limit is decreased, the ballistic
coefficient becomes less relevant, while at a 50 g limit, the
steepest EFPA is only about 9.5° for all ballistic
coefficients.
Figure 3. Variation with EFPA of peak deceleration load for mE= 2000 kg and various entry velocities.
Horizontal dashed lines are shown at 100 and 200 g, and at the intersections of these lines with the peak
deceleration load curves, the corresponding EFPAs are shown as vertical dashed lines. At roughly 50 g the
deceleration load is nearly independent of entry velocity and ballistic coefficient.

8
Instead of the cumbersome graphical approach (Fig. 3), we
can use an alternative analytical approach. In the analytical
approach, we fit to the peak deceleration loads curves of the
form
gPeak(E ) A VE,E VE ,E E VE ,E (6)
where A, , and are curve-fit coefficients that (could)
depend on both entry velocity and EBC. The coefficient
can be interpreted as the skip out angle. For a prescribed
value of gPeak, Eq. 6 is easily inverted to obtain the
corresponding value of EFPA, E. This provides a cross
check against results of the graphical method.
Figure 4 shows a sample fit to peak deceleration loads for a
3.5 m diameter heatshield of 2000 kg entry mass and an
entry velocity of 11.6 km/s. The values of A, , and
obtained by fitting the data are also shown in the figure.
Applying Eq. 6 to all peak deceleration load curves (all nine
of them) shown in Fig. 3 results in the entries shown in
Table 2. The inflections in and at 11.2 km/s are
interesting, but cannot be explained easily without finer
resolution in entry velocity. The dependence of the curve-fit
coefficients on either entry velocity or EBC could be
pursued further. However, such an undertaking will require
much finer resolution in both variables.
Figure 4. Variation with EFPA of peak deceleration load
for mE= 2000 kg and 11.6 km/s entry velocity. The open
symbols are 3DoF predictions and the line is a curve fit
of the form shown in Eq. 6.
Table 2. Coefficients of curves fit to peak deceleration loads for a 2000 kg entry mass capsule
VE, km/s
11.6 11.2 10.8 11.6 11.2 10.8 11.6 11.2 10.8
E, kg/m2 Db, m A(VE,E) (VE,E) (VE,E)
388 2.5 33.6 28.5 28.8 7.94 7.49 7.65 0.651 0.681 0.656
198 3.5 34.3 31.1 28.9 7.78 7.50 7.35 0.661 0.669 0.668
120 4.5 34.7 31.4 30.7 7.68 7.41 7.44 0.671 0.679 0.664
Nominal Cases: Mechanical constraint (peak pressure load)
We turn next to the other mechanical performance
constraint – the pressure load.
Figure 5 shows the variation with EFPA of peak pressure
loads for an entry mass of 2000 kg. Curves are shown for all
three entry velocities and three entry ballistic coefficients –
120, 198, and 388 kg/m2 (a factor of 3 spread between low
and high). We observe the following:
(i) Peak pressure loads increase with increasing EFPA for
all entry velocities and ballistic coefficients, which is as
expected. However, there is a very strong dependence
on ballistic coefficient – as the ballistic coefficient
decreases, so does the peak pressure load. The trend,
however, is opposite that of peak deceleration loads,
which increase with decreasing ballistic coefficient
(Fig. 3).
(ii) For a given EBC (curves of one family—solid, or
dashed, or dash-dotted) the highest pressure loads
correspond to the highest entry velocity (11.6 km/s).
Between the highest and lowest entry velocities, the
peak pressure loads at an EFPA of -30° differ by no
more than 30%, which is a little larger than the 15% we
saw in the case of peak deceleration loads.
(iii) For a given entry velocity (curves of one color – red, or
green, or blue) the highest pressure loads correspond to
the highest ballistic coefficient (388 kg/m2). Between
the highest and lowest ballistic coefficients, the
maximum difference in pressure loads at an entry flight
path angle of -30° is roughly a factor of 3, suggesting
that this difference scales directly as ballistic
coefficient.
(iv) At an entry angle of roughly -9.75°, the peak pressure
loads are nearly independent of the entry velocity.
However, there is still a dependence on ballistic
coefficient. For the highest ballistic coefficient of 388
kg/m2 (2.5 m diameter heatshield), the maximum
pressure load at -9.75° EFPA is roughly 3.5 bar.
Since the highest pressure loads occur for the highest entry
velocity of 11.6 km/s for all three ballistic coefficients, it is
sufficient to work with curves corresponding to this entry

9
velocity to determine the steepest entry angles for a
prescribed pressure load limit.
Dashed horizontal lines at 5 and 10 bar are also shown in
Fig. 5. The intersections of these lines with the peak
pressure load curves for the highest entry velocity (11.6
km/s) are shown as dashed vertical lines in the plot. The
arrows indicate the direction in which the vertical lines
move with decreasing peak pressure load limits to suggest
that the pressure load limit too determines the steepest entry
flight path angle for a given ballistic coefficient.
If peak pressure loads cannot exceed 10 bars, then the
steepest EFPA is 16.75° for an EBC of 388 kg/m2. For the
lowest EBC of 120 kg/m2, the steepest EFPA is outside our
chosen EFPA interval and peak pressure load is not a
constraint.
If peak pressure loads cannot exceed 5 bar, then the steepest
EFPA is 10.75° for an EBC of 388 kg/m2, and 23.5° for
an EBC of 120 kg/m2, which is a 12.75° interval in EFPA.
Figure 5. Variation with entry flight path angle of peak pressure load for mE = 2000 kg (EBC = 120, 198, and
388 kg/m2) and various entry velocities. Horizontal dashed lines are shown at 5 and 10 bar, and at the
intersections of these lines with the peak pressure load curves, the corresponding entry flight path angles are
shown as vertical dashed lines. At roughly 9.5° EFPA, the pressure load is nearly independent of entry
velocity for each ballistic coefficient.
As with the deceleration loads, we can work with the
alternative analytical method instead of the graphical one
shown in Fig. 5.
We still retain the curve fit form shown in Eq. 6, but
determine the new values of the coefficients for peak
pressure loads. For a prescribed value of pPeak, Eq. 6 is
easily inverted to obtain the corresponding value of EFPA,
E. This provides a cross check against results of the
graphical method.
Figure 6 shows a sample fit to peak pressure loads for a 3.5
m diameter capsule of 2000 kg entry mass and an entry
velocity of 11.6 km/s. The values of A, , and obtained by
fitting the data are also shown in the figure.
Applying Eq. 6 to all peak pressure load curves (all nine of
them) shown in Fig. 5 results in the entries shown in Table
3. The inflections in and at 11.2 km/s are interesting, but
cannot be explained easily without finer resolution in entry
velocity. The dependence of the coefficients on EBC is
somewhat weak. The lead coefficient A shows a very strong
dependence on EBC.
Comparing the entries in Tables 2 and 3, we see that the
coefficients and are very similar for both peak
deceleration and peak pressure loads, which is not very
surprising. However, values of the lead coefficient A are
different, which is as expected from the different scaling.
As with the peak deceleration load, the dependence of the
curve-fit coefficients on either entry velocity or EBC could
be pursued further. However, such an undertaking will
require much finer resolution in both variables.
We now have two performance constraints, both of which
provide limits on the steepest EFPA. The obvious questions
are: (i) Can both these constraints be active at the same
time? and (ii) Is there a critical ballistic coefficient at which
both constraints return the same EFPA? The latter question
is harder to answer because we have only sampled the
ballistic coefficient variable at a finite number of points, i.e.,

10
ballistic coefficient is not a continuous variable in the
present work. However, both questions can be answered by
applying the graphical procedure (outlined in Figs. 3 and 5)
to all 15 cases of in Table 1.
Table 3. Coefficients of curves fit to peak pressure loads for a 2000 kg entry mass capsule
VE, km/s
11.6 11.2 10.8 11.6 11.2 10.8 11.6 11.2 10.8
E, kg/m2 Db, m A(VE,E) (VE,E) (VE,E)
388 2.5 2.47 2.09 2.11 -7.95 -7.50 -7.65 0.648 0.679 0.653
198 3.5 1.28 1.16 1.08 -7.77 -7.51 -7.34 0.661 0.669 0.668
120 4.5 0.78 0.71 0.69 -7.69 -7.42 -7.44 0.669 0.677 0.663
Figure 6. Variation with EFPA of peak pressure load for
mE= 2000 kg and 11.6 km/s entry velocity. The open
symbols are 3DoF predictions and the line is a curve fit
of the form shown in Eq. 6.
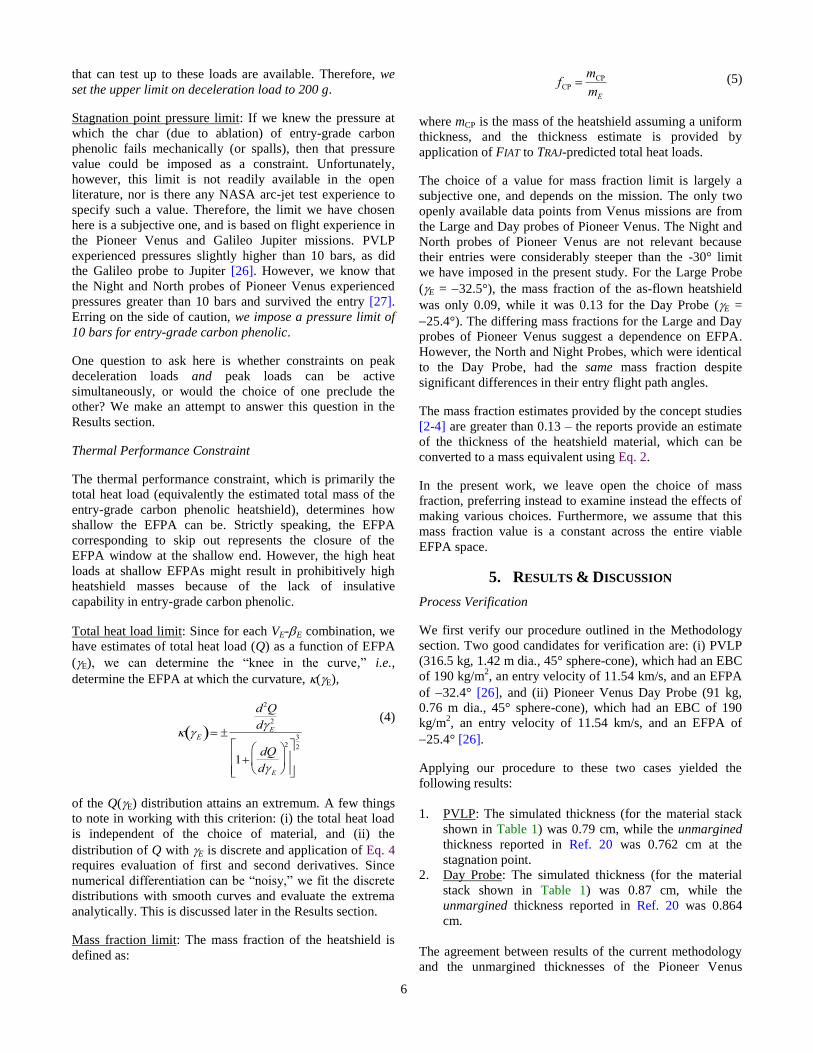
Deceleration Load Limit vs. Pressure Load Limit
We attempt to answer the question whether there is a
“critical” ballistic coefficient at which both constraints are
active, i.e., have the same EFPA for prescribed values of
peak deceleration and peak pressure load limits.
Pressure loads experience a very steep fall off with
decreasing ballistic coefficient (Fig. 6). The trend strongly
suggests that there is a “knee” in the critical pressure vs.
ballistic coefficient curve, and an attempt is made to
determine this “knee” using the bar chart shown in Fig. 7.
Each entry mass considered in the present work is a
horizontal bar in Fig. 7, and the length of each bar spans the
ballistic coefficient range covered by various diameters
(ranging from 2.5 m to 4.5 m) of the heatshield. Shown on
top of each bar are the diameters that correspond
(approximately) to the ballistic coefficients in the present
study. The bars are colored by the findings of analysis of
trajectories generated as part of this study. Regions colored
yellow indicate that the EFPA window is closed at the steep
end by the deceleration load constraint, and regions colored
green indicate that the EFPA window is closed by the
pressure load constraint. The gray areas between indicate
the ballistic coefficient range in which deceleration load
ceases to be an active constraint and pressure load becomes
the driver in closing the EFPA window at the steep end. The
diameters for which the pressure load constraint is a definite
driver are indicated in red in Fig. 7.
We see that the ballistic coefficient range at which the
switch occurs lies between 250 and 260 kg/m2. Therefore,
there is a “critical” EBC at which the deceleration load and
pressure load constraint yield the same interval closing entry
flight path angle. Denoting this “critical” EBC as E,crit, we
can determine the equivalent heatshield diameter, Db,crit,
from
Db,crit 4mE
CDE ,crit (7)
This heatshield diameter is to be interpreted as the smallest
diameter that can be flown without violating the peak
pressure load constraint, which we have assumed to be 10
bar. Using 255 kg/m2 as the value of E,crit and an entry mass
of 316.5 kg (mass of PVLP), we compute the minimum or
“critical” diameter of the heatshield to be 1.227 m. Although
further computations are necessary to get the precise value
of the “critical” EBC, it is comforting to see that the present
results are consistent with Pioneer Venus – the 316.5 kg
entry capsule had a 1.42 m diameter heatshield.
It should be borne in mind that this “critical” EBC is for a
10 bar limit on the peak pressure load. If the peak pressure
load limit is reduced, the value of E,crit will change (reduce)
as well (Fig. 5). Although a lower pressure load limit is
moot in the context of entry-grade carbon phenolic, this
finding might have implications for newer materials being
developed as alternates to entry-grade carbon phenolic.
Having worked with the mechanical constraints (or limits),
we turn next to the thermal performance constraint, viz. the
total heat load.
11
Figure 7. Bar chart of ballistic coefficient intervals in which the pressure load limit of 10 bar determines the closure of
the entry flight path angle at the steep end of the interval. Also indicated on the bar chart are the diameters of the
heatshields. Diameters for which the pressure limit determined EFPA interval closure are shown in red. The shaded
region between EBC values of 250 and 260 kg/m2 is where the peak deceleration and peak pressure loads switch roles
in determining the steepest entry angle. These results are for a 200 g peak deceleration load and 10 bar peak pressure
load mission profile.
Nominal Cases: Thermal constraint (total heat load)
The thermal performance constraint, which is primarily the
total heat load, determines how shallow the EFPA can be.
Figure 8 shows the variation with EFPA of total heat load at
the stagnation point for an entry mass of 2000 kg. Curves
are shown for all three entry velocities and three entry
ballistic coefficients. We observe the following:
(i) Total heat load is strongly dependent on ballistic
coefficient and entry velocity.
(ii) For a given EBC (curves of one family—solid, or
dashed, or dash-dotted) the highest total heat loads
correspond to the highest entry velocity (11.6 km/s).
(iii) For a given entry velocity (curves of one color – red, or
green, or blue) the highest total heat loads correspond to
the highest ballistic coefficient (388 kg/m2). Between
highest and lowest ballistic coefficients, the peak heat
fluxes differ by as much as a factor of 3.
(iv) In all cases, there is an upturn in total heat load at the
shallow end of the EFPA interval.
(v) These results are consistent with the contours shown in
Fig. 1.
As mentioned earlier, large total heat loads result in large
thicknesses of the thermal protection material to keep the
adhesive bondline at 250 °C. Deferring TPS mass fraction
and material properties for now, we therefore seek
“reasonable” heat loads that yield “reasonable” thicknesses
of the thermal protection material, and the EFPAs
corresponding to these heat loads. Since there is subjectivity
in coming up with a “reasonable” total heat load limit,
determination of the EFPA that closes the viable window at
the shallow entry end becomes a contentious task. We have
made an attempt here to develop a semi-rigorous metric to
determine the EFPA window closure.
We know the total heat load (Q) rises sharply beyond a
certain EFPA (Fig. 8). Therefore, we make an attempt to
determine the “knee in the curve” (point of maximum
curvature) of the Q-E distributions. Instead of using a
graphical method, or even a numerical approach with Eq. 4,
to compute the curvature, (E), of the total heat load
distributions, we use an analytical approach.
We first curve fit the total heat load distributions using a
function of the form given in Eq. 6, and then evaluate
curvature (Eq. 4) analytically.
Figure 9 shows a sample fit to total heat loads for a 3.5 m
diameter capsule of 2000 kg entry mass and an entry
velocity of 11.6 km/s. The values of A, , and (curve-fit
coefficients in Eq. 4) obtained by fitting the data are also
shown in the figure.

12
Figure 8. Variation with entry flight path angle of total heat load (at the stagnation point) for mE = 2000 kg
(EBC = 120, 198, and 388 kg/m2) and various entry velocities. The vertical dashed lines represent EFPAs at
which the total heat load distributions (for an entry velocity of 11.6 km/s) have maximum curvature.
Figure 9. Variation with EFPA of total heat load for mE
=2000 kg and 11.6 km/s entry velocity. The open symbols
are 3DoF predictions and the line is a curve fit of the
form shown in Eq. 6.
Applying Eq. 6 to all total heat load curves shown in Fig. 8
results in the entries shown in Table 4.
Comparing the values of (interpreted crudely as a skip out
EFPA) in Table 4, with the corresponding values in Tables
2 and 3, we see a shift of almost 1° towards the steeper end
of the EFPA interval. These results confirm what we
expected – the “knee in the curve” (of the total heat load
distributions) is away from the skip out boundary.
The distributions of curvature of total heat load, computed
using Eq. 4 with the entries given in Table 4, are shown in
Fig. 10. For each VE-E combination, there is a distinct peak
in curvature, and each peak is the “knee in the curve” of the
corresponding total heat load distribution. The values of
EFPA corresponding to the peaks in curvature (Fig. 10) are
shown in Table 5. The peaks depend weakly on entry
velocity, but shift by as much as 1.0° with a factor of 3
change in EBC.
Table 4. Coefficients of curves fit to total heat loads for a 2000 kg entry mass capsule
VE, km/s
11.6 11.2 10.8 11.6 11.2 10.8 11.6 11.2 10.8
E, kg/m2 Db, m A(VE,E) (VE,E) (VE,E)
388 2.5 30.7 24.8 22.2 8.75 8.56 7.93 0.075 0.108 0.159
198 3.5 17.4 14.5 12.8 8.75 8.49 8.06 0.082 0.123 0.167
120 4.5 11.6 9.8 9.3 8.71 8.48 7.78 0.095 0.138 0.201

13
Figure 10. Variation with EFPA of curvature (Eq. 4) of
total heat load distributions for mE = 2000 kg and nine
VE-E combinations (10.8, 11.2, and 11.6 km/s and 2.5,
3.5, and 4.5 m diameter).
Table 5. EFPAs corresponding to peak curvature in heat
load distributions for mE = 2000 kg VE, km/s
11.6 11.2 10.8
E, kg/m2 Db, m E at max of Q
388 2.5 10.40 10.45 10.32
198 3.5 9.81 9.81 9.62
120 4.5 9.55 9.52 9.17
We could use the EFPA values in Table 5 to close the
shallow end of the EFPA window, i.e., prescribe these
values as the shallowest one should enter the atmosphere of
Venus. The vertical dashed lines in Fig. 8 represent these
limits for an entry velocity of 11.6 km/s. Just because we
have “closed” the EFPA window does not mean that we
have established their viability. To do so would require that
we have to consider both the heatshield mass fraction (Eq.
5) and peak heat flux. However, before we take up these
ideas next, we emphasize that a material is not involved in
the total heat load argument presented so far. The total heat
load is simply a time-integrated heat flux, and the heat flux
at the stagnation point (Eq. 2) is independent of the material.
However, the heatshield mass fraction argument presented
next does depend on the choice of material for the
heatshield.
Nominal Cases: TPS mass fraction
Figure 11 shows the variation with EFPA of unmargined
heatshield mass (based on uniform thickness of entry-grade
carbon phenolic) for an entry mass of 2000 kg. Curves are
shown for all three entry velocities and three entry ballistic
coefficients. Several thin vertical dashed lines are shown in
the figure. The blue vertical lines represent EFPA limits
determined by either the 200 g limit on peak deceleration
loads or by the 10 bar limit on peak pressure loads.
Referring back to Fig. 5, we see that for the 2000 kg/2.5 m
dia. heatshield (EBC of 388 kg/m2), the steepest EFPA is
determined by the 10 bar pressure limit; the peak
deceleration load limit of 200 g determines the steepest
EFPA for the other two diameters at this entry mass. The
black vertical lines represent EFPA limits determined by the
total heat load. The EFPA space between like pairs of
vertical lines, indicated by double-headed green arrows,
represents the first estimate of the viable EFPA window for
each diameter (equivalently each EBC).
We now attempt to get a second estimate of the viable
EFPA window by prescribing a “desired” heatshield mass,
which is simply the product of a “desired” mass fraction (of
the heatshield) and the entry mass (Eq. 5). We could use the
Pioneer Venus probes for these fractions or rely on the
estimates provided by the mission concepts [2-4]. The mass
fraction of entry-grade carbon phenolic used in PVLP was
0.09, i.e., 9% of the entry mass (of 316.5 kg) was taken up
by just the carbon phenolic material; this fraction was 0.13
for the three small probes (91 kg) of the Pioneer Venus
mission. These mass fractions are from as-flown designs.
However, the mass fractions for the concept missions [2-4]
ranged from 0.17 to 0.22 (values back calculated using the
thicknesses stated, wetted areas, and mass density of entry-
grade carbon phenolic).
We see that there can be variability in mass fractions,
perhaps due to variability in mission requirements, or
perhaps due to different assumptions, or both. The best that
can be done then is to determine the sensitivity of the EFPA
window to an assumed fraction. However, we have to be
cautious here because the estimates of heatshield mass that
we have are unmargined. Since the present paper is not
about heatshield design, and hence, we do not have a
margins policy, we have simply used an arbitrary value of
0.1 of the unmargined heatshield mass fraction to illustrate a
few key points.
The thin horizontal dashed line is shown in Fig. 11 for a
heatshield mass of 200 kg for a 2000 kg entry mass, i.e., for
a mass fraction of 0.1. First, we notice that a 4.5 m diameter
heatshield has no viable entry space based on this assumed
mass fraction. Second, the shallow end of the EFPA
window for the 3.5 m diameter heatshield closes at roughly -
19°, which is close to the steep end limit of roughly 22°.
Third, the first estimate of viable EFPA space for the 2.5 m
dia. heatshield remains unchanged. Fourth, to enable the
larger diameter heatshield will require an increase in the
stipulated value of 0.1 for mass fraction.
There is little further to be gained from working with the
mass fraction argument, especially since it requires both a
margins policy and a clear mission requirement and/or mass
allocation.

14
Figure 11. Variation with entry flight path angle of unmargined heatshield mass for mE = 2000 kg (EBC = 120,
198, and 388 kg/m2) and various entry velocities. The vertical lines represent EFPA limits derived from
mechanical and thermal constraints. The thin horizontal dashed line at 200 kg represents a heatshield mass
fraction of 0.1
Nominal Cases: Material heat flux limit
The chief remaining consideration is the heat flux
performance of the material. Ablative materials usually have
a threshold heat flux below which their performance is
diminished, making them mass inefficient. This heat flux
threshold is not available in the open literature. Therefore,
we choose not to take it into consideration. The only thing
one could do is to determine the heat flux values
corresponding to the EFPA limits to see if these values
exceed the performance requirements of the mission.
We conclude here by stating that only a sampling of the
results of this study has been provided in the present paper.
Complete details are available from a comprehensive
document [28] currently in preparation.
6. GROUND TEST CONSIDERATIONS
One aspect not addressed in the present work is testing of
materials (entry-grade carbon phenolic or other). Ground-
based test facilities, such as arc jets, also have to be factored
into the constraints because there are limits on the test heat
fluxes and pressures they can provide. Depending on the
trajectory, some of the predicted pressure-heat flux
combinations could lie outside the operational envelopes of
these ground-based facilities. Furthermore, some of the
facilities developed at NASA Ames Research Center (ARC)
during the Galileo program no longer exist.
Based on the results shown in Table 6, the predicted heat
fluxes and pressures at the low end are roughly 2 kW/cm2
and 5 bar. With an appropriate test article design, heat
fluxes of this level can be achieved in the 60 MW
Interaction Heating Facility (IHF) arc jet at NASA ARC.
For instance, one could test small (10.16 cm diameter)
sphere-cone geometries in the smallest nozzle (15.24 cm
exit diameter) that is currently available in the IHF.
However, stagnation point pressures greater than 1.5 bar
cannot be achieved with this nozzle. To raise the pressure,
the nozzle exit diameter will have to be smaller. Indeed,
there is currently a plan at NASA ARC to develop a nozzle
with an exit diameter of 7.62 cm (3 inches). While such a
nozzle will be more able to provide the high heat fluxes and
pressures necessary to test and qualify materials, modeling
and test design (in terms of coupon size and thermal
response including sidewall effects) will pose more of a
challenge. A piecewise approach to testing and flight
qualification, as discussed in the paper of Venkatapathy et
al. [29], would probably be called for.
7. SUMMARY
We have considered the legacy 45° sphere-cone aeroshell
geometry for entries into Venus, which is called out as a
priority destination in the latest NRC Planetary Science
Decadal Survey. Guided by some of the mission studies
performed in support of the latest Decadal Survey, we have
considered a number of entry mass and diameter
combinations and a range of entry velocities as initial
conditions for atmospheric entry into Venus. Specifically,
we have considered combinations of entry masses of 1500,
1750, 2000, 2250, and 2750 kg, diameters of 2.5, 3.5, and
4.5 m, and entry velocities of 10.8, 11.2, and 11.6 km/s.

15
Furthermore, we have limited the present study to ballistic
entries that tie back to Pioneer Venus legacy.
With the knowledge of entry ballistic coefficient, entry
velocity, and heading angle, we have rapidly generated
hundreds of 3DoF trajectories using the in-house code,
TRAJ. We have covered an EFPA range from near skip out at
the shallow end to -30° at the steep end, with an increment
of 0.5°. All trajectory computations are terminated at a
Mach number of 0.8, assuming parachute deployment at this
point. For each trajectory we have tracked the peak
deceleration load (or g load), the peak pressure at the
stagnation point (or p load), the peak total heat flux (both
convective and radiative heat fluxes computed using
correlations based on the nose radius and freestream density
and flight speed), the total heat load, and the final altitude at
Mach 0.8. Further, for each trajectory, using the FIAT option
built into TRAJ, the unmargined thickness (at the stagnation
point of the heatshield) of entry-grade carbon phenolic (for
which a calibrated material thermal response model is
readily available) has been computed. Assuming this
thickness to be uniform, we have computed the mass of the
heatshield. The trajectory and material sizing computations
are calibrated against similar data for PVLP.
With this coverage of EFPA, we have imposed constraints
based on mechanical and thermal performance of the
heatshield material. For mechanical performance we have
assumed a deceleration load limit of 200 g on the science
payload and a pressure load limit of 10 bar on the heatshield
material. Applying these constraints on the TRAJ-predicted
deceleration and pressure loads, we have shown that they
determine the steepest possible entries. Furthermore, we
have shown that, for the chosen ballistic coefficients, the
constraints on deceleration loads and pressure loads are not
active at the same time. For most cases the operating
constraint that determines the steepest possible entry is the
deceleration load limit of 200 g. However, as the EBC
increases, the 10 bar limit on pressure becomes increasingly
important. Analysis of computed trajectories shows the
existence of “critical” EBCs beyond which the steepest
entry angle is determined by the pressure load and not the
deceleration load. The thermal performance of the material
determines the shallowest possible entries, and we have
assumed a threshold based on inflections in total heat load
distributions. Using the steep and shallow end limits on
EFPA determined by mechanical performance and thermal
performance constraints, respectively, we have determined
the viable EFPA windows (if any) for the many mass and
diameter combinations, thus meeting the primary objective
of the present work. A key finding is that there is a critical
ballistic coefficient beyond which the structural integrity of
the material under pressure loads becomes limiting. For the
above mechanical constraint choices, this E,crit is about 250
kg/m2.
We hope that apart from establishing viable entry corridors
for Venus missions (all predicated on the use of entry-grade
carbon phenolic on a legacy 45° sphere-cone geometry), the
results of the present study will be useful in the
development of a new class of ablators. Based on the
analysis presented, we think that a key driver in the
development of a new class of ablators for rigid aeroshells
is the pressure load, and the higher the spallation pressure
load limit of the new materials, the more the EFPA window
for ballistic entries can be opened up.
We add that the methodology presented here initially
employed a graphical approach to analysis of 3DoF results.
However, we have also demonstrated that it is possible to
use analytical methods to determine first estimates of viable
EFPA intervals. Essentially this means that with a modest
investment in the development of software tools, we can
develop an analysis framework, which significantly reduces
analysis time, allows for examination of larger and finer set
of parameters, and generalizes to other planetary entries.
ACKNOWLEDGEMENTS
The Entry Systems and Technology Division at NASA
Ames Research Center supported the authors, Dinesh
Prabhu and Gary Allen, by Contract NNA10DE12C to
ERC, Inc. The authors also acknowledge helpful discussions
with Raj Venkatapathy, Bernie Laub, Joseph Garcia, Kathy
McGuire, Loc Huynh, and John Karcz from Ames Research
Center. Thorough reviews of the manuscript by David
Saunders, Don Ellerby, Brandon Smith, Paul Wercinski, and
Ethiraj Venkatapathy are deeply appreciated by the authors.
REFERENCES
[1] National Research Council, Visions and Voyages for
Planetary Science in the Decade 2013-2022, National
Academies Press, 2012.
[2] Baker, C. L., and Karpati, G., “Venus Mobile
Explorer,” a Mission Concept Study in support of the
NRC Planetary Science Decadal Survey, December
2009.
[3] Adams, M. L., and Baker, C. L., “Venus Intrepid
Tessera Lander,” a Mission Concept Study in support
of the NRC Planetary Science Decadal Survey, April
2010.
[4] Adams, M. L., and Balint, T., “Venus Climate Mission
Study,” a Mission Concept Study in support of the NRC
Planetary Science Decadal Survey, June 2010.
[5] Spilker, T. R., “Saturn Atmospheric Entry Probe Trade
Study,” First part of a Mission Concept Study in
support of the NRC Planetary Science Decadal Survey,
September 2010.
[6] Spilker, T. R., “Saturn Atmospheric Entry Probe
Mission Study,” Second part of a Mission Concept
Study in support of the NRC Planetary Science Decadal
Survey, April 2010.
[7] Van den Berg, M., and Falkner, P., “Study Overview of
the Venus Entry Probe: An ESA Technology Reference
Study,” ESTEC document SCI-AP/2006/173/
VEP/MvbB, Issue 2, Rev. 3, February 2007.
[8] Sengupta, A. and Hall, L., “Challenges of a Venus
Entry Mission,” 2011 IEEE Aerospace Conference, Big
Sky, MT, 2012.
16
[9] Sengupta, A., Cruz, J., Prabhu, D., and Wercinski, P.,
“Development of a Venus Entry System for the Surface
and Atmospheric Geochemical Explorer (SAGE),” 9th
International Planetary Probe Workshop, Toulouse,
France, June 2012.
[10] Venkatapathy, E., Allen, G., Prabhu, D., and White, T.,
“Going Beyond Rigid Aeroshells: Enabling Venus and
Outer-Planet In-Situ Science Missions with
Deployables,” 8th
International Planetary Probe
Workshop, Portsmouth, VA, June 2011.
[11] Gasch, M., “Re-Entry Grade Carbon Phenolic for
NASA Planetary Probes - Past History and Assessment
of Current Availability,” 60th
JPM/9th
MSS/7th
LPS/6th
SPS/Joint Subcommittee Meeting (ITAR Restricted),
Colorado Spring, CO, Apr.-May 2013.
[12] Peterson, D. L., and Nicolet, W. E., “Heat Shielding for
Venus Entry Probes,” J. Spacecraft and Rockets, Vol.
36, No. 3, 1974, pp. 382-387.
[13] Chen, Y.-K., and Milos, F. S., “Ablation and Thermal
Response Program for Spacecraft Heatshield Analysis,”
J. Spacecraft and Rockets, Vol. 11, No. 6, 1999, pp.
475-483.
[14] Garcia, J.A., McGuire, K.M., Bowles, J.V., and Huynh,
L.C., “Venus Lifting Trajectory Studies of a Low L/D
and Mid L/D Aeroshell,” currently an internal report
which is expected to be presented at the 10th
Intl.
Planetary Probe Workshop, San Jose, CA, April 2013. [15] Kliore, A. J., Moroz, V. I., and Keating, G. M. (editors),
“The Venus International Reference Atmosphere,”
Advances in Space Research, Vol. 5, No. 11, 1985, pp.
1–304, Pergamon Press, Oxford, 1986.
[16] Gary A. Allen, Jr., Michael J. Wright, and Peter Gage,
“The Trajectory Program (Traj): Reference Manual
and User's Guide,” NASA/TM-2004-212847, 2005. [17] Fay, J. A., and Riddell, F. R., “Theory of Stagnation
Point Heat Transfer in Dissociated Air,” Journal of
Aeronautical Sciences, Vol. 25, No. 2, 1958, pp. 73-85.
[18] Tauber, M. E., Private communication, October 2008.
[19] Wakefield, R. M., and Pitts, W. C., “Analysis of the
Heat-Shield Experiment on the Pioneer-Venus Entry
Probes,” AIAA Paper 80-1494, July 1980.
[20] Anon., Pioneer Venus Large and Small Probe Data
Book, HS507-5164, Hughes Aircraft Company, Los
Angeles, California, 1976.
[21] Talley, R. L., Pioneer Venus Deceleration Module –
Final Report, Re-entry and Environmental Systems
Division, General Electric, Philadelphia, PA, 1978.
[22]Momentive, 180 East Broad Street, Columbus, OH
43215.
http://www.momentive.com/Products/ShowTechnicalD
ataSheet.aspx?id=10319
[23] Dutta, S., Smith, B., Prabhu, D., and Venkatapathy, E.,
“Mission Sizing and Trade Studies for Low Ballistic
Coefficient Entry Systems to Venus,” 2012 IEEE
Aerospace Conference, Big Sky, MT, March, 2012.
[24] Wright, M.W., White, T., and Mangini, N., “Data
Parallel Line Relaxation (DPLR) Code User Manual
Acadia – Version 4.01.1,” NASA/TM‐2009‐215388,
October 2009.
[25] Whiting, E. E., Park, C., Liu, Y., Arnold, J. O., and
Paterson, J. A., “NEQAIR96, Nonequilibrium and
Equilibrium Radiative Transport and Spectra Program:
User’s Manual,” NASA RP-1389, NASA, December
1996.
[26] Ames Research Center, “Planetary Mission Entry
Vehicles: Quick Reference Guide, v3,” NASA/SP-
2006-2041, 2006.
[27] Bienstock, B, “Pioneer Venus and Galileo Entry Probe
Heritage,” International Workshop on Planetary Probe
Atmospheric Entry and Descent Trajectory Analysis
and Science, Lisbon, Portugal, Oct. 2003.
[28] Prabhu, D. K., Allen, G. A., Jr., Cappuccio, G., Spilker,
T. R., Hwang, H. H., and Moses, R. W., “Atmospheric
Entry Studies for Saturn and Venus Missions: 45°
Sphere-Cone Rigid Aeroshells and Ballistic Entries,”
NASA TM (in preparation), 2012.
[29] Venkatapathy, E., Laub, B., Hartmann, G. J., Arnold, J.
O., Wright, M. W., Allen, G. A, “Selection and
Certification of TPS: Constraints and Considerations
for Venus Missions,” 6th
International Planetary Probe
Workshop, Atlanta, GA, June 2008.
BIOGRAPHIES
Dinesh K. Prabhu is a Senior Staff
Scientist with ERC, Inc., an onsite
contractor at NASA Ames Research
Center. He received his B.Tech. in
Aeronautical Engineering from the
Indian Institute of Technology at
Madras, India, and his Ph.D. in
Aerospace Engineering from the
Iowa State University at Ames, Iowa. His interests are in
modeling and simulation of high-temperature hypersonic
flow fields (for ground testing and flight), and in
aerothermodynamic design of ground tests and
atmospheric entry vehicles.
Gary A. Allen, Jr. is a Senior
Research Scientist with ERC, Inc.,
an onsite contractor at NASA Ames
Research Center. He received his
B.S. in Engineering Physics from the
University of California, Berkeley,
and his Ph.D. in Aerospace
Engineering from Stanford
University, California. His main professional focus is
modeling and simulation of spacecraft atmospheric entry
through engineering approximations. He is the author of
TRAJ.
Gelsomina Cappuccio is a Project
Manager at NASA Ames Research
Center. She received her BS in
Mechanical Engineering from the
University of Massachusetts at
Amherst, MA, and her MS in
Mechanical Engineering from the
Pennsylvannia State University at
17
State College, PA. Her interests are in the management of
the application of newly developed technologies and
scientific discoveries as it is applied to air breathing and
entry vehicles. She was formerly the Project Manager of
SOFIA Science, MSL Rover Sample Cache System, and X-
37 Wing Leading Edge TPS.
Thomas R. Spilker received his
Ph.D. from Stanford University and
spent the next 22 years at JPL, first
as an NRC Postdoctoral Fellow for
two years, then for two years in
JPL's Science Division. From there
he moved to space flight mission
architecture in JPL’s Division 31,
where he bridged the gulf between
science and engineering from 1995
until his retirement in mid-2012. He now operates his
consulting business, Solar System Science and
Exploration, in Monrovia, CA.
Helen H. Hwang is the Science Missions Development
Manager in the Entry Systems and Technology Division at
NASA Ames Research Center. She received her B.S., M.S.,
and Ph.D. in Electrical Engineering from the University
of Illinois at Urbana-Champaign. She has participated in
numerous planetary probe mission concept developments
and proposals. Previously, she was the Thermal
Protection System Project Manager for the Mars Science
Laboratory mission.
Robert W. Moses is a Senior
Researcher at NASA Langley
Research Center in the
Atmospheric Flight and Entry
Systems Branch within the
Engineering Directorate. He
received his B.S. in Civil
Engineering from North Carolina
State University, his M.S. in
Systems Engineering from Virginia Polytechnic Institute
and State College, his M.S. in Mechanical Engineering
from Stanford University, and his Ph.D. in Aeronautics &
Astronautics from Stanford University. With other
Centers, agencies, and industry, he has participated in
flight projects in aeronautics and space mission
directorates.
Recommended