APRIL 2016
Free to NACE members
NATIONAL ASSOCIATION OF COLLEGES AND EMPLOYERS62 Highland Avenue Bethlehem, PA 18017-9085 • 610.868.1421 • www.naceweb.org
JOB OUTLOOK
2016 SPRING UPDATE

TABLE OF CONTENTS
About the Survey ...................................................................................................................................3
College Hiring to Increase 5.2 Percent ...............................................................................................4 Figure 1: Job Outlook hiring projections, 2011 – 2016 Figure 2: Hiring plans Figure 3: Job postings and applications down
Degrees and Majors in Demand .........................................................................................................6 Figure 4: Hiring expectations by degree level for 2016 Figure 5: Actual hiring by degree level for 2015 Figure 6: Hiring expectations by major
Career Readiness Competencies ........................................................................................................8 Figure 7: Employers rate career readiness competencies in terms of essential need (2016 vs. 2015)
Spring 2016 Recruiting Plans ............................................................................................................10 Figure 8: Spring 2016 recruiting
Fall 2016 Recruiting for the Class of 2017 .....................................................................................11 Figure 9: Expectations for fall 2016 compared with expectations for fall 2015 and 2014
Appendix ...............................................................................................................................................12 Figure 10: Respondents by type of organization Figure 11: Respondents by size of company Figure 12: Respondents by industry Survey Respondents
©2016 National Association of Colleges and Employers. All rights reserved.
2 | Job Outlook 2016 Spring Update | National Association of Colleges and Employers

National Association of Colleges and Employers | Job Outlook 2016 Spring Update | 3
ABOUT THE SURVEY
ABOUT THE SURVEY
The Job Outlook 2016 Spring Update survey was conducted from February 10 – March 22, 2016; the survey was sent to 944 NACE employer members; 144, or 15.3 percent, responded. The survey updates hiring projections for the Class of 2016; those projections were collected from NACE employer members from August 5 – September 13, 2015, and reported in the Job Outlook 2016 report, published in November 2015.
By region, 22.9 percent of respondents are from the Northeast, 27.8 percent are from the Southeast, 33.3 percent are from the Midwest, and 16.0 percent are from the West. For additional information about the respondents, see the Appendix.
Data are calculated based on the number of respondents to each specific question. Totals may not equal 100 percent due to rounding.
RESEARCH TEAM:Director of Research, Public Policy, and Legislative Affairs: Edwin W. KocResearch Manager: Andrea J. KonczResearch Associate: Kenneth C. TsangResearch Associate: Louisa EismannResearch Assistant: Anna Longenberger

COLLEGE HIRING
COLLEGE HIRING TO INCREASE 5.2 PERCENT
Employers expect to hire 5.2 percent more new graduates from the Class of 2016 than they hired from the Class of 2015.
While hiring activity for the college Class of 2016 is positive, the current hiring projections are down from the 11 percent increase employers originally reported through the Job Outlook 2016 survey, results of which were published in November 2015. (See Figure 1.)
0
FALL SPRING UPDATE
2011 2012 2013 2014 20162015
5
15
10
20
Figure 1 JOB OUTLOOK HIRING PROJECTIONS, 2011 – 2016*
* Please note: Classes of 2014, 2015, and 2016 projections are for U.S. locations only. Prior years’ projections are shown for informational purposes only, and should not be compared to projections for 2014, 2015, and 2016.
13.5%
19.3%
9.5% 10.2%
13.0%
2.1%
7.8% 8.6% 8.3%9.6%
11.0%
5.2%
4 | Job Outlook 2016 Spring Update | National Association of Colleges and Employers

National Association of Colleges and Employers | Job Outlook 2016 Spring Update | 5
COLLEGE HIRING
Much of the change can be attributed to a larger portion of employers reporting plans to trim hiring. Just 13.2 percent of respondents originally reported plans to hire fewer 2016 graduates than they did 2015 graduates; currently, more than one-third say that is the case. (See Figure 2.)
Figure 2 HIRING PLANS
Job OutlookPercent
Increasing HiresPercent
Maintaining HiresPercent
Decreasing HiresTotal Number of
Respondents
Spring Update 2016 40.9% 22.0% 37.1% 132
Job Outlook 2016 (Fall 2015) 40.1% 46.7% 13.2% 201
Spring Update 2015 55.9% 11.8% 32.2% 152
Figure 3 JOB POSTINGS AND APPLICATIONS DOWN
Recruiting YearAverage Number of
Job PostingsAverage Number of
Applications per Posting
2015-16 67 22.7
2014-15 148 23.4
2013-14 99 28.4
2012-13 106 18.4
2011-12 116 32.6
2010-11 105 21.1
Additionally, the average number of job postings for the 2015-16 recruiting year is down compared to the 2014-15 year, while the average number of applications per posting remains fairly consistent between the years. (See Figure 3.)
DEGREES AND MAJORS
DEGREES AND MAJORS IN DEMAND
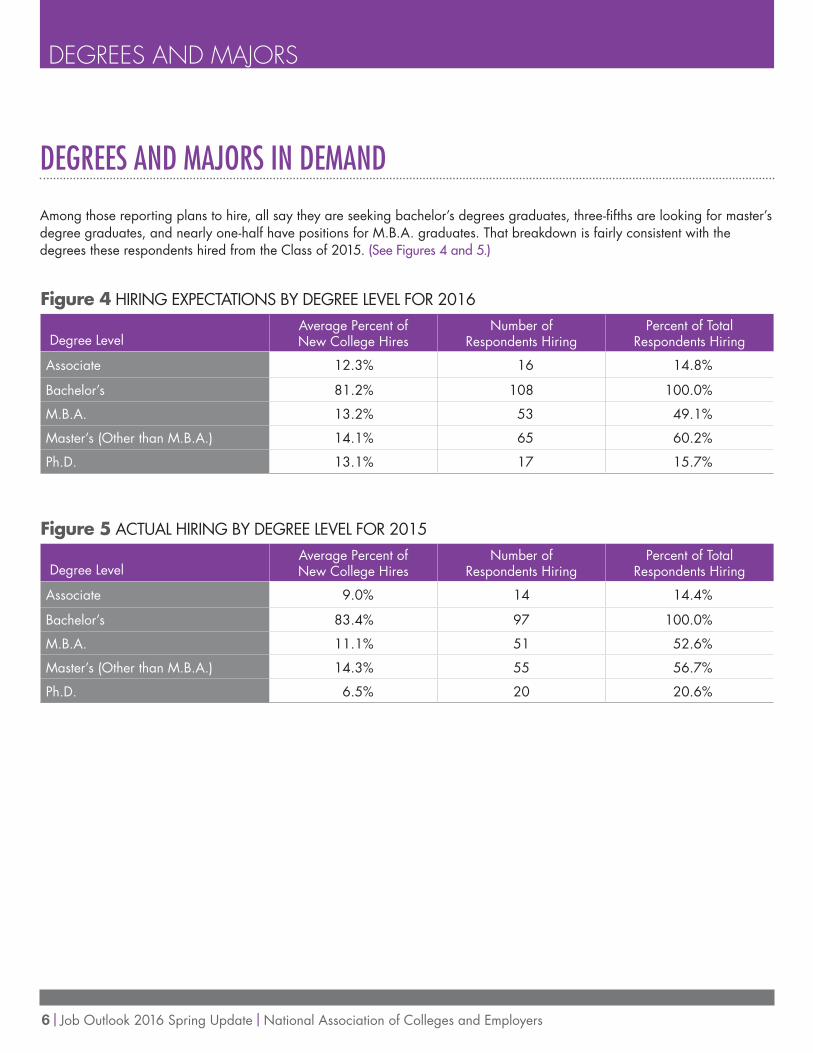
Among those reporting plans to hire, all say they are seeking bachelor’s degrees graduates, three-fifths are looking for master’s degree graduates, and nearly one-half have positions for M.B.A. graduates. That breakdown is fairly consistent with the degrees these respondents hired from the Class of 2015. (See Figures 4 and 5.)
Figure 4 HIRING EXPECTATIONS BY DEGREE LEVEL FOR 2016
Degree LevelAverage Percent of New College Hires
Number of Respondents Hiring
Percent of Total Respondents Hiring
Associate 12.3% 16 14.8%
Bachelor’s 81.2% 108 100.0%
M.B.A. 13.2% 53 49.1%
Master’s (Other than M.B.A.) 14.1% 65 60.2%
Ph.D. 13.1% 17 15.7%
Figure 5 ACTUAL HIRING BY DEGREE LEVEL FOR 2015
Degree LevelAverage Percent of New College Hires
Number of Respondents Hiring
Percent of Total Respondents Hiring
Associate 9.0% 14 14.4%
Bachelor’s 83.4% 97 100.0%
M.B.A. 11.1% 51 52.6%
Master’s (Other than M.B.A.) 14.3% 55 56.7%
Ph.D. 6.5% 20 20.6%
6 | Job Outlook 2016 Spring Update | National Association of Colleges and Employers
National Association of Colleges and Employers | Job Outlook 2016 Spring Update | 7
DEGREES AND MAJORS
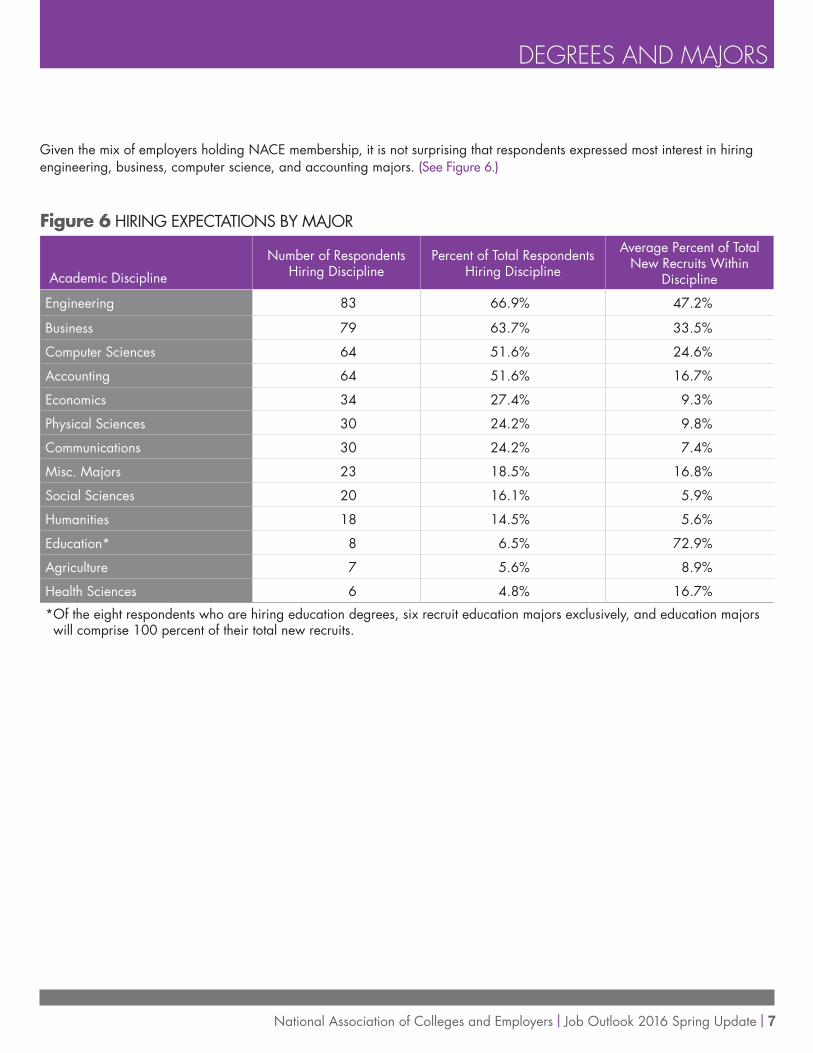
Given the mix of employers holding NACE membership, it is not surprising that respondents expressed most interest in hiring engineering, business, computer science, and accounting majors. (See Figure 6.)
Figure 6 HIRING EXPECTATIONS BY MAJOR
Academic Discipline
Number of Respondents Hiring Discipline
Percent of Total Respondents Hiring Discipline
Average Percent of Total New Recruits Within
Discipline
Engineering 83 66.9% 47.2%
Business 79 63.7% 33.5%
Computer Sciences 64 51.6% 24.6%
Accounting 64 51.6% 16.7%
Economics 34 27.4% 9.3%
Physical Sciences 30 24.2% 9.8%
Communications 30 24.2% 7.4%
Misc. Majors 23 18.5% 16.8%
Social Sciences 20 16.1% 5.9%
Humanities 18 14.5% 5.6%
Education* 8 6.5% 72.9%
Agriculture 7 5.6% 8.9%
Health Sciences 6 4.8% 16.7%
* Of the eight respondents who are hiring education degrees, six recruit education majors exclusively, and education majors will comprise 100 percent of their total new recruits.

CAREER READINESS
CAREER READINESS COMPETENCIES
NACE’s seven career readiness competencies represent those skills, experiences, and attributes that broadly prepare students for a successful transition into the work force. (See page 9 for the competencies and their definitions.) Employers of new college graduates seek such competencies in their new hires as these enable new hires to use the knowledge they have acquired through their course of study effectively in the workplace. To gauge the relative importance of each of the seven competencies to hiring organizations, NACE asked employers to rate them in terms of “essential need.”
As Figure 7 illustrates, four of the competencies—critical thinking/problem solving, professionalism/work ethic, teamwork, and communications skills—rise to the top. These results are consistent with those posted a year ago, indicating that these competencies are virtual “must haves.”
Figure 7 EMPLOYERS RATE CAREER READINESS COMPETENCIES IN TERMS OF ESSENTIAL NEED (2016 VS. 2015)
Competency
Essential Need Rating
2016 2015
Critical Thinking/Problem Solving 4.7 4.7
Professionalism/Work Ethic 4.7 4.5
Teamwork 4.6 4.6
Oral/Written Communications 4.4 4.4
Information Technology Application 3.9 3.9
Leadership 3.9 3.9
Career Management 3.6 3.6
*Weighted average. Based on a 5-point scale where 1=Not essential, 2=Not very essential; 3=Somewhat essential; 4=Essential; 5=Absolutely essential
In October 2015, NACE released its definition of and competencies associated with career readiness.
(See www.naceweb.org/knowledge/career-readiness-competencies.aspx.) The competencies are based, in large part, on information employers
provided through the annual Job Outlook survey over more than a decade.
8 | Job Outlook 2016 Spring Update | National Association of Colleges and Employers

National Association of Colleges and Employers | Job Outlook 2016 Spring Update | 9
CAREER READINESS
NACE Career Readiness Competency* Definition
Critical Thinking/Problem SolvingExercise sound reasoning and analytical thinking; obtain, interpret, and use knowledge, facts, and data to analyze situations, make decisions, and solve workplace problems; and demonstrate originality and inventiveness in work.
Oral/Written Communications
Articulate thoughts, ideas clearly and effectively with persons inside and outside of organization; demonstrate public speaking skills; and communicate new ideas to others; write/edit memos, letters, and complex technical reports clearly and effectively.
Teamwork/Collaboration
Build collaborative relationships with colleagues and customers representing diverse cultures, races, ages, genders, religions, lifestyles, and viewpoints; be able to work within team structure; and be able to negotiate and manage conflicts.
Information Technology Application Select and use appropriate technology to accomplish a given task and apply computing skills to problem solving.
Leadership
Leverage the strengths of others to achieve common goals; use interpersonal skills to coach and develop others; demonstrate ability to assess and manage one’s own emotions and those of others, using empathetic skills to guide and motivate; and prioritize and delegate work.
Professionalism/Work Ethic
Demonstrate personal accountability, effective work habits, e.g. punctuality, working productively with others, and workload management, and understand impact of non-verbal communication on professional work image; demonstrate integrity and ethical behavior; act responsibly with the interests of the larger community in mind; and be able to learn from one’s mistakes.
Career Management
Identify and articulate one’s skills, strengths, knowledge, and experience relevant to position desired and career goals; identify areas necessary for professional growth; be able to navigate and explore job options and how to take the steps necessary for pursuing opportunities; and understand how to self-advocate for opportunities in the workplace.
*See www.naceweb.org/knowledge/career-readiness-competencies.aspx.

SPRING RECRUITING
SPRING 2016 RECRUITING PLANS
Although the overall increase in college hiring is smaller than was originally predicted, most respondents expect to recruit this spring.
Almost 86 percent of respondents have plans to be on campus to hire interns/co-ops and/or full-time hires. (See Figure 8.) As this and other results shown in Figure 8 suggest, current respondents seem to have been more cautious about their overall hiring than were their counterparts last year, as they were somewhat more likely to leave a portion of their hiring to the spring (86 percent in 2016 versus 80 percent in 2015).
Figure 8 SPRING 2016 RECRUITING Number of 2016
RespondentsPercent of 2016
RespondentsNumber of 2015
RespondentsPercent of 2015
Respondents
Full-time, Only 12 9.6% 12 7.5%
Intern, Only 14 11.2% 25 15.6%
Both Intern & Full-time 81 64.8% 91 56.9%
On-campus Presence – Not Hiring 7 5.6% 13 8.1%
No Presence – Hired During Fall 10 8.0% 18 11.3%
Not Hiring This Year 1 0.8% 1 0.6%
Total 125 100.0% 160 100.0%
10 | Job Outlook 2016 Spring Update | National Association of Colleges and Employers

National Association of Colleges and Employers | Job Outlook 2016 Spring Update | 11
FALL RECRUITING
FALL 2016 RECRUITING FOR THE CLASS OF 2017
What is ahead for the Class of 2017?
Many employers “front load” their recruiting, concentrating much of their recruiting in the fall to secure hires who will graduate later in the year (typically December and May). Asked to project their fall 2016 recruiting plans, responding employers appear to be proceeding with caution.
Nearly half expect to hire the same number of Class of 2017 graduates in fall 2016 as they did in fall 2015, while less than one-third think they will hire more. In contrast, employers reporting their plans for fall 2015 and in fall 2014 reported more aggressive hiring plans. (See Figure 9.)
Figure 9 EXPECTATIONS FOR FALL 2016 COMPARED WITH EXPECTATIONS FOR FALL 2015 AND 2014 Number of 2016
RespondentsPercent of 2016
RespondentsNumber of 2015
RespondentsPercent of 2015
Respondents
Hire More 37 29.6% 35.8% 42.9%
Hire Fewer 9 7.2% 8.6% 3.2%
Hire Same 60 48.0% 37.0% 37.0%
Unsure 19 15.2% 18.5% 16.9%
Total 125 100.0% 100.0% 100.0%
Later this summer, NACE will collect data from employers on their initial hiring plans for the upcoming Class of 2017. Those hiring projections will be reported in late fall 2016.
12 | Job Outlook 2016 Spring Update | National Association of Colleges and Employers
APPENDIX
APPENDIX
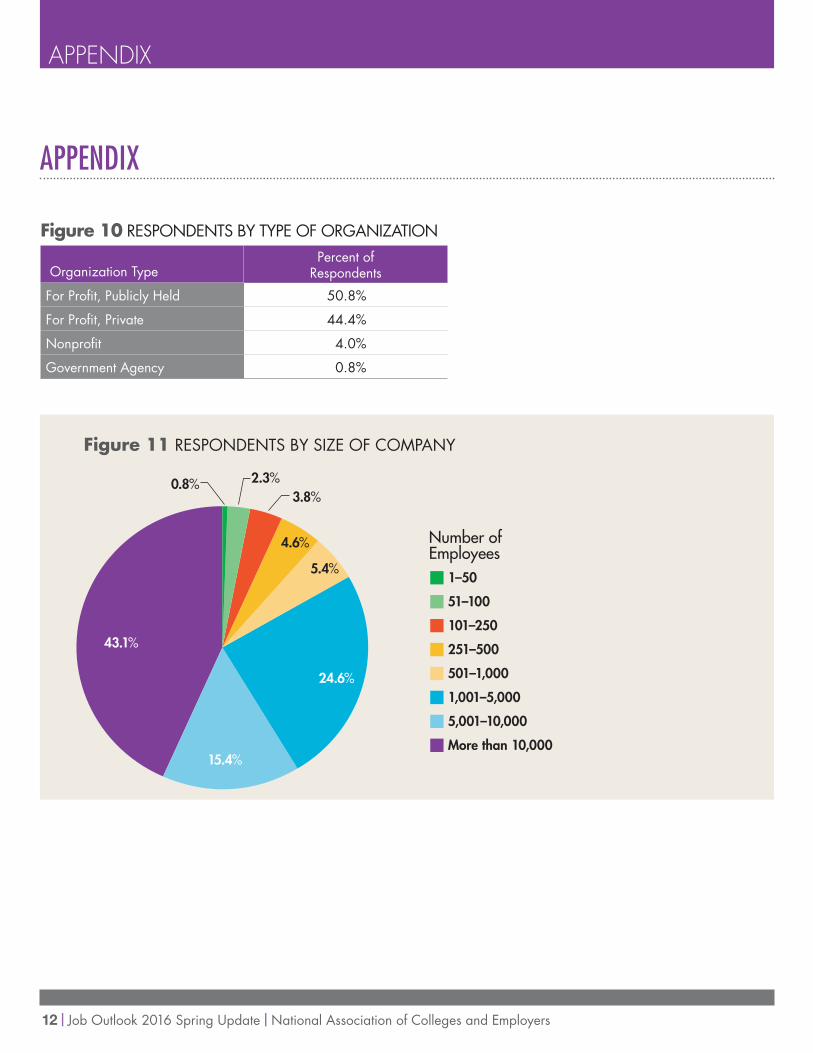
Figure 10 RESPONDENTS BY TYPE OF ORGANIZATION
Organization TypePercent of
Respondents
For Profit, Publicly Held 50.8%
For Profit, Private 44.4%
Nonprofit 4.0%
Government Agency 0.8%
1–50
51–100
101–250
251–500
501–1,000
1,001–5,000
5,001–10,000
More than 10,000
Figure 11 RESPONDENTS BY SIZE OF COMPANY
Number ofEmployees
43.1%
15.4%
24.6%
5.4%
4.6%
3.8%2.3%0.8%

National Association of Colleges and Employers | Job Outlook 2016 Spring Update | 13
APPENDIX
Figure 12 RESPONDENTS BY INDUSTRY
IndustryNumber of
RespondentsPercent of
Respondents
Oil & Gas Extraction 4 2.8%
Utilities 6 4.2%
Construction 7 4.9%
Food & Beverage Manufacturing 4 2.8%
Chemical (Pharmaceutical) Manufacturing 11 7.6%
Computer & Electronics Manufacturing 7 4.9%
Motor Vehicle Manufacturing 7 4.9%
Misc. Manufacturing 19 13.2%
Wholesale Trade 3 2.1%
Retail Trade 8 5.6%
Transportation 5 3.5%
Information 3 2.1%
Finance, Insurance, & Real Estate 20 13.9%
Accounting Services 4 2.8%
Engineering Services 6 4.2%
Management Consulting 5 3.5%
Misc. Prof. Services 11 7.6%
Social Services 9 6.3%
Recreation & Hospitality 1 0.7%
Misc. Support Services 3 2.1%
Government 1 0.7%
Total 144 100.0%

SURVEY RESPONDENTS
SURVEY RESPONDENTS
The following organizations took part in the NACE Job Outlook 2016 Spring Update survey. (Note: Although 144 organizations responded, the list below includes 98, as 46 organizations preferred not to be listed.)
ABB Inc.
AeroVironment
Air Products & Chemicals Inc.
Alcatel-Lucent
ALCOA Inc.
American Axle & Manufacturing Holdings, Inc.
ARAMARK
Ascend Performance Materials
Asurion Corporation
Baker Tilly Virchow Krause
Brady Corp.
Briggs & Stratton Corporation
Burlington Stores
Burns & McDonnell Engineering Co. Inc.
California State Auditor
Cambridge Associates LLC
Cardinal Health
Carrollton-Farmers Branch ISD
Caterpillar Inc.
CGI Federal
ConAgra Foods, Inc.
ConocoPhillips Company
Dick’s Sporting Goods
Discover Financial Services
Doeren Mayhew
Duff & Phelps LLC
Duke Energy Corporation
E. & J. Gallo Winery
Ecolab Inc.
Edward Jones
Elizabeth City Pasquotank Public Schools
Emerson Climate Technologies
ENERCON Services, Inc.
Entergy Services, Inc.
Equinix
Excella Consulting
ExxonMobil Corporation
FirstBank Holding Co.
Fluor Corporation - Global Recruiting
Govig & Associates, INC - GovigU
Great Lakes Dredge & Dock Company
GROWMARK, Inc.
HNTB Companies
Imagine Leadership Academy
Infineum USA L.P.
International SOS Assistance Inc.
Intuit Inc.
Johnson & Johnson
kCura
Kearney & Company
Kiewit Energy Group
KPMG LLP
Lake Shore Cryotronics, Inc.
LB White Co.
Liberty Mutual Insurance Company
Macy’s, Inc.
Mars, Incorporated
MAVERICK Technologies
Medical Mutual of Ohio
Meijer, Inc.
MetroStar Systems
Modern Woodmen of America
Olin Chlor Alkali Products
Orange County Schools
Owens Corning
Pacific Gas and Electric Company
Parsons Corporation
Performance Assessment Network (PAN)
Polaris Industries, Inc.
Principal Financial Group
Protiviti Inc.
PVH
Questar Corporation
Rockwell Collins
Rosetta
Roux Associates, Inc.
Rural Sourcing Inc.
SapientNitro
Seagate Technology
Sears Holdings Corporation
Selden Fox LTD
Shaw Industries, Inc.
South Jersey Industries
Southern California Edison
Spectra Energy Corp.
SRC, Inc.
SUN Automation Inc.
Teradata Corporation
The Lane Construction Corporation
The Nielsen Company
The Northern Trust Company
The Vanguard Group
TIBCO Software Inc.
Toys “R” Us, Inc.
Turner Construction Company
Union Pacific Railroad Company
UnitedHealth Group
Walgreens
14 | Job Outlook 2016 Spring Update | National Association of Colleges and Employers

62 HIGHLAND AVENUEBETHLEHEM, PA 18017-9085
610.868.1421 | www.naceweb.org
Recommended