
DRAFT ENVIRONMENTAL IMPACT STATEMENT
APPENDIX H PRELIMINARY DRAINAGE REPORT
Na Pua Makani Wind Project

PRELIMINARY DRAINAGE REPORT NĀ PUA MAKANI WIND FARM Kahuku, O‘ahu, Hawai‘i Tax Map Keys: 5-6-006:018,047,051,055; 5-6-005:018, 5-6-008:006
December 2014 Prepared for: Champlin Hawai‘i Wind Holdings LLC 2020 Alameda Padre Serra, Suite 123 Santa Barbara, CA 93102 Prepared by: BELT COLLINS HAWAII LLC 2153 North King Street, Suite 200 Honolulu, Hawai‘i 96819 2014.33.1001

December 2014 Preliminary Drainage Report - Nā Pua Makani Wind Farm 1
1 PROJECT DESCRIPTION 1.1 GENERAL The Nā Pua Makani Wind Farm project (Project) is located at the northeast coast of O‘ahu, in Kahuku and Ka‘ena Town, Tax Map Key (TMK) 5-6-006:018,047,051,055; 5-6-005:018, 5-6-008:006. See Figure 1 – Location Map. The 707 acre project area is approximately 9,000 feet inland from the coast on a steep sloping ridge with elevations ranging from 13- to 400-feet above mean sea level. Three alternatives evaluated in the Project EIS: Alternative 1 – No Action, Alternative 2 – Proposed Action Wind Project of up to 10 turbines (up to approximately 25 megawatts (MW)) and Alternative 3 – Larger Generation Wind Project of up to 12 turbines (up to 42-MW). Under Alternative 1, there will be no new construction of wind turbines, meteorological towers, supporting structures, and access roadways. Thus, the main focus of this report will only discuss Alternative 2 and 3. Alternative 2 entails the construction and operation of an approximately 25 MW wind generation facility, consisting of 8 to 10 wind turbines, meteorological tower, operations and maintenance facility, electrical collections system, transmission line, and 16-foot- wide internal access roads using compacted gravel. Alternative 3 entails the construction and operation of an approximately 42 MW wind generation facility, consisting of up to 12 wind turbines, meteorological tower, operations and maintenance facility, electrical collections system, transmission line, and 16-foot-wide access roads using compacted gravel. 1.2 EXISTING DRAINAGE The developed portions of the project area consist mostly of agricultural and vegetated fields. Runoff generated onsite and offsite is routed through three gulches located in the project site. Farthest north of the project site is ‘Ōhi‘a‘ai Gulch, Kea‘aulu Gulch is located in the middle of the project site, and Lamaloa Gulch is to the south of the project site. Runoff from the three gulches discharges into Mālaekahana Stream or its tributaries just upstream of Kamehameha Highway which discharges directly to the Pacific Ocean.
2 REGULATORY REQUIREMENTS 2.1 CITY AND COUNTY OF HONOLULU (CCH) STORM DRAINAGE
STANDARDS The City and County of Honolulu Rules Relating to Storm Drainage Standards requires developments to manage storm water runoff such that there is no adverse impact to downstream properties, typically resulting from an increase in storm water runoff or a change in drainage patterns. On-site disposal or retention of the net increase in storm water runoff is proposed to mitigate any adverse downstream impact.

December 2014 Preliminary Drainage Report - Nā Pua Makani Wind Farm 2
2.2 FLOOD HAZARD AREA According to the Federal Emergency Management Agency (FEMA) Flood Insurance Rate Map (FIRM Panel 15003C0045G, effective date January 19, 2011), a portion of the project site is located within Zone AE, or areas where base flood elevations (BFEs) are determined; Zone A, or areas where no BFE is determined; Zone X, or areas determined to be outside of the 0.2% annual chance floodplain; and Zone D, or unstudied areas where flood hazards are undetermined but flooding is possible. See Figure 2 – Flood Zones. The AEF zone immediately adjacent to Kamehameha Highway is designated as a floodway. Chapter 21-9.10-5 of the Revised Ordinances of Honolulu prohibits encroachments, including fill, new construction, substantial improvements, and other development within the adopted regulatory floodway unless it has been demonstrated through hydrological and hydraulic analyses that such encroachments would not result in any increased flood levels within the community during the occurrence of the base flood discharge. 3 ANALYSIS AND RESULTS The approximate total area of proposed roadways, wind turbines, and structures is 8.9 acres and 10.4 acres for Alternative 2 and 3, respectively. The net change in runoff is computed using the rational method and the 10 year design storm. The on-site retention volume is computed using the modified rational method and the 50 year design storm. The design storm durations are equal to the time of concentration. The runoff rate from the area to be occupied by the proposed improvements is computed for the existing and developed conditions and the net increase determined. Under the 10 year design storm, the net increase in storm water runoff is 7.1 cfs and 8.2 cfs for Alternative 2 and 3, respectively. See Appendix A for computations. To mitigate any adverse downstream impact, the project will need to either dispose or store the net increase in runoff on-site. The criteria for disposal is a 10 year design storm and is limited to the installation of seepage pits or drywells. Additional subsurface investigation is needed to characterize the disposal rate of the project area. The alternative is to retain the runoff on-site using open detention areas or subsurface storage. The required storage volume, determined using the 50 year design storm, is 2.0 ac-ft and 2.4 ac-ft for Alternative 2 and 3, respectively, which may be provided in one or several distributed locations. The design of the on-site disposal or storage facilities would be developed in conjunction with preparation of detailed construction plans.

December 2014 Preliminary Drainage Report - Nā Pua Makani Wind Farm 3
4 CONCLUSION No adverse impacts to neighboring properties are expected. The net increase in runoff due to the proposed improvements will be mitigated through the use of on-site disposal and/or on-site detention. Drainage drywells or seepage pits may be used to dispose of the net increase in storm water runoff. Alternatively, the net increase in storm water runoff may be stored on-site using retention basins. The use of on-site disposal and retention, individually or in combination, will address the net increase in storm water runoff. Improvements within the floodway are limited to surface pavements and underground power transmission lines. The conveyance capacity of the floodway is not expected to change as a result of these improvements, consequently, no rise in the BFE is expected. 5 REFERENCES • Flood Insurance Study, Volume 1 and 2, City and County of Honolulu, Hawai‘i, Federal Emergency Management Agency, Revised November 26, 2010. • Flood Insurance Rate Map, Map Number 15003C0045G, Federal Emergency Management Agency, Map Revised January 19, 2011. • NOAA Atlas 14, Precipitation-Frequency Atlas of the United States, Volume 4 Version 3: Hawaiian Islands, U.S. Department of Commerce, National Oceanic and Atmospheric Administration, National Weather Service, Revised 2011.
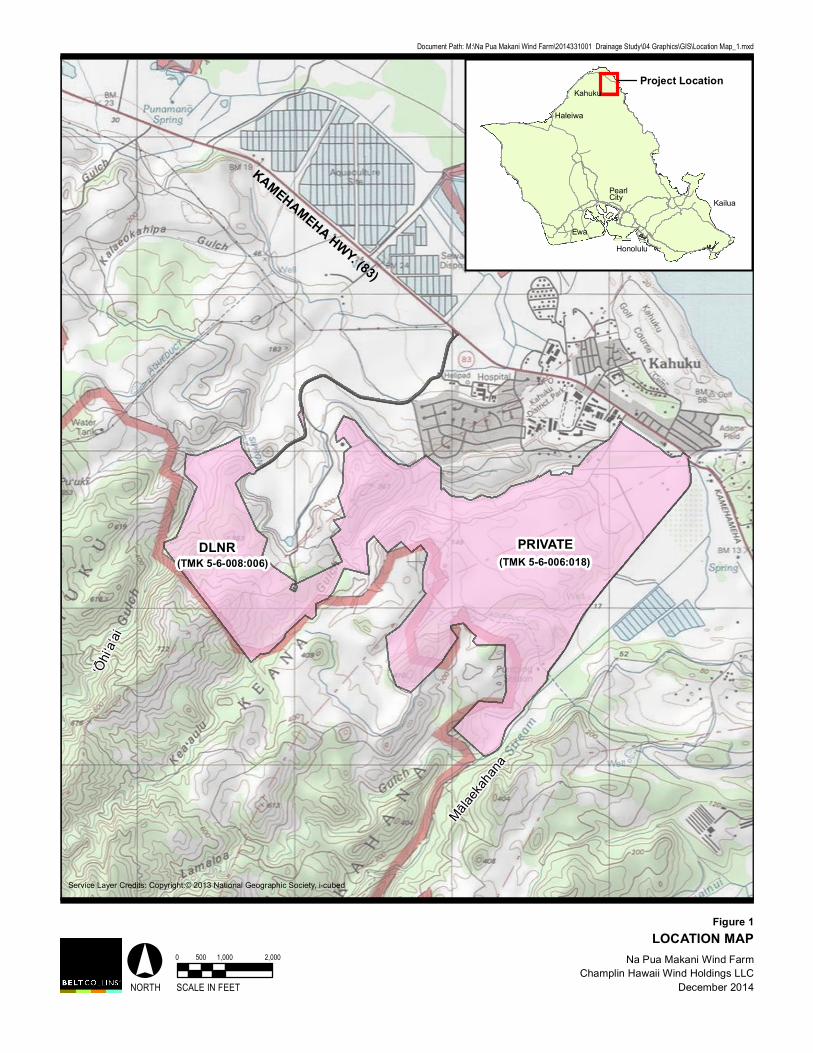
Figure 1
Na Pua Makani Wind FarmChamplin Hawaii Wind Holdings LLC
December 2014NORTH SCALE IN FEET° 0 1,000 2,000500
LOCATION MAP
Document Path: M:\Na Pua Makani Wind Farm\2014331001 Drainage Study\04 Graphics\GIS\Location Map_1.mxd
DLNR(TMK 5-6-008:006)
PRIVATE(TMK 5-6-006:018)
Project LocationKahuku
Honolulu
Kailua
Ewa
PearlCity
KAMEHAMEHA HWY. (83)
Service Layer Credits: Copyright:© 2013 National Geographic Society, i-cubed
Haleiwa‘Ōh
i‘a‘ai
Mā laeka
hana

!!
!!
! !
!
!
!
!
!
!
X
X
X
X
AEF
AE
X
AEF
AE
AEFA
AE
AE
VE
A
AE
AEF
AE AEAEF
AE
AE
A
X
A
XS
XSXS
XS
AEF
XX
XS
AAE
AE
XS
X
AE
A
AE
AE
VE
AE
AE AE
AEF
AE
VE
A
VE
XS
XS
XS
XS
XS
XS
!
Figure 2
Nā Pua Makani W ind FarmCham plin Hawaii W ind Ho ldings LLC
Decem ber 2014NORTH SCALE IN FEET° 0 1,000 2,000500
FLOOD ZONES
Document Path: M:\Na Pua Makani Wind Farm\2014331001 Drainage Study\04 Graphics\GIS\2014331001_004 Flood Zones.mxd
KAMEHAMEHA HWY.
Service Layer Credits: So urces: Esri, HERE, DeLo rm e, To m To m , Interm ap,increm ent P Co rp., GEBCO, USGS, FAO, NPS, NRCAN, Geo Base, IGN,Kadaster NL, Ordnance Survey, Esri Japan, METI, Esri China (Ho ng Ko ng),swissto po , Mapm yIndia, © OpenStreetMap co ntributo rs, and the GIS UserCo m m unity
LEGEND
Alt. 2 W ind TurbinesAlt. 3 Additio nal W ind Turbines
! Meteo ro lo gical To wer
Alt. 2 Undergro und Co llecto r Line
Baseyard Facilities
Existing Public Ro adway
! ! Transm issio n LineTMK ParcelPro ject Bo undary
Alt. 3 Access Ro ad
Alt. 3 Undergro und Co llecto r Line
! ! ! ! ! ! ! !
Alt. 2 Access Ro ad

Figure 3
Nā Pua Makan i W in d FarmCham plin Haw aii W in d Holdin g s LLC
Decem ber 2014NORTH SCALE IN FEET° 0 1,000 2,000500
TIME OF CONCENTRATION
Document Path: M:\Na Pua Makani Wind Farm\2014331001 Drainage Study\04 Graphics\GIS\2014331001_005 Time of Concentration.mxd
KAMEHAMEHA HWY.
Elev.= 15'
Service Layer Credits: Copyrig ht:© 2013 Nation al Geog raphic Society, i-cubed
Elev.= 300'
LEGEND
Project Boun dary
Alt. 3 Addition al W in d Turbin esAlt. 2 W in d Turbin es
Meteorolog ical Tow er
Baseyard Facilities
Existin g Public Roadw ay
Alt. 2 Un derg roun d Collection Lin e
Len g th of Hydraulic Run , L=13,659'
! ! ! ! ! ! ! !
Alt. 3 Un derg roun d Collection Lin e
! ! Tran sm ission Lin e
Alt. 2 Access RoadAlt. 3 Access Road
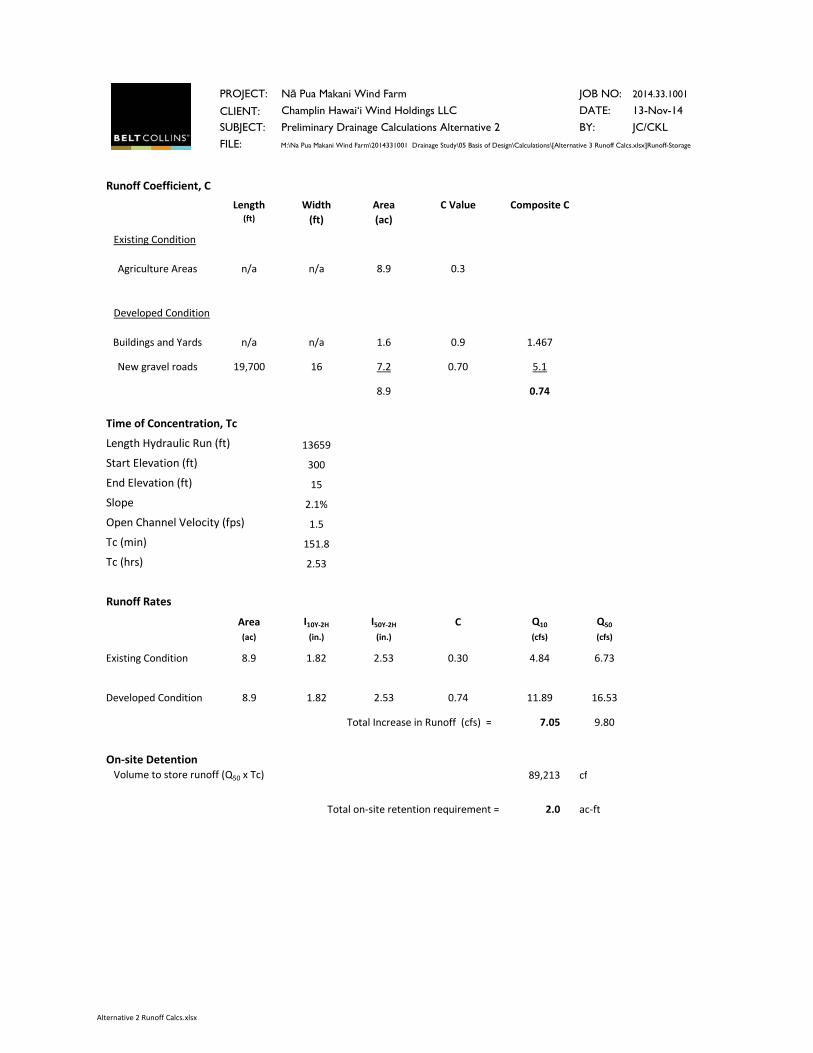
PROJECT: Nā Pua Makani Wind Farm JOB NO: 2014.33.1001
CLIENT: Champlin Hawai‘i Wind Holdings LLC DATE: 13-Nov-14SUBJECT: Preliminary Drainage Calculations Alternative 2 BY: JC/CKLFILE: M:\Na Pua Makani Wind Farm\2014331001 Drainage Study\05 Basis of Design\Calculations\[Alternative 3 Runoff Calcs.xlsx]Runoff-Storage
Runoff Coefficient, CLength Width Area C Value Composite C
(ft) (ft) (ac)
Existing Condition
Agriculture Areas n/a n/a 8.9 0.3
Developed Condition
Buildings and Yards n/a n/a 1.6 0.9 1.467
New gravel roads 19,700 16 7.2 0.70 5.1
8.9 0.74
Time of Concentration, Tc
Length Hydraulic Run (ft) 13659
Start Elevation (ft) 300
End Elevation (ft) 15
Slope 2.1%
Open Channel Velocity (fps) 1.5
Tc (min) 151.8
Tc (hrs) 2 53Tc (hrs) 2.53
Runoff Rates
Area I10Y-2H I50Y-2H C Q10 Q50
(ac) (in.) (in.) (cfs) (cfs)
Existing Condition 8.9 1.82 2.53 0.30 4.84 6.73
Developed Condition 8.9 1.82 2.53 0.74 11.89 16.53
Total Increase in Runoff (cfs) = 7.05 9.80
On-site DetentionVolume to store runoff (Q50 x Tc) 89,213 cf
Total on-site retention requirement = 2.0 ac-ft
Alternative 2 Runoff Calcs.xlsx

PROJECT: Nā Pua Makani Wind Farm JOB NO: 2014.33.1001
CLIENT: Champlin Hawai‘i Wind Holdings LLC DATE: 13-Nov-14SUBJECT: Preliminary Drainage Calculations Alternative 3 BY: JC/CKLFILE: M:\Na Pua Makani Wind Farm\2014331001 Drainage Study\05 Basis of Design\Calculations\[Alternative 2 Runoff Calcs.xlsx]Runoff-Storage
Runoff Coefficient, CLength Width Area C Value Composite C
(ft) (ft) (ac)
Existing Condition
Agriculture Areas n/a n/a 10.4 0.3
Developed Condition
Buildings and Yards n/a n/a 1.8 0.9 1.584
New gravel roads 23,400 16 8.6 0.70 6.0
10.4 0.73
Time of Concentration, Tc
Length Hydraulic Run (ft) 13659
Start Elevation (ft) 300
End Elevation (ft) 15
Slope 2.1%
Open Channel Velocity (fps) 1.5
Tc (min) 151.8
Tc (hrs) 2 53Tc (hrs) 2.53
Runoff Rates
Area I10Y-2H I50Y-2H C Q10 Q50
(ac) (in.) (in.) (cfs) (cfs)
Existing Condition 10.4 1.82 2.53 0.30 5.65 7.86
Developed Condition 10.4 1.82 2.53 0.73 13.83 19.23
Total Increase in Runoff (cfs) = 8.2 11.37
On-site DetentionVolume to store runoff (Q50 x Tc) 103,534 cf
Total on-site retention requirement = 2.4 ac-ft
Alternative 3 Runoff Calcs.xlsx

5/7/2014 Precipitation Frequency Data Server
http://hdsc.nws.noaa.gov/hdsc/pfds/pfds_printpage.html?lat=21.6722&lon=-157.9518&data=intensity&units=english&series=pds#table 1/4
NOAA Atlas 14, Volume 4, Version 3 Location name: Hauula, Hawaii, US*
Latitude: 21.6722°, Longitude: -157.9518° Elevation: 118 ft** source: Google Maps
POINT PRECIPITATION FREQUENCY ESTIMATES
S. Perica, D. Martin, B. Lin, T. Parzybok, D. Riley, M. Yekta, L. Hiner, L.-C. Chen, D. Brewer, F.
Yan, K. Maitaria, C. Trypaluk, G. M. Bonnin
NOAA, National Weather Service, Silver Spring, Maryland
PF_tabular | PF_graphical | Maps_&_aerials
PF tabular
PDS-based point precipitation frequency estimates with 90% confidence intervals (in inches/hour)1
DurationAverage recurrence interval (years)
1 2 5 10 25 50 100 200 500 1000
5-min4.44
(3.89‑5.10)
5.82(5.02‑6.78)
7.62(6.53‑8.90)
9.04(7.66‑10.6)
11.0(9.16‑13.0)
12.5(10.3‑15.0)
14.0(11.3‑17.0)
15.6(12.3‑19.1)
17.8(13.5‑22.1)
19.6(14.4‑24.6)
10-min3.29
(2.88‑3.78)
4.31(3.72‑5.02)
5.65(4.84‑6.60)
6.70(5.68‑7.87)
8.14(6.79‑9.65)
9.26(7.61‑11.1)
10.4(8.39‑12.6)
11.6(9.13‑14.2)
13.2(10.0‑16.4)
14.5(10.6‑18.3)
15-min2.76
(2.41‑3.16)
3.61(3.11‑4.20)
4.73(4.05‑5.52)
5.61(4.75‑6.58)
6.82(5.68‑8.08)
7.76(6.37‑9.28)
8.72(7.02‑10.5)
9.71(7.64‑11.9)
11.1(8.39‑13.7)
12.1(8.90‑15.3)
30-min1.94
(1.70‑2.23)
2.54(2.19‑2.96)
3.33(2.85‑3.89)
3.95(3.34‑4.63)
4.80(4.00‑5.69)
5.46(4.48‑6.53)
6.13(4.94‑7.41)
6.84(5.38‑8.34)
7.79(5.90‑9.67)
8.55(6.27‑10.8)
60-min1.28
(1.12‑1.47)
1.67(1.44‑1.95)
2.19(1.88‑2.56)
2.60(2.20‑3.05)
3.15(2.63‑3.74)
3.59(2.95‑4.30)
4.04(3.25‑4.87)
4.50(3.54‑5.49)
5.12(3.88‑6.36)
5.62(4.12‑7.08)
2-hr0.878
(0.755‑1.00)
1.16(1.00‑1.35)
1.53(1.31‑1.79)
1.82(1.55‑2.14)
2.22(1.85‑2.63)
2.53(2.08‑3.02)
2.84(2.29‑3.43)
3.17(2.49‑3.87)
3.61(2.74‑4.48)
3.96(2.90‑4.98)
3-hr0.663
(0.569‑0.761)
0.890(0.768‑1.03)
1.18(1.01‑1.38)
1.40(1.20‑1.65)
1.71(1.43‑2.03)
1.95(1.61‑2.33)
2.20(1.78‑2.65)
2.46(1.94‑2.99)
2.80(2.13‑3.47)
3.07(2.26‑3.86)
6-hr0.423
(0.361‑0.487)
0.562(0.486‑0.654)
0.752(0.645‑0.879)
0.900(0.765‑1.06)
1.10(0.923‑1.31)
1.26(1.04‑1.51)
1.43(1.15‑1.72)
1.59(1.25‑1.94)
1.82(1.38‑2.26)
2.00(1.47‑2.52)
12-hr0.255
(0.217‑0.295)
0.344(0.297‑0.399)
0.467(0.401‑0.547)
0.564(0.480‑0.664)
0.697(0.583‑0.826)
0.801(0.658‑0.957)
0.906(0.731‑1.09)
1.02(0.800‑1.24)
1.17(0.885‑1.45)
1.28(0.941‑1.62)
24-hr0.148
(0.125‑0.175)
0.206(0.174‑0.243)
0.285(0.240‑0.337)
0.347(0.291‑0.411)
0.431(0.360‑0.514)
0.498(0.413‑0.595)
0.566(0.467‑0.680)
0.637(0.521‑0.771)
0.734(0.592‑0.896)
0.810(0.646‑0.996)
2-day0.088
(0.076‑0.102)
0.121(0.104‑0.140)
0.166(0.142‑0.192)
0.200(0.171‑0.233)
0.248(0.211‑0.290)
0.285(0.241‑0.334)
0.322(0.270‑0.381)
0.361(0.301‑0.429)
0.414(0.341‑0.496)
0.456(0.370‑0.550)
3-day0.066
(0.056‑0.076)
0.089(0.077‑0.104)
0.121(0.104‑0.141)
0.146(0.124‑0.170)
0.179(0.152‑0.210)
0.204(0.172‑0.241)
0.230(0.193‑0.272)
0.257(0.213‑0.305)
0.292(0.239‑0.351)
0.319(0.259‑0.387)
4-day0.054
(0.047‑0.064)
0.074(0.063‑0.086)
0.099(0.084‑0.116)
0.118(0.101‑0.139)
0.144(0.122‑0.170)
0.164(0.138‑0.194)
0.184(0.154‑0.218)
0.204(0.169‑0.244)
0.231(0.189‑0.278)
0.251(0.203‑0.305)
7-day0.036
(0.031‑0.042)
0.048(0.041‑0.056)
0.064(0.055‑0.075)
0.076(0.065‑0.089)
0.092(0.078‑0.108)
0.104(0.088‑0.123)
0.116(0.097‑0.138)
0.128(0.106‑0.153)
0.144(0.118‑0.173)
0.155(0.126‑0.189)
10-day0.028
(0.024‑0.033)
0.038(0.032‑0.044)
0.050(0.043‑0.058)
0.059(0.050‑0.069)
0.071(0.060‑0.083)
0.080(0.067‑0.094)
0.088(0.074‑0.105)
0.097(0.080‑0.115)
0.108(0.089‑0.130)
0.116(0.094‑0.141)
20-day0.019
(0.016‑0.022)
0.025(0.021‑0.029)
0.032(0.028‑0.038)
0.038(0.032‑0.044)
0.045(0.038‑0.053)
0.050(0.042‑0.059)
0.055(0.046‑0.065)
0.059(0.049‑0.071)
0.065(0.054‑0.079)
0.070(0.057‑0.084)
30-day0.015
(0.013‑0.017)
0.019(0.017‑0.023)
0.025(0.022‑0.029)
0.029(0.025‑0.034)
0.035(0.029‑0.041)
0.038(0.032‑0.045)
0.042(0.035‑0.050)
0.046(0.038‑0.054)
0.050(0.041‑0.060)
0.053(0.043‑0.064)
45-day0.012
(0.010‑0.014)
0.015(0.013‑0.018)
0.020(0.017‑0.023)
0.023(0.020‑0.027)
0.027(0.023‑0.032)
0.030(0.026‑0.036)
0.033(0.028‑0.039)
0.036(0.030‑0.043)
0.039(0.032‑0.047)
0.042(0.034‑0.051)
60-day0.010
(0.009‑0.012)
0.013(0.011‑0.015)
0.017(0.014‑0.020)
0.020(0.017‑0.023)
0.023(0.019‑0.027)
0.025(0.021‑0.030)
0.028(0.023‑0.033)
0.030(0.025‑0.035)
0.032(0.027‑0.039)
0.034(0.028‑0.042)
1 Precipitation frequency (PF) estimates in this table are based on frequency analysis of partial duration series (PDS).
Numbers in parenthesis are PF estimates at low er and upper bounds of the 90% confidence interval. The probability that precipitation frequency estimates (for
a given duration and average recurrence interval) w ill be greater than the upper bound (or less than the low er bound) is 5%. Estimates at upper bounds are not
checked against probable maximum precipitation (PMP) estimates and may be higher than currently valid PMP values.
Please refer to NOAA Atlas 14 document for more information.
Back to Top
PF graphical
Recommended