Appendix E –Benefit Cost Analysis
Upper Midwest Transportation Hub
Iowa Department of Transportation

IOWA DEPARTMENT OF TRANSPORTATION
UPPER MIDWEST TRANSPORTATION HUB AT MANLY, IOWA TIGER DISCRETIONARY GRANTS PROGRAM
ECONOMIC ANALYSIS SUPPLEMENTARY DOCUMENTATIONAPRIL 22, 2014

Page | 1
TABLE OF CONTENTS
1. EXECUTIVE SUMMARY ........................................................................................................................... 3 2. INTRODUCTION .................................................................................................................................... 7 3. METHODOLOGICAL FRAMEWORK ............................................................................................................ 7 4. PROJECT OVERVIEW .............................................................................................................................. 8
4.1 Base Case, Build Case and Alternative .................................................................................. 10 4.2 Project Cost and Schedule ..................................................................................................... 10 4.3 Effects on Long-Term Outcomes ........................................................................................... 10
5. GENERAL ASSUMPTIONS ...................................................................................................................... 13 6. DEMAND PROJECTIONS ....................................................................................................................... 14
6.1 Methodology ......................................................................................................................... 14 6.2 Assumptions .......................................................................................................................... 15 6.3 Demand Projections .............................................................................................................. 15
7. BENEFITS MEASUREMENT, DATA AND ASSUMPTIONS ............................................................................... 16 7.1 State of Good Repair ............................................................................................................. 16 7.2 Economic Competitiveness .................................................................................................... 18 7.3 Quality of Life ........................................................................................................................ 26 7.4 Environmental Sustainability................................................................................................. 28 7.5 Safety ..................................................................................................................................... 35
8. SUMMARY OF FINDINGS AND BCA OUTCOMES ....................................................................................... 38 9. BCA SENSITIVITY/ALTERNATIVE ANALYSIS .............................................................................................. 38 10. SUPPLEMENTARY DATA TABLES ........................................................................................................ 39
10.1 Annual Estimates of Total Project Benefits and Costs ........................................................... 40 10.2 Annual Demand Projections .................................................................................................. 41 10.3 Benefit Estimates – Undiscounted Values ............................................................................. 42 10.4 Benefit Estimates – Discounted Values (at 7 Percent) .......................................................... 43
Page | 2
LIST OF TABLES
Table 1: Expected Effects on Long-Term Outcomes and Benefit Categories ............................................ 13 Table 2: Demand Input Assumptions ......................................................................................................... 15 Table 3: Projections of Truck Miles Saved ................................................................................................. 16 Table 4: Assumptions used in the Estimation of State-of-Good-Repair Benefits ...................................... 17 Table 5: Estimates of State-of-Good-Repair Benefits, Millions of 2013$ .................................................. 18 Table 6: Assumptions used in the Estimation of Transportation Cost Savings .......................................... 20 Table 7: Estimates of Transportation Cost Savings, Millions of 2013$ ...................................................... 22 Table 8: Project Spending and Economic Impacts (Direct, Indirect and Induced) during Project Development Phase .................................................................................................................................... 23 Table 9: Project Spending and Job-Year Estimates with IMPLAN and CEA Methodologies ...................... 23 Table 10: Project Spending and Short-Term Economic Impacts by Quarter ............................................. 24 Table 11: Short-Term Impacts in Key Industries Employing Low-Income People ..................................... 24 Table 12: Economic Impacts of the UMTH Project, Annual for Selected Years .......................................... 25 Table 13: Economic Impacts of Capital Expenditures Related to Ancillary Operations.............................. 26 Table 14: Economic Impacts of Operations and Maintenance Expenditures Related to Ancillary Operations .................................................................................................................................................. 26 Table 15: Assumptions used in the Estimation of Livability Benefits ........................................................ 27 Table 16: Estimates of Quality of Life Benefits, Millions of 2013$ ............................................................ 28 Table 17: Assumptions used in the Estimation of Environmental Sustainability Benefits ........................ 29 Table 18: Estimates of Environmental Sustainability Benefits, Millions of 2013$..................................... 35 Table 19: Assumptions used in the Estimation of Safety Benefits ............................................................. 37 Table 20: Estimates of Safety Benefits, 2013$ ........................................................................................... 37 Table 21: Overall Results of the Benefit Cost Analysis, Millions of 2013$* ............................................... 38 Table 22: Benefit Estimates by Long-Term Outcome for the Full Project, Millions of 2013$ ................... 38 Table 23: Quantitative Assessment of Sensitivity, Summary..................................................................... 39

Page | 3
1. Executive Summary This TIGER Grant application is for infrastructure construction for the Upper Midwest Transportation Hub (UMTH) Project at Manly, Iowa. It consists primarily of the intermodal portion of the UMTH Project that will provide the infrastructure for staging, transloading containers (“container stuffing”), and loading/unloading of domestic and international shipping trailers and containers. The development will serve an approximately 150 mile radius encompassing north central Iowa, southern Minnesota, and a portion of western Wisconsin where little useful intermodal service is currently available. Manly, Iowa, is currently the home of an approximately 350 acre campus that already serves as a major transportation hub. The long term potential for continued growth of this transportation hub is considerable. The site currently includes a major rail support and classification yard, a grain terminal, a large liquid transload facility with over 5 million gallon storage tanks, and capacity for a multitude of both inbound and outbound products. Expansion of the liquid infrastructure is already underway, and ground has been broken for a large steel distribution facility. A nearly 15,000 foot single track loop is complete on the 160 acre UMTH-North parcel. Two major portions of the UMTH project remain; namely 1) UMTH-North – construction of infrastructure for a full service intermodal facility and; 2)UMTH-South - construction of infrastructure that will provide an interim intermodal facility and rail yard support for transloading highway trailers and shipping containers, The project planned for this TIGER Grant is all contained within the existing transportation campus. The project will provide significant benefits to the region, state, and nation through:
1) improving freight rail efficiency and capacity, 2) diverting existing freight from truck to rail, 3) reducing truck miles traveled, 4) reducing highway maintenance costs, 5) reducing transportation costs, 6) reducing congestion costs, 7) reducing transportation costs, 8) reducing accident costs (fatalities and injuries), and 9) job creation.
The overall project is designed to provide an independent, high service and lower cost package of rail, truck and intermodal logistics for Iowa and Minnesota manufacturers, producers and consumers, with the particular portion of the project directly providing lower cost access to domestic and international intermodal service to a large and growing number of shippers/receivers that do not currently have such cost-competitive access. This project will result in reducing the time, distance and related costs for shippers and receivers in the region to access the national and international intermodal network. That will allow existing and potential shippers, receivers and consumers in this region a more equal and competitive access to the world marketplace.

Page | 4
A table summarizing the changes expected from the project (and the associated benefits) is provided below.
Table ES-1: Summary of Infrastructure Improvements and Associated Benefits
Current Status or Baseline &
Problems to be Addressed
Changes to Baseline / Alternative
Type of Impacts Population Affected by
Impacts Benefits
Summary Page
of Results #
($2013, 7% Discounted,
Millions)
The region served by the UMTH suffers from a serious lack of nearby intermodal infrastructure and service. There also exists a severe container imbalance situation from too little inbound containers, causing high dray costs. Declining truckload capacity and increasing costs has become a concern. Also, no direct, competitive, time sensitive intermodal service to US Eastern Seaboard, Texas-Mexico and California exists in this region.
Improvements to the UMTH include completing the construction of the UMTH-North intermodal facility and container yard within the loop track, and providing a second loop track. Construction in the UMTH-South include converting an existing wind component area into a startup intermodal facility and eventual transload and container loading facility,
Reduced Highway Maintenance Costs from truck diversion to rail.
Federal and State
(various) Governments
Monetized Maintenance Costs Savings.
$171.7 15
Reduced Transportation Costs from truck diversion to rail.
Goods Shippers
Monetized Shipping Costs Savings.
$371.5 18
Short-Term Economic Impacts from construction/planning expenditure.
Local Citizens and
Businesses
Job years, income etc.
Pg 22 22
Reduction in Highway Congestion from truck diversion to rail
On Road Motorists
Using Trucking Routes
Monetized Reduced Congestion Costs Savings.
$107.5 26
Reduced Emissions from truck diversion to rail.
Iowa Monetized Reduced Pollution.
$125.5 28
Reduced Accident Costs
On Road Motorists
Using Trucking Routes
Monetized Costs of Change in Injuries and Fatalities.
$490.2 35
The period of analysis used in the estimation of benefits and costs is 22 years, including 2 years of construction and 20 years of operation. The total project capital costs are $23.37 M in nominal terms, and are expected to be financed by Federal (TIGER) and private funds from Iowa Northern Railway Company (IANR); Manly Terminal LLC (MT); and Manly Logistics Park LLC (MLP) according to the distribution shown in Table ES-2 below.
Table ES-2: Summary of Project Costs and Anticipated Funding Sources, 2012$
Funding Source
Capital/Construction Percent of Total Capital Cost Financed by Source
Federal (TIGER) $14,586,397 62.4%
Private (IANR-MT-MLP) $8,780,426 37.6%
TOTAL $23,366,823 100.0%
Page | 5
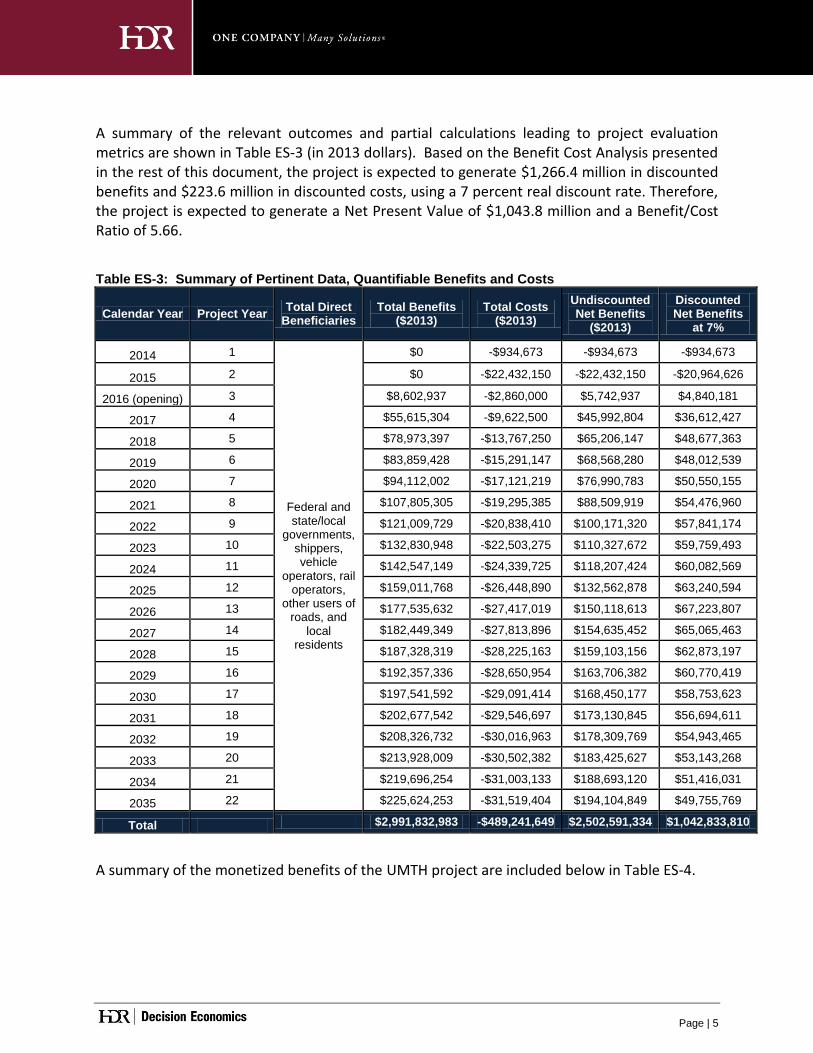
A summary of the relevant outcomes and partial calculations leading to project evaluation metrics are shown in Table ES-3 (in 2013 dollars). Based on the Benefit Cost Analysis presented in the rest of this document, the project is expected to generate $1,266.4 million in discounted benefits and $223.6 million in discounted costs, using a 7 percent real discount rate. Therefore, the project is expected to generate a Net Present Value of $1,043.8 million and a Benefit/Cost Ratio of 5.66.
Table ES-3: Summary of Pertinent Data, Quantifiable Benefits and Costs
Calendar Year Project Year Total Direct
Beneficiaries Total Benefits
($2013) Total Costs
($2013)
Undiscounted Net Benefits
($2013)
Discounted Net Benefits
at 7%
2014 1
Federal and state/local
governments, shippers, vehicle
operators, rail operators,
other users of roads, and
local residents
$0 -$934,673 -$934,673 -$934,673
2015 2 $0 -$22,432,150 -$22,432,150 -$20,964,626
2016 (opening) 3 $8,602,937 -$2,860,000 $5,742,937 $4,840,181
2017 4 $55,615,304 -$9,622,500 $45,992,804 $36,612,427
2018 5 $78,973,397 -$13,767,250 $65,206,147 $48,677,363
2019 6 $83,859,428 -$15,291,147 $68,568,280 $48,012,539
2020 7 $94,112,002 -$17,121,219 $76,990,783 $50,550,155
2021 8 $107,805,305 -$19,295,385 $88,509,919 $54,476,960
2022 9 $121,009,729 -$20,838,410 $100,171,320 $57,841,174
2023 10 $132,830,948 -$22,503,275 $110,327,672 $59,759,493
2024 11 $142,547,149 -$24,339,725 $118,207,424 $60,082,569
2025 12 $159,011,768 -$26,448,890 $132,562,878 $63,240,594
2026 13 $177,535,632 -$27,417,019 $150,118,613 $67,223,807
2027 14 $182,449,349 -$27,813,896 $154,635,452 $65,065,463
2028 15 $187,328,319 -$28,225,163 $159,103,156 $62,873,197
2029 16 $192,357,336 -$28,650,954 $163,706,382 $60,770,419
2030 17 $197,541,592 -$29,091,414 $168,450,177 $58,753,623
2031 18 $202,677,542 -$29,546,697 $173,130,845 $56,694,611
2032 19 $208,326,732 -$30,016,963 $178,309,769 $54,943,465
2033 20 $213,928,009 -$30,502,382 $183,425,627 $53,143,268
2034 21 $219,696,254 -$31,003,133 $188,693,120 $51,416,031
2035 22 $225,624,253 -$31,519,404 $194,104,849 $49,755,769
Total $2,991,832,983 -$489,241,649 $2,502,591,334 $1,042,833,810
A summary of the monetized benefits of the UMTH project are included below in Table ES-4.

Page | 6
Table ES-4: Summary of Monetized Benefits, in Million of 2013$
Long-Term Benefit Categories
7% Discount Rate
3% Discount Rate Outcomes
State of Good Repair Avoided Pavement Maintenance Costs $171.7 $274.7
Economic Competitiveness Shipper Savings due to Modal Switch from Truck to Rail
$371.5 $592.2
Livability Reduced Road Congestion due to Modal Switch from Truck to Rail
$107.5 $172.0
Environmental Sustainability Emission Cost Savings due to Modal Switch from Truck to Rail
$125.5 $128.4
Safety Accident Cost Savings due to Modal Switch from Truck to Rail
$490.2 $823.5
Total Benefit Estimates $1,266.4 $1,990.6
In addition to the monetized benefits presented in Table ES-4, the project would generate benefits that are difficult to quantify. These benefits are discussed in more details in the main part of this application to provide more context and justification for project needs. A brief description of those benefits is provided below. These benefits would be additive to those reported in Table ES-4 and are acknowledged here in qualitative terms.
Induced Regional Benefits to Shippers and Receivers: it is assumed that a proportion of the lifts in the build scenario will represent ‘induced’ shipments. That is to say that some volume of the lift forecast is made up of lifts that are not currently moving in the base case (in addition to existing demand). The presence of the intermodal hub at Manly will create new business opportunities through providing access to markets that were previously not cost effective. As an example, this new origin-destination hub will bring new regional opportunities to local commodity producers or processors. The induced component of the lift forecast has been excluded from the cost-benefit analysis to be conservative. As such, it can be said that induced demand will further improve the Benefit Cost Analysis evaluation metrics, as the corresponding benefits will be achieved within the same capital and operating costs. The effects of one of such opportunities, construction and operation of a cold storage facility, is evaluated here in terms of its economic impacts, i.e. the number of jobs and economic output that it would contribute to the local and national economy.
Container imbalance: Iowa has an imbalance of inbound versus outbound international shipping containers. According to US Census Bureau Data, in 2011 the ratio of the two categories of containers was 1 to 3. This implies a severe shortage of empty containers available to Iowa producers for loading their shipments. Empty containers must be shipped or “drayed” into Iowa to meet demand. This significantly increases the transportation cost. A new, efficient, independent regional intermodal terminal in north central Iowa can draw inbound and outbound container loads from a widespread region including much of Iowa and the southern half of Minnesota alleviating the shortage.
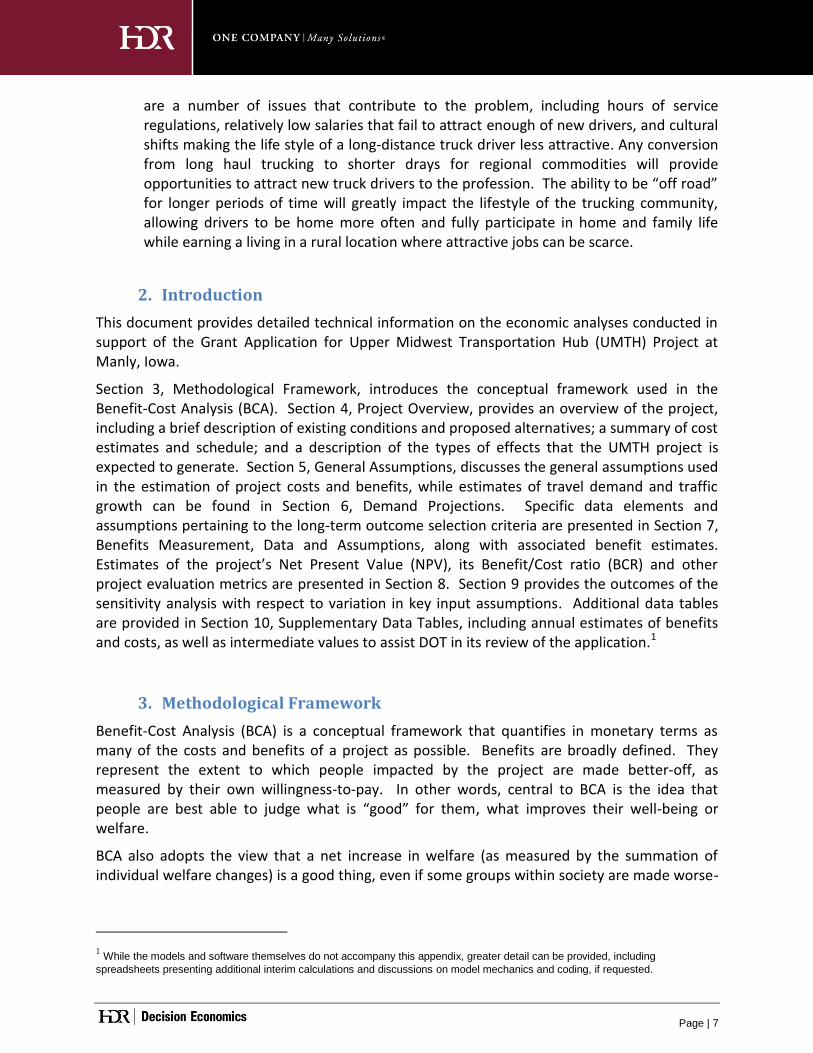
Shortage of truck drivers: The Iowa DOT’s Freight Advisory Council has identified driver shortages as one of the major challenges facing truck freight movement in Iowa. There
Page | 7
are a number of issues that contribute to the problem, including hours of service regulations, relatively low salaries that fail to attract enough of new drivers, and cultural shifts making the life style of a long-distance truck driver less attractive. Any conversion from long haul trucking to shorter drays for regional commodities will provide opportunities to attract new truck drivers to the profession. The ability to be “off road” for longer periods of time will greatly impact the lifestyle of the trucking community, allowing drivers to be home more often and fully participate in home and family life while earning a living in a rural location where attractive jobs can be scarce.
2. Introduction
This document provides detailed technical information on the economic analyses conducted in support of the Grant Application for Upper Midwest Transportation Hub (UMTH) Project at Manly, Iowa.
Section 3, Methodological Framework, introduces the conceptual framework used in the Benefit-Cost Analysis (BCA). Section 4, Project Overview, provides an overview of the project, including a brief description of existing conditions and proposed alternatives; a summary of cost estimates and schedule; and a description of the types of effects that the UMTH project is expected to generate. Section 5, General Assumptions, discusses the general assumptions used in the estimation of project costs and benefits, while estimates of travel demand and traffic growth can be found in Section 6, Demand Projections. Specific data elements and assumptions pertaining to the long-term outcome selection criteria are presented in Section 7, Benefits Measurement, Data and Assumptions, along with associated benefit estimates. Estimates of the project’s Net Present Value (NPV), its Benefit/Cost ratio (BCR) and other project evaluation metrics are presented in Section 8. Section 9 provides the outcomes of the sensitivity analysis with respect to variation in key input assumptions. Additional data tables are provided in Section 10, Supplementary Data Tables, including annual estimates of benefits and costs, as well as intermediate values to assist DOT in its review of the application.1
3. Methodological Framework
Benefit-Cost Analysis (BCA) is a conceptual framework that quantifies in monetary terms as many of the costs and benefits of a project as possible. Benefits are broadly defined. They represent the extent to which people impacted by the project are made better-off, as measured by their own willingness-to-pay. In other words, central to BCA is the idea that people are best able to judge what is “good” for them, what improves their well-being or welfare.
BCA also adopts the view that a net increase in welfare (as measured by the summation of individual welfare changes) is a good thing, even if some groups within society are made worse-
1 While the models and software themselves do not accompany this appendix, greater detail can be provided, including
spreadsheets presenting additional interim calculations and discussions on model mechanics and coding, if requested.

Page | 8
off. A project or proposal would be rated positively if the benefits to some are large enough to compensate the losses of others.
Finally, BCA is typically a forward-looking exercise, seeking to anticipate the welfare impacts of a project or proposal over its entire life-cycle. Future welfare changes are weighted against today’s changes through discounting, which is meant to reflect society’s general preference for the present, as well as broader inter-generational concerns.
The specific methodology developed for this application was developed using the above BCA principles and is consistent with the TIGER guidelines. In particular, the methodology involves:
Establishing existing and future conditions under the build and no-build scenarios;
Assessing benefits with respect to each of the five long-term outcomes identified in the
Notice of Funding Availability (NOFA);
Measuring benefits in dollar terms, whenever possible, and expressing benefits and
costs in a common unit of measurement;
Using DOT guidance for the valuation of travel time savings, safety benefits and
reductions in air emissions, while relying on industry best practice for the valuation of
other effects;
Discounting future benefits and costs with the real discount rates recommended by the
DOT (7 percent, and 3 percent for sensitivity analysis); and
Conducting a sensitivity analysis to assess the impacts of changes in key estimating
assumptions.
4. Project Overview This TIGER Grant application is for infrastructure construction for the Upper Midwest Transportation Hub (UMTH) Project at Manly, Iowa. It consists primarily of the intermodal portion of the UMTH Project that will provide the infrastructure for staging, transloading and loading/unloading domestic and international shipping trailers and containers. The project is being developed by Manly Terminal LLC (MT), Manly Logistics Park, LLC (MLP), and the railroad common carrier, Iowa Northern Railway Company (IANR). The project collectively will be referred to throughout this document as the Upper Midwest Transportation Hub (UMTH). The development will serve an approximately 150 mile radius encompassing north central Iowa, southern Minnesota, and a smaller portion of Wisconsin where little useful intermodal service is currently available. The total UMTH covers approximately 350 acres of specialized transportation infrastructure and is divided into three distinct parts: 1. UMTH – North – 160 acres; 2. UMTH-South – 100 acres, and 3. Manly Yard – 90 acres (No TIGER grant funds are requested for the yard.)
1) UMTH-North: Construction includes completing the UMTH-North intermodal facility and container yard within the existing loop track, and providing a second loop track. Currently under development, the 160 acre industrial development will handle distribution of steel products, various transload components and commodities, and a
Page | 9
large scale intermodal facility and a container/trailer staging and storage yard and an eventual cold and freezer storage warehouse and cross dock. Once the UMTH-North intermodal facility is in service, the smaller initial intermodal facility in UMTH-South will continue in service in specialized container loading (called “container stuffing” in the industry) for food products, manufactured goods, export grain, distiller grains, and edible bean products for export. It is contemplated that this will eventually be recognized as a bonded area for US Customs clearance of imported goods to the region.
2) UMTH-South: Construction in the UMTH-South includes conversion of an existing wind component area into a startup intermodal facility and eventual transload and container stuffing facility. The 100 acre facility built in 2007 includes substantial infrastructure for the storage and transfer of liquid commodities, such as chemicals, fuel and fuel components, feed additives and other liquids used in various manufacturing processes throughout the region, and includes 28 acres designed for the handling of heavy dimensional shipments, particularly wind turbine components and an initial intermodal facility.
3) Manly Yard: The IANR’s 90 acre railroad yard includes 11 classification and switching tracks with adjacent car repair facility, grain staging tracks, engine house, maintenance of way material yard, food grade transload and support tracks and several other customer transload areas, including a new food grade rail-to-truck transfer station. Manly Yard is the critical support yard for IANR interchange with Union Pacific Railroad and to provide track support for the UMTH North and South. (Note that no TIGER grant funds are requested for the Manly Yard.)
Manly, Iowa is currently the home of an approximately 350 acre campus that already serves as a major transportation hub and the long term potential for continued growth of this transportation hub is considerable. The site currently includes a major rail support and classification yard, a grain terminal, a large liquid transload facility with over 5 million gallon storage tanks, and capacity for a multitude of both inbound and outbound products. Expansion of the liquid infrastructure is already underway, and ground has been broken for a large steel distribution facility. A nearly 15,000 foot single track loop is complete on a 160 acre UMTH-North parcel. Two major portions of the UMTH project remain; 1) UMTH-North – construction of infrastructure for a full service intermodal facility and; 2) UMTH-South - construction of infrastructure that will provide an interim intermodal facility and rail yard support for transloading highway trailers and shipping containers, The project planned for this TIGER Grant is all contained within the existing transportation campus. The region served by (UMTH) suffers from a serious lack of nearby intermodal infrastructure and service. There also exists a severe container imbalance situation from too little inbound containers, causing high dray costs. Declining truckload capacity and increasing costs has become a concern. Also, no direct, competitive, time sensitive intermodal service to US Eastern Seaboard, Texas-Mexico and California exists to this region. The project will provide significant benefits to the region, state, and nation through:
1) improving freight rail efficiency and capacity, 2) diverting existing freight from truck to rail,

Page | 10
3) reducing truck miles traveled, 4) reducing highway maintenance costs, 5) reducing transportation costs, 6) reducing congestion costs, 7) reducing transportation costs, 8) reducing accident costs (fatalities and injuries), and 9) job creation.
The overall project is designed to provide an independent, high service and lower cost package of rail, truck and intermodal logistics for Upper Midwest manufacturers, producers and consumers. The project will directly provide lower cost access to domestic and international intermodal service to a large and growing number of shippers/receivers that do not currently have such cost-competitive access. This project will result in reducing the time, distance and related costs for shippers and receivers in the region to access the national and international intermodal network. That will allow existing and potential shippers, receivers and consumers in this region a more equal and competitive access to the world marketplace.
4.1 Base Case, Build Case and Alternative
Base Case (No-Build Case): In the base case, the UMTH project is not undertaken. Shipping is continued via truck and other intermodal facilities farther away.
Build Case: In the build case the UMTH project is undertaken. Trucking traffic and intermodal traffic from less direct routes are diverted to the proposed facility. The benefits of the build case are attributed to the avoidance of truck use as well as use of less direct intermodal routes.
4.2 Project Cost and Schedule
Total costs of the proposed project are estimated at $23,366,823. This figure includes all relevant costs: construction, engineering planning, and equipment. About 4 percent of total costs, or $934,673, is expected to be incurred in 2014. The remainder of the costs, or $22,432,150, would be incurred in 2015.
4.3 Effects on Long-Term Outcomes
Reduction in Highway Maintenance Costs from Displacing Heavy Truck Travel to Rail An avoidance of heavy trucks on the highway system reduces highway maintenance costs and in particular pavement re-surfacing and maintenance costs. Typically, this benefit is realized in terms of increased cycle times between maintenance work orders. This benefit category captures the reduced highway maintenance cost associated with diverting freight shipments from truck to rail.
Reduced Transportation Costs from Diverting Heavy Truck Travel to Rail Rail shipping rates tend to be lower than truck shipping rates on a per ton-mile basis. As such, diversion of highway freight to rail can generate cost savings to shippers. The UMTH project allows shippers a greater choice of transportation mode. Furthermore, these improvements increase schedule reliability, one of the key challenges facing a railroad in terms of product delivery. In the absence of such improvements, some shipments would likely be carried by truck

Page | 11
at a greater cost to producers. The UMTH project will also offer some existing intermodal shippers more direct routes and thus also less costly shipping options. Transportation cost savings are quantified using the calculation of the number of container lifts and shipping costs savings per container. The benefits in this category are counted as public because the difference in transportation prices between rail intermodal and truckload freight accrue directly to the shipper and receiver lowering the final price consumers pay. Shipping costs savings for existing rail users have the potential of spurring dynamic changes in land-use, manufacturing, and industrial re-organization. Research conducted for USDOT/FHWA indicated that reduced shipping costs could enable shifts in mode choice and investments in productivity in the ‘medium term’. In addition, these combined savings could increase further based on industrial re-organization, and the shifting of warehousing or just-in-time manufacturing to realize even lower transportation costs.2 Economists call the difference between the amount people actually pay for something and the amount they would pay for the next most costly alternative, “consumer surplus.” Consumer surplus is a monetary quantity that equates to the economic value (EV) of the reduced costs to mode-shifting shippers in this project and is shown in the figure below. The change in consumer surplus is evaluated using the equation provided below. This equation assumes the “rule-of-half” is being used. The rule of half is a simplification that assumes a linear approximation of the travel demand curve. The rule of half has been used to calculate this benefit category shown diagrammatically in the figure below.
∑ (
)(
) [1]
Where: ∆CS = change in consumer surplus due to rail network improvements t = time period Q = number of containers during time period t P = private cost of shipping (shipping rate) 0,1 = index denoting baseline scenario and improvement scenario respectively
2 (Citation: NCHRP 586. Rail Freight Solutions to Roadway Congestion—Final Report and Guidebook). These
additional costs savings would be realized in the long-run through lower prices for consumers.

Page | 12
Figure 1: Sources of Shipping Benefits
Reduction in Highway Congestion Costs from Displacing Heavy Truck Travel to Rail
The proposed UMTH project will divert freight from road to rail resulting in a reduction in the use of public highways by heavy trucks. This reduces highway traffic volume and thus traffic congestion leading to time savings to the remaining on-road motorists.
Emission Savings from Diverting Heavy Truck Travel to Rail Freight carried over the rail network imposes less environmental impacts for the same amount of cargo than those imposed by trucks on the highway network. This benefit category estimates the value of the reduced environmental emissions associated with transporting goods on rail as opposed to by truck. The reduced amounts of Nitrogen Oxide (NOx), Carbon Dioxide (CO2), Particulate Matter (PM), and Volatile Organic Compounds (VOCs) are calculated and monetized.
Reduced Accident Costs from Diverting Heavy Truck Travel to Rail Fatality and injury rates per ton-mile of freight carried by truck are greater than the fatality and injury rates for an equal volume of cargo when shipped by rail. This benefit captures the different accident rates per truck ton-mile and train ton-mile, and the reduced amounts of injuries and fatalities of truck diversion to rail.
The main benefit categories associated with the project are mapped into the five long-term outcome criteria set forth by the DOT in the table below.
Number of
Containers
Generalized
Shipping Cost
Existing New
P0 without
UMTH
P1 with
UMTHDemand
Benefits to
Existing
Intermodal Benefits to
Diverted Traffic
Diversion

Page | 13
Table 1: Expected Effects on Long-Term Outcomes and Benefit Categories
Impact #
Long-Term Outcomes
Impact Categories
Description Monetized Quantified Qualitative
1 State of Good Repair
Avoided Pavement Maintenance Costs
Modal switch from truck to rail will reduce annual pavement O&M costs per ton-mile
√
2
Economic Competitiveness
Shipper Savings due to Modal Switch from Truck to Rail and Choice of More Direct Intermodal Routes
Modal switch from truck to rail will reduce total shipping costs (due to lower rail shipping rates). In addition, more direct routes from UMTH will offer savings to existing intermodal shippers.
√
3
Short-term economic impacts*
Number of jobs expected to be created by the project, and related income.
√
4
Induced Localized Demand
Intermodal terminal will induce additional businesses to ship who would otherwise not.
√
5
Quality of Life
Reduced Road Congestion due to Modal Switch from Truck to Rail
Modal switch from truck to rail will reduce highway congestion and generate time savings to other motorists.
√
6 Environmental Sustainability
Emission Cost Savings due to Modal Switch from Truck to Rail
Modal switch from truck to rail will reduce the amounts of emissions.
√
7
Safety
Accident Cost Savings due to Modal Switch from Truck to Rail
Modal switch from truck to rail will reduce the number of accidents and corresponding socio-economic costs.
√
5. General Assumptions
The BCA measures benefits against costs throughout a period of analysis beginning at the start of construction (2014) and including 20 years of operations after construction completion in 2015. The benefits start accruing in 2016 after construction is completed.
The monetized benefits and costs are estimated in 2013 dollars with future dollars discounted to 2014 and in compliance with TIGER requirements using a 7 percent real rate, and a rate of 3 percent for sensitivity assessment.
The methodology makes several important assumptions and seeks to avoid overestimation of benefits and underestimation of costs. Specifically:
Input prices are expressed in 2013 dollars;
The period of analysis begins in 2014 and ends in 2035. It includes project development
and construction years (2014 - 2015) and 20 years of operations (2016 - 2035);

Page | 14
A constant 7 percent real discount rate is assumed throughout the period of analysis. A
3 percent real discount rate is used for sensitivity analysis;
Annual demand ramps up conservatively to account for shifting demand forecasts; and
Induced lifts have been estimated and subsequently removed from the annual lift
diversions forecasts so as to be conservative in estimation of project benefits.
6. Demand Projections Accurate demand projections are important to ensure the reasonable BCA output results. The magnitudes of the long-term benefits accruing over the Upper Midwest Transportation Hub study period are a function of the number of existing and projected truck and intermodal trips diverted to rail.
6.1 Methodology The demand projections are based on the number of truck and intermodal trips in the build scenario. One key assumption is the source of the lifts for the intermodal operations. An assumption has been made that 1) existing intermodal moves will be diverted from more distant facilities, like Chicago and 2) there will be a conversion of current truck moves to intermodal as a consequence of the opening of UMTH. A conservative approach has been taken on the truck-miles saved as a consequence of the opening of UMTH, with 1) existing intermodal moves netting a 250 mile savings and 2) conversion from other truck moves netting 750 mile savings (from Origin/Destination sample with rail versus highway mileage to/from Manly, Iowa).3 The demand growth of diverted moves is segmented into lifts attributed to UMTH-South and UMTH-North. Growth estimates are based on engineering estimates and discussions with transportation companies. It should be emphasized that in general the Manly lift forecasts can be considered conservative. Comparing these forecasts (see Table 2 in the next section) with forecasts of truck movements to and from Iowa and Minnesota from FAF 3 database (see Table 2 in the main part of this application), it can be seen that for 2020 the number of lifts assumed for this BCA accounts for less than 1% of total truck movements. The difference in diversion miles from the base case versus the build case is a function of a weighted average between the distance diverted from existing intermodal moves and the conversion from truck moves. The diverted intermodal moves and conversion from truck to intermodal each have an associated distance and a percentage share of the total lifts. The intermodal lift forecasts at this facility were then adjusted through removal of the estimated proportion of induced traffic in those lift estimates. Both the number of lifts and the estimated proportion of induced traffic vary year to year. The annual lift value is then multiplied by the proportion of lifts that are diverted intermodal moves and the proportion that comes from
3 Based on an analysis of specific origin destination pairs using FAF 3 data that could reasonably be diverted to rail
service.

Page | 15
truck to intermodal by the estimated distance per lift saved from diverted intermodal moves and from truck to intermodal diversions to get the total truck miles diverted to rail.
6.2 Assumptions Table 2 below lists the key demand inputs used in the benefit-cost assessment of the UMTH project.
Table 2: Demand Input Assumptions
Year UMTH-
South Lifts
UMTH-North Lifts
UMTH Total Lifts
Percentage of Diverted Intermodal
Moves
Percentage of Moves
Diverted from Truck
Percentage of Induced
Moves
UMTH Lifts Used in in this BCA
2016 10,000 0 10,000 15% 85% 5% 9,500
2017 15,000 60,000 75,000 25% 75% 15% 63,750
2018 25,000 90,000 115,000 30% 70% 20% 92,000
2019 25,625 108,000 133,625 37% 63% 25% 100,219
2020 26,266 129,600 155,866 39% 61% 28% 113,003
2021 26,922 155,520 182,442 40% 60% 29% 129,534
2022 27,595 174,182 201,778 35% 65% 30% 141,244
2023 28,285 195,084 223,369 30% 70% 33% 150,774
2024 28,992 218,494 247,487 30% 70% 35% 160,866
2025 29,717 244,714 274,431 30% 70% 35% 178,380
2026 30,460 274,079 304,539 30% 70% 35% 197,951
2027 31,222 279,561 310,783 30% 70% 35% 202,009
2028 32,002 285,152 317,154 30% 70% 35% 206,150
2029 32,802 290,855 323,657 30% 70% 35% 210,377
2030 33,622 296,672 330,295 30% 70% 35% 214,691
2031 34,463 302,606 337,069 30% 70% 35% 219,095
2032 35,324 308,658 343,982 30% 70% 35% 223,588
2033 36,207 314,831 351,039 30% 70% 35% 228,175
2034 37,113 321,128 358,240 30% 70% 35% 232,856
2035 38,040 327,550 365,591 30% 70% 35% 237,634
6.3 Demand Projections
The resulting projections for the truck miles diverted (based on the savings of 250 miles for intermodal moves and 750 miles for truck moves) are shown in the table below.

Page | 16
Table 3: Projections of Truck Miles Saved
Year of Operation
Truck Miles Saved Per Year, by Year
2016 6,412,500
2017 39,843,750
2018 55,200,000
2019 56,623,594
2020 62,716,431
2021 71,243,705
2022 81,215,533
2023 90,464,645
2024 96,519,828
2025 107,028,041
2026 118,770,386
2027 121,205,191
2028 123,690,177
2029 126,226,384
2030 128,814,876
2031 131,456,737
2032 134,153,074
2033 136,905,018
2034 139,713,723
2035 142,580,367
7. Benefits Measurement, Data and Assumptions
This section describes the measurement approach used for each benefit or impact category identified in Table 1 (Expected Effects on Long Term Outcomes and Benefit Categories) and provides an overview of the associated methodology, assumptions, and estimates.
7.1 State of Good Repair
To quantify the benefits associated with maintaining the existing transportation network in a state of good repair, Reduction in Maintenance Costs from Displacing Heavy Truck Travel to Rail is monetized.
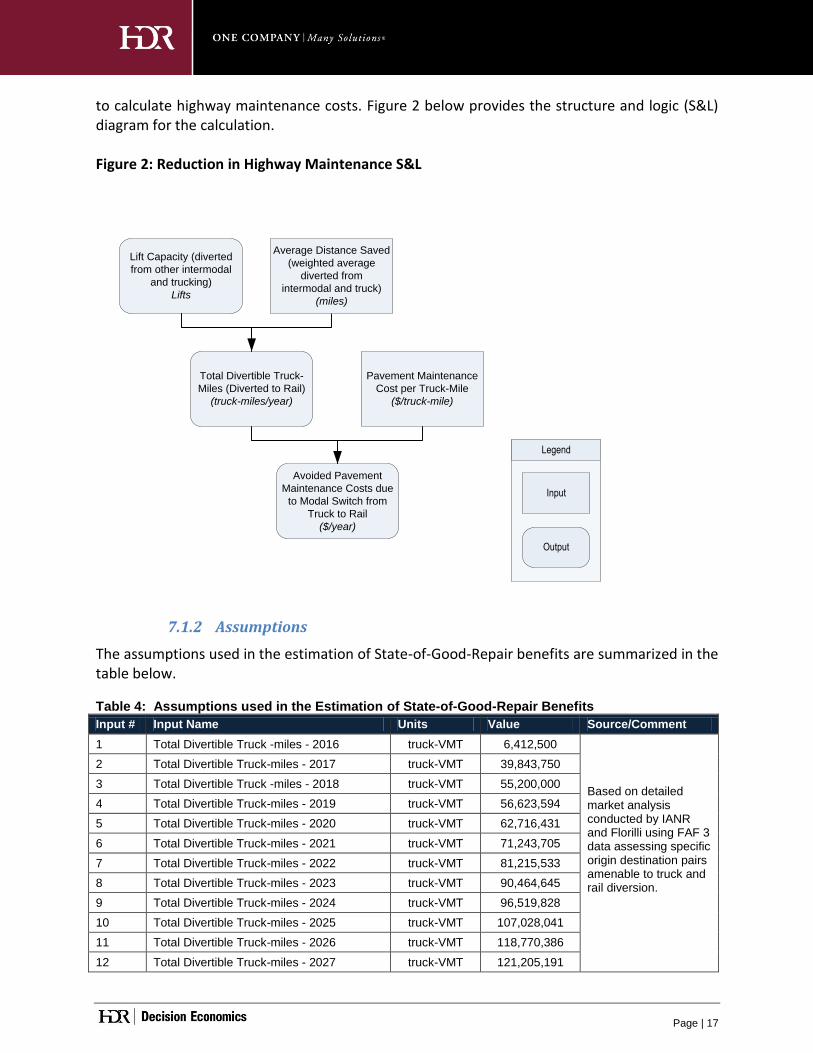
7.1.1 Methodology Reduction in Maintenance Costs from Displacing Heavy Truck Travel to Rail An avoidance of heavy trucks on the highway system reduces highway maintenance costs and in particular pavement re-surfacing and maintenance costs. Typically, this benefit is realized in terms of increased cycle times between maintenance work orders. This benefit category captures the reduced maintenance cost associated with diverting freight shipments from truck to rail. The total diverted truck miles are applied to highway maintenance cost per truck -mile
Page | 17
to calculate highway maintenance costs. Figure 2 below provides the structure and logic (S&L) diagram for the calculation. Figure 2: Reduction in Highway Maintenance S&L
Lift Capacity (diverted
from other intermodal
and trucking)
Lifts
Total Divertible Truck-
Miles (Diverted to Rail)
(truck-miles/year)
Pavement Maintenance
Cost per Truck-Mile
($/truck-mile)
Avoided Pavement
Maintenance Costs due
to Modal Switch from
Truck to Rail
($/year)
Average Distance Saved
(weighted average
diverted from
intermodal and truck)
(miles)
Input
Legend
Output
7.1.2 Assumptions
The assumptions used in the estimation of State-of-Good-Repair benefits are summarized in the table below.
Table 4: Assumptions used in the Estimation of State-of-Good-Repair Benefits
Input # Input Name Units Value Source/Comment
1 Total Divertible Truck -miles - 2016 truck-VMT 6,412,500
Based on detailed market analysis conducted by IANR and Florilli using FAF 3 data assessing specific origin destination pairs amenable to truck and rail diversion.
2 Total Divertible Truck-miles - 2017 truck-VMT 39,843,750
3 Total Divertible Truck -miles - 2018 truck-VMT 55,200,000
4 Total Divertible Truck-miles - 2019 truck-VMT 56,623,594
5 Total Divertible Truck-miles - 2020 truck-VMT 62,716,431
6 Total Divertible Truck-miles - 2021 truck-VMT 71,243,705
7 Total Divertible Truck-miles - 2022 truck-VMT 81,215,533
8 Total Divertible Truck-miles - 2023 truck-VMT 90,464,645
9 Total Divertible Truck-miles - 2024 truck-VMT 96,519,828
10 Total Divertible Truck-miles - 2025 truck-VMT 107,028,041
11 Total Divertible Truck-miles - 2026 truck-VMT 118,770,386
12 Total Divertible Truck-miles - 2027 truck-VMT 121,205,191
Page | 18
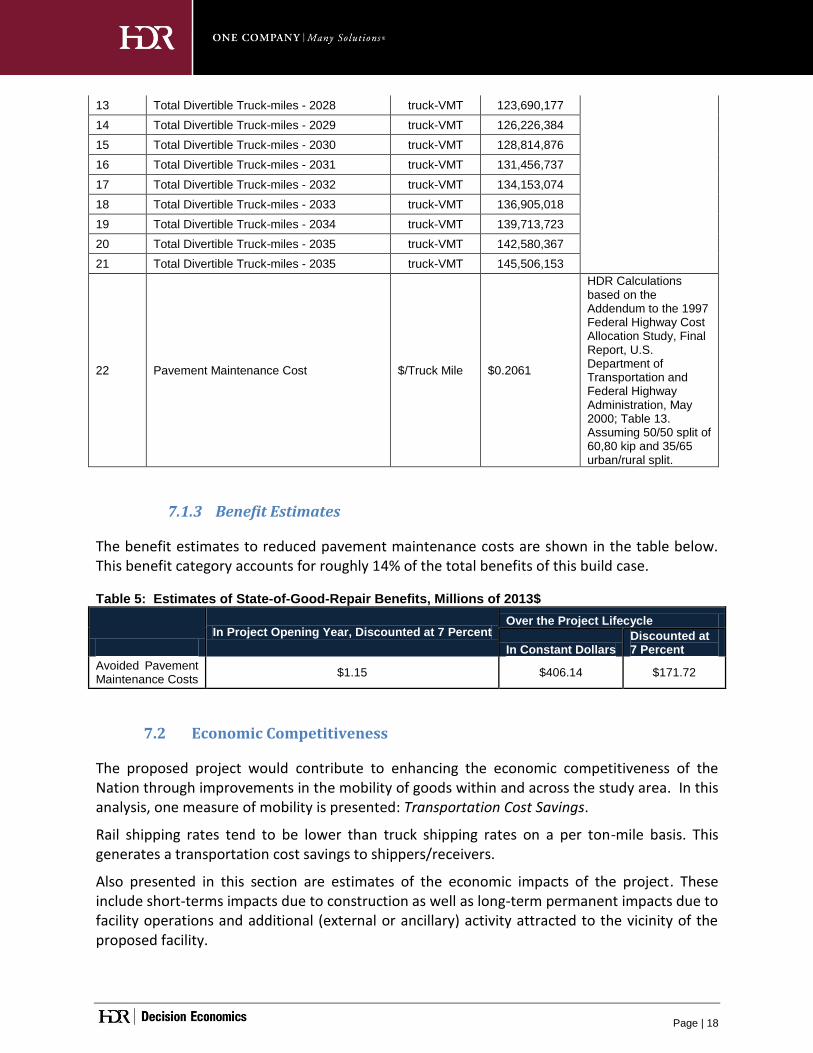
13 Total Divertible Truck-miles - 2028 truck-VMT 123,690,177
14 Total Divertible Truck-miles - 2029 truck-VMT 126,226,384
15 Total Divertible Truck-miles - 2030 truck-VMT 128,814,876
16 Total Divertible Truck-miles - 2031 truck-VMT 131,456,737
17 Total Divertible Truck-miles - 2032 truck-VMT 134,153,074
18 Total Divertible Truck-miles - 2033 truck-VMT 136,905,018
19 Total Divertible Truck-miles - 2034 truck-VMT 139,713,723
20 Total Divertible Truck-miles - 2035 truck-VMT 142,580,367
21 Total Divertible Truck-miles - 2035 truck-VMT 145,506,153
22 Pavement Maintenance Cost $/Truck Mile $0.2061
HDR Calculations based on the Addendum to the 1997 Federal Highway Cost Allocation Study, Final Report, U.S. Department of Transportation and Federal Highway Administration, May 2000; Table 13. Assuming 50/50 split of 60,80 kip and 35/65 urban/rural split.
7.1.3 Benefit Estimates
The benefit estimates to reduced pavement maintenance costs are shown in the table below. This benefit category accounts for roughly 14% of the total benefits of this build case.
Table 5: Estimates of State-of-Good-Repair Benefits, Millions of 2013$
In Project Opening Year, Discounted at 7 Percent
Over the Project Lifecycle
In Constant Dollars Discounted at 7 Percent
Avoided Pavement Maintenance Costs
$1.15 $406.14 $171.72
7.2 Economic Competitiveness
The proposed project would contribute to enhancing the economic competitiveness of the Nation through improvements in the mobility of goods within and across the study area. In this analysis, one measure of mobility is presented: Transportation Cost Savings.
Rail shipping rates tend to be lower than truck shipping rates on a per ton-mile basis. This generates a transportation cost savings to shippers/receivers.
Also presented in this section are estimates of the economic impacts of the project. These include short-terms impacts due to construction as well as long-term permanent impacts due to facility operations and additional (external or ancillary) activity attracted to the vicinity of the proposed facility.

Page | 19
7.2.1 Methodology Reduced Transportation Costs from Diverting Heavy Truck Travel to Rail and Reduced Transportation Costs from Diverting Existing Intermodal Shipments to More Direct Routes out of UMTH Rail shipping rates tend to be lower than truck shipping rates on a per ton-mile basis. As such, diversion of highway freight to rail can generate cost savings to shippers. In addition, the proposed project would offer for some existing intermodal shipments more direct – and thus less costly – shipping routes. In other words, the UMTH facility would reduce shipping costs on a ‘per lift’ basis, with cost reductions attributed to diverting both existing intermodal and truck-only freight. The category of cost savings relating to the diversion of truck-only freight to rail is attributed to ‘new users’ of the rail system. As such, it is appropriate to apply the ‘50% rule’ when accounting for this consumer surplus change. Consumer surplus is a monetary quantity that equates to the economic value (EV) of the additional transportation options to users (here shippers of freight) through the new project. Transportation cost savings are quantified using the calculation of the volume of truck ton-miles avoided and relative shipping rates. Rates were converted into a ‘per lift’ basis by Iowa Northern Railway Company (IANR). Florilli Logistics, an Iowa based trucking company that handles large volumes of both refrigerated and dry freight within the region and the entire country, compared the assumptions with confidential traffic flow data in-house and confirmed that the assumptions by IANR were reasonable. The benefits in this category are counted as public because the difference in transportation costs between rail intermodal and truckload freight accrue directly to the shipper and receiver lowering the final price consumers pay. The figure below outlines the methodology for quantifying this benefit. Figure 3: Reduced Transportation Costs S&L
Total Lift Capacity
(Number of Lifts/year)
Percent of Lifts Diverted
from Other Intermodal
Moves
(%, by year)
Average Freight Savings
for Intermodal Moves
($/lift)
Shipper Savings due to
proposed Project
($/Year)Input
Legend
Output
Percent of Lifts Diverted
from Truck
(%, by year)
Average Freight Savings
for Lifts Diverted from
Truck
($/lift)

Page | 20
7.2.2 Assumptions
The assumptions used in the estimation of shipping cost reductions are summarized in the table below. Note that input called “Total Lifts (by year)” represents total lifts in UMTH reduced by the percentage of lifts which are expected to represent induced traffic.
Table 6: Assumptions used in the Estimation of Transportation Cost Savings Input
# Input Name Units Value Source/Comment
3 Total Lifts - 2016 #/year 9,500
Based on detailed market analysis conducted by IANR and Florilli using FAF 3 data assessing specific origin destination pairs amenable to truck and rail diversion.
4 Total Lifts - 2017 #/year 63,750
5 Total Lifts - 2018 #/year 92,000
6 Total Lifts - 2019 #/year 100,219
7 Total Lifts - 2020 #/year 113,003
8 Total Lifts - 2021 #/year 129,534
9 Total Lifts - 2022 #/year 141,244
10 Total Lifts - 2023 #/year 150,774
11 Total Lifts - 2024 #/year 160,866
12 Total Lifts - 2025 #/year 178,380
13 Total Lifts - 2026 #/year 197,951
14 Total Lifts - 2027 #/year 202,009
15 Total Lifts - 2028 #/year 206,150
16 Total Lifts - 2029 #/year 210,377
17 Total Lifts - 2030 #/year 214,691
18 Total Lifts - 2031 #/year 219,095
19 Total Lifts - 2032 #/year 223,588
20 Total Lifts - 2033 #/year 228,175
21 Total Lifts - 2034 #/year 232,856
22 Total Lifts - 2035 #/year 237,634
23 Percentage Diverted of Intermodal Moves - 2016 % 15%
24 Percentage Diverted of Intermodal Moves - 2017 % 25%
25 Percentage Diverted of Intermodal Moves - 2018 % 30%
26 Percentage Diverted of Intermodal Moves - 2019 % 37%
27 Percentage Diverted of Intermodal Moves - 2020 % 39%
28 Percentage Diverted of Intermodal Moves - 2021 % 40%
29 Percentage Diverted of Intermodal Moves - 2022 % 35%
30 Percentage Diverted of Intermodal Moves - 2023 % 30%
31 Percentage Diverted of Intermodal Moves - 2024 % 30%
32 Percentage Diverted of Intermodal Moves - 2025 % 30%
33 Percentage Diverted of Intermodal Moves - 2026 % 30%
34 Percentage Diverted of Intermodal Moves - 2027 % 30%
35 Percentage Diverted of Intermodal Moves - 2028 % 30%
36 Percentage Diverted of Intermodal Moves - 2029 % 30%
37 Percentage Diverted of Intermodal Moves - 2030 % 30%

Page | 21
38 Percentage Diverted of Intermodal Moves - 2031 % 30%
39 Percentage Diverted of Intermodal Moves - 2032 % 30%
40 Percentage Diverted of Intermodal Moves - 2033 % 30%
41 Percentage Diverted of Intermodal Moves - 2034 % 30%
42 Percentage Diverted of Intermodal Moves - 2035 % 30%
43 Freight Savings Per Lift: Diverted Intermodal - 2016 $/Lift $350
44 Freight Savings Per Lift: Diverted Intermodal - 2017 $/Lift $350
45 Freight Savings Per Lift: Diverted Intermodal - 2018 $/Lift $350
46 Freight Savings Per Lift: Diverted Intermodal - 2019 $/Lift $350
47 Freight Savings Per Lift: Diverted Intermodal - 2020 $/Lift $350
48 Freight Savings Per Lift: Diverted Intermodal - 2021 $/Lift $350
49 Freight Savings Per Lift: Diverted Intermodal - 2022 $/Lift $350
50 Freight Savings Per Lift: Diverted Intermodal - 2023 $/Lift $350
51 Freight Savings Per Lift: Diverted Intermodal - 2024 $/Lift $350
52 Freight Savings Per Lift: Diverted Intermodal - 2025 $/Lift $350
53 Freight Savings Per Lift: Diverted Intermodal - 2026 $/Lift $350
54 Freight Savings Per Lift: Diverted Intermodal - 2027 $/Lift $350
55 Freight Savings Per Lift: Diverted Intermodal - 2028 $/Lift $350
56 Freight Savings Per Lift: Diverted Intermodal - 2029 $/Lift $350
57 Freight Savings Per Lift: Diverted Intermodal - 2030 $/Lift $350
58 Freight Savings Per Lift: Diverted Intermodal - 2031 $/Lift $350
59 Freight Savings Per Lift: Diverted Intermodal - 2032 $/Lift $350
60 Freight Savings Per Lift: Diverted Intermodal - 2033 $/Lift $350
61 Freight Savings Per Lift: Diverted Intermodal - 2034 $/Lift $350
62 Freight Savings Per Lift: Diverted Intermodal - 2035 $/Lift $350
63 Percentage Diverted From Truck to Intermodal - 2016 % 85%
64 Percentage Diverted From Truck to Intermodal - 2017 % 75%
65 Percentage Diverted From Truck to Intermodal - 2018 % 70%
66 Percentage Diverted From Truck to Intermodal - 2019 % 63%
67 Percentage Diverted From Truck to Intermodal - 2020 % 61%
68 Percentage Diverted From Truck to Intermodal - 2021 % 60%
69 Percentage Diverted From Truck to Intermodal - 2022 % 65%
70 Percentage Diverted From Truck to Intermodal - 2023 % 70%
71 Percentage Diverted From Truck to Intermodal - 2024 % 70%
72 Percentage Diverted From Truck to Intermodal - 2025 % 70%
73 Percentage Diverted From Truck to Intermodal - 2026 % 70%
74 Percentage Diverted From Truck to Intermodal - 2027 % 70%
75 Percentage Diverted From Truck to Intermodal - 2028 % 70%
76 Percentage Diverted From Truck to Intermodal - 2029 % 70%
77 Percentage Diverted From Truck to Intermodal - 2030 % 70%
78 Percentage Diverted From Truck to Intermodal - 2031 % 70%
79 Percentage Diverted From Truck to Intermodal - 2032 % 70%
Page | 22
80 Percentage Diverted From Truck to Intermodal - 2033 % 70%
81 Percentage Diverted From Truck to Intermodal - 2034 % 70%
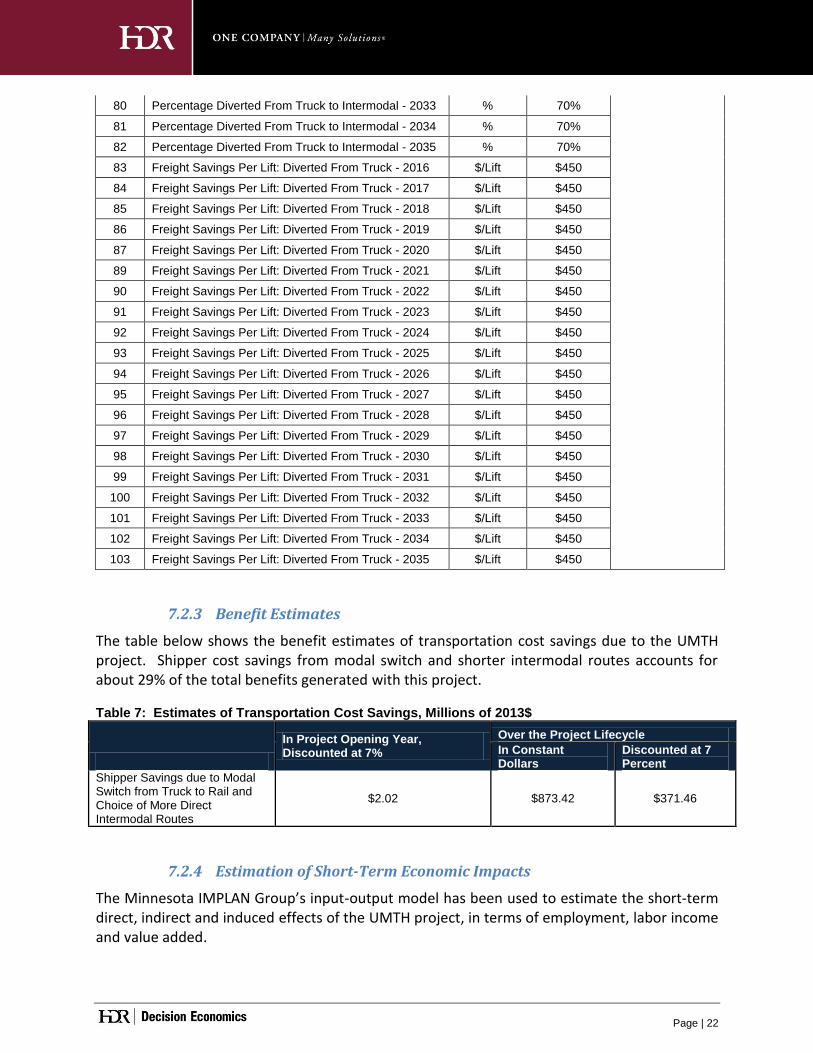
82 Percentage Diverted From Truck to Intermodal - 2035 % 70%
83 Freight Savings Per Lift: Diverted From Truck - 2016 $/Lift $450
84 Freight Savings Per Lift: Diverted From Truck - 2017 $/Lift $450
85 Freight Savings Per Lift: Diverted From Truck - 2018 $/Lift $450
86 Freight Savings Per Lift: Diverted From Truck - 2019 $/Lift $450
87 Freight Savings Per Lift: Diverted From Truck - 2020 $/Lift $450
89 Freight Savings Per Lift: Diverted From Truck - 2021 $/Lift $450
90 Freight Savings Per Lift: Diverted From Truck - 2022 $/Lift $450
91 Freight Savings Per Lift: Diverted From Truck - 2023 $/Lift $450
92 Freight Savings Per Lift: Diverted From Truck - 2024 $/Lift $450
93 Freight Savings Per Lift: Diverted From Truck - 2025 $/Lift $450
94 Freight Savings Per Lift: Diverted From Truck - 2026 $/Lift $450
95 Freight Savings Per Lift: Diverted From Truck - 2027 $/Lift $450
96 Freight Savings Per Lift: Diverted From Truck - 2028 $/Lift $450
97 Freight Savings Per Lift: Diverted From Truck - 2029 $/Lift $450
98 Freight Savings Per Lift: Diverted From Truck - 2030 $/Lift $450
99 Freight Savings Per Lift: Diverted From Truck - 2031 $/Lift $450
100 Freight Savings Per Lift: Diverted From Truck - 2032 $/Lift $450
101 Freight Savings Per Lift: Diverted From Truck - 2033 $/Lift $450
102 Freight Savings Per Lift: Diverted From Truck - 2034 $/Lift $450
103 Freight Savings Per Lift: Diverted From Truck - 2035 $/Lift $450
7.2.3 Benefit Estimates
The table below shows the benefit estimates of transportation cost savings due to the UMTH project. Shipper cost savings from modal switch and shorter intermodal routes accounts for about 29% of the total benefits generated with this project.
Table 7: Estimates of Transportation Cost Savings, Millions of 2013$
In Project Opening Year, Discounted at 7%
Over the Project Lifecycle
In Constant Dollars
Discounted at 7 Percent
Shipper Savings due to Modal Switch from Truck to Rail and Choice of More Direct Intermodal Routes
$2.02 $873.42 $371.46
7.2.4 Estimation of Short-Term Economic Impacts
The Minnesota IMPLAN Group’s input-output model has been used to estimate the short-term direct, indirect and induced effects of the UMTH project, in terms of employment, labor income and value added.
Page | 23
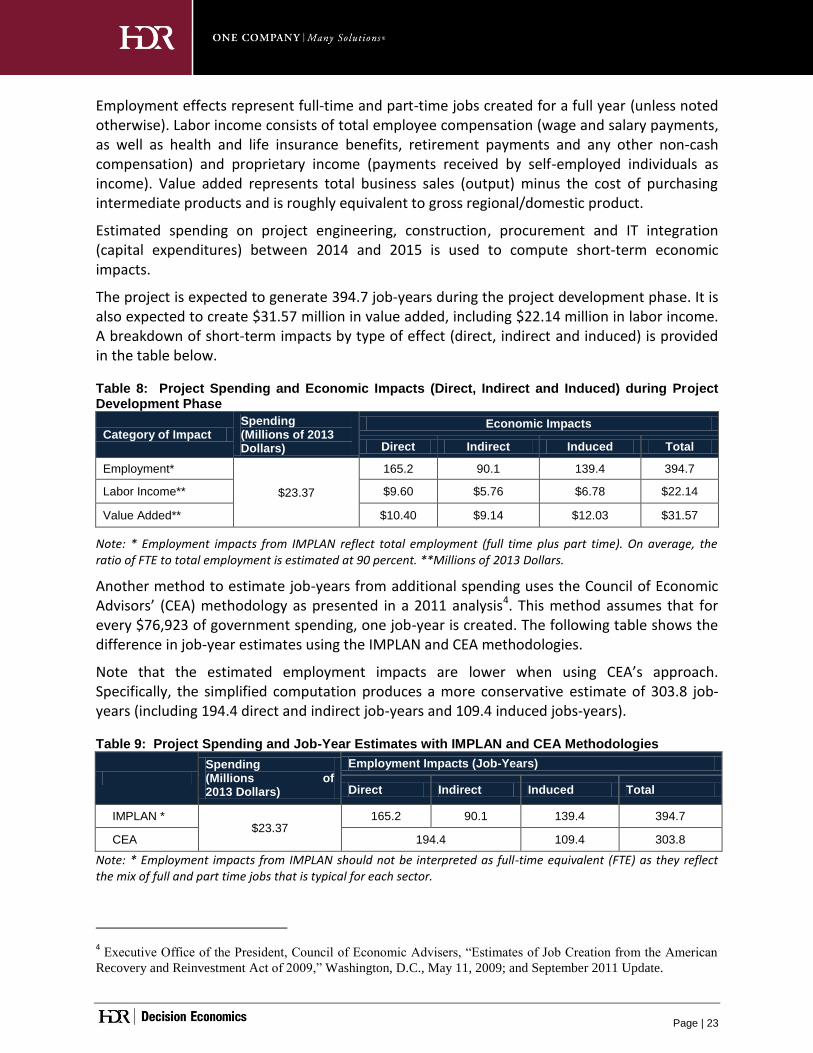
Employment effects represent full-time and part-time jobs created for a full year (unless noted otherwise). Labor income consists of total employee compensation (wage and salary payments, as well as health and life insurance benefits, retirement payments and any other non-cash compensation) and proprietary income (payments received by self-employed individuals as income). Value added represents total business sales (output) minus the cost of purchasing intermediate products and is roughly equivalent to gross regional/domestic product.
Estimated spending on project engineering, construction, procurement and IT integration (capital expenditures) between 2014 and 2015 is used to compute short-term economic impacts.
The project is expected to generate 394.7 job-years during the project development phase. It is also expected to create $31.57 million in value added, including $22.14 million in labor income. A breakdown of short-term impacts by type of effect (direct, indirect and induced) is provided in the table below.
Table 8: Project Spending and Economic Impacts (Direct, Indirect and Induced) during Project Development Phase
Category of Impact Spending (Millions of 2013 Dollars)
Economic Impacts
Direct Indirect Induced Total
Employment*
$23.37
165.2 90.1 139.4 394.7
Labor Income** $9.60 $5.76 $6.78 $22.14
Value Added** $10.40 $9.14 $12.03 $31.57
Note: * Employment impacts from IMPLAN reflect total employment (full time plus part time). On average, the ratio of FTE to total employment is estimated at 90 percent. **Millions of 2013 Dollars.
Another method to estimate job-years from additional spending uses the Council of Economic Advisors’ (CEA) methodology as presented in a 2011 analysis4. This method assumes that for every $76,923 of government spending, one job-year is created. The following table shows the difference in job-year estimates using the IMPLAN and CEA methodologies.
Note that the estimated employment impacts are lower when using CEA’s approach. Specifically, the simplified computation produces a more conservative estimate of 303.8 job-years (including 194.4 direct and indirect job-years and 109.4 induced jobs-years).
Table 9: Project Spending and Job-Year Estimates with IMPLAN and CEA Methodologies
Spending (Millions of 2013 Dollars)
Employment Impacts (Job-Years)
Direct Indirect Induced Total
IMPLAN * $23.37
165.2 90.1 139.4 394.7
CEA 194.4 109.4 303.8
Note: * Employment impacts from IMPLAN should not be interpreted as full-time equivalent (FTE) as they reflect the mix of full and part time jobs that is typical for each sector.
4 Executive Office of the President, Council of Economic Advisers, “Estimates of Job Creation from the American
Recovery and Reinvestment Act of 2009,” Washington, D.C., May 11, 2009; and September 2011 Update.

Page | 24
A breakdown of short-term economic impacts (using IMPLAN estimates) in terms of employment (job-hours), labor income and value added is provided by quarter in the table below.
Table 10: Project Spending and Short-Term Economic Impacts by Quarter
Period Spending (Millions of 2013 Dollars)*
Economic Impacts
Total Job-Hours**
Direct Job-Hours**
Total Labor Income (Millions of 2013 Dollars)
Total Value Added (Millions of 2013 Dollars)
2014 - Q3 $0.38 12,830.7 5,862.8 $0.40 $0.56
2014 - Q4 $0.38 12,830.7 5,862.8 $0.40 $0.56
2015 - Q1 $5.65 170,607.6 71,160.8 $5.34 $7.61
2015 - Q2 $5.65 170,607.6 71,160.8 $5.34 $7.61
2015 - Q3 $5.65 170,607.6 71,160.8 $5.34 $7.61
2015 - Q4 $5.65 170,607.6 71,160.8 $5.34 $7.61
Total $23.37 708,091.8 296,368.8 $22.14 $31.57
Notes: * based on project spending on construction ($24.61 million); ** assuming average weekly hours of 34.5 (Bureau of Labor Statistics estimate).
The table below presents the short-term increase in employment and labor income resulting from capital expenditures in key industries employing low-income people. 64.8 cumulative job-years (or 16.4 percent of total job-years) are expected to be created in those industries by the end of 2015, bringing in an additional $1.96 million in labor income.
Table 11: Short-Term Impacts in Key Industries Employing Low-Income People
Sectors Employment (Job-Years)
Labor Income (Millions of 2012 Dollars)
Retail Industries 27.1 $0.90
Services to buildings and dwellings 4.6 $0.12
Other business services 4 $0.14
Food services and drinking places 15.1 $0.35
Hotel/accommodation services 2 $0.08
Personal care and other personal Services 12 $0.38
Total 64.8 $1.96
Note: Low-income sectors are identified in BLS, A Profile of the Working Poor, March 2009; BLS, Characteristics of Minimum Wage Workers, March 2009; and Carsey Institute, Issue Brief No. 2, Summer 2008.
Page | 25
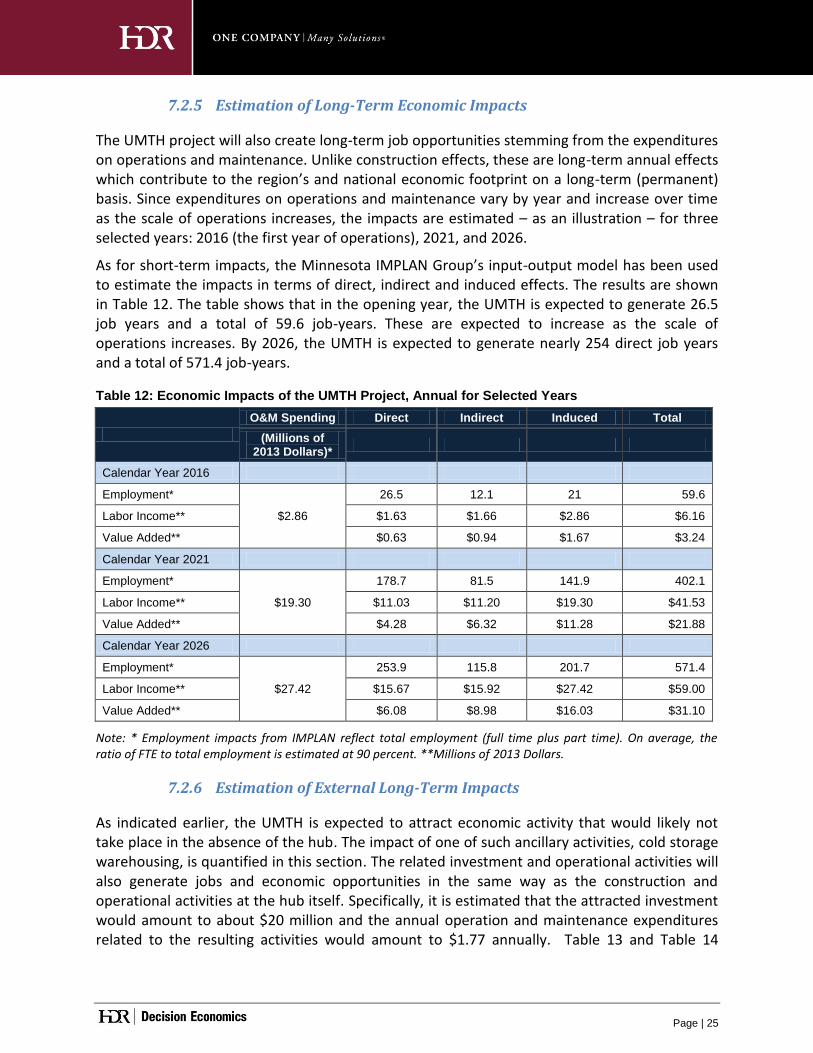
7.2.5 Estimation of Long-Term Economic Impacts
The UMTH project will also create long-term job opportunities stemming from the expenditures on operations and maintenance. Unlike construction effects, these are long-term annual effects which contribute to the region’s and national economic footprint on a long-term (permanent) basis. Since expenditures on operations and maintenance vary by year and increase over time as the scale of operations increases, the impacts are estimated – as an illustration – for three selected years: 2016 (the first year of operations), 2021, and 2026.
As for short-term impacts, the Minnesota IMPLAN Group’s input-output model has been used to estimate the impacts in terms of direct, indirect and induced effects. The results are shown in Table 12. The table shows that in the opening year, the UMTH is expected to generate 26.5 job years and a total of 59.6 job-years. These are expected to increase as the scale of operations increases. By 2026, the UMTH is expected to generate nearly 254 direct job years and a total of 571.4 job-years.
Table 12: Economic Impacts of the UMTH Project, Annual for Selected Years
O&M Spending Direct Indirect Induced Total
(Millions of 2013 Dollars)*
Calendar Year 2016
Employment*
$2.86
26.5 12.1 21 59.6
Labor Income** $1.63 $1.66 $2.86 $6.16
Value Added** $0.63 $0.94 $1.67 $3.24
Calendar Year 2021
Employment*
$19.30
178.7 81.5 141.9 402.1
Labor Income** $11.03 $11.20 $19.30 $41.53
Value Added** $4.28 $6.32 $11.28 $21.88
Calendar Year 2026
Employment*
$27.42
253.9 115.8 201.7 571.4
Labor Income** $15.67 $15.92 $27.42 $59.00
Value Added** $6.08 $8.98 $16.03 $31.10
Note: * Employment impacts from IMPLAN reflect total employment (full time plus part time). On average, the ratio of FTE to total employment is estimated at 90 percent. **Millions of 2013 Dollars.
7.2.6 Estimation of External Long-Term Impacts
As indicated earlier, the UMTH is expected to attract economic activity that would likely not take place in the absence of the hub. The impact of one of such ancillary activities, cold storage warehousing, is quantified in this section. The related investment and operational activities will also generate jobs and economic opportunities in the same way as the construction and operational activities at the hub itself. Specifically, it is estimated that the attracted investment would amount to about $20 million and the annual operation and maintenance expenditures related to the resulting activities would amount to $1.77 annually. Table 13 and Table 14

Page | 26
present the impacts of capital expenditures and operating expenditures, respectively, related to the investment and operating activities in question.
Table 13: Economic Impacts of Capital Expenditures Related to Ancillary Operations
Spending Direct Indirect Induced Total
(Millions of 2013 Dollars)*
Employment*
$20.00
164.7 84.4 131.8 380.9
Labor Income** $9.83 $10.78 $20.00 $40.61
Value Added** $4.55 $7.38 $15.45 $27.39
Note: * Employment impacts from IMPLAN reflect total employment (full time plus part time). On average, the ratio of FTE to total employment is estimated at 90 percent. **Millions of 2013 Dollars.
Table 14: Economic Impacts of Operations and Maintenance Expenditures Related to Ancillary Operations
Spending Direct Indirect Induced Total
(Millions of 2013 Dollars)*
Employment*
$1.77
19.3 5.7 10.8 35.8
Labor Income** $0.89 $1.17 $1.77 $3.83
Value Added** $0.28 $0.49 $0.83 $1.60
Note: * Employment impacts from IMPLAN reflect total employment (full time plus part time). On average, the ratio of FTE to total employment is estimated at 90 percent. **Millions of 2013 Dollars.
7.3 Quality of Life
The proposed project would contribute to enhancing livability and quality of life in the study area through the reduction in highway congestion from displacing heavy truck travel to rail. This represents the travel time savings of the remaining on-road motorists.
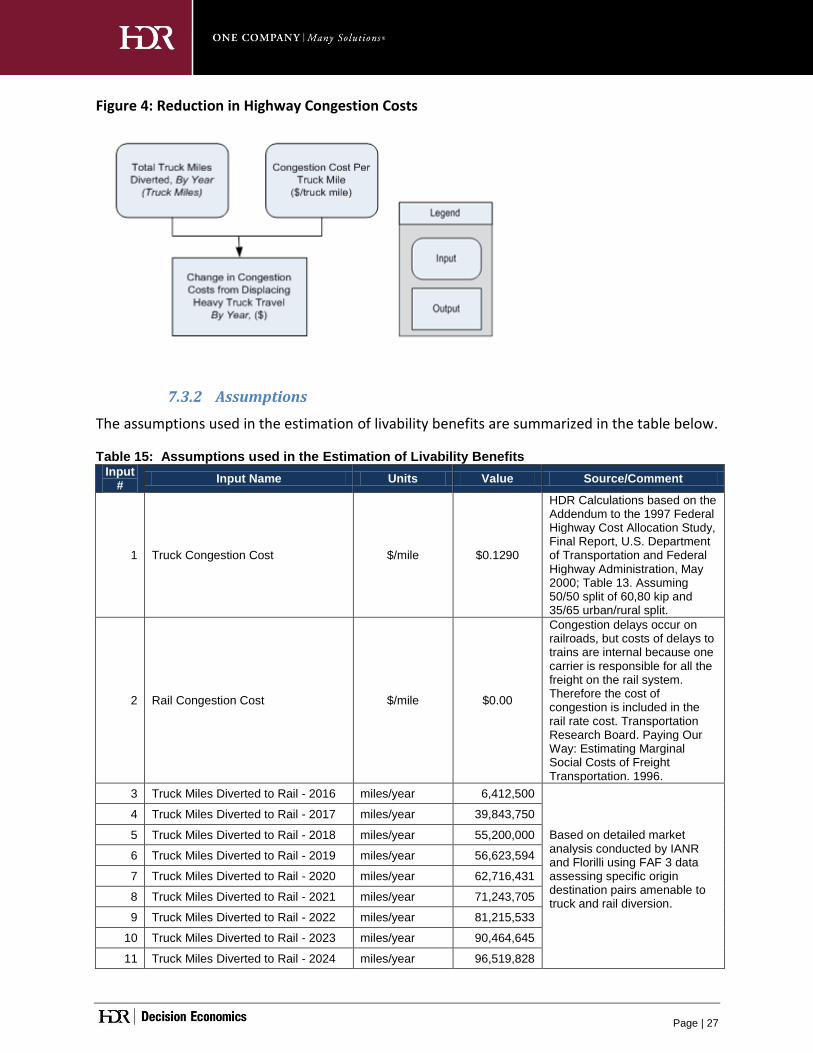
7.3.1 Methodology Reduction in Highway Congestion Costs from Displacing Heavy Truck Travel to Rail
The proposed UMTH project will divert freight from road to rail resulting in a reduction in the use of public highways by heavy trucks. This benefit category estimates the avoided highway congestion costs by applying the total diverted truck miles to a rate of congestion cost per mile.
It should also be noted that increased goods shipment by rail increase traffic on the rail network. Congestion delays do occur on railroads, but costs of delays to trains are internal because one carrier is responsible for all the freight on the rail system. Therefore the cost of congestion is included in the rail rate cost and the external social cost is assumed equal to zero.5 The figure below outlines the structure and logic model of the benefit calculation.
5 Transportation Research Board. Paying Our Way: Estimating Marginal Social Costs of Freight Transportation.
1996.
Page | 27
Figure 4: Reduction in Highway Congestion Costs
7.3.2 Assumptions
The assumptions used in the estimation of livability benefits are summarized in the table below.
Table 15: Assumptions used in the Estimation of Livability Benefits Input
# Input Name Units Value Source/Comment
1 Truck Congestion Cost $/mile $0.1290
HDR Calculations based on the Addendum to the 1997 Federal Highway Cost Allocation Study, Final Report, U.S. Department of Transportation and Federal Highway Administration, May 2000; Table 13. Assuming 50/50 split of 60,80 kip and 35/65 urban/rural split.
2 Rail Congestion Cost $/mile $0.00
Congestion delays occur on railroads, but costs of delays to trains are internal because one carrier is responsible for all the freight on the rail system. Therefore the cost of congestion is included in the rail rate cost. Transportation Research Board. Paying Our Way: Estimating Marginal Social Costs of Freight Transportation. 1996.
3 Truck Miles Diverted to Rail - 2016 miles/year 6,412,500
Based on detailed market analysis conducted by IANR and Florilli using FAF 3 data assessing specific origin destination pairs amenable to truck and rail diversion.
4 Truck Miles Diverted to Rail - 2017 miles/year 39,843,750
5 Truck Miles Diverted to Rail - 2018 miles/year 55,200,000
6 Truck Miles Diverted to Rail - 2019 miles/year 56,623,594
7 Truck Miles Diverted to Rail - 2020 miles/year 62,716,431
8 Truck Miles Diverted to Rail - 2021 miles/year 71,243,705
9 Truck Miles Diverted to Rail - 2022 miles/year 81,215,533
10 Truck Miles Diverted to Rail - 2023 miles/year 90,464,645
11 Truck Miles Diverted to Rail - 2024 miles/year 96,519,828

Page | 28
12 Truck Miles Diverted to Rail - 2025 miles/year 107,028,041
13 Truck Miles Diverted to Rail - 2026 miles/year 118,770,386
14 Truck Miles Diverted to Rail - 2027 miles/year 121,205,191
15 Truck Miles Diverted to Rail - 2028 miles/year 123,690,177
16 Truck Miles Diverted to Rail - 2029 miles/year 126,226,384
17 Truck Miles Diverted to Rail - 2030 miles/year 128,814,876
18 Truck Miles Diverted to Rail - 2031 miles/year 131,456,737
19 Truck Miles Diverted to Rail - 2032 miles/year 134,153,074
20 Truck Miles Diverted to Rail - 2033 miles/year 136,905,018
21 Truck Miles Diverted to Rail - 2034 miles/year 139,713,723
22 Truck Miles Diverted to Rail - 2035 miles/year 142,580,367
7.3.3 Benefit Estimates
The table below shows the benefit estimates of road congestion savings due to the UMTH project. Congestion savings from modal switch and shorter intermodal routes accounts for roughly 9% of the total benefits generated with this project.
Table 16: Estimates of Quality of Life Benefits, Millions of 2013$
In Project Opening Year, Discounted at 7%
Over the Project Lifecycle
In Constant Dollars Discounted at 7 Percent
Reduced Road Congestion due to Modal Switch from Truck to Rail
$0.72 $254.27 $107.50
7.4 Environmental Sustainability
The proposed project would contribute to environmental sustainability through emission savings from diverting heavy truck travel to rail.
7.4.1 Methodology
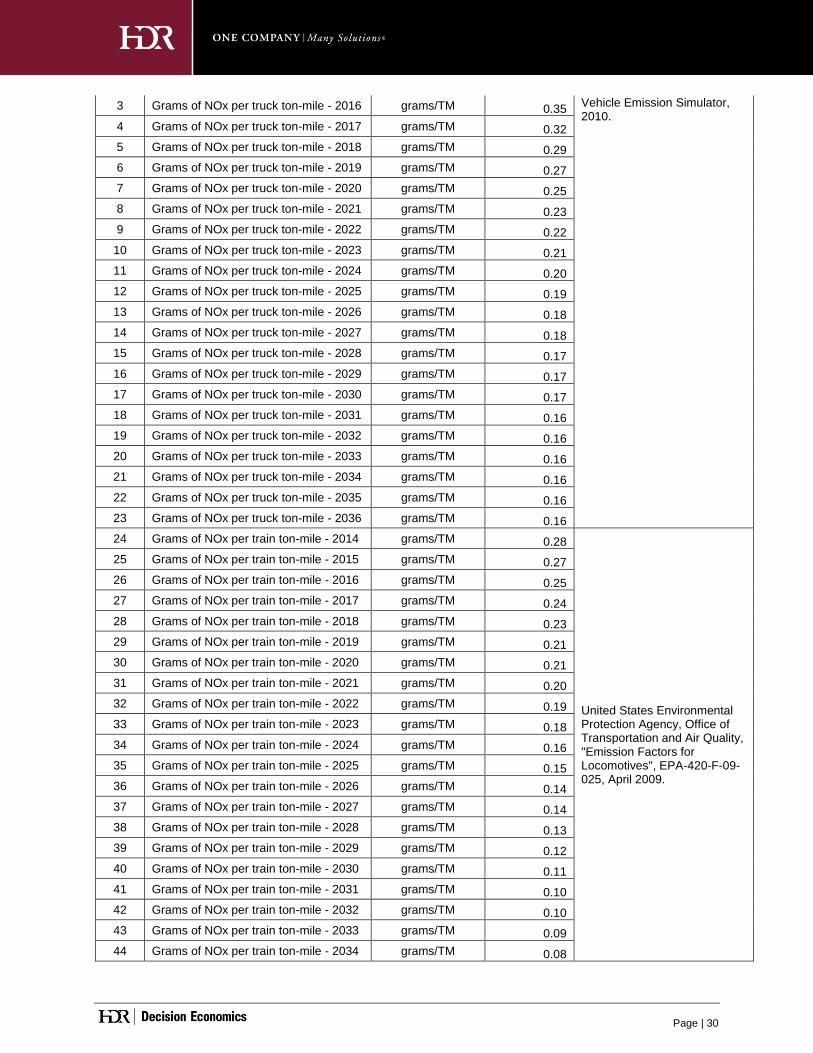
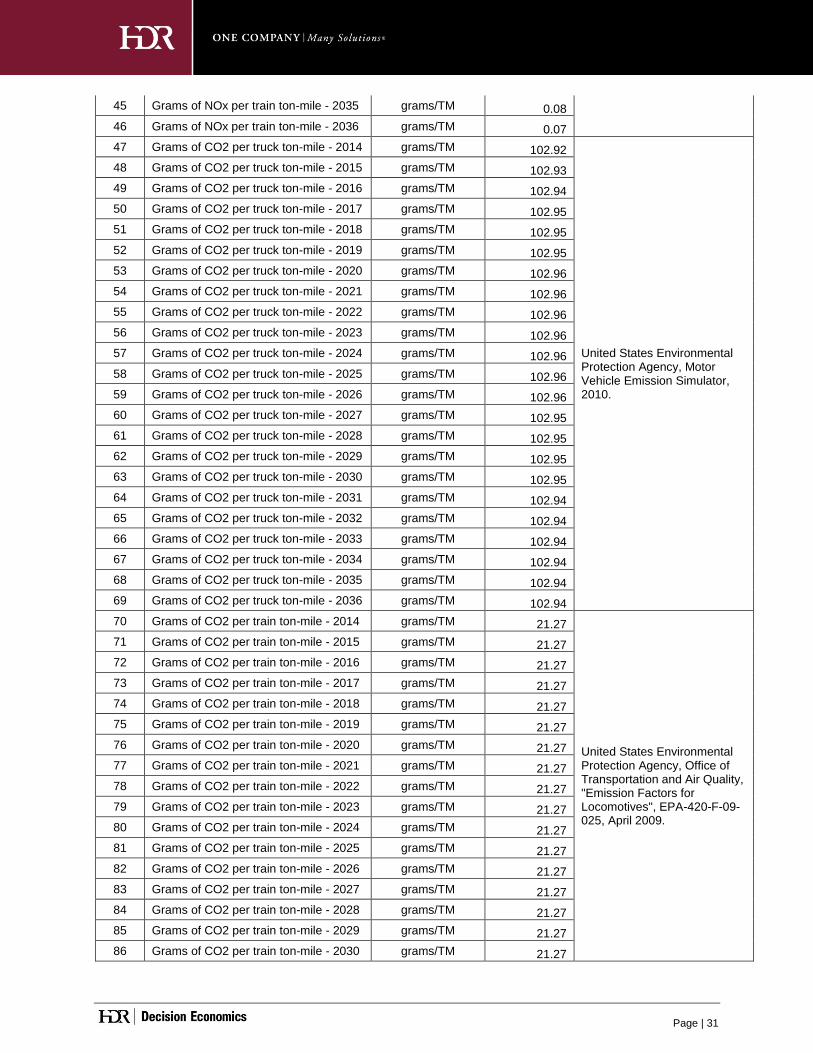
Emission Savings from Diverting Heavy Truck Travel to Rail Freight carried over the rail network imposes less environmental impacts for the same amount of cargo than those imposed by trucks on the highway network. This benefit category estimates the value of the reduced environmental emissions associated with transporting goods on rail as opposed to by truck. The amount of greenhouse gas (GHG) and critical air contaminants (CAC) are calculated on the basis of pollutants generated per ton-mile travelled by truck and train. Truck ton-miles diverted to rail are estimated by multiplying truck miles diverted (as shown in previous tables, e.g. Table 15) by the average truck load. The estimated truck ton-miles diverted from truck to rail are then multiplied by truck emissions factors (grams of pollutants per truck-ton mile) to calculate the amounts of pollutant emissions avoided.

Page | 29
Truck ton-miles diverted to rail are also multiplied by a truck-mile to rail-mile conversion factor to obtain the equivalent train ton-miles. These are then multiplied by rail emissions factors (grams of pollutants per train ton-mile) to obtain the incremental rail emissions due to diversion of truck shipments. The difference between the two sets of emissions multiplied by the social costs of emissions gives the net impact on emissions. The structure and logic model outlining this calculation is provided in the figure below.
Figure 5: Emission Savings S&L
Truck Ton-Miles
Diverted to Rail
(ton-miles, by yeart)
Truck Emissions Factors
(grams/ton-mile, by
pollutant)
Truck Ton-Mile to Rail
Ton-Mile Conversion
Factor
(Number)
Equivalent Incremental
Rail Ton-Miles
(ton-miles, by year)
Rail Emissions Factor
(grams/ton-mile, by
pollutant)
Incremental Rail
Emissions
(tons, by year)
Truck Emissions
Avoided
(tons, by year)
Social Costs of
Pollutants
($/ton, by pollutant, by
year)
Cost of Incremental Rail
Emissions
($, by year)
Cost of Truck Emissions
Avoided
($, by year)
Net Effect on Emissions
Costs
($, by year)
7.4.2 Assumptions
The key assumptions used in the estimation of sustainability benefits are summarized in the table below.
Table 17: Assumptions used in the Estimation of Environmental Sustainability Benefits Input
# Input Name Units Value Source/Comment
1 Grams of NOx per truck ton-mile - 2014 grams/TM 0.42 United States Environmental Protection Agency, Motor 2 Grams of NOx per truck ton-mile - 2015 grams/TM 0.38
Page | 30
3 Grams of NOx per truck ton-mile - 2016 grams/TM 0.35 Vehicle Emission Simulator, 2010.
4 Grams of NOx per truck ton-mile - 2017 grams/TM 0.32
5 Grams of NOx per truck ton-mile - 2018 grams/TM 0.29
6 Grams of NOx per truck ton-mile - 2019 grams/TM 0.27
7 Grams of NOx per truck ton-mile - 2020 grams/TM 0.25
8 Grams of NOx per truck ton-mile - 2021 grams/TM 0.23
9 Grams of NOx per truck ton-mile - 2022 grams/TM 0.22
10 Grams of NOx per truck ton-mile - 2023 grams/TM 0.21
11 Grams of NOx per truck ton-mile - 2024 grams/TM 0.20
12 Grams of NOx per truck ton-mile - 2025 grams/TM 0.19
13 Grams of NOx per truck ton-mile - 2026 grams/TM 0.18
14 Grams of NOx per truck ton-mile - 2027 grams/TM 0.18
15 Grams of NOx per truck ton-mile - 2028 grams/TM 0.17
16 Grams of NOx per truck ton-mile - 2029 grams/TM 0.17
17 Grams of NOx per truck ton-mile - 2030 grams/TM 0.17
18 Grams of NOx per truck ton-mile - 2031 grams/TM 0.16
19 Grams of NOx per truck ton-mile - 2032 grams/TM 0.16
20 Grams of NOx per truck ton-mile - 2033 grams/TM 0.16
21 Grams of NOx per truck ton-mile - 2034 grams/TM 0.16
22 Grams of NOx per truck ton-mile - 2035 grams/TM 0.16
23 Grams of NOx per truck ton-mile - 2036 grams/TM 0.16
24 Grams of NOx per train ton-mile - 2014 grams/TM 0.28
United States Environmental Protection Agency, Office of Transportation and Air Quality, "Emission Factors for Locomotives", EPA-420-F-09-025, April 2009.
25 Grams of NOx per train ton-mile - 2015 grams/TM 0.27
26 Grams of NOx per train ton-mile - 2016 grams/TM 0.25
27 Grams of NOx per train ton-mile - 2017 grams/TM 0.24
28 Grams of NOx per train ton-mile - 2018 grams/TM 0.23
29 Grams of NOx per train ton-mile - 2019 grams/TM 0.21
30 Grams of NOx per train ton-mile - 2020 grams/TM 0.21
31 Grams of NOx per train ton-mile - 2021 grams/TM 0.20
32 Grams of NOx per train ton-mile - 2022 grams/TM 0.19
33 Grams of NOx per train ton-mile - 2023 grams/TM 0.18
34 Grams of NOx per train ton-mile - 2024 grams/TM 0.16
35 Grams of NOx per train ton-mile - 2025 grams/TM 0.15
36 Grams of NOx per train ton-mile - 2026 grams/TM 0.14
37 Grams of NOx per train ton-mile - 2027 grams/TM 0.14
38 Grams of NOx per train ton-mile - 2028 grams/TM 0.13
39 Grams of NOx per train ton-mile - 2029 grams/TM 0.12
40 Grams of NOx per train ton-mile - 2030 grams/TM 0.11
41 Grams of NOx per train ton-mile - 2031 grams/TM 0.10
42 Grams of NOx per train ton-mile - 2032 grams/TM 0.10
43 Grams of NOx per train ton-mile - 2033 grams/TM 0.09
44 Grams of NOx per train ton-mile - 2034 grams/TM 0.08
Page | 31
45 Grams of NOx per train ton-mile - 2035 grams/TM 0.08
46 Grams of NOx per train ton-mile - 2036 grams/TM 0.07
47 Grams of CO2 per truck ton-mile - 2014 grams/TM 102.92
United States Environmental Protection Agency, Motor Vehicle Emission Simulator, 2010.
48 Grams of CO2 per truck ton-mile - 2015 grams/TM 102.93
49 Grams of CO2 per truck ton-mile - 2016 grams/TM 102.94
50 Grams of CO2 per truck ton-mile - 2017 grams/TM 102.95
51 Grams of CO2 per truck ton-mile - 2018 grams/TM 102.95
52 Grams of CO2 per truck ton-mile - 2019 grams/TM 102.95
53 Grams of CO2 per truck ton-mile - 2020 grams/TM 102.96
54 Grams of CO2 per truck ton-mile - 2021 grams/TM 102.96
55 Grams of CO2 per truck ton-mile - 2022 grams/TM 102.96
56 Grams of CO2 per truck ton-mile - 2023 grams/TM 102.96
57 Grams of CO2 per truck ton-mile - 2024 grams/TM 102.96
58 Grams of CO2 per truck ton-mile - 2025 grams/TM 102.96
59 Grams of CO2 per truck ton-mile - 2026 grams/TM 102.96
60 Grams of CO2 per truck ton-mile - 2027 grams/TM 102.95
61 Grams of CO2 per truck ton-mile - 2028 grams/TM 102.95
62 Grams of CO2 per truck ton-mile - 2029 grams/TM 102.95
63 Grams of CO2 per truck ton-mile - 2030 grams/TM 102.95
64 Grams of CO2 per truck ton-mile - 2031 grams/TM 102.94
65 Grams of CO2 per truck ton-mile - 2032 grams/TM 102.94
66 Grams of CO2 per truck ton-mile - 2033 grams/TM 102.94
67 Grams of CO2 per truck ton-mile - 2034 grams/TM 102.94
68 Grams of CO2 per truck ton-mile - 2035 grams/TM 102.94
69 Grams of CO2 per truck ton-mile - 2036 grams/TM 102.94
70 Grams of CO2 per train ton-mile - 2014 grams/TM 21.27
United States Environmental Protection Agency, Office of Transportation and Air Quality, "Emission Factors for Locomotives", EPA-420-F-09-025, April 2009.
71 Grams of CO2 per train ton-mile - 2015 grams/TM 21.27
72 Grams of CO2 per train ton-mile - 2016 grams/TM 21.27
73 Grams of CO2 per train ton-mile - 2017 grams/TM 21.27
74 Grams of CO2 per train ton-mile - 2018 grams/TM 21.27
75 Grams of CO2 per train ton-mile - 2019 grams/TM 21.27
76 Grams of CO2 per train ton-mile - 2020 grams/TM 21.27
77 Grams of CO2 per train ton-mile - 2021 grams/TM 21.27
78 Grams of CO2 per train ton-mile - 2022 grams/TM 21.27
79 Grams of CO2 per train ton-mile - 2023 grams/TM 21.27
80 Grams of CO2 per train ton-mile - 2024 grams/TM 21.27
81 Grams of CO2 per train ton-mile - 2025 grams/TM 21.27
82 Grams of CO2 per train ton-mile - 2026 grams/TM 21.27
83 Grams of CO2 per train ton-mile - 2027 grams/TM 21.27
84 Grams of CO2 per train ton-mile - 2028 grams/TM 21.27
85 Grams of CO2 per train ton-mile - 2029 grams/TM 21.27
86 Grams of CO2 per train ton-mile - 2030 grams/TM 21.27
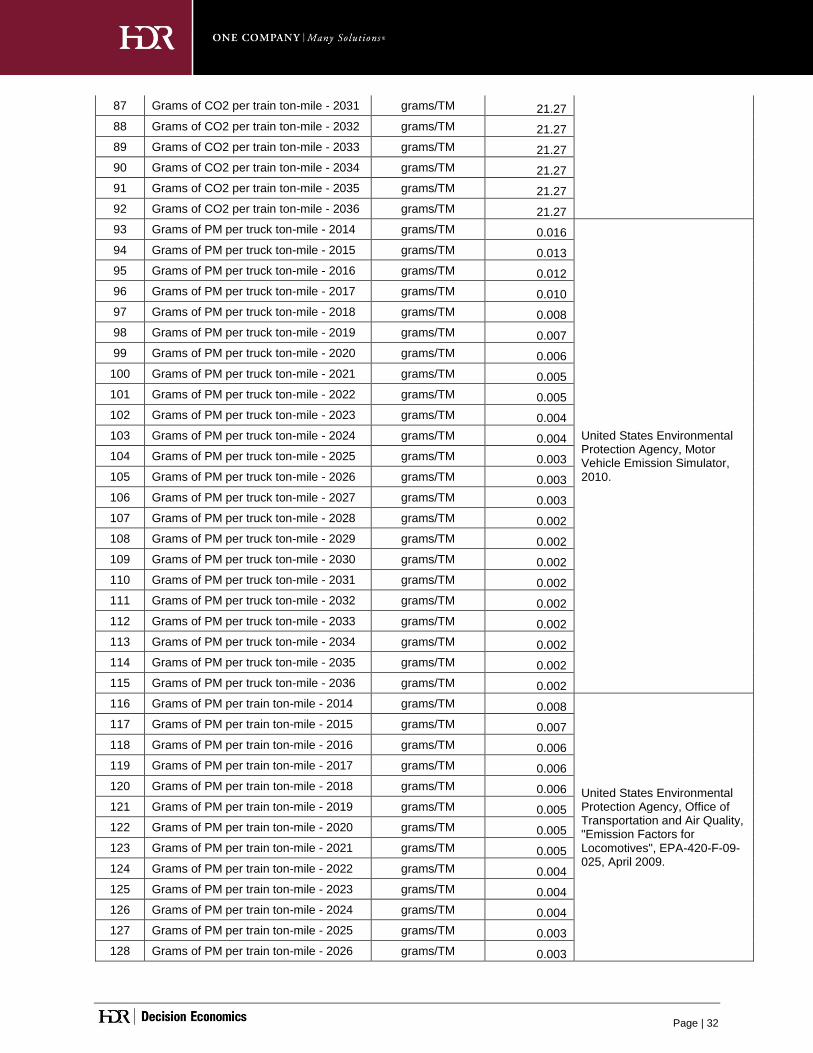
Page | 32
87 Grams of CO2 per train ton-mile - 2031 grams/TM 21.27
88 Grams of CO2 per train ton-mile - 2032 grams/TM 21.27
89 Grams of CO2 per train ton-mile - 2033 grams/TM 21.27
90 Grams of CO2 per train ton-mile - 2034 grams/TM 21.27
91 Grams of CO2 per train ton-mile - 2035 grams/TM 21.27
92 Grams of CO2 per train ton-mile - 2036 grams/TM 21.27
93 Grams of PM per truck ton-mile - 2014 grams/TM 0.016
United States Environmental Protection Agency, Motor Vehicle Emission Simulator, 2010.
94 Grams of PM per truck ton-mile - 2015 grams/TM 0.013
95 Grams of PM per truck ton-mile - 2016 grams/TM 0.012
96 Grams of PM per truck ton-mile - 2017 grams/TM 0.010
97 Grams of PM per truck ton-mile - 2018 grams/TM 0.008
98 Grams of PM per truck ton-mile - 2019 grams/TM 0.007
99 Grams of PM per truck ton-mile - 2020 grams/TM 0.006
100 Grams of PM per truck ton-mile - 2021 grams/TM 0.005
101 Grams of PM per truck ton-mile - 2022 grams/TM 0.005
102 Grams of PM per truck ton-mile - 2023 grams/TM 0.004
103 Grams of PM per truck ton-mile - 2024 grams/TM 0.004
104 Grams of PM per truck ton-mile - 2025 grams/TM 0.003
105 Grams of PM per truck ton-mile - 2026 grams/TM 0.003
106 Grams of PM per truck ton-mile - 2027 grams/TM 0.003
107 Grams of PM per truck ton-mile - 2028 grams/TM 0.002
108 Grams of PM per truck ton-mile - 2029 grams/TM 0.002
109 Grams of PM per truck ton-mile - 2030 grams/TM 0.002
110 Grams of PM per truck ton-mile - 2031 grams/TM 0.002
111 Grams of PM per truck ton-mile - 2032 grams/TM 0.002
112 Grams of PM per truck ton-mile - 2033 grams/TM 0.002
113 Grams of PM per truck ton-mile - 2034 grams/TM 0.002
114 Grams of PM per truck ton-mile - 2035 grams/TM 0.002
115 Grams of PM per truck ton-mile - 2036 grams/TM 0.002
116 Grams of PM per train ton-mile - 2014 grams/TM 0.008
United States Environmental Protection Agency, Office of Transportation and Air Quality, "Emission Factors for Locomotives", EPA-420-F-09-025, April 2009.
117 Grams of PM per train ton-mile - 2015 grams/TM 0.007
118 Grams of PM per train ton-mile - 2016 grams/TM 0.006
119 Grams of PM per train ton-mile - 2017 grams/TM 0.006
120 Grams of PM per train ton-mile - 2018 grams/TM 0.006
121 Grams of PM per train ton-mile - 2019 grams/TM 0.005
122 Grams of PM per train ton-mile - 2020 grams/TM 0.005
123 Grams of PM per train ton-mile - 2021 grams/TM 0.005
124 Grams of PM per train ton-mile - 2022 grams/TM 0.004
125 Grams of PM per train ton-mile - 2023 grams/TM 0.004
126 Grams of PM per train ton-mile - 2024 grams/TM 0.004
127 Grams of PM per train ton-mile - 2025 grams/TM 0.003
128 Grams of PM per train ton-mile - 2026 grams/TM 0.003
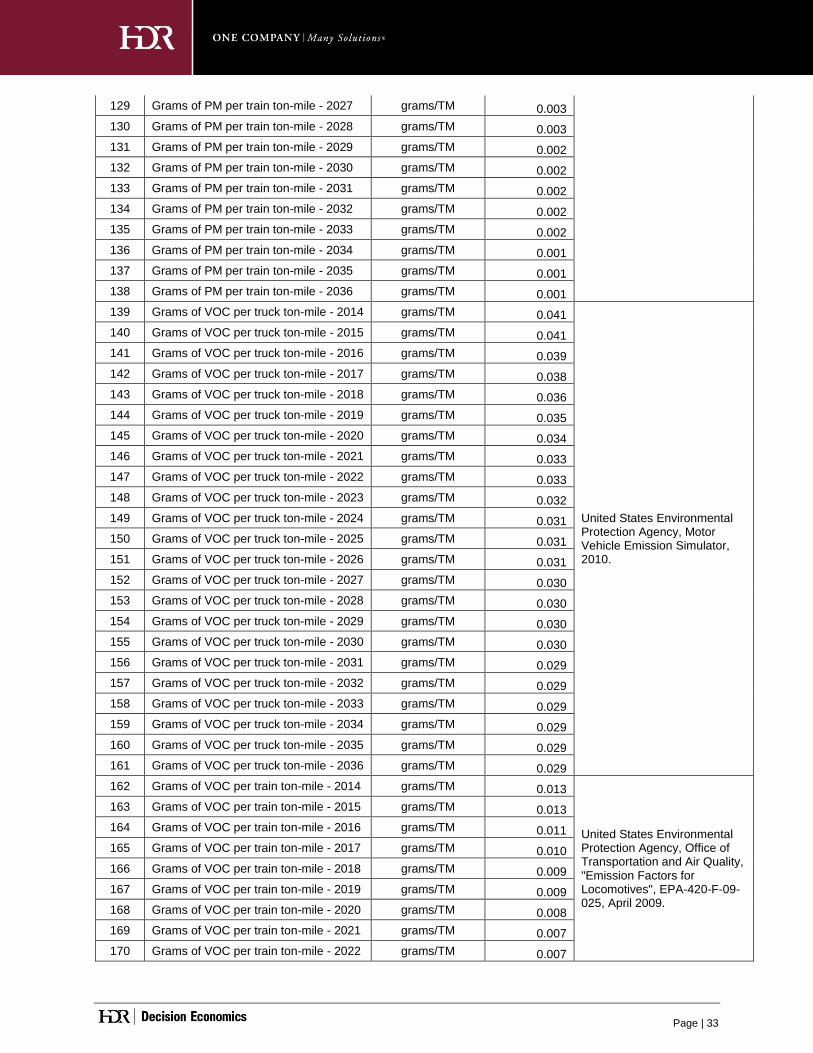
Page | 33
129 Grams of PM per train ton-mile - 2027 grams/TM 0.003
130 Grams of PM per train ton-mile - 2028 grams/TM 0.003
131 Grams of PM per train ton-mile - 2029 grams/TM 0.002
132 Grams of PM per train ton-mile - 2030 grams/TM 0.002
133 Grams of PM per train ton-mile - 2031 grams/TM 0.002
134 Grams of PM per train ton-mile - 2032 grams/TM 0.002
135 Grams of PM per train ton-mile - 2033 grams/TM 0.002
136 Grams of PM per train ton-mile - 2034 grams/TM 0.001
137 Grams of PM per train ton-mile - 2035 grams/TM 0.001
138 Grams of PM per train ton-mile - 2036 grams/TM 0.001
139 Grams of VOC per truck ton-mile - 2014 grams/TM 0.041
United States Environmental Protection Agency, Motor Vehicle Emission Simulator, 2010.
140 Grams of VOC per truck ton-mile - 2015 grams/TM 0.041
141 Grams of VOC per truck ton-mile - 2016 grams/TM 0.039
142 Grams of VOC per truck ton-mile - 2017 grams/TM 0.038
143 Grams of VOC per truck ton-mile - 2018 grams/TM 0.036
144 Grams of VOC per truck ton-mile - 2019 grams/TM 0.035
145 Grams of VOC per truck ton-mile - 2020 grams/TM 0.034
146 Grams of VOC per truck ton-mile - 2021 grams/TM 0.033
147 Grams of VOC per truck ton-mile - 2022 grams/TM 0.033
148 Grams of VOC per truck ton-mile - 2023 grams/TM 0.032
149 Grams of VOC per truck ton-mile - 2024 grams/TM 0.031
150 Grams of VOC per truck ton-mile - 2025 grams/TM 0.031
151 Grams of VOC per truck ton-mile - 2026 grams/TM 0.031
152 Grams of VOC per truck ton-mile - 2027 grams/TM 0.030
153 Grams of VOC per truck ton-mile - 2028 grams/TM 0.030
154 Grams of VOC per truck ton-mile - 2029 grams/TM 0.030
155 Grams of VOC per truck ton-mile - 2030 grams/TM 0.030
156 Grams of VOC per truck ton-mile - 2031 grams/TM 0.029
157 Grams of VOC per truck ton-mile - 2032 grams/TM 0.029
158 Grams of VOC per truck ton-mile - 2033 grams/TM 0.029
159 Grams of VOC per truck ton-mile - 2034 grams/TM 0.029
160 Grams of VOC per truck ton-mile - 2035 grams/TM 0.029
161 Grams of VOC per truck ton-mile - 2036 grams/TM 0.029
162 Grams of VOC per train ton-mile - 2014 grams/TM 0.013
United States Environmental Protection Agency, Office of Transportation and Air Quality, "Emission Factors for Locomotives", EPA-420-F-09-025, April 2009.
163 Grams of VOC per train ton-mile - 2015 grams/TM 0.013
164 Grams of VOC per train ton-mile - 2016 grams/TM 0.011
165 Grams of VOC per train ton-mile - 2017 grams/TM 0.010
166 Grams of VOC per train ton-mile - 2018 grams/TM 0.009
167 Grams of VOC per train ton-mile - 2019 grams/TM 0.009
168 Grams of VOC per train ton-mile - 2020 grams/TM 0.008
169 Grams of VOC per train ton-mile - 2021 grams/TM 0.007
170 Grams of VOC per train ton-mile - 2022 grams/TM 0.007

Page | 34
171 Grams of VOC per train ton-mile - 2023 grams/TM 0.007
172 Grams of VOC per train ton-mile - 2024 grams/TM 0.006
173 Grams of VOC per train ton-mile - 2025 grams/TM 0.006
174 Grams of VOC per train ton-mile - 2026 grams/TM 0.005
175 Grams of VOC per train ton-mile - 2027 grams/TM 0.005
176 Grams of VOC per train ton-mile - 2028 grams/TM 0.005
177 Grams of VOC per train ton-mile - 2029 grams/TM 0.004
178 Grams of VOC per train ton-mile - 2030 grams/TM 0.004
179 Grams of VOC per train ton-mile - 2031 grams/TM 0.004
180 Grams of VOC per train ton-mile - 2032 grams/TM 0.004
181 Grams of VOC per train ton-mile - 2033 grams/TM 0.003
182 Grams of VOC per train ton-mile - 2034 grams/TM 0.003
183 Grams of VOC per train ton-mile - 2035 grams/TM 0.003
184 Grams of VOC per train ton-mile - 2036 grams/TM 0.003
185 NOx cost per ton 2013$/short ton $7,147
TIGER Benefit-Cost Analysis Resource Guide, April 4, 2014. Values per metric ton converted to $/short ton.
186 CO2 cost per ton - 2014 2013$/short ton $39.92
TIGER Benefit-Cost Analysis Resource Guide, April 4, 2014. Values per metric ton converted to $/short ton.
187 CO2 cost per ton - 2014 2013$/short ton $40.82
188 CO2 cost per ton - 2015 2013$/short ton $41.73
189 CO2 cost per ton - 2016 2013$/short ton $42.64
190 CO2 cost per ton - 2017 2013$/short ton $44.45
191 CO2 cost per ton - 2018 2013$/short ton $46.27
192 CO2 cost per ton - 2019 2013$/short ton $47.17
193 CO2 cost per ton - 2020 2013$/short ton $47.17
194 CO2 cost per ton - 2021 2013$/short ton $48.99
195 CO2 cost per ton - 2022 2013$/short ton $49.90
196 CO2 cost per ton - 2023 2013$/short ton $50.80
197 CO2 cost per ton - 2024 2013$/short ton $51.71
198 CO2 cost per ton - 2025 2013$/short ton $52.62
199 CO2 cost per ton - 2026 2013$/short ton $54.43
200 CO2 cost per ton - 2027 2013$/short ton $55.34
201 CO2 cost per ton - 2028 2013$/short ton $56.25
202 CO2 cost per ton - 2029 2013$/short ton $57.15
203 CO2 cost per ton - 2030 2013$/short ton $57.15
204 CO2 cost per ton - 2031 2013$/short ton $58.97
205 CO2 cost per ton - 2032 2013$/short ton $59.87
206 CO2 cost per ton - 2033 2013$/short ton $60.78
207 CO2 cost per ton - 2034 2013$/short ton $61.69
208 CO2 cost per ton - 2035 2013$/short ton $62.60
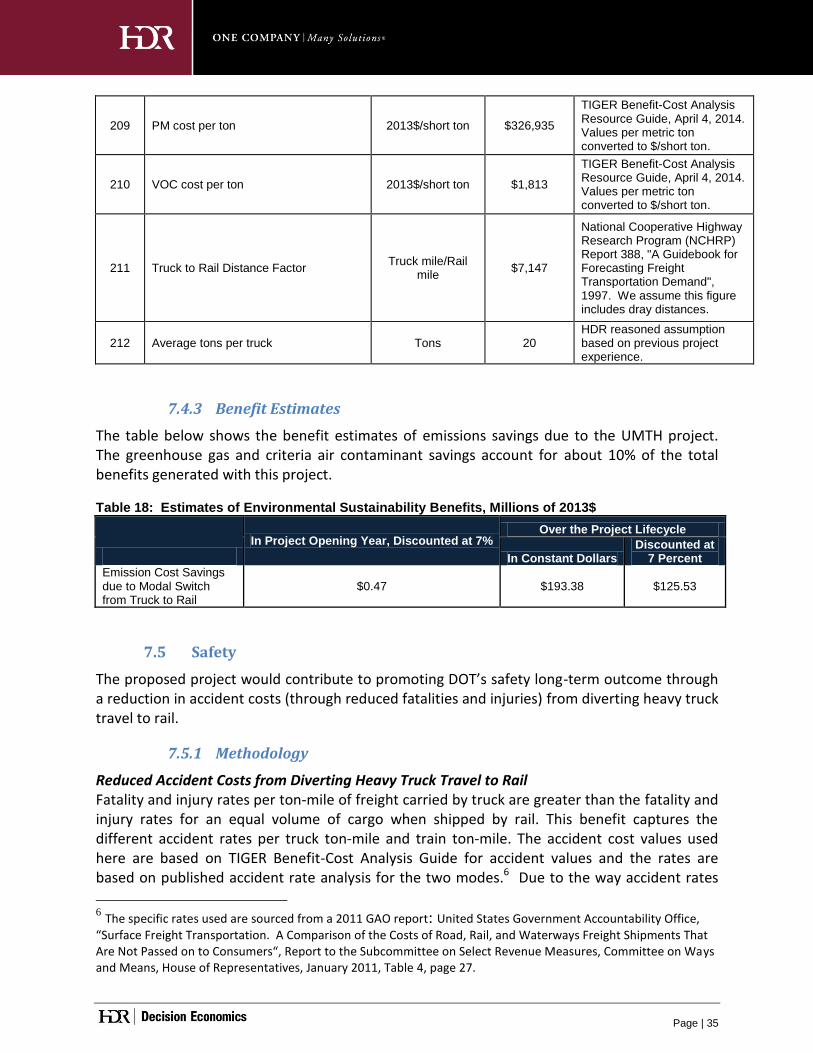
Page | 35
209 PM cost per ton 2013$/short ton $326,935
TIGER Benefit-Cost Analysis Resource Guide, April 4, 2014. Values per metric ton converted to $/short ton.
210 VOC cost per ton 2013$/short ton $1,813
TIGER Benefit-Cost Analysis Resource Guide, April 4, 2014. Values per metric ton converted to $/short ton.
211 Truck to Rail Distance Factor Truck mile/Rail
mile $7,147
National Cooperative Highway Research Program (NCHRP) Report 388, "A Guidebook for Forecasting Freight Transportation Demand", 1997. We assume this figure includes dray distances.
212 Average tons per truck Tons 20 HDR reasoned assumption based on previous project experience.
7.4.3 Benefit Estimates
The table below shows the benefit estimates of emissions savings due to the UMTH project. The greenhouse gas and criteria air contaminant savings account for about 10% of the total benefits generated with this project.
Table 18: Estimates of Environmental Sustainability Benefits, Millions of 2013$
In Project Opening Year, Discounted at 7%
Over the Project Lifecycle
In Constant Dollars Discounted at
7 Percent
Emission Cost Savings due to Modal Switch from Truck to Rail
$0.47 $193.38 $125.53
7.5 Safety
The proposed project would contribute to promoting DOT’s safety long-term outcome through a reduction in accident costs (through reduced fatalities and injuries) from diverting heavy truck travel to rail.
7.5.1 Methodology
Reduced Accident Costs from Diverting Heavy Truck Travel to Rail Fatality and injury rates per ton-mile of freight carried by truck are greater than the fatality and injury rates for an equal volume of cargo when shipped by rail. This benefit captures the different accident rates per truck ton-mile and train ton-mile. The accident cost values used here are based on TIGER Benefit-Cost Analysis Guide for accident values and the rates are based on published accident rate analysis for the two modes.6 Due to the way accident rates
6 The specific rates used are sourced from a 2011 GAO report: United States Government Accountability Office,
“Surface Freight Transportation. A Comparison of the Costs of Road, Rail, and Waterways Freight Shipments That Are Not Passed on to Consumers“, Report to the Subcommittee on Select Revenue Measures, Committee on Ways and Means, House of Representatives, January 2011, Table 4, page 27.
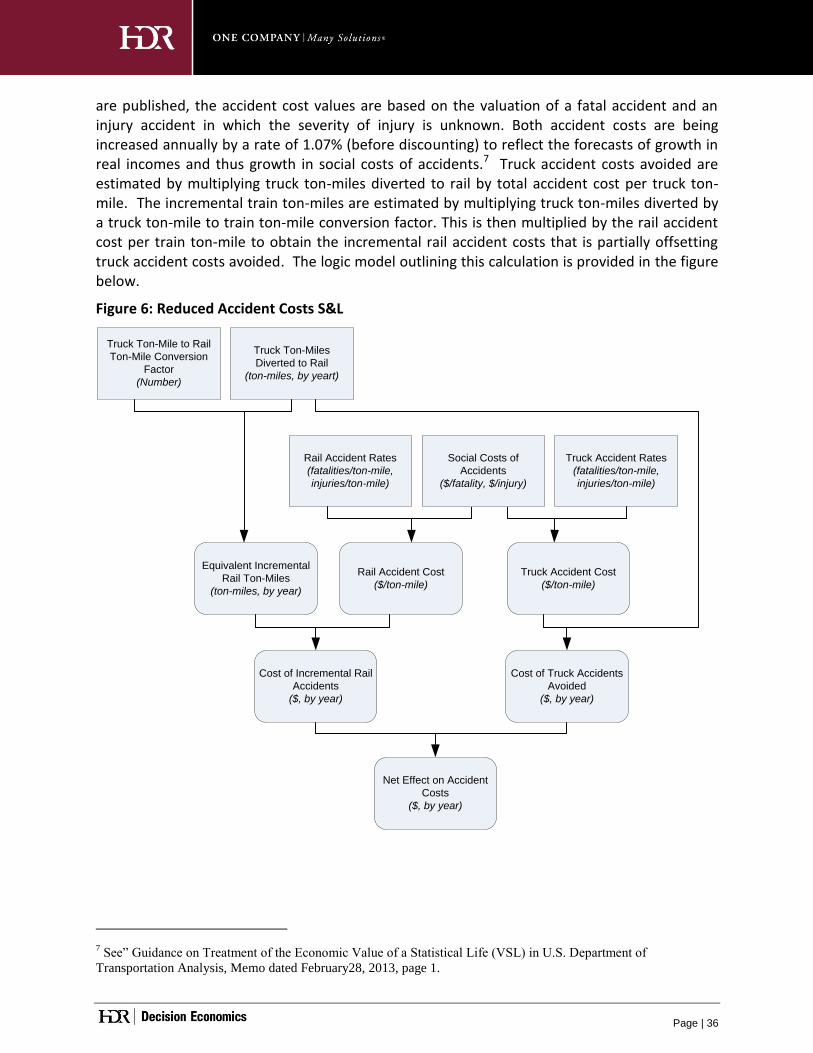
Page | 36
are published, the accident cost values are based on the valuation of a fatal accident and an injury accident in which the severity of injury is unknown. Both accident costs are being increased annually by a rate of 1.07% (before discounting) to reflect the forecasts of growth in real incomes and thus growth in social costs of accidents.7 Truck accident costs avoided are estimated by multiplying truck ton-miles diverted to rail by total accident cost per truck ton-mile. The incremental train ton-miles are estimated by multiplying truck ton-miles diverted by a truck ton-mile to train ton-mile conversion factor. This is then multiplied by the rail accident cost per train ton-mile to obtain the incremental rail accident costs that is partially offsetting truck accident costs avoided. The logic model outlining this calculation is provided in the figure below.
Figure 6: Reduced Accident Costs S&L
Truck Ton-Miles
Diverted to Rail
(ton-miles, by yeart)
Truck Accident Rates
(fatalities/ton-mile,
injuries/ton-mile)
Truck Ton-Mile to Rail
Ton-Mile Conversion
Factor
(Number)
Equivalent Incremental
Rail Ton-Miles
(ton-miles, by year)
Rail Accident Rates
(fatalities/ton-mile,
injuries/ton-mile)
Rail Accident Cost
($/ton-mile)
Truck Accident Cost
($/ton-mile)
Social Costs of
Accidents
($/fatality, $/injury)
Cost of Incremental Rail
Accidents
($, by year)
Cost of Truck Accidents
Avoided
($, by year)
Net Effect on Accident
Costs
($, by year)
7 See” Guidance on Treatment of the Economic Value of a Statistical Life (VSL) in U.S. Department of
Transportation Analysis, Memo dated February28, 2013, page 1.

Page | 37
7.5.2 Assumptions
The assumptions used in the estimation of safety benefits are summarized in the table below. Truck ton-miles diverted to rail were estimated in the same way as for other benefit categories.
Table 19: Assumptions used in the Estimation of Safety Benefits Input
# Input Name Units Value Source/Comment
1 Truck to Rail Distance Factor
Truck mile/Rail mile
0.83
National Cooperative Highway Research Program (NCHRP) Report 388, "A Guidebook for Forecasting Freight Transportation Demand", 1997. We assume this figure includes dray distances. This factor is applied to account for relatively longer rail routes for the same origin-destination (O-D) pair.
2 Fatalities per Billion Ton-Miles, Truck
fatalities/Btm 2.54
Surface Freight Transportation. A Comparison of the Costs of Road, Rail, and Waterways Freight Shipments That Are Not Passed on to Consumers, GAO, January 2011, Table 4.
3 Fatalities per Billion Ton-Miles, Rail
fatalities/Btm 0.39
4 Injuries per Billion Ton-Miles Truck
injuries/Btm 55.98
5 Injuries per Billion Ton-Miles Rail
injuries/Btm 3.32
6 Value of a Statistical Life 2013$ $9,200,000 US DOT, Guidance on Treatment of the Economic Value of a Statistical Life in U.S. Department of Transportation Analyses. 2013.
7 Average Cost per Accident Injury
2013$ $166,778 US DOT, Based on MAIS Injury Severity Scale and KACBO-AIS Conversion if Injury Unknown. Department of Transportation Analyses. 2013.
8 Accident Cost - Truck 2013$/per Million truck ton-miles
$32,704.25 Calculated from inputs above.
9 Accident Cost - Train 2013$/per Million truck ton-miles
$4,141.70 Calculated from inputs above.
10 Annual Growth in Real Accident Costs
% Annually 1.07% US DOT, Guidance on Treatment of the Economic Value of a Statistical Life in U.S. Department of Transportation Analyses. 2013.
7.5.3 Benefit Estimates
The table below shows the benefit estimates of improved safety due to the UMTH project. The reductions in accidents due to less truck miles account for about 39% of the total benefits generated with this project.
Table 20: Estimates of Safety Benefits, 2013$
In Project Opening Year, Discounted at 7%
Over the Project Lifecycle
In Constant Dollars Discounted at 7 Percent
Accident Cost Savings due to Modal Switch from Truck to Rail
$1.15 $1,264.62 $490.21

Page | 38
8. Summary of Findings and BCA Outcomes
The tables below summarize the BCA findings. Annual costs and benefits are computed over the lifecycle of the project (2014-2035). As stated earlier, construction is expected to be completed by the end of 2015. Benefits accrue during the full operation of the project and begin in 2016.
Table 21: Overall Results of the Benefit Cost Analysis, Millions of 2013$*
Project Evaluation Metric 7% Discount Rate 3% Discount Rate
Total Discounted Costs $223.6 $340.9
Total Discounted Benefits $1,266.4 $1,990.6
Net Present Value $1,042.8 $1,649.7
Benefit / Cost Ratio 5.66 5.84
Payback Period (years) 4
* Unless Specified Otherwise
Considering all monetized benefits and costs, with a 7 percent real discount rate, the $23.4 million of initial capital investment would result in $1,266.4 million in total benefits, net present value of $1,042.8 million, and a Benefit/Cost Ratio of 5.66.
With a 3 percent real discount rate, the Net Present Value of the project would increase to $1,649.7 million, for a Benefit/Cost ratio of 5.84.
Table 22: Benefit Estimates by Long-Term Outcome for the Full Project, Millions of 2013$
Long-Term Benefit Categories
7% Discount Rate
3% Discount Rate Outcomes
State of Good Repair Avoided Pavement Maintenance Costs $171.7 $274.7
Economic Competitiveness Shipper Savings due to Modal Switch from Truck to Rail
$371.5 $592.2
Quality of Life Reduced Road Congestion due to Modal Switch from Truck to Rail
$107.5 $172.0
Environmental Sustainability
Emission Cost Savings due to Modal Switch from Truck to Rail
$125.5 $128.4
Safety Accident Cost Savings due to Modal Switch from Truck to Rail
$490.2 $823.5
Total Benefit Estimates $1,266.4 $1,990.6
9. BCA Sensitivity/Alternative Analysis
The BCA outcomes presented in the previous sections rely on a large number of assumptions and long-term projections; both of which are subject to considerable uncertainty.
The primary purpose of the sensitivity analysis is to help identify the variables and model parameters whose variations have the greatest impact on the BCA outcomes: the “critical variables.”
The sensitivity analysis can also be used to:
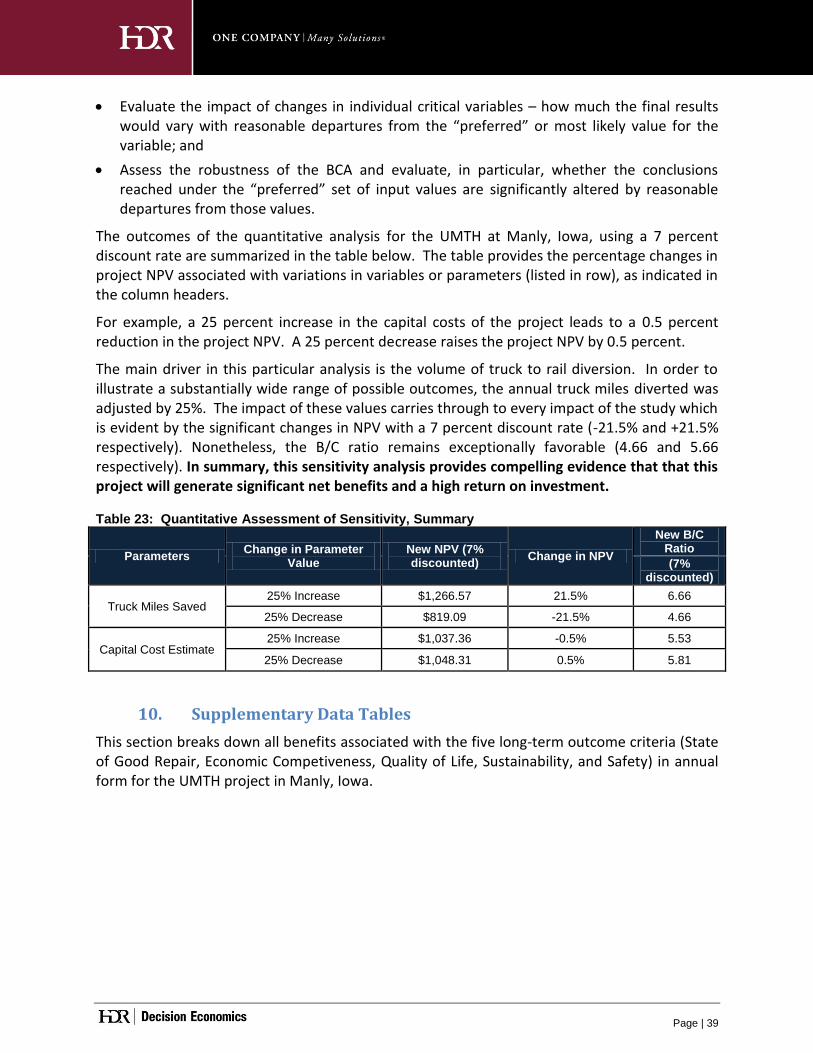
Page | 39
Evaluate the impact of changes in individual critical variables – how much the final results would vary with reasonable departures from the “preferred” or most likely value for the variable; and
Assess the robustness of the BCA and evaluate, in particular, whether the conclusions reached under the “preferred” set of input values are significantly altered by reasonable departures from those values.
The outcomes of the quantitative analysis for the UMTH at Manly, Iowa, using a 7 percent discount rate are summarized in the table below. The table provides the percentage changes in project NPV associated with variations in variables or parameters (listed in row), as indicated in the column headers.
For example, a 25 percent increase in the capital costs of the project leads to a 0.5 percent reduction in the project NPV. A 25 percent decrease raises the project NPV by 0.5 percent.
The main driver in this particular analysis is the volume of truck to rail diversion. In order to illustrate a substantially wide range of possible outcomes, the annual truck miles diverted was adjusted by 25%. The impact of these values carries through to every impact of the study which is evident by the significant changes in NPV with a 7 percent discount rate (-21.5% and +21.5% respectively). Nonetheless, the B/C ratio remains exceptionally favorable (4.66 and 5.66 respectively). In summary, this sensitivity analysis provides compelling evidence that that this project will generate significant net benefits and a high return on investment.
Table 23: Quantitative Assessment of Sensitivity, Summary
Parameters Change in Parameter
Value New NPV (7% discounted)
Change in NPV
New B/C Ratio
(7% discounted)
Truck Miles Saved 25% Increase $1,266.57 21.5% 6.66
25% Decrease $819.09 -21.5% 4.66
Capital Cost Estimate 25% Increase $1,037.36 -0.5% 5.53
25% Decrease $1,048.31 0.5% 5.81
10. Supplementary Data Tables
This section breaks down all benefits associated with the five long-term outcome criteria (State of Good Repair, Economic Competiveness, Quality of Life, Sustainability, and Safety) in annual form for the UMTH project in Manly, Iowa.

Page | 40
10.1 Annual Estimates of Total Project Benefits and Costs
Calendar Year Project Year Total Undiscounted Benefits ($2013)
Total Undiscounted Costs ($2013)
Undiscounted Net Benefits ($2013)
Discounted Net Benefits at 7%
Discounted Net Benefits at 3%
2014 1 $0 -$934,673 -$934,673 -$934,673 -$934,673
2015 2 $0 -$22,432,150 -$22,432,150 -$20,964,626 -$21,778,786
2016 3 $8,602,937 -$2,860,000 $5,742,937 $4,840,181 $5,313,588
2017 4 $55,615,304 -$9,622,500 $45,992,804 $36,612,427 $41,482,171
2018 5 $78,973,397 -$13,767,250 $65,206,147 $48,677,363 $57,108,595
2019 6 $83,859,428 -$15,291,147 $68,568,280 $48,012,539 $58,315,953
2020 7 $94,112,002 -$17,121,219 $76,990,783 $50,550,155 $63,574,693
2021 8 $107,805,305 -$19,295,385 $88,509,919 $54,476,960 $70,959,132
2022 9 $121,009,729 -$20,838,410 $100,171,320 $57,841,174 $77,949,132
2023 10 $132,830,948 -$22,503,275 $110,327,672 $59,759,493 $83,325,114
2024 11 $142,547,149 -$24,339,725 $118,207,424 $60,082,569 $86,667,738
2025 12 $159,011,768 -$26,448,890 $132,562,878 $63,240,594 $94,362,945
2026 13 $177,535,632 -$27,417,019 $150,118,613 $67,223,807 $103,762,096
2027 14 $182,449,349 -$27,813,896 $154,635,452 $65,065,463 $103,769,034
2028 15 $187,328,319 -$28,225,163 $159,103,156 $62,873,197 $103,653,633
2029 16 $192,357,336 -$28,650,954 $163,706,382 $60,770,419 $103,542,482
2030 17 $197,541,592 -$29,091,414 $168,450,177 $58,753,623 $103,436,042
2031 18 $202,677,542 -$29,546,697 $173,130,845 $56,694,611 $103,208,338
2032 19 $208,326,732 -$30,016,963 $178,309,769 $54,943,465 $103,197,389
2033 20 $213,928,009 -$30,502,382 $183,425,627 $53,143,268 $103,062,120
2034 21 $219,696,254 -$31,003,133 $188,693,120 $51,416,031 $102,929,704
2035 22 $225,624,253 -$31,519,404 $194,104,849 $49,755,769 $102,793,663
Total $2,991,832,983 -$489,241,649 $2,502,591,334 $1,042,833,810 $1,649,700,104

Page | 41
10.2 Annual Demand Projections
Calendar Year Project Year Truck Miles Saved Per Year
2014 1 0
2015 2 0
2016 (opening) 3 6,412,500
2017 4 39,843,750
2018 5 55,200,000
2019 6 56,623,594
2020 7 62,716,431
2021 8 71,243,705
2022 9 81,215,533
2023 10 90,464,645
2024 11 96,519,828
2025 12 107,028,041
2026 13 118,770,386
2027 14 121,205,191
2028 15 123,690,177
2029 16 126,226,384
2030 17 128,814,876
2031 18 131,456,737
2032 19 134,153,074
2033 20 136,905,018
2034 21 139,713,723
2035 22 142,580,367

Page | 42
10.3 Benefit Estimates – Undiscounted Values
Calendar Year Project Year
Avoided Pavement
Maintenance Costs
Shipper Savings due to Modal Switch from
Truck to Rail
Emission Cost Savings due to Modal Switch from Truck to
Rail
Accident Cost Savings due to Modal Switch
from Truck to Rail
Reduced Road Congestion due to Modal Switch from
Truck to Rail
2014 1 $0 $0 $0 $0 $0
2015 2 $0 $0 $0 $0 $0
2016 (opening) 3 $1,321,502 $2,315,625 $507,648 $3,630,822 $827,340
2017 4 $8,211,086 $16,335,938 $3,126,318 $22,801,324 $5,140,637
2018 5 $11,375,736 $24,150,000 $4,398,534 $31,927,228 $7,121,899
2019 6 $11,669,113 $27,184,336 $4,599,353 $33,101,054 $7,305,571
2020 7 $12,924,738 $30,934,456 $5,106,038 $37,055,101 $8,091,669
2021 8 $14,682,057 $35,621,852 $5,765,822 $42,543,716 $9,191,857
2022 9 $16,737,073 $37,959,434 $6,817,398 $49,017,402 $10,478,421
2023 10 $18,643,150 $39,578,282 $7,753,880 $55,183,894 $11,671,741
2024 11 $19,891,016 $42,227,425 $8,468,152 $59,507,576 $12,452,980
2025 12 $22,056,571 $46,824,768 $9,629,400 $66,692,280 $13,808,749
2026 13 $24,476,459 $51,962,044 $10,972,209 $74,801,176 $15,323,745
2027 14 $24,978,229 $53,027,271 $11,654,578 $77,151,388 $15,637,884
2028 15 $25,490,340 $54,114,452 $12,189,416 $79,575,614 $15,958,496
2029 16 $26,013,007 $55,224,043 $12,758,376 $82,076,191 $16,285,718
2030 17 $26,546,449 $56,356,508 $13,363,418 $84,655,531 $16,619,685
2031 18 $27,090,890 $57,512,322 $13,797,672 $87,316,121 $16,960,537
2032 19 $27,646,557 $58,691,970 $14,619,261 $90,060,526 $17,308,419
2033 20 $28,213,683 $59,895,945 $15,263,511 $92,891,395 $17,663,474
2034 21 $28,792,507 $61,124,754 $15,941,682 $95,811,458 $18,025,853
2035 22 $29,383,271 $62,378,911 $16,642,831 $98,823,533 $18,395,707
Total $406,143,435 $873,420,336 $193,375,497 $1,264,623,330 $254,270,385

Page | 43
10.4 Benefit Estimates – Discounted Values (at 7 Percent)
Calendar Year Project Year
Avoided Pavement
Maintenance Costs
Shipper Savings due to Modal Switch from
Truck to Rail
Emission Cost Savings due to Modal Switch
from Truck to Rail
Accident Cost Savings due to Modal Switch
from Truck to Rail
Reduced Road Congestion due to Modal Switch from
Truck to Rail
2014 1 $0 $0 $0 $0 $0
2015 2 $0 $0 $0 $0 $0
2016 (opening) 3 $1,154,251 $2,022,557 $474,945 $2,963,832 $722,631
2017 4 $6,702,692 $13,334,991 $2,838,258 $17,395,021 $4,196,291
2018 5 $8,678,494 $18,423,919 $3,880,984 $22,763,672 $5,433,263
2019 6 $8,319,916 $19,382,056 $3,947,542 $22,056,630 $5,208,771
2020 7 $8,612,299 $20,612,934 $4,265,638 $23,076,054 $5,391,821
2021 8 $9,143,247 $22,183,499 $4,681,353 $24,760,830 $5,724,227
2022 9 $9,741,129 $22,092,736 $5,374,697 $26,662,219 $6,098,537
2023 10 $10,140,639 $21,527,963 $5,929,835 $28,052,693 $6,348,654
2024 11 $10,111,584 $21,466,281 $6,275,702 $28,271,621 $6,330,464
2025 12 $10,478,918 $22,246,110 $6,908,636 $29,612,170 $6,560,437
2026 13 $10,867,840 $23,071,769 $7,613,927 $31,039,829 $6,803,926
2027 14 $10,365,077 $22,004,432 $7,827,928 $29,920,638 $6,489,166
2028 15 $9,885,593 $20,986,518 $7,916,447 $28,841,864 $6,188,980
2029 16 $9,428,311 $20,015,735 $8,006,059 $27,802,046 $5,902,694
2030 17 $8,992,201 $19,089,899 $8,096,356 $26,799,773 $5,629,662
2031 18 $8,576,282 $18,206,928 $8,062,167 $25,833,689 $5,369,272
2032 19 $8,179,619 $17,364,836 $8,256,524 $24,902,486 $5,120,937
2033 20 $7,801,319 $16,561,728 $8,325,384 $24,004,902 $4,884,098
2034 21 $7,440,531 $15,795,798 $8,393,557 $23,139,721 $4,658,223
2035 22 $7,096,445 $15,065,323 $8,457,773 $22,305,772 $4,442,804
Total $371,456,013 $125,533,710 $490,205,464 $107,504,856

Page | 44
Recommended