A-1
Appendix A Test frame fabrication drawings
This appendix provides the drawings that were provided to the fabricators to fabricate the
test frame. The drawings for the first-storey brace are included after the drawings for the
rest of the frame because the original intent was to lock the SCED brace closed for tests in
the 0V configurations. A conventional brace was used instead after calibration of the
SCED brace showed that the planned lock-off device was not effective.
UNIVERSITY of TORONTODepartment of Civil Engineering Rocking Steel Frame
Project Title
Bill of Materials 1/5Drawing Title
4 2010/07/08
LDWDesigner Drawing No.
REV Date
LW05-BM1ÉCOLE POLYTECHNIQUE MONTRÉAL
Départment des génies civil, géologique et des mines
Rocking Steel Frame
Départment des génies civil, géologique et des minesÉCOLE POLYTECHNIQUE MONTRÉAL
UNIVERSITY of TORONTODepartment of Civil Engineering
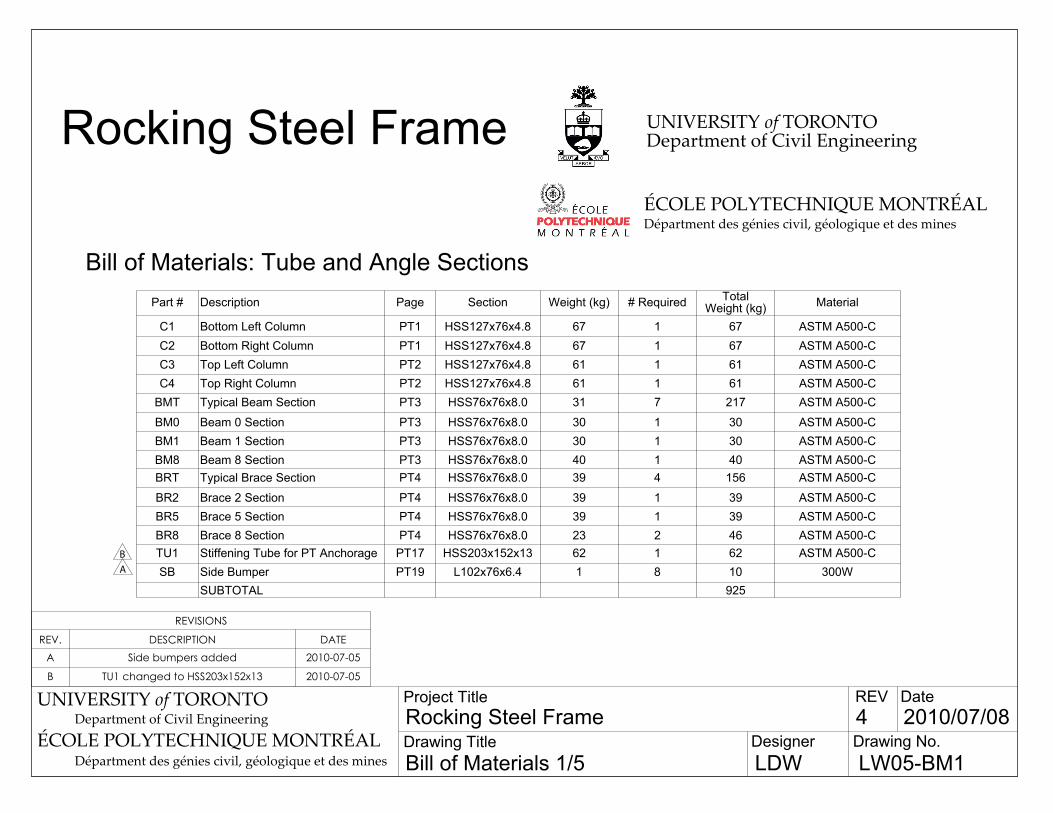
Bill of Materials: Tube and Angle Sections
AB
Part # Description Page Section Weight (kg) # Required TotalWeight (kg) Material
C1 Bottom Left Column PT1 HSS127x76x4.8 67 1 67 ASTM A500-CC2 Bottom Right Column PT1 HSS127x76x4.8 67 1 67 ASTM A500-CC3 Top Left Column PT2 HSS127x76x4.8 61 1 61 ASTM A500-CC4 Top Right Column PT2 HSS127x76x4.8 61 1 61 ASTM A500-C
BMT Typical Beam Section PT3 HSS76x76x8.0 31 7 217 ASTM A500-C
BM0 Beam 0 Section PT3 HSS76x76x8.0 30 1 30 ASTM A500-CBM1 Beam 1 Section PT3 HSS76x76x8.0 30 1 30 ASTM A500-CBM8 Beam 8 Section PT3 HSS76x76x8.0 40 1 40 ASTM A500-CBRT Typical Brace Section PT4 HSS76x76x8.0 39 4 156 ASTM A500-C
BR2 Brace 2 Section PT4 HSS76x76x8.0 39 1 39 ASTM A500-CBR5 Brace 5 Section PT4 HSS76x76x8.0 39 1 39 ASTM A500-CBR8 Brace 8 Section PT4 HSS76x76x8.0 23 2 46 ASTM A500-CTU1 Stiffening Tube for PT Anchorage PT17 HSS203x152x13 62 1 62 ASTM A500-CSB Side Bumper PT19 L102x76x6.4 1 8 10 300W
SUBTOTAL 925
REVISIONS
REV. DESCRIPTION DATEA Side bumpers added 2010-07-05
B TU1 changed to HSS203x152x13 2010-07-05

Rocking Steel Frame
Départment des génies civil, géologique et des minesÉCOLE POLYTECHNIQUE MONTRÉAL
UNIVERSITY of TORONTODepartment of Civil Engineering
Bill of Materials: Plates (1/3)
Part # Description Page Plate Thickness (inches) Weight (kg) # Required Total
Weight (kg) Material
CPTS Typical Short Connection Plate PT5 0.5 7 6 43 300WCPTL Typical Long Connection Plate PT5 0.5 8.5 5 43 300W
CP0 Connection Plate for Beam 0 PT6 0.75 12 2 24 300WCP1L Long Connection Plate for Beam 1 PT6 0.5 9 1 9 300WCP4L Long Connection Plate for Beam 4 PT7 0.5 8 1 8 300W
CP4S Short Connection Plate for Beam 4 PT7 0.5 7 1 7 300W
CP4U Connection Plate for Beam 4U PT7 0.5 7 2 14 300WGBR Typical Gusset Plate with Braces PT8 0.5 13 1 13 300W
GNO Typical Gusset Plate without Braces PT8 0.5 6 2 13 300W
GMBR Typical Mass-Connecting Gusset Plate with Braces PT8 0.5 13 2 26 300W
GMNO Typical Mass-Connecting Gusset Plate without Braces PT8 0.5 6 3 18 300W
G8 Storey 8 Gusset Plate PT9 0.5 14 1 14 300W
G4NO Storey 4 Gusset Plate without Braces PT9 0.5 13 1 13 300W
G1 Storey 1 Gusset Plate PT9 0.5 21 1 21 300WG4BR Storey 4 Gusset Plate with Braces PT9 0.5 14 1 14 300W
SUBTOTAL 280
UNIVERSITY of TORONTODepartment of Civil Engineering Rocking Steel Frame
Project Title
Bill of Materials 2/5Drawing Title
3 2010/06/26
LDWDesigner Drawing No.
REV Date
LW05-BM2ÉCOLE POLYTECHNIQUE MONTRÉAL
Départment des génies civil, géologique et des mines

Rocking Steel Frame
Départment des génies civil, géologique et des minesÉCOLE POLYTECHNIQUE MONTRÉAL
UNIVERSITY of TORONTODepartment of Civil Engineering
Bill of Materials: Plates (2/3)
A
Part # Description Page Plate Thickness (inches) Weight (kg) # Required Total
Weight (kg) Material
G5 Storey 5 Gusset Plate PT10 0.5 13 1 13 300WGE8 Storey 8 End Plate PT10 0.5 2 1 2 300W
G7BR Storey 7 Gusset Plate with Braces PT10 0.5 11 1 11 300W
G7NO Storey 7 Gusset Plate without Braces PT10 0.5 11 1 11 300W
P1 PT Anchorage Plate PT12 0.5 4 2 7 300W
P2 Top Plate PT12 0.75 30 2 61 300W
P3 Upper Joint Vertical Stiffener PT12 0.5 1 12 17 300W
P4 Upper Joint Horizontal Stiffener PT12 0.5 2 4 8 300W
P5 Small Stiffener PT12 0.5 1 12 7 300W
P7 Base Plate PT13 0.75 6 2 11 300W
P8 Base Plate for Upper Rocking Section PT13 0.75 6 2 11 300W
P9 Cap Plate PT13 1.5 18 2 36 300W
SUBTOTAL 195
REVISIONS
REV. DESCRIPTION DATEA P9 redesigned using PL 1.5" 2010-08-30
UNIVERSITY of TORONTODepartment of Civil Engineering Rocking Steel Frame
Project Title
Bill of Materials 3/5Drawing Title
4 2010/08/30
LDWDesigner Drawing No.
REV Date
LW05-BM3ÉCOLE POLYTECHNIQUE MONTRÉAL
Départment des génies civil, géologique et des mines
Rocking Steel Frame
Départment des génies civil, géologique et des minesÉCOLE POLYTECHNIQUE MONTRÉAL
UNIVERSITY of TORONTODepartment of Civil Engineering
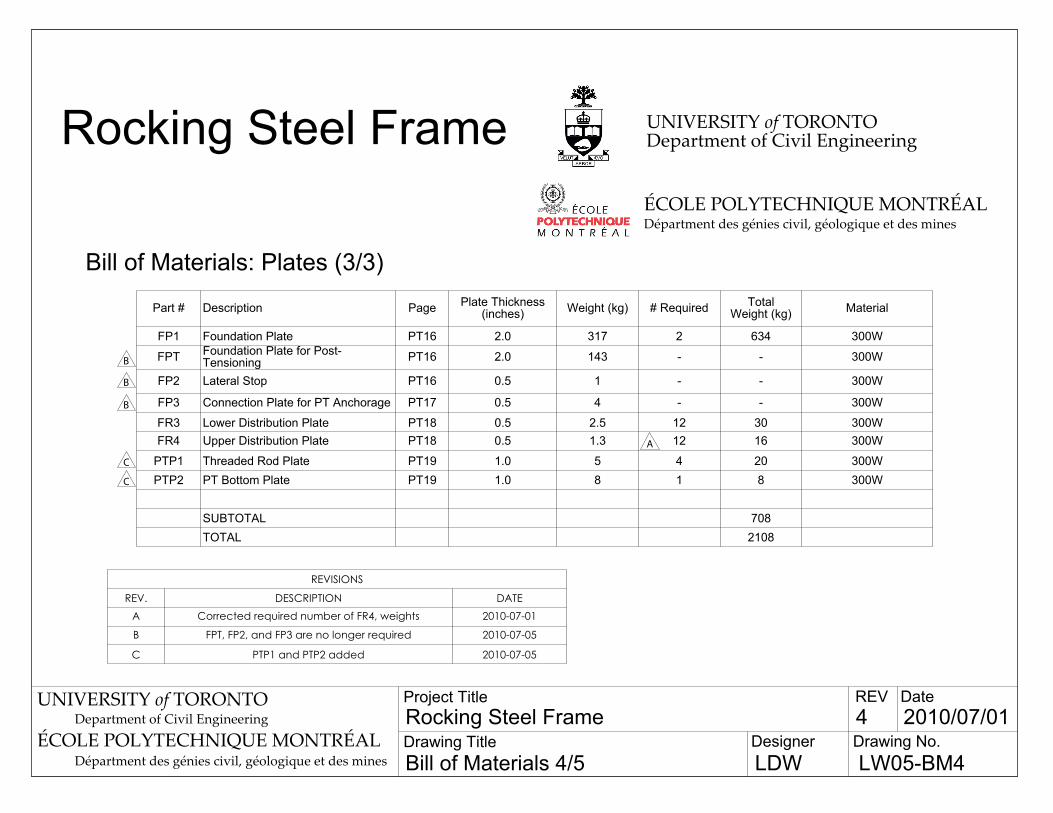
Bill of Materials: Plates (3/3)
A
B
B
C
C
B
Part # Description Page Plate Thickness (inches) Weight (kg) # Required Total
Weight (kg) Material
FP1 Foundation Plate PT16 2.0 317 2 634 300W
FPT Foundation Plate for Post-Tensioning PT16 2.0 143 - - 300W
FP2 Lateral Stop PT16 0.5 1 - - 300W
FP3 Connection Plate for PT Anchorage PT17 0.5 4 - - 300W
FR3 Lower Distribution Plate PT18 0.5 2.5 12 30 300WFR4 Upper Distribution Plate PT18 0.5 1.3 12 16 300W
PTP1 Threaded Rod Plate PT19 1.0 5 4 20 300WPTP2 PT Bottom Plate PT19 1.0 8 1 8 300W
SUBTOTAL 708TOTAL 2108
REVISIONS
REV. DESCRIPTION DATEA Corrected required number of FR4, weights 2010-07-01
B FPT, FP2, and FP3 are no longer required 2010-07-05
C PTP1 and PTP2 added 2010-07-05
UNIVERSITY of TORONTODepartment of Civil Engineering Rocking Steel Frame
Project Title
Bill of Materials 4/5Drawing Title
4 2010/07/01
LDWDesigner Drawing No.
REV Date
LW05-BM4ÉCOLE POLYTECHNIQUE MONTRÉAL
Départment des génies civil, géologique et des mines

Rocking Steel Frame
Départment des génies civil, géologique et des minesÉCOLE POLYTECHNIQUE MONTRÉAL
UNIVERSITY of TORONTODepartment of Civil Engineering
Bill of Materials: For Machine Shop
A
Part # Description Page Plate Thickness (inches) Weight (kg) # Required Total
Weight (kg) Material
SP1 Shear Bearing Plate without Braces PT11 1.5 43 1 43 350W
SP2 Shear Bearing Plate with Braces PT11 1.5 67 1 67 350W
SP3 Upper Shear Bearing Plate without Braces PT11 1.0 25 1 25 350W
SP4 Upper Shear Bearing Plate with Braces PT11 1.0 30 1 30 350W
P6 Mass Connection Plate PT13 1.5 3 8 24 350WP10 Mass Strut Bolt Holder PT13 0.625 0.5 16 8 350W
BP1 Horizontal Plate for Lower Bumper PT14 0.75 20 2 40 350W
BP2 Vertical Plate for Lower Bumper PT14 1.5 12 2 24 350WBP3 Stiffener for Lower Bumper PT14 1.75 4 2 8 350W
BP4 Horizontal Plate for Upper Bumper PT15 0.75 12 2 24 350W
BP5 Vertical Plate for Upper Bumper PT15 0.75 4 2 8 350W
BP6 Stiffener for Upper Bumper PT15 1.25 4 2 8 350W
FR1 Lower Friction Plate PT18 0.5 6 4 22 350WFR2 Upper Friction Plate PT18 0.5 4 4 16 350W
TOTAL FOR MACHINE SHOP 347
REVISIONS
REV. DESCRIPTION DATEA P6 is made from 1.5" plate 2010-07-08
UNIVERSITY of TORONTODepartment of Civil Engineering Rocking Steel Frame
Project Title
Bill of Materials 5/5Drawing Title
4 2010/07/08
LDWDesigner Drawing No.
REV Date
LW05-BM5ÉCOLE POLYTECHNIQUE MONTRÉAL
Départment des génies civil, géologique et des mines

Rocking Steel Frame
Départment des génies civil, géologique et des minesÉCOLE POLYTECHNIQUE MONTRÉAL
UNIVERSITY of TORONTODepartment of Civil Engineering
Bill of Materials: Bolt Assemblies
A
A
B
Connection Bolt Type Bolt Length # Required Note
Foundation Plate to Table 1" threaded rod 17 at EPM
Mass Connection Pins 1" A325 4" 8 at EPM
Lower Bumper to Foundation Plate (tapped holes) 3/4" A325 2" 24
Lower Friction Assembly - Pin through Stiffener 3/4" A325 4" 2 at EPM
Lower Friction Assembly - Normal Force on Friction Interface 3/4" A325 6 3/4" 4 possible?
Lower PT Anchorage 3/4" A325 2" -
SCED Brace - Lower Connection 3/4" A325 3" 4
SCED Brace - Upper Connection 3/4" A325 2 1/2" 4
SCED Lock-Off (to plate on SCED) 3/4" A325 2 1/2" 8
SCED Lock-Off (to gusset plate) 3/4" A325 5" 2Upper Section Lock-Off (in P8) 3/4" A325 2 1/2" 8Upper Bumper to Top Plate 3/4" A325 2 1/2" 12
Upper Friction Assembly - Pin through Stiffener 3/4" A325 3 1/2" 2 at EPM
Upper Friction Assembly - Normal Force on Friction Interface 3/4" A325 6 1/4" 2
REVISIONS
REV. DESCRIPTION DATE
A Pins to be machined. 2010-07-05B Bolts not needed for lower anchorage 2010-07-22
UNIVERSITY of TORONTODepartment of Civil Engineering Rocking Steel Frame
Project Title
Bill of Material: BoltsDrawing Title
2 2010/07/05
LDWDesigner Drawing No.
REV Date
LW05-BM6ÉCOLE POLYTECHNIQUE MONTRÉAL
Départment des génies civil, géologique et des mines

Rocking Steel Frame
Départment des génies civil, géologique et des minesÉCOLE POLYTECHNIQUE MONTRÉAL
UNIVERSITY of TORONTODepartment of Civil Engineering
Bill of Materials: Stainless SteelPart # Description Page Plate Thickness # Required Material
SS1 Long Stainless Steel Sheet PT20 14 ga 4 Stainless Steel Grade 304-2B
SS2 Short Stainless Steel Sheet PT20 14 ga 4 Stainless Steel Grade 304-2B
UNIVERSITY of TORONTODepartment of Civil Engineering Rocking Steel Frame
Project Title
Bill of Materials: Stainless SteelDrawing Title
1 2010/07/15
LDWDesigner Drawing No.
REV Date
LW05-BM7ÉCOLE POLYTECHNIQUE MONTRÉAL
Départment des génies civil, géologique et des mines
REVISIONS
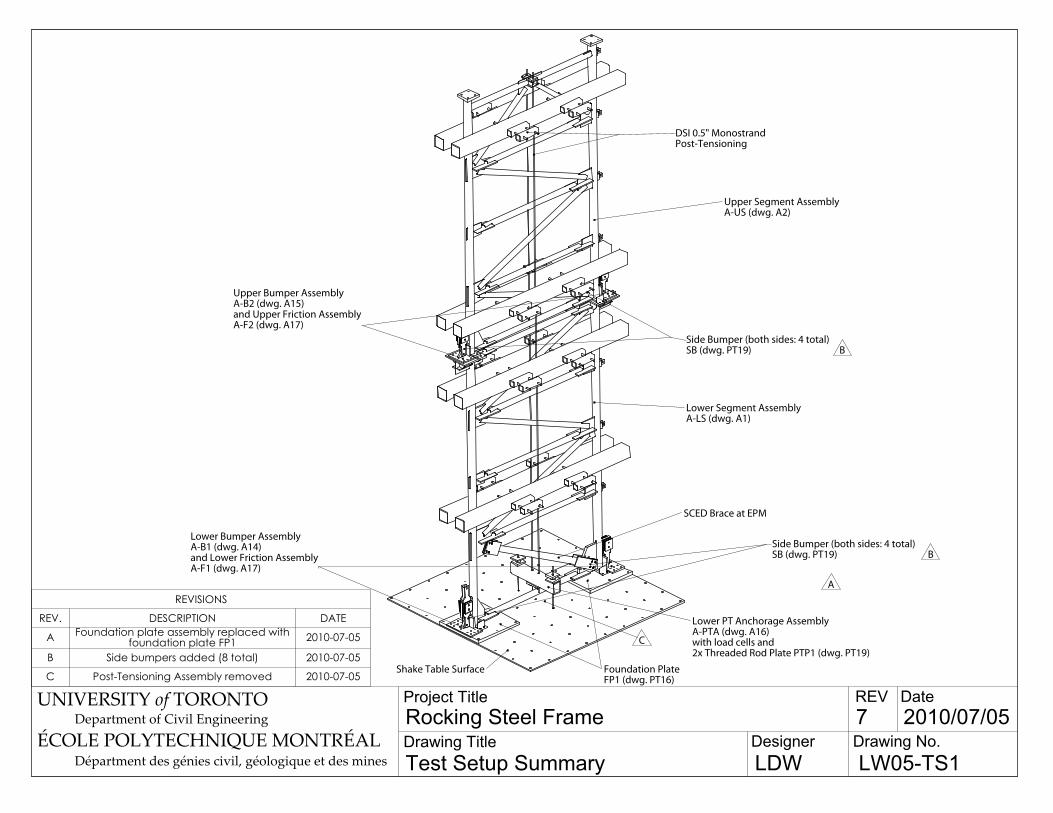
REV. DESCRIPTION DATE
A Foundation plate assembly replaced with foundation plate FP1 2010-07-05
B Side bumpers added (8 total) 2010-07-05
C Post-Tensioning Assembly removed 2010-07-05
UNIVERSITY of TORONTODepartment of Civil Engineering Rocking Steel Frame
Project Title
Test Setup SummaryDrawing Title
7 2010/07/05
LDWDesigner Drawing No.
REV Date
LW05-TS1ÉCOLE POLYTECHNIQUE MONTRÉAL
Départment des génies civil, géologique et des mines
Shake Table Surface
SCED Brace at EPM
Foundation PlateFP1 (dwg. PT16)
Lower Segment AssemblyA-LS (dwg. A1)
Upper Segment AssemblyA-US (dwg. A2)
DSI 0.5" MonostrandPost-Tensioning
Upper Bumper AssemblyA-B2 (dwg. A15)and Upper Friction AssemblyA-F2 (dwg. A17)
Lower PT Anchorage AssemblyA-PTA (dwg. A16)with load cells and2x Threaded Rod Plate PTP1 (dwg. PT19)
Side Bumper (both sides: 4 total)SB (dwg. PT19)
Side Bumper (both sides: 4 total)SB (dwg. PT19)
A
B
B
Lower Bumper AssemblyA-B1 (dwg. A14)and Lower Friction AssemblyA-F1 (dwg. A17)
C

REVISIONS
REV. DESCRIPTION DATE
A Moved top plate assembly to dwgs. A3 & A4. 2010-07-05
UNIVERSITY of TORONTODepartment of Civil Engineering Rocking Steel Frame
Project Title
Lower Segment AssemblyDrawing Title
7
LDWDesigner Drawing No.
REV Date
LW05-A1ÉCOLE POLYTECHNIQUE MONTRÉAL
Départment des génies civil, géologique et des mines
All dimensions in mm [inches] unless otherwise noted
2010/07/05
3D VIEW
Bottom LeftColumn AssemblyA-C1 (dwg. A3)
LOWER SEGMENT ASSEMBLYA-LS - SCALE 1:50
Bottom RightColumn AssemblyA-C2 (dwg. A4)
Beam 0 AssemblyA-BM0 (dwg. A7)
Beam 1 AssemblyA-BM1 (dwg. A8)(long end at gusset with brace)
Typical Beam AssemblyA-BMT (dwg. A7)(long end at gusset with braces)
Beam 4 AssemblyA-BM4 (dwg. A8)(long end at gusset with brace)
Typical Brace SectionBRT (dwg. PT4)
Brace 2 SectionBR2 (dwg. PT4)
A A
8
8
8
8
8
8
8
8
8
8
8
2700
1380
1125
1125
1125
325
7469
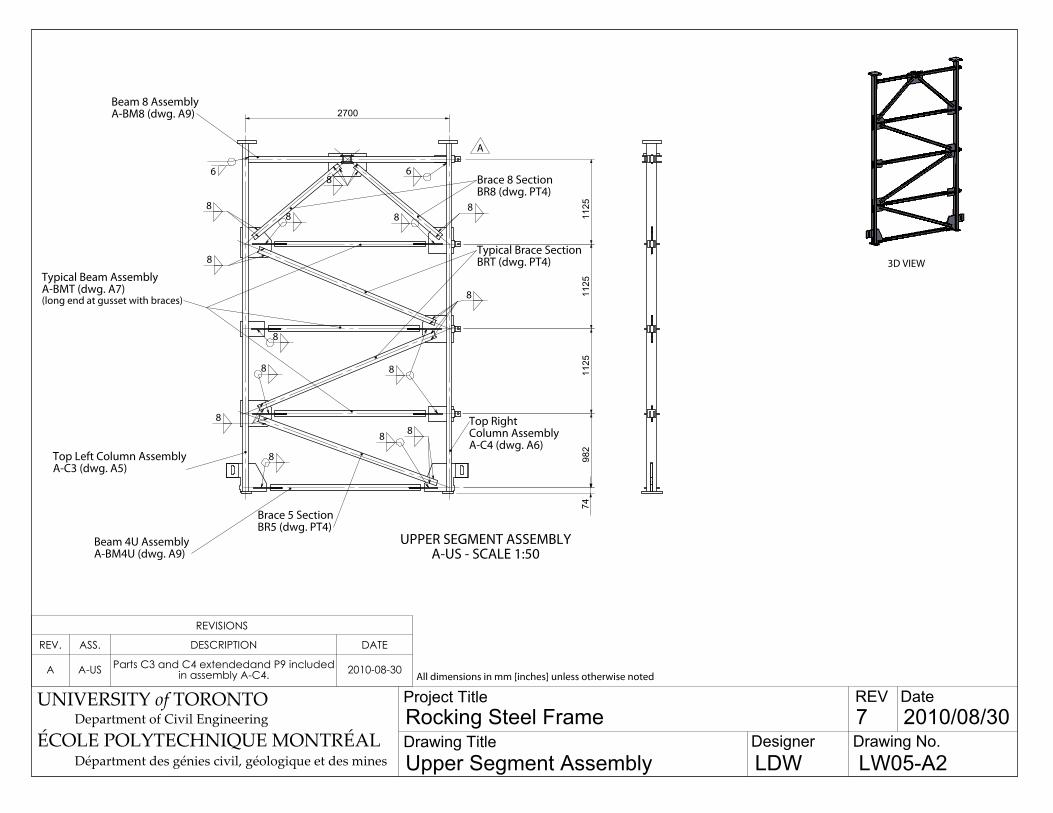
UPPER SEGMENT ASSEMBLYA-US - SCALE 1:50
REVISIONS
REV. ASS. DESCRIPTION DATE
A A-US Parts C3 and C4 extendedand P9 included in assembly A-C4. 2010-08-30
UNIVERSITY of TORONTODepartment of Civil Engineering Rocking Steel Frame
Project Title
Upper Segment AssemblyDrawing Title
7 2010/08/30
LDWDesigner Drawing No.
REV Date
LW05-A2ÉCOLE POLYTECHNIQUE MONTRÉAL
Départment des génies civil, géologique et des mines
All dimensions in mm [inches] unless otherwise noted
Top Left Column AssemblyA-C3 (dwg. A5)
Top RightColumn AssemblyA-C4 (dwg. A6)
Typical Beam AssemblyA-BMT (dwg. A7)(long end at gusset with braces)
Beam 4U AssemblyA-BM4U (dwg. A9)
Beam 8 AssemblyA-BM8 (dwg. A9)
Brace 5 SectionBR5 (dwg. PT4)
Typical Brace SectionBRT (dwg. PT4)
Brace 8 SectionBR8 (dwg. PT4)
A
8
8 88
8 8
8
8
8
8
8 88
86 6
2700
982
1125
1125
1125
74
3D VIEW

BOTTOM LEFT COLUMN ASSEMBLYA-C1 - SCALE 1:20
REVISIONS
REV. DESCRIPTION DATE
A References for SP1 2010-07-01
B Noted P4 on both sides (2 total) 2010-07-01
C Moved top plate assembly, together with associated dimensions and welds. 2010-07-05
D New drawing to clarify location of P2 2010-09-08
UNIVERSITY of TORONTODepartment of Civil Engineering Rocking Steel Frame
Project Title
Bottom Left Column AssemblyDrawing Title
10 2010/09/08
LDWDesigner Drawing No.
REV Date
LW05-A3ÉCOLE POLYTECHNIQUE MONTRÉAL
Départment des génies civil, géologique et des mines
All dimensions in mm [inches] unless otherwise noted
Typical Gusset Plate with BracesGBR (dwg. PT8)
Typical Gusset Plate without BracesGNO (dwg. PT8)
Storey 1 Gusset PlateG1 (dwg. PT9)
Base PlateP7 (dwg. PT13)
Shear Bearing Platewithout BracesSP1 (dwg. PT11)(to be providedby machine shop)
Bottom Left Column SectionC1 (dwg. PT1)
Storey 4 Gusset Plate without BracesG4NO (dwg. PT9)
Upper JointVertical Stiffener(3 each side)P3 (dwg. PT12)
Upper JointHorizontal Stiffener(1 each side)P4 (dwg. PT12)
SEE DETAILDWG A18
6 6 6
6
8
6
8
23 23 23
287
4515
5
50
60 22
294
262 221
301 22
2
8
1300 1050 1125 100 125116019
3D VIEW

BOTTOM RIGHT COLUMN ASSEMBLYA-C2 - SCALE 1:20
3D VIEW
SEE DETAILDWG A19
REVISIONS
REV. DESCRIPTION DATEA Noted SP2 to be provided by shop 2010-07-01
B Noted P4 on both sides (2 total) 2010-07-01
C Moved top plate assembly from dwg. A1, together with dimensions and welds 2010-07-05
D Top plate assembly replaced by plate only, noted detail drawing A19 2010-11-23
UNIVERSITY of TORONTODepartment of Civil Engineering Rocking Steel Frame
Project Title
Bottom Right Column AssemblyDrawing Title
10 2010/11/23
LDWDesigner Drawing No.
REV Date
LW05-A4ÉCOLE POLYTECHNIQUE MONTRÉAL
Départment des génies civil, géologique et des mines
All dimensions in mm [inches] unless otherwise noted
CD
8
1435 1125 1125 1125
50
19
Base PlateP7 (dwg. PT13)
Shear Bearing Plate with BracesSP2 (dwg. PT11)(to be providedby machine shop)
Typical Mass Connection Assemblywithout BracesA-M2 (dwg. A-11)
Bottom Right Column SectionC2 (dwg. PT1)
Typical Mass ConnectionAssembly with BracesA-M1 (dwg. A-11)
Mass Connection Assembly for Storey 4A-M3 (dwg. A-12)
Upper JointHorizontal Stiffener(1 each side)P4 (dwg. PT12)
Upper JointVertical Stiffener(3 each side)P3 (dwg. PT12)
A
B
Top PlateP2 (dwg. PT12)
C
C
6
6
6
66
6
6
68
8
302
4515
550
60 22
294
228
308
228

3D VIEW
B B
UPPER LEFT COLUMN ASSEMBLYA-C3 - SCALE 1:20
REVISIONS
REV. DESCRIPTION DATEA SP3 to be provided by machine shop 2010-07-01
B Lengths updated 2010-08-30
C P9 not centred on column 2010-09-10
UNIVERSITY of TORONTODepartment of Civil Engineering Rocking Steel Frame
Project Title
Upper Left Column AssemblyDrawing Title
9 2010/09/10
LDWDesigner Drawing No.
REV Date
LW05-A5ÉCOLE POLYTECHNIQUE MONTRÉAL
Départment des génies civil, géologique et des mines
All dimensions in mm [inches] unless otherwise noted
8
19 862 1200 1050 1508 38
Base Plate for Upper SectionP8 (dwg. PT13)
Upper Shear Bearing Plate without BracesSP3 (dwg. PT11)(to be provided by machine shop)
Storey 5 Gusset PlateG5 (dwg. PT10)
Typical Gusset Plate without BracesGNO (dwg. PT8)
Top Left Column SectionC3 (dwg. PT2)
Cap PlateP9 (dwg. PT13)
Storey 7 Gusset Plate with BracesG7BR (dwg. PT10)
A
C
6 66
8
60 22 23 23 23 7110
3
301 22
1
301
6
2254
13 13

6
5422
13 13
Base Plate for Upper SectionP8 (dwg. PT13)
Upper Shear Bearing Plate with BracesSP4 (dwg. PT11)(to be provided by machine shop)
Typical Mass ConnectionAssembly without BracesA-M2 (dwg. A-11)
Upper Right Column SectionC4 (dwg. PT2)
Typical Mass ConnectionAssembly with BracesA-M1 (dwg. A-11)
Mass Connection Assemblyfor Storey 7A-M4 (dwg. A-12)
Mass Connection Assemblyfor Storey 8A-M5 (dwg. A-13)
A Cap PlateP9 (dwg. PT13) E
6
6
6
6
6
6
68
60 22
1037 1125 1125 1125 208
103
71
228 308
B C
8
19
UNIVERSITY of TORONTODepartment of Civil Engineering Rocking Steel Frame
Project Title
Upper Right Column AssemblyDrawing Title
9 2010/09/10
LDWDesigner Drawing No.
REV Date
LW05-A6ÉCOLE POLYTECHNIQUE MONTRÉAL
Départment des génies civil, géologique et des mines
All dimensions in mm [inches] unless otherwise noted
UPPER RIGHT COLUMN ASSEMBLYA-C4 - SCALE 1:20
3D VIEW
D
REVISIONS
REV. DESCRIPTION DATE
A SP4 to be provided by machine shop 2010-07-01
B 1125mm btwn top mass strut connectors 2010-07-01
C Final Dimension Noted 2010-08-30
D Cap plate P9 noted 2010-08-30
E P9 not centred on column 2010-09-10

8
8
8
8
150 150
2520
Typical Beam SectionBMT (dwg. PT3)
Typical Long Connection PlateCPTL (dwg. PT5)
Typical Short Connection PlateCPTS (dwg. PT5)
TYPICAL BEAM ASSEMBLYA-BMT - SCALE 1:20
8
8 8
8
2350
150 150
Connection Plate for Beam 0CP0 (dwg. PT6)
Beam 0 SectionBM0 (dwg. PT3)
BEAM 0 ASSEMBLYA-BM0 - SCALE 1:20
UNIVERSITY of TORONTODepartment of Civil Engineering Rocking Steel Frame
Project Title
Beam Assemblies: Typical and 0Drawing Title
6 2010/06/22
LDWDesigner Drawing No.
REV Date
LW05-A7ÉCOLE POLYTECHNIQUE MONTRÉAL
Départment des génies civil, géologique et des mines
All dimensions in mm [inches] unless otherwise noted

Long Connection Plate for Beam 1CP1L (dwg. PT6)
Beam 1 SectionBM1 (dwg. PT3)
Typical Short Connection PlateCPTS (dwg. PT5)
UNIVERSITY of TORONTODepartment of Civil Engineering Rocking Steel Frame
Project Title
Beam Assemblies 1 and 4Drawing Title
5 2010/06/18
LDWDesigner Drawing No.
REV Date
LW05-A8ÉCOLE POLYTECHNIQUE MONTRÉAL
Départment des génies civil, géologique et des mines
All dimensions in mm [inches] unless otherwise noted
BEAM 1 ASSEMBLYA-BM1 - SCALE 1:20
8
8
8
8
2500150 150
Typical Beam SectionBMT (dwg. PT3)
Long Connection Plate for Beam 4CP4L (dwg. PT7)
Short Connection Plate for Beam 4CP4S (dwg. PT7)
BEAM 4 ASSEMBLYA-BM4 - SCALE 1:20
8
8 8
8
2445150 150

8
88
8
2445
150 150
Typical Beam SectionBMT (dwg. PT3)
Connection Plate for Beam 4UCP4U (dwg. PT7)
6
Beam 8 SectionBM8 (dwg. PT3)
Storey 8 Gusset PlateG8 (dwg. PT9)
PT Anchorage PlateP1 (dwg. PT12)
Small Stiffener (2 on each side)P5 (dwg. PT12)
BEAM 8 ASSEMBLYA-BM8 - SCALE 1:20
66
6
6
66
1312 1312
5050
UNIVERSITY of TORONTODepartment of Civil Engineering Rocking Steel Frame
Project Title
Beam Assemblies 4U and 8Drawing Title
5 2010/06/18
LDWDesigner Drawing No.
REV Date
LW05-A9ÉCOLE POLYTECHNIQUE MONTRÉAL
Départment des génies civil, géologique et des mines
All dimensions in mm [inches] unless otherwise noted
BEAM 4U ASSEMBLYA-BM4U - SCALE 1:20

FOUNDATION PLATE ASSEMBLYA-FP - SCALE 1:10
50.82"
TOP PLATE ASSEMBLYA-TP - SCALE 1:10ASSEMBLIES NO LONGER REQUIRED
REVISIONS
REV. ASS. DESCRIPTION DATE
A FP 6mm fillets of FP2 to FP1 2010-07-01
UNIVERSITY of TORONTODepartment of Civil Engineering Rocking Steel Frame
Project Title
Top Plate AssemblyDrawing Title
8 2010/07/05
LDWDesigner Drawing No.
REV Date
LW05-A10ÉCOLE POLYTECHNIQUE MONTRÉAL
Départment des génies civil, géologique et des mines
All dimensions in mm [inches] unless otherwise noted
Top PlateP2 (dwg. PT12)
Small StiffenerP5 (dwg. PT12)
CLsymmetry
6 NOT TO EXTENDPAST P5 TOWARDCENTRELINE
457
18"
45718"
7075
7075
CLsymmetry
Foundation PlateFP1 (dwg. PT16)
Lateral StopFP2 (dwg. PT17)
A6 NOT TO EXTEND
PAST FP2 TOWARDCENTRELINE
901.
735
1/2
"
901.735 1/2"
44.51 3/4"
406.416"
406.416"
44.4
1 3/
4"40
6.4
16"
406.
416
"
270 75
270 75
141
100
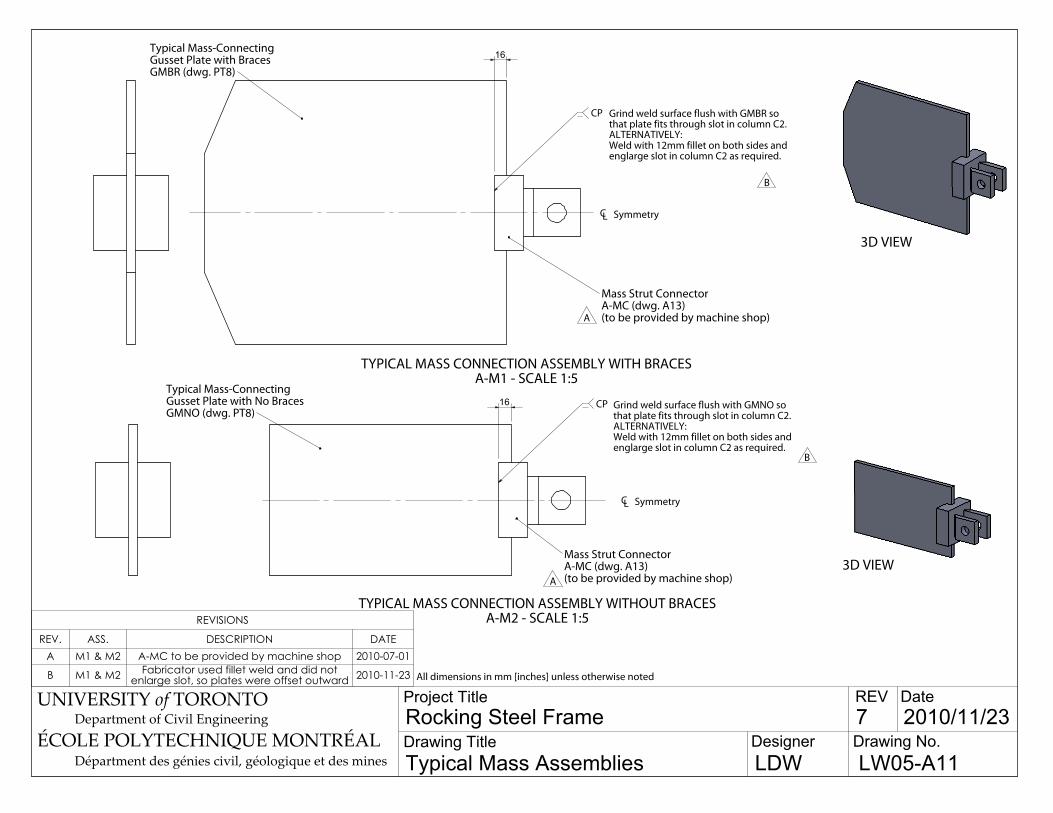
TYPICAL MASS CONNECTION ASSEMBLY WITHOUT BRACESA-M2 - SCALE 1:5
Grind weld surface flush with GMNO sothat plate fits through slot in column C2.ALTERNATIVELY:Weld with 12mm fillet on both sides andenglarge slot in column C2 as required.
Grind weld surface flush with GMBR sothat plate fits through slot in column C2.ALTERNATIVELY:Weld with 12mm fillet on both sides andenglarge slot in column C2 as required.
B
B
REVISIONS
REV. ASS. DESCRIPTION DATEA M1 & M2 A-MC to be provided by machine shop 2010-07-01
B M1 & M2 Fabricator used fillet weld and did not enlarge slot, so plates were offset outward 2010-11-23
3D VIEW
TYPICAL MASS CONNECTION ASSEMBLY WITH BRACESA-M1 - SCALE 1:5
CL Symmetry
Typical Mass-ConnectingGusset Plate with BracesGMBR (dwg. PT8)
Mass Strut ConnectorA-MC (dwg. A13)(to be provided by machine shop)A
CP
16
3D VIEW
CL Symmetry
Typical Mass-ConnectingGusset Plate with No BracesGMNO (dwg. PT8)
Mass Strut ConnectorA-MC (dwg. A13)(to be provided by machine shop)A
CP16
UNIVERSITY of TORONTODepartment of Civil Engineering Rocking Steel Frame
Project Title
Typical Mass AssembliesDrawing Title
7 2010/11/23
LDWDesigner Drawing No.
REV Date
LW05-A11ÉCOLE POLYTECHNIQUE MONTRÉAL
Départment des génies civil, géologique et des mines
All dimensions in mm [inches] unless otherwise noted

MASS CONNECTION ASSEMBLY FOR STOREY 4A-M3 - SCALE 1:5
Grind weld surface flush with G4BR sothat plate fits through slot in column C2.ALTERNATIVELY:Weld with 12mm fillet on both sides andenglarge slot in column C2 as required.
Grind weld surface flush with G7NO sothat plate fits through slot in column C4.ALTERNATIVELY:Weld with 12mm fillet on both sides andenglarge slot in column C4 as required.
B
B
REVISIONS
REV. ASS. DESCRIPTION DATE
A M3 & M4 A-MC to be provided by machine shop 2010-07-01
B M3 & M4 Fabricator used fillet weld and did not enlarge slot, so plates were offset outward 2010-11-23
UNIVERSITY of TORONTODepartment of Civil Engineering Rocking Steel Frame
Project Title
Special Mass AssembliesDrawing Title
7 2010/11/23
LDWDesigner Drawing No.
REV Date
LW05-A12ÉCOLE POLYTECHNIQUE MONTRÉAL
Départment des génies civil, géologique et des mines
All dimensions in mm [inches] unless otherwise noted
Storey 4 Gusset Plate with BracesG4BR (dwg. PT9)
Mass Strut ConnectorA-MC (dwg. A13)(to be provided by machine shopA CP
16
3D VIEW
3D VIEWMASS CONNECTION ASSEMBLY FOR STOREY 7A-M4 - SCALE 1:5
Storey 7 Gusset Plate without BracesG7NO (dwg. PT10)
Mass Strut ConnectorA-MC (dwg. A13)(to be provided by machine shop)A
CP
16

3D VIEW
MASS CONNECTION ASSEMBLY FOR STOREY 8A-M5 - SCALE 1:5
Grind weld surface flush with G7NO sothat plate fits through slot in column C2.ALTERNATIVELY:Weld with 12mm fillet on both sides andenglarge slot in column C2 as required.
AB
C
D
E
F
REVISIONS
REV. ASS. DESCRIPTION DATE
A M5 A-MC to be provided by machine shop 2010-07-01
B M5 Corrected reference from G7NO to GE8 2010-07-01
C MC P6 to be provided by machine shop 2010-07-01
D MC A-MC to be assembled in machine shop 2010-07-01
E M5 Fabricator used fillet weld and did not enlarge slot, so plates were offset outward 2010-11-23
F MC Parts P10 were welded to the frame at Poly to ensure proper alignment 2010-11-23
UNIVERSITY of TORONTODepartment of Civil Engineering Rocking Steel Frame
Project Title
Special Mass AssembliesDrawing Title
8 2010/11/23
LDWDesigner Drawing No.
REV Date
LW05-A13ÉCOLE POLYTECHNIQUE MONTRÉAL
Départment des génies civil, géologique et des mines
All dimensions in mm [inches] unless otherwise noted
Storey 8 End PlateGE8 (dwg. PT10)
Mass Strut ConnectorA-MC (dwg. A13)(to be provided by machine shop)
CP
100
225
MASS STRUT CONNECTORA-MC - SCALE 1:5
(to be assembled in machine shop)
14to be completed in machine shopwith pin in place to ensure alignment
Mass Connection PlateP6 (dwg. PT13)(to be provided by machine shop)
Mass Strut Bolt HolderP10 (dwg. PT13)(to be provided by machine shop)
3D VIEW

LOWER BUMPER ASSEMBLYA-B1 - SCALE 1:10
(to be provided by machine shop)
REVISIONS
REV. DESCRIPTION DATEA Increased fillet leg from 6mm to 8mm (2x) 2010-07-01
UNIVERSITY of TORONTODepartment of Civil Engineering Rocking Steel Frame
Project Title
Lower BumperDrawing Title
8 2010/07/01
LDWDesigner Drawing No.
REV Date
LW05-A14ÉCOLE POLYTECHNIQUE MONTRÉAL
Départment des génies civil, géologique et des mines
All dimensions in mm [inches] unless otherwise noted
25410"
177.
87"
558.822"
228.69"
Horizontal Plate for Lower BumperBP1 (dwg. PT14)
Vertical Plate for Lower BumperBP2 (dwg. PT14)
Lower Bumper StiffenerBP3 (dwg. PT14)
Faced Surface
A
A
8
8
9.5
3/8"
3D VIEW

3D VIEW
Horizontal Plate for Upper BumperB4 (dwg. PT15)
Vertical Plate for Upper BumperB5 (dwg. PT15)
Upper Bumper StiffenerB6 (dwg. PT15)
Faced Surface
A
A
8
8
9.5
3/8"
REVISIONS
REV. DESCRIPTION DATEA Increased fillet leg from 6mm to 8mm (2x) 2010-07-01
UNIVERSITY of TORONTODepartment of Civil Engineering Rocking Steel Frame
Project Title
Upper BumperDrawing Title
8 2010/07/01
LDWDesigner Drawing No.
REV Date
LW05-A15ÉCOLE POLYTECHNIQUE MONTRÉAL
Départment des génies civil, géologique et des mines
All dimensions in mm [inches] unless otherwise noted
241.39 1/2"
177.
87"
UPPER BUMPER ASSEMBLYA-B2 - SCALE 1:10
(to be provided by machine shop)
355.614"
152.46"

LOWER PT ANCHORAGE ASSEMBLYA-PTA - SCALE 1:5
Stiffening Tubefor PT AnchorageTU1 (PT17)
PT Bottom PlatePTP2 (dwg. PT19
Threaded Rod PlatePTP1 (dwg. PT19)
66
6
REVISIONS
REV. DESCRIPTION DATE
A Post-Tensioning Foundation Assembly (A-PTF) removed 2010-07-05
B Lower PT Anchorage Assembly completely redesigned 2010-07-05
UNIVERSITY of TORONTODepartment of Civil Engineering Rocking Steel Frame
Project Title
Lower PT AnchorageDrawing Title
2 2010/07/05
LDWDesigner Drawing No.
REV Date
LW05-A16ÉCOLE POLYTECHNIQUE MONTRÉAL
Départment des génies civil, géologique et des mines
All dimensions in mm [inches] unless otherwise noted
812.832"
150
31.81 1/4"
25.41"
170
150
3D VIEW

BC
B
C
D
D
REVISIONS
REV. ASS. DESCRIPTION DATE
A F1 & F2 Removed extra leader so that each assembly has three distribution plates) 2010-07-01
B F1 FR1 to be provided by machine shop, including placing friction pads 2010-07-01
C F2 FR2 to be provided by machine shop, including friction pads 2010-07-01
D F1 & F2 Pads were glued into recesses at Poly 2010-11-23
UNIVERSITY of TORONTODepartment of Civil Engineering Rocking Steel Frame
Project Title
Friction Plate AssembliesDrawing Title
3 2010/11/23
LDWDesigner Drawing No.
REV Date
LW05-A17ÉCOLE POLYTECHNIQUE MONTRÉAL
Départment des génies civil, géologique et des mines
All dimensions in mm [inches] unless otherwise noted
LOWER FRICTION ASSEMBLYA-F1 - SCALE 1:5
Lower Friction PlateFR1 (dwg. PT18)(to be providedby machine shop)
3.3mm NF-916Friction Padsplaced in recessesin FR1(to be completedin machine shop)
Lower Distribution PlatesFR3 (dwg. PT18)
A
UPPER FRICTION ASSEMBLYA-F2 - SCALE 1:5
Upper Friction PlateFR2 (dwg. PT18)(to be providedby machine shop)
3.3mm NF-916Friction Padsplaced in recessesin FR2(to be completed inmachine shop)
Upper Distribution PlatesFR4 (dwg. PT18)
A

Top PlateP2 (dwg. PT12)
87
8
98
175
98
175
7276
76
UNIVERSITY of TORONTODepartment of Civil Engineering Rocking Steel Frame
Project Title
BL Column Assembly DetailDrawing Title
1 2010/09/08
LDWDesigner Drawing No.
REV Date
LW05-A18ÉCOLE POLYTECHNIQUE MONTRÉAL
Départment des génies civil, géologique et des mines
All dimensions in mm [inches] unless otherwise noted
DETAIL FROM BOTTOM LEFT COLUMN ASSEMBLY (dwg. A3)SCALE 1:5
3D VIEW
Bottom LeftColumn SectionC1 (dwg. PT1)
Storey 4 Gusset Plate without BracesG4NO (dwg. PT9)
Upper JointVertical Stiffner(3 each side)P3 (dwg. PT12)
Upper JointHorizontalStiffener(1 each side)P4 (dwg. PT12)
6
86
3914
244
125

DETAIL FROM BOTTOM RIGHT COLUMN ASSEMBLY (dwg. A4)SCALE 1:5
3D VIEW
UNIVERSITY of TORONTODepartment of Civil Engineering Rocking Steel Frame
Project Title
BR Column Assembly DetailDrawing Title
1 2010/09/08
LDWDesigner Drawing No.
REV Date
LW05-A19ÉCOLE POLYTECHNIQUE MONTRÉAL
Départment des génies civil, géologique et des mines
All dimensions in mm [inches] unless otherwise noted
Bottom RightColumn SectionC2 (dwg. PT1)
Mass ConnectionAssembly for Storey 4A-M3 (dwg. A-12)
Upper JointVertical Stiffner(3 each side)P3 (dwg. PT12)
Upper JointHorizontalStiffener(1 each side)P4 (dwg. PT12)
8
6
6
4439
142
125
Top PlateP2 (dwg. PT12)
TO BE WELDED ATECOLE POLYTECHNIQUE
98
175
98
175
8
8772
7676

127
5"
763"
4.8
3/16
"
BOTTOM RIGHT COLUMN SECTION HSS127X76X4.8C2 - SCALE 1:20
Slots in C2 may need to be enlargedto accommodate MCP weld(see dwgs. A11 and A12)
A
1335 1050 1200
4860
14.3
9/16
" 200 350 200 225480
39.7
1 9/
16"
14.3
9/16
"
14.3
9/16
"
14.3
9/16
"
UNIVERSITY of TORONTODepartment of Civil Engineering Rocking Steel Frame
Project Title
Lower ColumnsDrawing Title
7 2010/07/01
LDWDesigner Drawing No.
REV Date
LW05-PT1ÉCOLE POLYTECHNIQUE MONTRÉAL
Départment des génies civil, géologique et des mines
All dimensions in mm [inches] unless otherwise noted
All HSS to be ASTM A500-C
All slots through both sides
All slots are drawn with rounded endsand 1/16" wider than the plates that areslotted through them. The slot widthand end may be adjusted as necessaryto ensure proper fit and welding.
REVISIONS
REV. PT DESCRIPTION DATE
A C1 & C2
Bottom slot length increased to 480mm to accommodate bearing plate (2x) 2010-07-01
BOTTOM LEFT COLUMN SECTION HSS127X76X4.8C1 - SCALE 1:20
A
4860
1160
485
1300 1050
200 350 225
14.3
9/16
"
39.7
1 9/
16"480
14.3
9/16
"
14.3
9/16
"
14.3
9/16
"
127
5"
763"
4.8
3/16
"

TOP RIGHT COLUMN SECTION HSS127X76X4.8C4 - SCALE 1:20
A
B
C
4620
937 1050 1175
380 200 350 350271
1/16
"
149/16
"
149/16
"
149/16
"
100149/16
"
1458
127
5"
763"
4.8
3/16
"
UNIVERSITY of TORONTODepartment of Civil Engineering Rocking Steel Frame
Project Title
Upper ColumnsDrawing Title
7 2010/08/30
LDWDesigner Drawing No.
REV Date
LW05-PT2ÉCOLE POLYTECHNIQUE MONTRÉAL
Départment des génies civil, géologique et des mines
All dimensions in mm [inches] unless otherwise noted
763"
127
5"
4.8
3/16
"
All HSS to be ASTM A500-C
All slots through both sides
All slots are drawn with rounded endsand 1/16" wider than the plates that areslotted through them. The slot widthand end may be adjusted as necessaryto ensure proper fit and welding.
Slots in C4 may need to be enlargedto accommodate MCP weld(see dwgs. A11 and A12)
REVISIONS
REV. PT DESCRIPTION DATE
A C3 & C4
Bottom slot lengthened to 380mm to accommodate bearing plate (2x) 2010-07-01
B C3 & C4 Tube length increased to 4620mm 2010-08-30
C C4 Top slot adjusted because of length change 2010-08-30
TOP LEFT COLUMN SECTION HSS127X76X4.8C3 - SCALE 1:20
A
B4620
862 1200 1050
380 350 200 400
271
1/16
"
149/16
"
149/16
"
149/16
"
1508

UNIVERSITY of TORONTODepartment of Civil Engineering Rocking Steel Frame
Project Title
Beam SectionsDrawing Title
7 2010/07/01
LDWDesigner Drawing No.
REV Date
LW05-PT3ÉCOLE POLYTECHNIQUE MONTRÉAL
Départment des génies civil, géologique et des mines
All dimensions in mm [inches] unless otherwise noted
All HSS to be ASTM A500-C
All slots through both sides
All slots are drawn with rounded endsand 1/16" wider than the plates that areslotted through them. The slot widthand end may be adjusted as necessaryto ensure proper fit and welding.
REVISIONS
REV. PT DESCRIPTION DATE
A BM8 slot at end is 9/16" wide and 150mm long 2010-07-01
763"
763"
85/
16"
BEAM 0 SECTION HSS76x76x8.0BM0 - SCALE 1:20
150
1950
20.6
13/1
6" 150
20.6
13/1
6"
763"
763"
85/
16"
BEAM 8 SECTION HSS76x76x8.0BM8 - SCALE 1:20
A
2624
1062 500
149/16
" 150
149/16
"
1925
150 150
149/16
"
149/16
"763"
763"
85/
16"
1995
150 150
149/16
"
149/16
"
TYPICAL BEAM SECTION HSS76x76x8.0BMT - SCALE 1:20
BEAM 1 SECTION HSS76x76x8.0BM1 - SCALE 1:20
763"
763"
85/
16"

BRACE 8 SECTION HSS76x76x8.0BR8 - SCALE 1:20
1480
150
149/16
"150
149/16
"
763"
763"
85/
16"
2532
150 150149/16
"
149/16
"
763"
763"
85/
16"
BRACE 5 SECTION HSS76x76x8.0BR5 - SCALE 1:20
2509
150 150
271
1/16
" 149/16
"
BRACE 2 SECTION HSS76x76x8.0BR2 - SCALE 1:20
2486
149/16
"
149/16
"
150 150
763"
763"
85/
16"
UNIVERSITY of TORONTODepartment of Civil Engineering Rocking Steel Frame
Project Title
Brace SectionsDrawing Title
5 2010/06/18
LDWDesigner Drawing No.
REV Date
LW05-PT4ÉCOLE POLYTECHNIQUE MONTRÉAL
Départment des génies civil, géologique et des mines
All dimensions in mm [inches] unless otherwise noted
TYPICAL BRACE SECTION HSS76x76x8.0BRT - SCALE 1:20
All HSS to be ASTM A500-C
All slots through both sides
All slots are drawn with rounded endsand 1/16" wider than the plates that areslotted through them. The slot widthand end may be adjusted as necessaryto ensure proper fit and welding.
763"
763"
85/
16"
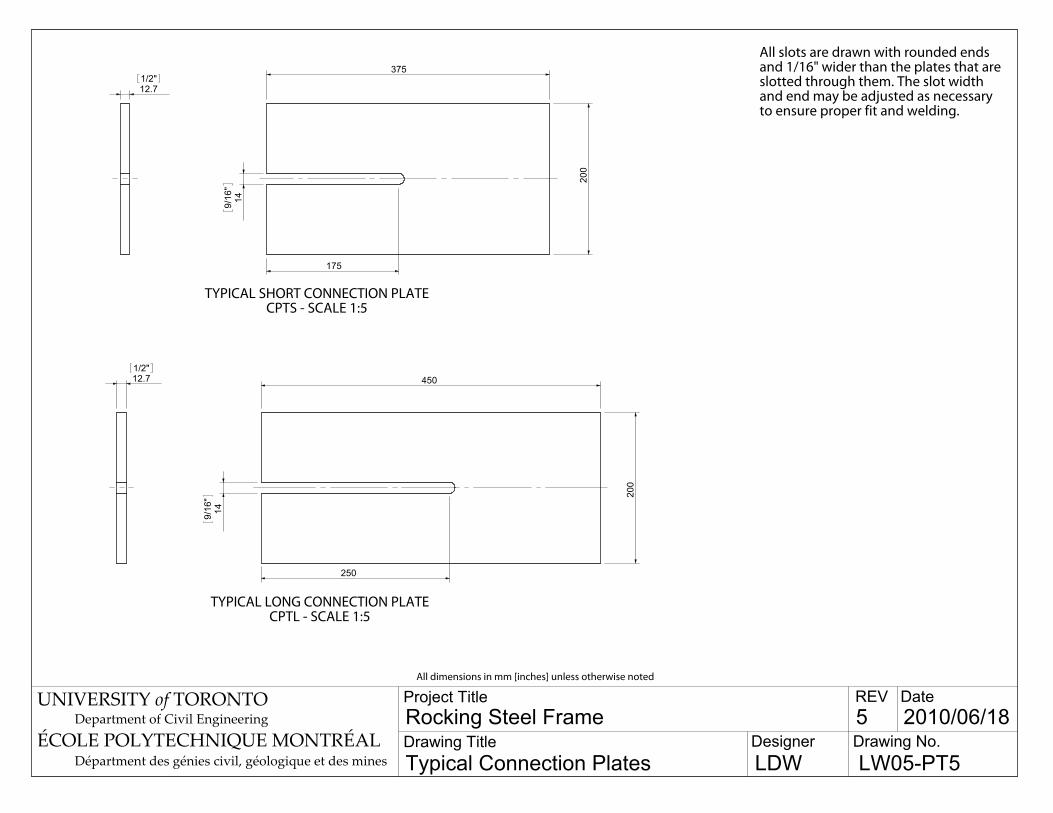
All slots are drawn with rounded endsand 1/16" wider than the plates that areslotted through them. The slot widthand end may be adjusted as necessaryto ensure proper fit and welding.
UNIVERSITY of TORONTODepartment of Civil Engineering Rocking Steel Frame
Project Title
Typical Connection PlatesDrawing Title
5 2010/06/18
LDWDesigner Drawing No.
REV Date
LW05-PT5ÉCOLE POLYTECHNIQUE MONTRÉAL
Départment des génies civil, géologique et des mines
All dimensions in mm [inches] unless otherwise noted
TYPICAL SHORT CONNECTION PLATECPTS - SCALE 1:5
200
375
149/16
"
175
12.71/2"
TYPICAL LONG CONNECTION PLATECPTL - SCALE 1:5
200
450
149/16
"
250
12.71/2"

UNIVERSITY of TORONTODepartment of Civil Engineering Rocking Steel Frame
Project Title
Special Connection Plates: 0 and 1Drawing Title
6 2010/06/22
LDWDesigner Drawing No.
REV Date
LW05-PT6ÉCOLE POLYTECHNIQUE MONTRÉAL
Départment des génies civil, géologique et des mines
All dimensions in mm [inches] unless otherwise noted
12.71/2"
LONG CONNECTION PLATE FOR BEAM 1CP1L - SCALE 1:5
200
500
149/16
"
300
19.13/4"
CONNECTION PLATE FOR BEAM 0CP0 - SCALE 1:5
350
250
150
39.7
1 9/
16"
All slots are drawn with rounded endsand 1/16" wider than the plates that areslotted through them. The slot widthand end may be adjusted as necessaryto ensure proper fit and welding.

12.71/2"
SHORT CONNECTION PLATE FOR BEAM 4CP4S - SCALE 1:5
350
200
150
149/16
"
12.71/2"
400
200
200
149/16
"
UNIVERSITY of TORONTODepartment of Civil Engineering Rocking Steel Frame
Project Title
Special Connection PlatesDrawing Title
5 2010/06/14
LDWDesigner Drawing No.
REV Date
LW05-PT7ÉCOLE POLYTECHNIQUE MONTRÉAL
Départment des génies civil, géologique et des mines
All dimensions in mm [inches] unless otherwise noted
All slots are drawn with rounded endsand 1/16" wider than the plates that areslotted through them. The slot widthand end may be adjusted as necessaryto ensure proper fit and welding.
LONG CONNECTION PLATE FOR BEAM 4CP4L - SCALE 1:5
12.71/2"
CONNECTION PLATE FOR BEAM 4UCP4U - SCALE 1:5
375
200
271
1/16
"
175

12.71/2"
12.71/2"
TYPICAL MASS-CONNECTINGGUSSET PLATE WITHOUT BRACES
GMNO - SCALE 1:10
320
200
16
5010
0
12.71/2"
TYPICAL MASS-CONNECTINGGUSSET PLATE WITH BRACES
GMBR - SCALE 1:10
350
400
96
40
40
96
16
125
100
12.71/2"
TYPICAL GUSSET PLATE WITHOUT BRACESGNO - SCALE 1:10
320
200
TYPICAL GUSSET PLATE WITH BRACESGBR - SCALE 1:10
400
350
96
40
40
96
UNIVERSITY of TORONTODepartment of Civil Engineering Rocking Steel Frame
Project Title
Gusset PlatesDrawing Title
5 2010/06/18
LDWDesigner Drawing No.
REV Date
LW05-PT8ÉCOLE POLYTECHNIQUE MONTRÉAL
Départment des génies civil, géologique et des mines
All dimensions in mm [inches] unless otherwise noted

All slots are drawn withrounded ends and 1/16"wider than the plates thatare slotted through them.The slot width and endmay be adjusted asnecessary to ensure properfit and welding.
REVISIONS
REV. PT DESCRIPTION DATEA G1 Hole size increased to 1-1/16" 2010-08-30
UNIVERSITY of TORONTODepartment of Civil Engineering Rocking Steel Frame
Project Title
Gusset PlatesDrawing Title
7 2010/08/30
LDWDesigner Drawing No.
REV Date
LW05-PT9ÉCOLE POLYTECHNIQUE MONTRÉAL
Départment des génies civil, géologique et des mines
All dimensions in mm [inches] unless otherwise noted
STOREY 8 GUSSET PLATEG8 - SCALE 1:10
500
300
75
80 80
75
150
150
149/16
"149/16
"
3089
12.71/2"
STOREY 4 GUSSET PLATE WITH BRACESG4BR - SCALE 1:10
665
225
100
40
96
16
12.71/2"
12.71/2"
STOREY 4 GUSSET PLATE WITHOUT BRACESG4NO - SCALE 1:10
585
225
STOREY 1 GUSSET PLATEG1- SCALE 1:10
A
485
470
180
75
170
87
4351
10951
3626
166
26
27typ.
1 1/16"
12.71/2"

12.71/2"
350
400
96
40
108
40
STOREY 5 GUSSET PLATEG5 - SCALE 1:10
UNIVERSITY of TORONTODepartment of Civil Engineering Rocking Steel Frame
Project Title
PlatesDrawing Title
5 2010/06/18
LDWDesigner Drawing No.
REV Date
ÉCOLE POLYTECHNIQUE MONTRÉALDépartment des génies civil, géologique et des mines
All dimensions in mm [inches] unless otherwise noted
LW05-PT10
STOREY 7 GUSSET PLATE WITH BRACESG7BR - SCALE 1:10
400
400
180
150
96
40
12.71/2"
STOREY 7 GUSSET PLATE WITHOUT BRACESG7NO - SCALE 1:10
320
350
7510
0
16
80
7512.71/2"
STOREY 8 END PLATEGE8 - SCALE 1:10
225
100
12.71/2"
25.41"
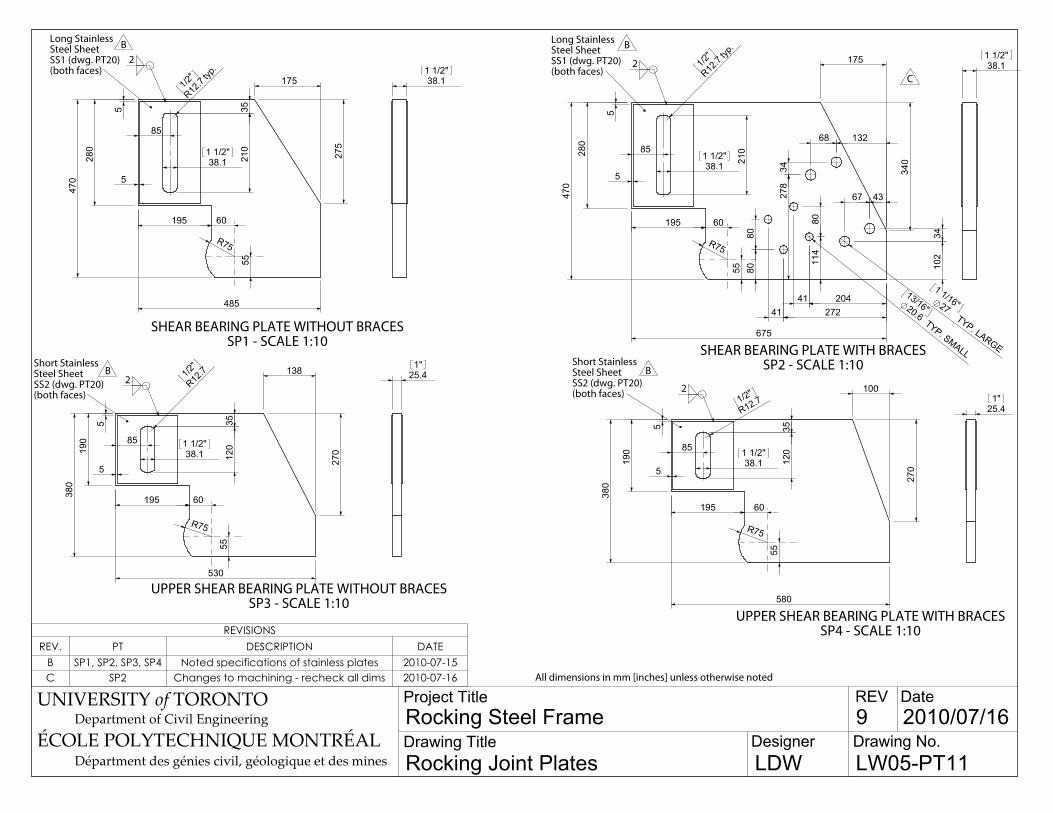
Long StainlessSteel SheetSS1 (dwg. PT20)(both faces)
B2
485
275
17547
0
280
R7555
195 60
5
585
210
38.11 1/2"
R12.7
typ.
1/2"
35
Short StainlessSteel SheetSS2 (dwg. PT20)(both faces)
UPPER SHEAR BEARING PLATE WITH BRACESSP4 - SCALE 1:10
2
55
270
100
580
R75
195 60
5
190
380
5
85
38.11 1/2"
120
35
R12.71/2"
25.41"
UPPER SHEAR BEARING PLATE WITHOUT BRACESSP3 - SCALE 1:10
Short StainlessSteel SheetSS2 (dwg. PT20)(both faces)
2
55
270
138
530
195 60
R75
5
5
190
380
8538.1
1 1/2"
120
35
R12.71/2
"
SHEAR BEARING PLATE WITHOUT BRACESSP1 - SCALE 1:10
B
BB
REVISIONSREV. PT DESCRIPTION DATE
B SP1, SP2, SP3, SP4 Noted specifications of stainless plates 2010-07-15C SP2 Changes to machining - recheck all dims 2010-07-16
UNIVERSITY of TORONTODepartment of Civil Engineering Rocking Steel Frame
Project Title
Rocking Joint PlatesDrawing Title
9 2010/07/16
LDWDesigner Drawing No.
REV Date
ÉCOLE POLYTECHNIQUE MONTRÉALDépartment des génies civil, géologique et des mines
All dimensions in mm [inches] unless otherwise noted
LW05-PT11
38.11 1/2"
SHEAR BEARING PLATE WITH BRACESSP2 - SCALE 1:10
Long StainlessSteel SheetSS1 (dwg. PT20)(both faces)
C2
675
340
175
5
280
470
195 60
R75
55
5
80
114
80
80
2044141 272
85
38.11 1/2" 21
0
R12.7
typ.
1/2"
102
34
4367278
34
13268
27TYP. LARGE
1 1/16"20.6TYP. SMALL
13/16"
38.11 1/2"
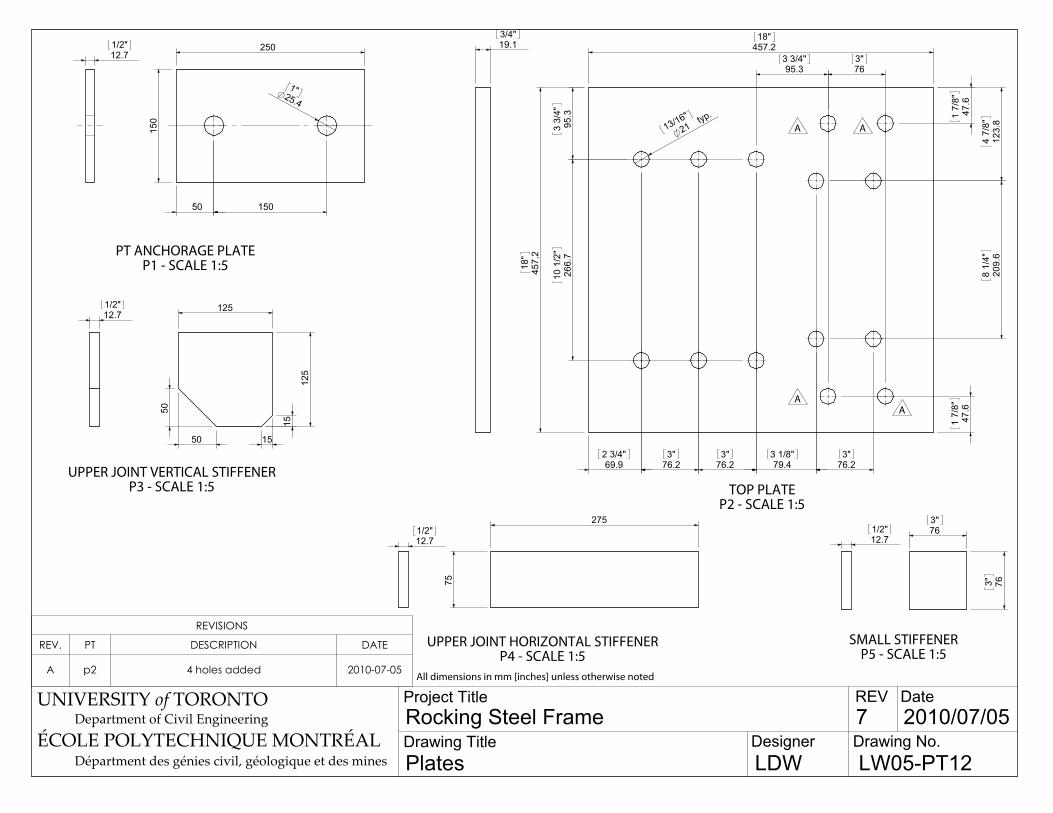
19.13/4"
250
150
50 150
25.41"
UPPER JOINT VERTICAL STIFFENERP3 - SCALE 1:5
125
50
50
15
15
125
12.71/2"
763"
763"
12.71/2"
PT ANCHORAGE PLATEP1 - SCALE 1:5
SMALL STIFFENERP5 - SCALE 1:5
REVISIONS
REV. PT DESCRIPTION DATE
A p2 4 holes added 2010-07-05
UNIVERSITY of TORONTODepartment of Civil Engineering Rocking Steel Frame
Project Title
PlatesDrawing Title
7 2010/07/05
LDWDesigner Drawing No.
REV Date
LW05-PT12ÉCOLE POLYTECHNIQUE MONTRÉAL
Départment des génies civil, géologique et des mines
All dimensions in mm [inches] unless otherwise noted
12.71/2"
UPPER JOINT HORIZONTAL STIFFENERP4 - SCALE 1:5
75
275
TOP PLATEP2 - SCALE 1:5
A A
AA
457.218"
457.
218
"
21typ.
13/16"
69.92 3/4"
76.23"
76.23"
79.43 1/8"
76.23"
95.3
3 3/
4"
123.
84
7/8"
209.
68
1/4"
266.
710
1/2
"
95.33 3/4"
763"
47.6
1 7/
8"47
.61
7/8"
12.71/2"
63.5
2 1/
2"
76.23"
31.81 1/4"
tol. -0.0000"/+0.0015"1.000"
31.8
1 1/
4"
15.9
5/8" 14
14
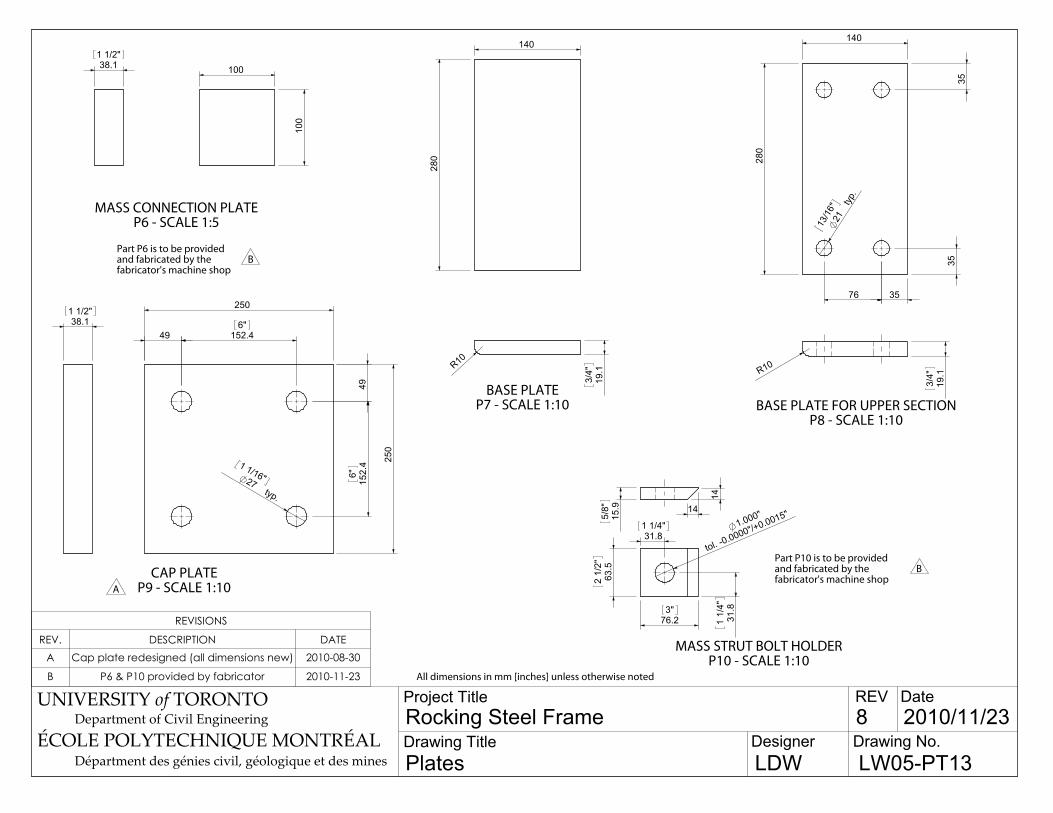
BASE PLATE FOR UPPER SECTIONP8 - SCALE 1:10
19.1
3/4"R10
BASE PLATEP7 - SCALE 1:10
R10
19.1
3/4"
140
280
MASS CONNECTION PLATEP6 - SCALE 1:5
MASS STRUT BOLT HOLDERP10 - SCALE 1:10
Part P10 is to be providedand fabricated by thefabricator's machine shop
Part P6 is to be providedand fabricated by thefabricator's machine shop
A
B
B
REVISIONS
REV. DESCRIPTION DATEA Cap plate redesigned (all dimensions new) 2010-08-30
B P6 & P10 provided by fabricator 2010-11-23
UNIVERSITY of TORONTODepartment of Civil Engineering Rocking Steel Frame
Project Title
PlatesDrawing Title
8 2010/11/23
LDWDesigner Drawing No.
REV Date
LW05-PT13ÉCOLE POLYTECHNIQUE MONTRÉAL
Départment des génies civil, géologique et des mines
All dimensions in mm [inches] unless otherwise noted
38.11 1/2"
100
100
CAP PLATEP9 - SCALE 1:10
250
250
49 152.46"
4915
2.4
6"27typ.
1 1/16"
38.11 1/2"
280
140
3535
3576
21typ
.
13/1
6"
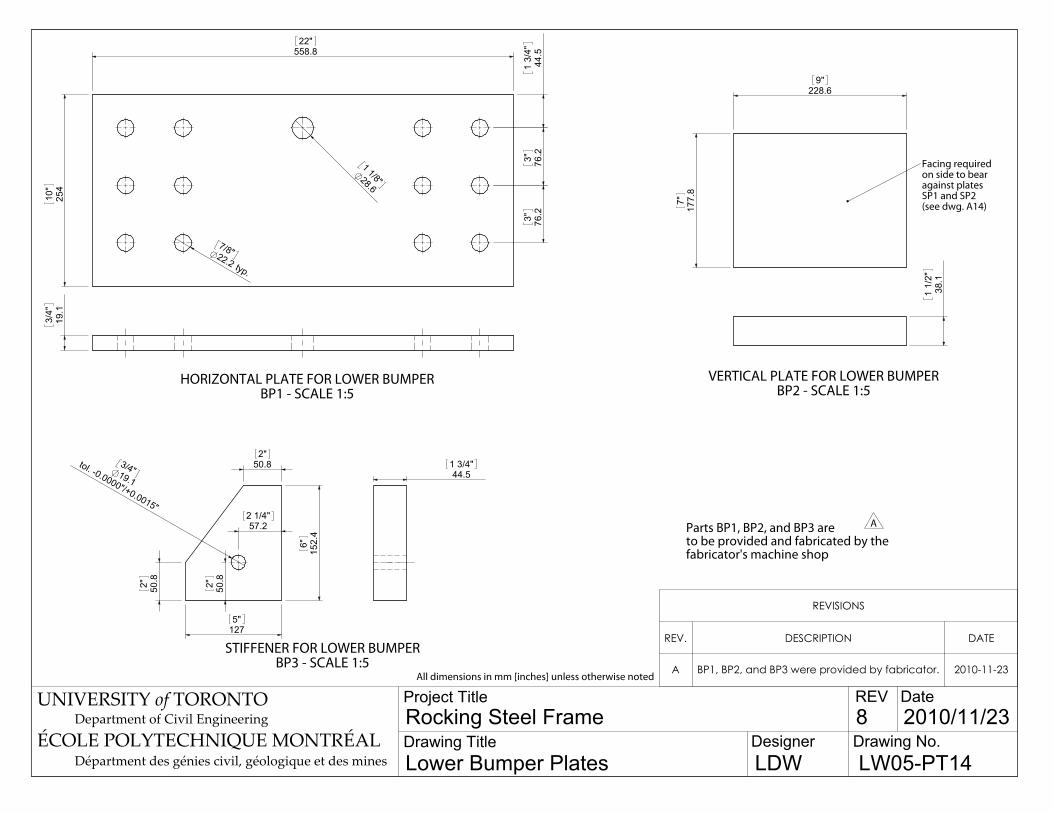
VERTICAL PLATE FOR LOWER BUMPERBP2 - SCALE 1:5
38.1
1 1/
2"
STIFFENER FOR LOWER BUMPERBP3 - SCALE 1:5
152.
46"
1275"
50.82"
50.82"
57.22 1/4"
50.82"
19.1
tol. -0.0000"/+0.0015"
3/4" 44.51 3/4"
Facing requiredon side to bearagainst platesSP1 and SP2(see dwg. A14)
228.69"
177.
87"
28.61 1/8"
254
10"
558.822"
44.5
1 3/
4"76
.23"76
.23"
22.2 typ.
7/8"
HORIZONTAL PLATE FOR LOWER BUMPERBP1 - SCALE 1:5
19.1
3/4"
UNIVERSITY of TORONTODepartment of Civil Engineering Rocking Steel Frame
Project Title
Lower Bumper PlatesDrawing Title
8 2010/11/23
LDWDesigner Drawing No.
REV Date
LW05-PT14ÉCOLE POLYTECHNIQUE MONTRÉAL
Départment des génies civil, géologique et des mines
All dimensions in mm [inches] unless otherwise noted
Parts BP1, BP2, and BP3 areto be provided and fabricated by thefabricator's machine shop
A
REVISIONS
REV. DESCRIPTION DATE
A BP1, BP2, and BP3 were provided by fabricator. 2010-11-23

VERTICAL PLATE FOR LOWER BUMPERBP5 - SCALE 1:5
19.1
3/4"
31.81 1/4"
STIFFENER FOR UPPER BUMPERBP6 - SCALE 1:5
177.
87"
177.87"
25.41"
25.41"
19.1
tol. -0.0000"/+0.0015"
3/4"
512"
76.23"
Facing requiredon side to bearagainst platesSP3 and SP4(see dwg. A15)
177.
87"
152.46"
HORIZONTAL PLATE FOR UPPER BUMPERBP4 - SCALE 1:5
19.1
3/4"
241.
39
1/2"
355.614"
44.51 3/4"
266.710 1/2"
44.5
1 3/
4"76
.23"76
.23"
22.2 typ.7/8"
UNIVERSITY of TORONTODepartment of Civil Engineering Rocking Steel Frame
Project Title
Upper Bumper PlatesDrawing Title
8 2010/11/23
LDWDesigner Drawing No.
REV Date
LW05-PT15ÉCOLE POLYTECHNIQUE MONTRÉAL
Départment des génies civil, géologique et des mines
All dimensions in mm [inches] unless otherwise noted
Parts BP4, BP5, and BP6 areto be provided and fabricated by thefabricator's machine shop
A
REVISIONS
REV. DESCRIPTION DATE
A Parts BP4, BP5, and BP6 were provided by the fabricator 2010-11-23

tapped for 3/4" bolt,typ. for small holes
A A
AA
901.
735
1/2
"
901.735 1/2"
27 typ. fo
r large holes
1 1/16"
44.4
1 3/
4"40
6.4
16"
406.
416
"
44.51 3/4"
406.416"
406.416"
158.
86
1/4"
76.23"
44.51 3/4"
76.23"
76.23"
301.611 7/8"
763"
181
7 1/
8"
UNIVERSITY of TORONTODepartment of Civil Engineering Rocking Steel Frame
Project Title
Foundation Assembly PlatesDrawing Title
7 2010/07/05
LDWDesigner Drawing No.
REV Date
LW05-PT16ÉCOLE POLYTECHNIQUE MONTRÉAL
Départment des génies civil, géologique et des mines
All dimensions in mm [inches] unless otherwise noted
CLsymmetry
FPT
IS N
O
LONGER
REQ
UIRED
REVISIONS
REV. PT DESCRIPTION DATE
A FP1 4 holes added 2010-07-05
B FPT FPT is no longer required 2010-07-05
FOUNDATION PLATEFP1 - SCALE 1:10
50.82"
FOUNDATION PLATE FOR POST-TENSIONINGFPT - SCALE 1:10
50.82"
901.
735
1/2
"
400
27typ
.
1 1/16
"
200
44.4
1 3/
4"40
6.4
16"
406.
416
"
A
FP2 AND P11 ARE NO
LONGER REQUIRED
C
C
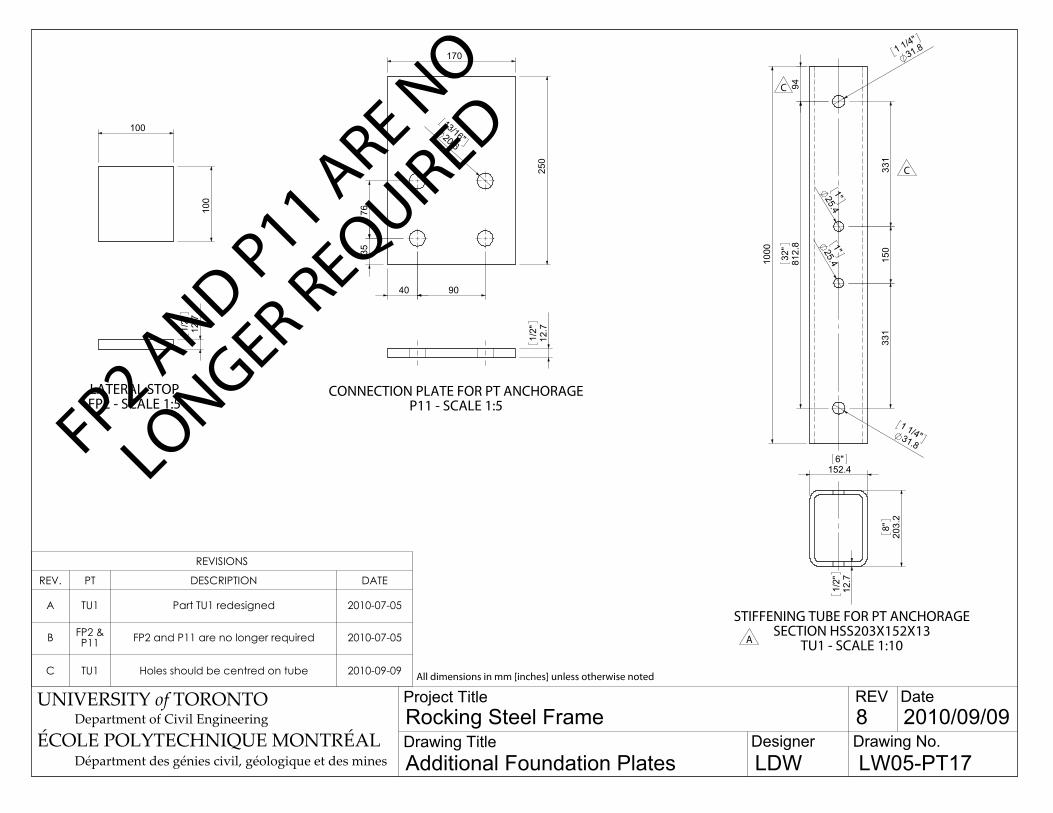
REVISIONS
REV. PT DESCRIPTION DATE
A TU1 Part TU1 redesigned 2010-07-05
B FP2 & P11 FP2 and P11 are no longer required 2010-07-05
C TU1 Holes should be centred on tube 2010-09-09
100
100
LATERAL STOPFP2 - SCALE 1:5
12.7
1/2"
250
170
40 90
3576
20.6
13/16"
CONNECTION PLATE FOR PT ANCHORAGEP11 - SCALE 1:5
12.7
1/2"
1000
9481
2.8
32"
331
15025.4
1"25.4
1"
31.8
1 1/4"
31.81 1/4"
331
STIFFENING TUBE FOR PT ANCHORAGESECTION HSS203X152X13
TU1 - SCALE 1:10
203.
28"
152.46"
12.7
1/2"
UNIVERSITY of TORONTODepartment of Civil Engineering Rocking Steel Frame
Project Title
Additional Foundation PlatesDrawing Title
8 2010/09/09
LDWDesigner Drawing No.
REV Date
LW05-PT17ÉCOLE POLYTECHNIQUE MONTRÉAL
Départment des génies civil, géologique et des mines
All dimensions in mm [inches] unless otherwise noted

UPPER DISTRIBUTIONPLATEFR4 - SCALE 1:5
90
150
75
45
20.6
13/16"
LOWER FRICTION PLATEFR1 - SCALE 1:5
1.7mm recesstyp.A
B
450
150
35 35
180
40
5080
20.6
13/1
6"20
.613
/16"
1570
1070
15 30 30 30 30
19.1
tol.
-0.0
000"
/+0.
0015
"
3/4"
4018
0
12.7
1/2"
UNIVERSITY of TORONTODepartment of Civil Engineering Rocking Steel Frame
Project Title
Friction Interface PiecesDrawing Title
9 2010/07/22
LDWDesigner Drawing No.
REV Date
LW05-PT18ÉCOLE POLYTECHNIQUE MONTRÉAL
Départment des génies civil, géologique et des mines
All dimensions in mm [inches] unless otherwise noted
Parts FR1 and FR2 are to be providedand fabricated by the machine shop.
REVISIONS
REV. PT DESCRIPTION DATE
A FR1 Reduced lenth to 450mm 2010-07-05
B FR1, FR2 Do not round corners of recesses 2010-07-22
LOWER DISTRIBUTIONPLATEFR3 - SCALE 1:5
170
150
4580
75 20.6
13/16"
12.71/2"
1.7mm recesstyp.
UPPER FRICTION PLATEFR2 - SCALE 1:5
B
360
50
1570
15 30 30 30 30
150
180
35 35
404018
0
19.1
tol.
-0.0
000"
/+0.
0015
"
3/4"
20.613/16"
12.7
1/2"
12.71/2"

SIDE BUMPER ANGLESECTION L102X76X6.4
SB - SCALE 1:5
102
76
6.4
1/4"
PT BOTTOM PLATEPTP2 - SCALE 1:5
25.41"
150
170
75
85
31.81 1/4"
170
250
50 150
25.4TYP.
1"
85
THREADED ROD PLATEPTP1 - SCALE 1:5
25.41"
377615
0
40
20.6
13/16"
UNIVERSITY of TORONTODepartment of Civil Engineering Rocking Steel Frame
Project Title
Side Bumper AngleDrawing Title
2 2010/11/23
LDWDesigner Drawing No.
REV Date
LW05-PT19ÉCOLE POLYTECHNIQUE MONTRÉAL
Départment des génies civil, géologique et des mines
All dimensions in mm [inches] unless otherwise noted
A
REVISIONS
REV. DESCRIPTION DATE
A Noted hole dimension 2010-11-23

SHORT STAINLESS STEEL SHEETSS2 - SCALE 1:5
160
180
80
3012
0
38.11 1/2"
R12.7 typ.
1/2"
2
UNIVERSITY of TORONTODepartment of Civil Engineering Rocking Steel Frame
Project Title
Stainless Steel PlatesDrawing Title
1 2010/07/15
LDWDesigner Drawing No.
REV Date
LW05-PT20ÉCOLE POLYTECHNIQUE MONTRÉAL
Départment des génies civil, géologique et des mines
All dimensions in mm [inches] unless otherwise noted
LONG STAINLESS STEEL SHEETSS1 - SCALE 1:5
270
160
80
38.11 1/2"
3021
0
R12.7 typ.
1/2"
All stainless steel to be grade 304-2B, 14 gauge.
2
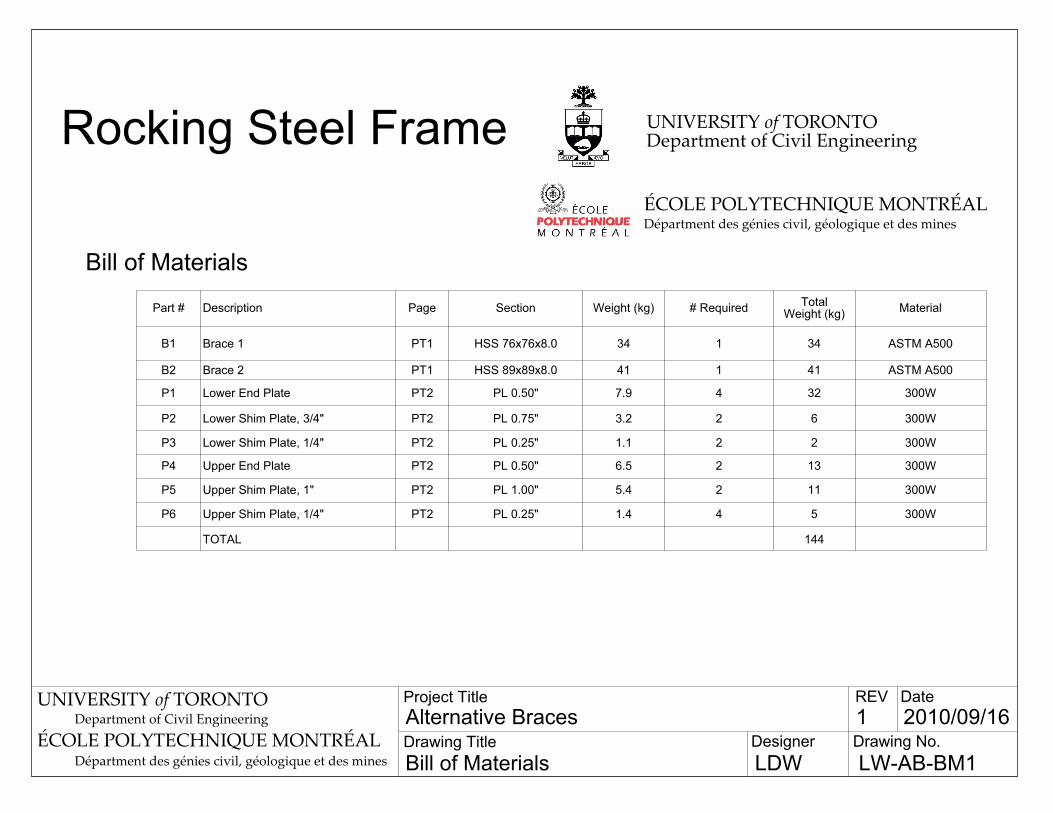
UNIVERSITY of TORONTODepartment of Civil Engineering Alternative Braces
Project Title
Bill of MaterialsDrawing Title
1 2010/09/16
LDWDesigner Drawing No.
REV Date
LW-AB-BM1ÉCOLE POLYTECHNIQUE MONTRÉAL
Départment des génies civil, géologique et des mines
Rocking Steel Frame
Départment des génies civil, géologique et des minesÉCOLE POLYTECHNIQUE MONTRÉAL
UNIVERSITY of TORONTODepartment of Civil Engineering
Bill of Materials
Part # Description Page Section Weight (kg) # Required TotalWeight (kg) Material
B1 Brace 1 PT1 HSS 76x76x8.0 34 1 34 ASTM A500
B2 Brace 2 PT1 HSS 89x89x8.0 41 1 41 ASTM A500
P1 Lower End Plate PT2 PL 0.50" 7.9 4 32 300W
P2 Lower Shim Plate, 3/4" PT2 PL 0.75" 3.2 2 6 300W
P3 Lower Shim Plate, 1/4" PT2 PL 0.25" 1.1 2 2 300W
P4 Upper End Plate PT2 PL 0.50" 6.5 2 13 300W
P5 Upper Shim Plate, 1" PT2 PL 1.00" 5.4 2 11 300W
P6 Upper Shim Plate, 1/4" PT2 PL 0.25" 1.4 4 5 300W
TOTAL 144

UNIVERSITY of TORONTODepartment of Civil Engineering Alternative Braces
Project Title
OverviewDrawing Title
1 2010/09/16
LDWDesigner Drawing No.
REV Date
LW-AB-O1ÉCOLE POLYTECHNIQUE MONTRÉAL
Départment des génies civil, géologique et des mines
Lower Shim Plates to leave 1-1/2" gapP3 and P4 (dwg. PT2)
Upper Shim Plates to leave 1/2" gapP5 and P6 (dwg. PT2)
66
2159150 150
38.1
1 1/
2"
12.7
1/2"
Brace 1B1 (dwg. PT1) ORBrace 2B2 (dwg. PT1)
Lower End PlateP1 (dwg. PT2)
Upper End PlateP2 (dwg. PT2)
1" A325 Bolt,Slip-Critical,Typical
2569
90
76 57
146
2649

UNIVERSITY of TORONTODepartment of Civil Engineering Alternative Braces
Project Title
Brace AssembliesDrawing Title
1 2010/09/16
LDWDesigner Drawing No.
REV Date
LW-AB-A1ÉCOLE POLYTECHNIQUE MONTRÉAL
Départment des génies civil, géologique et des mines
ALTERNATIVE BRACE 1A-B1 - SCALE 1:20
ALTERNATIVE BRACE 2A-B2 - SCALE 1:20
Brace 1B1 (dwg. PT1)
Upper End PlateP4 (dwg. PT2)
Lower End PlateP1 (dwg. PT2)
2569
66
150 150
66
150150
Upper End PlateP4 (dwg. PT2)
Brace 2B2 (dwg. PT1)Lower End Plate
P1 (dwg. PT2)
2569
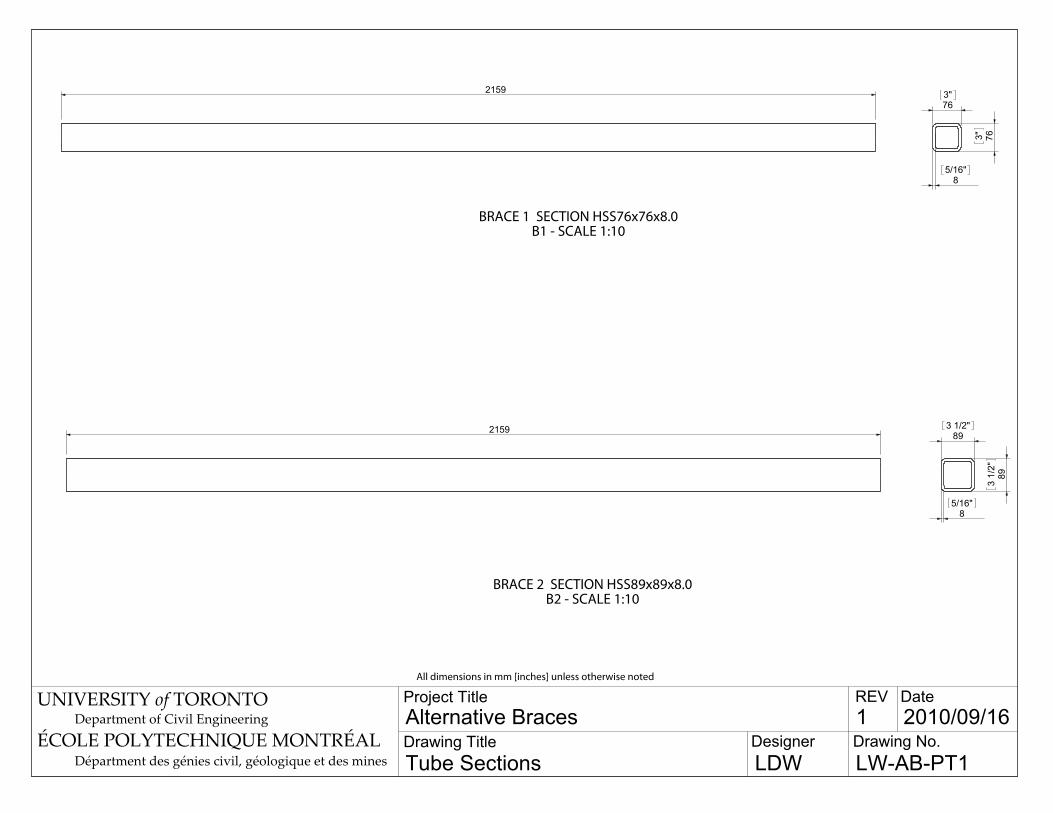
BRACE 2 SECTION HSS89x89x8.0B2 - SCALE 1:10
UNIVERSITY of TORONTODepartment of Civil Engineering Alternative Braces
Project Title
Tube SectionsDrawing Title
1 2010/09/16
LDWDesigner Drawing No.
REV Date
ÉCOLE POLYTECHNIQUE MONTRÉALDépartment des génies civil, géologique et des mines
All dimensions in mm [inches] unless otherwise noted
LW-AB-PT1
893
1/2"
893 1/2"
85/16"
BRACE 1 SECTION HSS76x76x8.0B1 - SCALE 1:10
2159
763"
763"
85/16"
2159

19.13/4"
LOWER SHIM PLATE, 1/4"P3 - SCALE 1:5
170
150
4090
40
377637
28.6
TYP.
1 1/8"
6.41/4"
UPPER SHIM PLATE, 1"P5 - SCALE 1:5
135
220
3957
39
3714637
28.6
TYP.
1 1/8"
25.41"
UPPER SHIM PLATE, 1/4"P6 - SCALE 1:5
135
220
3957
39
3714637
28.6
TYP.
1 1/8" 6.4
1/4"
UNIVERSITY of TORONTODepartment of Civil Engineering Alternative Braces
Project Title
PlatesDrawing Title
1 2010/09/16
LDWDesigner Drawing No.
REV Date
ÉCOLE POLYTECHNIQUE MONTRÉALDépartment des génies civil, géologique et des mines
All dimensions in mm [inches] unless otherwise noted
LW-AB-PT2
LOWER END PLATEP1 - SCALE 1:5
LOWER SHIM PLATE, 3/4"P2 - SCALE 1:5
170
480
4090
40
364 76 40
28.6 TYP.1 1/8"17
0
150
4090
40
377637
28.6
TYP.
1 1/8"
12.71/2"
12.71/2"
UPPER END PLATEP4 - SCALE 1:5
220
310
3714
637
4057213
28.6 TYP.
1 1/8"

B-1
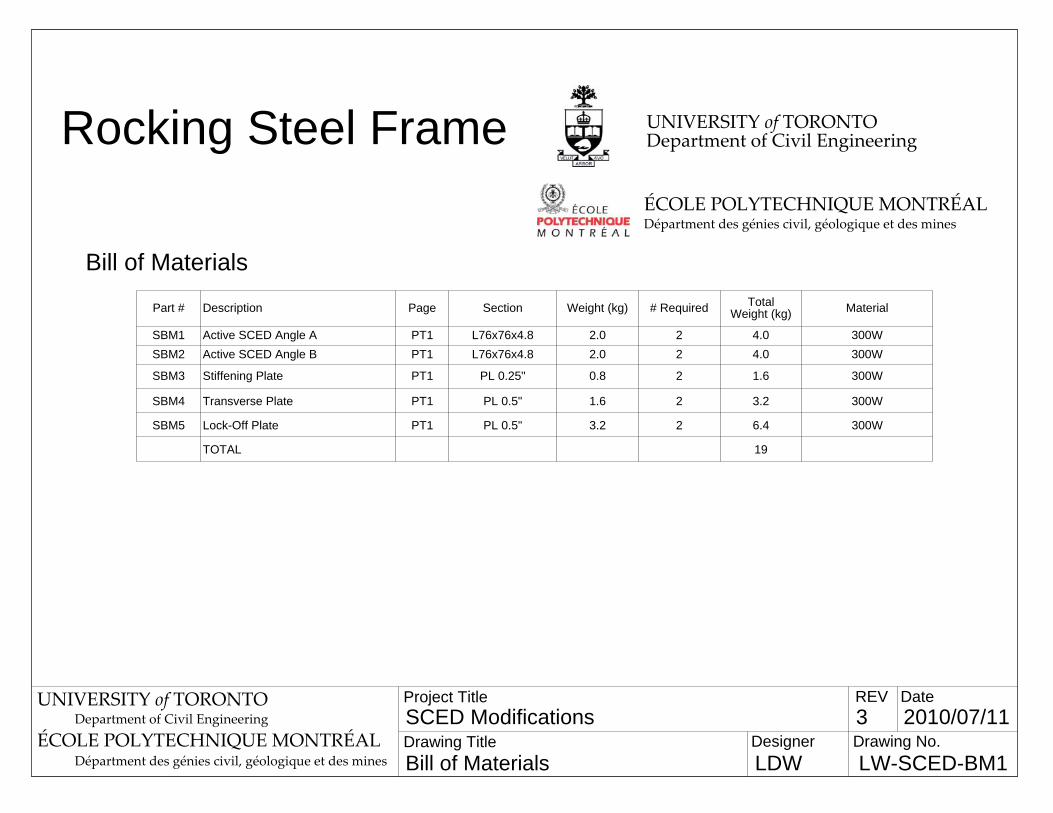
Appendix B SCED brace modification drawings
This appendix provides the drawings that describe how the SCED brace was to be modi-
fied from the earlier test program [Tremblay et al. 2010] for this application.
Rocking Steel Frame
Départment des génies civil, géologique et des minesÉCOLE POLYTECHNIQUE MONTRÉAL
UNIVERSITY of TORONTODepartment of Civil Engineering
Bill of Materials
Part # Description Page Section Weight (kg) # Required TotalWeight (kg) Material
SBM1 Active SCED Angle A PT1 L76x76x4.8 2.0 2 4.0 300WSBM2 Active SCED Angle B PT1 L76x76x4.8 2.0 2 4.0 300W
SBM3 Stiffening Plate PT1 PL 0.25" 0.8 2 1.6 300W
SBM4 Transverse Plate PT1 PL 0.5" 1.6 2 3.2 300W
SBM5 Lock-Off Plate PT1 PL 0.5" 3.2 2 6.4 300W
TOTAL 19
UNIVERSITY of TORONTODepartment of Civil Engineering SCED Modifications
Project Title
Bill of MaterialsDrawing Title
3 2010/07/11
LDWDesigner Drawing No.
REV Date
LW-SCED-BM1ÉCOLE POLYTECHNIQUE MONTRÉAL
Départment des génies civil, géologique et des mines

Step 1: Grind welds to remove stainless steel plates
Active SCED Angle BSBM2 (dwg. PT1)2 total
Active SCED Angle ASBM1 (dwg. PT1)2 total 6
100
38.1
1 1/
2"
2222
2022 220300
Step 2: Cut both plates as shown.
100
Existing SCED Brace
90
2571
2642
31
120
UNIVERSITY of TORONTODepartment of Civil Engineering SCED Modifications
Project Title
SCED Modifications OverviewDrawing Title
5 2010/08/17
LDWDesigner Drawing No.
REV Date
LW-SCED-O1ÉCOLE POLYTECHNIQUE MONTRÉAL
Départment des génies civil, géologique et des mines
Step 3: Weld Active SCED Anglesas shown (4 pieces total)

Transverse PlateSBM4 (dwg. PT1)(1 each side)
6SEE NOTE
6SEE NOTE
35 50521
A325 3/4" bolts
A325 3/4" bolts
Lock-Off Bolts(A325 1")with shims
Lock-Off PlateSBM5 (dwg. PT1)(4 total)
Lock-Off Bolts(A325 1")
5
8
Step 4: Weld stiffening andlock-off plates as shown.
NOTE: the tendon will remaininside the SCED brace duringwelding. Because the tendonmay be damaged by temperaturesover 200C, each welding passshould be done as quickly aspossible, and cooling time shouldbe allowed between welds.
Step 6: Install SCED brace inframe as shown, tighteningall 3/4" bolts using theturn-of-nut method to ensurea slip-critical connection.
To lock off the brace, installthe lock-off plates with 1" boltsas shown, tightening using theturn-of-nut method to ensurea slip-critical connection.
Step 5: Retension strand andretorque internal friction bolts.Calibrate using test rig (separateset of drawings). Targets havenot yet been finalized.
UNIVERSITY of TORONTODepartment of Civil Engineering SCED Modficiations
Project Title
SCED Modifications OverviewDrawing Title
5 2010/08/17
LDWDesigner Drawing No.
REV Date
LW-SCED-O2ÉCOLE POLYTECHNIQUE MONTRÉAL
Départment des génies civil, géologique et des mines
Stiffening PlateSBM3 (dwg. PT1)(1 each side)
6SEE NOTE
25

300
40
4076
20.6
typ.
13/1
6"
30
9060
40
300
4076
9060
30
20.6typ.
13/16"
763"
763"
6.41/4"
ACTIVE SCED ANGLE BL76x76x4.8
SBM2 - SCALE 1:5
763"
763" 6.4
1/4"
220
75
UNIVERSITY of TORONTODepartment of Civil Engineering SCED Modifications
Project Title
SCED PlatesDrawing Title
4 2010/07/16
LDWDesigner Drawing No.
REV Date
ÉCOLE POLYTECHNIQUE MONTRÉALDépartment des génies civil, géologique et des mines
All dimensions in mm [inches] unless otherwise noted
LW-SCED-PT1
ACTIVE SCED ANGLE AL76x76x4.8
SBM1 - SCALE 1:5
STIFFENING PLATESBM3 - SCALE 1:5
6.4
1/4"
TRANSVERSE PLATESBM4 - SCALE 1:5
12.7
1/2"
200
85
5076
27TYP.
1 1/16"
80
445
25 25
503876
215
76 27 TYP.1 1/16"
LOCK-OFF PLATESBM5 - SCALE 1:5
12.7
1/2"

Appendix C Summary of experimental results
Each of the following pages presents a one-page summary of the response of all four con-
figurations to one earthquake record.
C-1

Appendix C Summary of experimental results
Figure C.1 Record SLE-1
0 5 10 15 20−0.2
0.2 0.07g
Time (s)
Gr. Acc.(g)
Roof Δ@ 0.2%
Bot. Jt. θ@ 0.2%
Top Jt. θ@ 0.2%
0.0 1.0 2.00.0
0.1
0.2
0.3← T
0Sa(g)
Period (s)
0.0 1.0 2.00
20
40← T
0Sd(mm)
Period (s)
0.3% 0.0% 0.3%
20
30
Bottom Jt. θ (rad)
PT
For
ce (
kN)
0.0 0.1 0.2 0.30
2
4
6
8
Peak Floor Acceleration (g)
Sto
rey
0.0% 0.1% 0.2% 0.3%0
2
4
6
8
Res. & Peak Disp.
Sto
rey
0.0% 0.1% 0.2% 0.3%0
2
4
6
8
Res. & Peak Inter. Drift
Sto
rey
0 10 20 30 400
2
4
6
8
Peak Storey Shear (kN)
Sto
rey
0 50 100 150 2000
2
4
6
8
Peak Moment (kN−m)
Sto
rey
8 4 0 0 4
−36
36
Bottom Gap Opening (mm)
Bot. Jt.(kN)
8 4 0 0 4
−1818
Top Gap Opening (mm)
Top Jt.(kN)
SCED El.@ 0.2%
−5 0 5−50
0
50
SCED Elongation (mm)
SC
ED
For
ce (
kN)
−80 −40 0 400
2
4
6
8
Left Column Force (kN)
Sto
rey
−80 −40 0 400
2
4
6
8
Right Column Force (kN)
Sto
rey
1M0V2M0V
1M1V2M1V
Design / Reference
C-2

Appendix C Summary of experimental results
Figure C.2 Record SLE-2
0 5 10 15 20−0.2
0.2
0.08g
Time (s)
Gr. Acc.(g)
Roof Δ@ 0.2%
Bot. Jt. θ@ 0.2%
Top Jt. θ@ 0.2%
0.0 1.0 2.00.0
0.1
0.2
0.3← T
0Sa(g)
Period (s)
0.0 1.0 2.00
20
40← T
0Sd(mm)
Period (s)
0.3% 0.0% 0.3%
20
30
Bottom Jt. θ (rad)
PT
For
ce (
kN)
0.0 0.1 0.2 0.30
2
4
6
8
Peak Floor Acceleration (g)
Sto
rey
0.0% 0.1% 0.2% 0.3%0
2
4
6
8
Res. & Peak Disp.
Sto
rey
0.0% 0.1% 0.2% 0.3%0
2
4
6
8
Res. & Peak Inter. Drift
Sto
rey
0 10 20 30 400
2
4
6
8
Peak Storey Shear (kN)
Sto
rey
0 50 100 150 2000
2
4
6
8
Peak Moment (kN−m)
Sto
rey
8 4 0 0 4
−36
36
Bottom Gap Opening (mm)
Bot. Jt.(kN)
8 4 0 0 4
−1818
Top Gap Opening (mm)
Top Jt.(kN)
SCED El.@ 0.2%
−5 0 5−50
0
50
SCED Elongation (mm)
SC
ED
For
ce (
kN)
−80 −40 0 400
2
4
6
8
Left Column Force (kN)
Sto
rey
−80 −40 0 400
2
4
6
8
Right Column Force (kN)
Sto
rey
1M0V2M0V
1M1V2M1V
Design / Reference
C-3

Appendix C Summary of experimental results
Figure C.3 Record DBE-1
0 5 10 15 20−0.2
0.2
0.17g
Time (s)
Gr. Acc.(g)
Roof Δ@ 0.2%
Bot. Jt. θ@ 0.2%
Top Jt. θ@ 0.2%
0.0 1.0 2.00.0
0.4
0.8← T
0Sa(g)
Period (s)
0.0 1.0 2.00
20
40
60← T
0Sd(mm)
Period (s)
0.3% 0.0% 0.3%
20
30
Bottom Jt. θ (rad)
PT
For
ce (
kN)
0.0 0.1 0.2 0.3 0.4 0.50
2
4
6
8
Peak Floor Acceleration (g)
Sto
rey
0.0% 0.2% 0.4%0
2
4
6
8
Res. & Peak Disp.
Sto
rey
0.0% 0.2% 0.4%0
2
4
6
8
Res. & Peak Inter. Drift
Sto
rey
0 10 20 30 40 500
2
4
6
8
Peak Storey Shear (kN)
Sto
rey
0 50 100 150 2000
2
4
6
8
Peak Moment (kN−m)
Sto
rey
8 4 0 0 4
−36
36
Bottom Gap Opening (mm)
Bot. Jt.(kN)
8 4 0 0 4
−1818
Top Gap Opening (mm)
Top Jt.(kN)
SCED El.@ 0.2%
−5 0 5−50
0
50
SCED Elongation (mm)
SC
ED
For
ce (
kN)
−80 −40 0 400
2
4
6
8
Left Column Force (kN)
Sto
rey
−80 −40 0 400
2
4
6
8
Right Column Force (kN)
Sto
rey
1M0V2M0V
1M1V2M1V
Design / Reference
C-4

Appendix C Summary of experimental results
Figure C.4 Record DBE-2
0 5 10 15 20−0.2
0.2 0.14g
Time (s)
Gr. Acc.(g)
Roof Δ@ 0.2%
Bot. Jt. θ@ 0.2%
Top Jt. θ@ 0.2%
0.0 1.0 2.00.0
0.4
0.8← T
0Sa(g)
Period (s)
0.0 1.0 2.00
20
40
60← T
0Sd(mm)
Period (s)
0.3% 0.0% 0.3%
20
30
Bottom Jt. θ (rad)
PT
For
ce (
kN)
0.0 0.1 0.2 0.3 0.4 0.50
2
4
6
8
Peak Floor Acceleration (g)
Sto
rey
0.0% 0.2% 0.4%0
2
4
6
8
Res. & Peak Disp.
Sto
rey
0.0% 0.2% 0.4%0
2
4
6
8
Res. & Peak Inter. Drift
Sto
rey
0 10 20 30 40 500
2
4
6
8
Peak Storey Shear (kN)
Sto
rey
0 50 100 150 2000
2
4
6
8
Peak Moment (kN−m)
Sto
rey
8 4 0 0 4
−36
36
Bottom Gap Opening (mm)
Bot. Jt.(kN)
8 4 0 0 4
−1818
Top Gap Opening (mm)
Top Jt.(kN)
SCED El.@ 0.2%
−5 0 5−50
0
50
SCED Elongation (mm)
SC
ED
For
ce (
kN)
−80 −40 0 400
2
4
6
8
Left Column Force (kN)
Sto
rey
−80 −40 0 400
2
4
6
8
Right Column Force (kN)
Sto
rey
1M0V2M0V
1M1V2M1V
Design / Reference
C-5
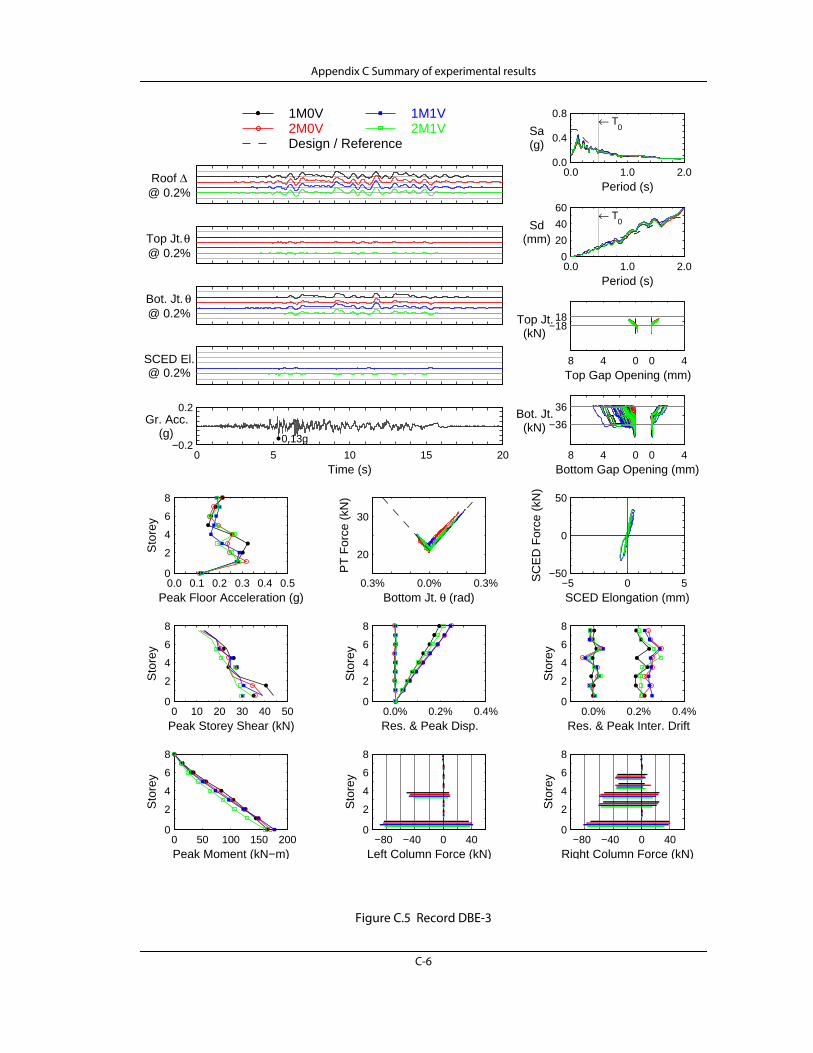
Appendix C Summary of experimental results
Figure C.5 Record DBE-3
0 5 10 15 20−0.2
0.2
0.13g
Time (s)
Gr. Acc.(g)
Roof Δ@ 0.2%
Bot. Jt. θ@ 0.2%
Top Jt. θ@ 0.2%
0.0 1.0 2.00.0
0.4
0.8← T
0Sa(g)
Period (s)
0.0 1.0 2.00
20
40
60← T
0Sd(mm)
Period (s)
0.3% 0.0% 0.3%
20
30
Bottom Jt. θ (rad)
PT
For
ce (
kN)
0.0 0.1 0.2 0.3 0.4 0.50
2
4
6
8
Peak Floor Acceleration (g)
Sto
rey
0.0% 0.2% 0.4%0
2
4
6
8
Res. & Peak Disp.
Sto
rey
0.0% 0.2% 0.4%0
2
4
6
8
Res. & Peak Inter. Drift
Sto
rey
0 10 20 30 40 500
2
4
6
8
Peak Storey Shear (kN)
Sto
rey
0 50 100 150 2000
2
4
6
8
Peak Moment (kN−m)
Sto
rey
8 4 0 0 4
−36
36
Bottom Gap Opening (mm)
Bot. Jt.(kN)
8 4 0 0 4
−1818
Top Gap Opening (mm)
Top Jt.(kN)
SCED El.@ 0.2%
−5 0 5−50
0
50
SCED Elongation (mm)
SC
ED
For
ce (
kN)
−80 −40 0 400
2
4
6
8
Left Column Force (kN)
Sto
rey
−80 −40 0 400
2
4
6
8
Right Column Force (kN)
Sto
rey
1M0V2M0V
1M1V2M1V
Design / Reference
C-6

Appendix C Summary of experimental results
Figure C.6 Record CAS-1
0 10 20 30 40 50−0.4
0.4
0.21g
Time (s)
Gr. Acc.(g)
Roof Δ@ 0.5%
Bot. Jt. θ@ 0.5%
Top Jt. θ@ 0.5%
0.0 1.0 2.00.0
0.4
0.8
1.2← T
0Sa(g)
Period (s)
0.0 1.0 2.00
80
160← T
0Sd(mm)
Period (s)
0.6% 0.0% 0.6%0
20
40
60
Bottom Jt. θ (rad)
PT
For
ce (
kN)
0.0 0.2 0.4 0.6 0.80
2
4
6
8
Peak Floor Acceleration (g)
Sto
rey
0.0% 0.5% 1.0%0
2
4
6
8
Res. & Peak Disp.
Sto
rey
0.0% 0.5% 1.0%0
2
4
6
8
Res. & Peak Inter. Drift
Sto
rey
0 20 40 60 800
2
4
6
8
Peak Storey Shear (kN)
Sto
rey
0 50 100 150 200 2500
2
4
6
8
Peak Moment (kN−m)
Sto
rey
20 10 0 0 10
−36
36
Bottom Gap Opening (mm)
Bot. Jt.(kN)
20 10 0 0 10
−1818
Top Gap Opening (mm)
Top Jt.(kN)
SCED El.@ 0.5%
−5 0 5−50
0
50
SCED Elongation (mm)
SC
ED
For
ce (
kN)
−120 −80 −40 0 400
2
4
6
8
Left Column Force (kN)
Sto
rey
−120 −80 −40 0 400
2
4
6
8
Right Column Force (kN)
Sto
rey
1M0V2M0V
1M1V2M1V
Design / Reference
C-7

Appendix C Summary of experimental results
Figure C.7 Record CAS-2
0 10 20 30 40 50−0.4
0.4 0.33g
Time (s)
Gr. Acc.(g)
Roof Δ@ 0.5%
Bot. Jt. θ@ 0.5%
Top Jt. θ@ 0.5%
0.0 1.0 2.00.0
0.4
0.8
1.2← T
0Sa(g)
Period (s)
0.0 1.0 2.00
80
160← T
0Sd(mm)
Period (s)
0.6% 0.0% 0.6%0
20
40
60
Bottom Jt. θ (rad)
PT
For
ce (
kN)
0.0 0.2 0.4 0.6 0.80
2
4
6
8
Peak Floor Acceleration (g)
Sto
rey
0.0% 0.5% 1.0%0
2
4
6
8
Res. & Peak Disp.
Sto
rey
0.0% 0.5% 1.0%0
2
4
6
8
Res. & Peak Inter. Drift
Sto
rey
0 20 40 60 800
2
4
6
8
Peak Storey Shear (kN)
Sto
rey
0 50 100 150 200 2500
2
4
6
8
Peak Moment (kN−m)
Sto
rey
20 10 0 0 10
−36
36
Bottom Gap Opening (mm)
Bot. Jt.(kN)
20 10 0 0 10
−1818
Top Gap Opening (mm)
Top Jt.(kN)
SCED El.@ 0.5%
−5 0 5−50
0
50
SCED Elongation (mm)
SC
ED
For
ce (
kN)
−120 −80 −40 0 400
2
4
6
8
Left Column Force (kN)
Sto
rey
−120 −80 −40 0 400
2
4
6
8
Right Column Force (kN)
Sto
rey
1M0V2M0V
1M1V2M1V
Design / Reference
C-8
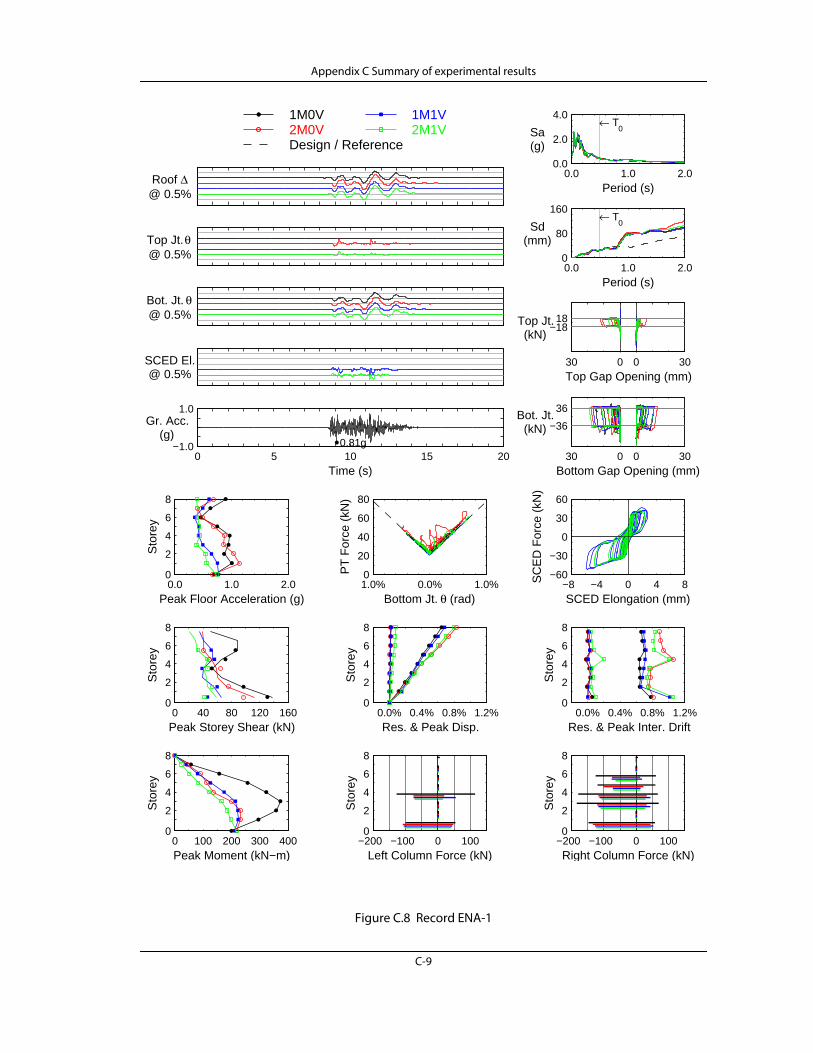
Appendix C Summary of experimental results
Figure C.8 Record ENA-1
0 5 10 15 20−1.0
1.0
0.81g
Time (s)
Gr. Acc.(g)
Roof Δ@ 0.5%
Bot. Jt. θ@ 0.5%
Top Jt. θ@ 0.5%
0.0 1.0 2.00.0
2.0
4.0← T
0Sa(g)
Period (s)
0.0 1.0 2.00
80
160← T
0Sd(mm)
Period (s)
1.0% 0.0% 1.0%0
20
40
60
80
Bottom Jt. θ (rad)
PT
For
ce (
kN)
0.0 1.0 2.00
2
4
6
8
Peak Floor Acceleration (g)
Sto
rey
0.0% 0.4% 0.8% 1.2%0
2
4
6
8
Res. & Peak Disp.
Sto
rey
0.0% 0.4% 0.8% 1.2%0
2
4
6
8
Res. & Peak Inter. Drift
Sto
rey
0 40 80 120 1600
2
4
6
8
Peak Storey Shear (kN)
Sto
rey
0 100 200 300 4000
2
4
6
8
Peak Moment (kN−m)
Sto
rey
30 0 0 30
−36
36
Bottom Gap Opening (mm)
Bot. Jt.(kN)
30 0 0 30
−1818
Top Gap Opening (mm)
Top Jt.(kN)
SCED El.@ 0.5%
−8 −4 0 4 8−60
−30
0
30
60
SCED Elongation (mm)
SC
ED
For
ce (
kN)
−200 −100 0 1000
2
4
6
8
Left Column Force (kN)
Sto
rey
−200 −100 0 1000
2
4
6
8
Right Column Force (kN)
Sto
rey
1M0V2M0V
1M1V2M1V
Design / Reference
C-9

Appendix C Summary of experimental results
Figure C.9 Record ENA-2
0 5 10 15 20−1.0
1.0
0.75g
Time (s)
Gr. Acc.(g)
Roof Δ@ 0.5%
Bot. Jt. θ@ 0.5%
Top Jt. θ@ 0.5%
0.0 1.0 2.00.0
2.0
4.0← T
0Sa(g)
Period (s)
0.0 1.0 2.00
80
160← T
0Sd(mm)
Period (s)
1.0% 0.0% 1.0%0
20
40
60
80
Bottom Jt. θ (rad)
PT
For
ce (
kN)
0.0 1.0 2.00
2
4
6
8
Peak Floor Acceleration (g)
Sto
rey
0.0% 0.4% 0.8% 1.2%0
2
4
6
8
Res. & Peak Disp.
Sto
rey
0.0% 0.4% 0.8% 1.2%0
2
4
6
8
Res. & Peak Inter. Drift
Sto
rey
0 40 80 120 1600
2
4
6
8
Peak Storey Shear (kN)
Sto
rey
0 100 200 300 4000
2
4
6
8
Peak Moment (kN−m)
Sto
rey
30 0 0 30
−36
36
Bottom Gap Opening (mm)
Bot. Jt.(kN)
30 0 0 30
−1818
Top Gap Opening (mm)
Top Jt.(kN)
SCED El.@ 0.5%
−8 −4 0 4 8−60
−30
0
30
60
SCED Elongation (mm)
SC
ED
For
ce (
kN)
−200 −100 0 1000
2
4
6
8
Left Column Force (kN)
Sto
rey
−200 −100 0 1000
2
4
6
8
Right Column Force (kN)
Sto
rey
1M0V2M0V
1M1V2M1V
Design / Reference
C-10

Appendix C Summary of experimental results
Figure C.10 Record MCE-1
0 5 10 15 20−1.0
1.0 0.27g
Time (s)
Gr. Acc.(g)
Roof Δ@ 0.5%
Bot. Jt. θ@ 0.5%
Top Jt. θ@ 0.5%
0.0 1.0 2.00.0
2.0
4.0← T
0Sa(g)
Period (s)
0.0 1.0 2.00
100
200← T
0Sd(mm)
Period (s)
1.0% 0.0% 1.0%0
20
40
60
80
Bottom Jt. θ (rad)
PT
For
ce (
kN)
0.0 1.0 2.00
2
4
6
8
Peak Floor Acceleration (g)
Sto
rey
0.0% 0.8% 1.6%0
2
4
6
8
Res. & Peak Disp.
Sto
rey
0.0% 0.8% 1.6%0
2
4
6
8
Res. & Peak Inter. Drift
Sto
rey
0 40 80 120 1600
2
4
6
8
Peak Storey Shear (kN)
Sto
rey
0 100 200 300 4000
2
4
6
8
Peak Moment (kN−m)
Sto
rey
30 0 0 30
−36
36
Bottom Gap Opening (mm)
Bot. Jt.(kN)
30 0 0 30
−1818
Top Gap Opening (mm)
Top Jt.(kN)
SCED El.@ 0.5%
−8 −4 0 4 8−60
−30
0
30
60
SCED Elongation (mm)
SC
ED
For
ce (
kN)
−200 −100 0 1000
2
4
6
8
Left Column Force (kN)
Sto
rey
−200 −100 0 1000
2
4
6
8
Right Column Force (kN)
Sto
rey
1M0V2M0V
1M1V2M1V
Design / Reference
C-11

Appendix C Summary of experimental results
Figure C.11 Record MCE-2
0 5 10 15 20−1.0
1.0
0.47g
Time (s)
Gr. Acc.(g)
Roof Δ@ 0.5%
Bot. Jt. θ@ 0.5%
Top Jt. θ@ 0.5%
0.0 1.0 2.00.0
2.0
4.0← T
0Sa(g)
Period (s)
0.0 1.0 2.00
100
200← T
0Sd(mm)
Period (s)
1.0% 0.0% 1.0%0
20
40
60
80
Bottom Jt. θ (rad)
PT
For
ce (
kN)
0.0 1.0 2.00
2
4
6
8
Peak Floor Acceleration (g)
Sto
rey
0.0% 0.8% 1.6%0
2
4
6
8
Res. & Peak Disp.
Sto
rey
0.0% 0.8% 1.6%0
2
4
6
8
Res. & Peak Inter. Drift
Sto
rey
0 40 80 120 1600
2
4
6
8
Peak Storey Shear (kN)
Sto
rey
0 100 200 300 4000
2
4
6
8
Peak Moment (kN−m)
Sto
rey
30 0 0 30
−36
36
Bottom Gap Opening (mm)
Bot. Jt.(kN)
30 0 0 30
−1818
Top Gap Opening (mm)
Top Jt.(kN)
SCED El.@ 0.5%
−8 −4 0 4 8−60
−30
0
30
60
SCED Elongation (mm)
SC
ED
For
ce (
kN)
−200 −100 0 1000
2
4
6
8
Left Column Force (kN)
Sto
rey
−200 −100 0 1000
2
4
6
8
Right Column Force (kN)
Sto
rey
1M0V2M0V
1M1V2M1V
Design / Reference
C-12

Appendix C Summary of experimental results
Figure C.12 Record MCE-3
0 5 10 15 20 25 30−1.0
1.0 0.50g
Time (s)
Gr. Acc.(g)
Roof Δ@ 0.5%
Bot. Jt. θ@ 0.5%
Top Jt. θ@ 0.5%
0.0 1.0 2.00.0
2.0
4.0← T
0Sa(g)
Period (s)
0.0 1.0 2.00
100
200← T
0Sd(mm)
Period (s)
1.0% 0.0% 1.0%0
20
40
60
80
Bottom Jt. θ (rad)
PT
For
ce (
kN)
0.0 1.0 2.00
2
4
6
8
Peak Floor Acceleration (g)
Sto
rey
0.0% 0.8% 1.6%0
2
4
6
8
Res. & Peak Disp.
Sto
rey
0.0% 0.8% 1.6%0
2
4
6
8
Res. & Peak Inter. Drift
Sto
rey
0 40 80 120 1600
2
4
6
8
Peak Storey Shear (kN)
Sto
rey
0 100 200 300 4000
2
4
6
8
Peak Moment (kN−m)
Sto
rey
30 0 0 30
−36
36
Bottom Gap Opening (mm)
Bot. Jt.(kN)
30 0 0 30
−1818
Top Gap Opening (mm)
Top Jt.(kN)
SCED El.@ 0.5%
−8 −4 0 4 8−60
−30
0
30
60
SCED Elongation (mm)
SC
ED
For
ce (
kN)
−200 −100 0 1000
2
4
6
8
Left Column Force (kN)
Sto
rey
−200 −100 0 1000
2
4
6
8
Right Column Force (kN)
Sto
rey
1M0V2M0V
1M1V2M1V
Design / Reference
C-13

Appendix C Summary of experimental results
Figure C.13 Record INC-25%
0 5 10 15 20 25 30−1.5
1.5
0.13g
Time (s)
Gr. Acc.(g)
Roof Δ@ 1%
Bot. Jt. θ@ 1%
Top Jt. θ@ 1%
0.0 1.0 2.00
5← T
0Sa(g)
Period (s)
0.0 1.0 2.00
200
400← T
0Sd(mm)
Period (s)
2.5% 0.0% 2.5%0
40
80
120
160
Bottom Jt. θ (rad)
PT
For
ce (
kN)
0.0 1.0 2.00
2
4
6
8
Peak Floor Acceleration (g)
Sto
rey
0.0% 1.0% 2.0% 3.0%0
2
4
6
8
Res. & Peak Disp.
Sto
rey
0.0% 1.0% 2.0% 3.0%0
2
4
6
8
Res. & Peak Inter. Drift
Sto
rey
0 100 2000
2
4
6
8
Peak Storey Shear (kN)
Sto
rey
0 100 200 300 4000
2
4
6
8
Peak Moment (kN−m)
Sto
rey
80 40 0 0 40
−36
36
Bottom Gap Opening (mm)
Bot. Jt.(kN)
80 40 0 0 40
−1818
Top Gap Opening (mm)
Top Jt.(kN)
SCED El.@ 1%
−15 0 15−100
0
100
SCED Elongation (mm)
SC
ED
For
ce (
kN)
−200 −100 0 1000
2
4
6
8
Left Column Force (kN)
Sto
rey
−200 −100 0 1000
2
4
6
8
Right Column Force (kN)
Sto
rey
1M0V2M0V
1M1V2M1V
Design / Reference
C-14

Appendix C Summary of experimental results
Figure C.14 Record INC-50%
0 5 10 15 20 25 30−1.5
1.5
0.25g
Time (s)
Gr. Acc.(g)
Roof Δ@ 1%
Bot. Jt. θ@ 1%
Top Jt. θ@ 1%
0.0 1.0 2.00
5← T
0Sa(g)
Period (s)
0.0 1.0 2.00
200
400← T
0Sd(mm)
Period (s)
2.5% 0.0% 2.5%0
40
80
120
160
Bottom Jt. θ (rad)
PT
For
ce (
kN)
0.0 1.0 2.00
2
4
6
8
Peak Floor Acceleration (g)
Sto
rey
0.0% 1.0% 2.0% 3.0%0
2
4
6
8
Res. & Peak Disp.
Sto
rey
0.0% 1.0% 2.0% 3.0%0
2
4
6
8
Res. & Peak Inter. Drift
Sto
rey
0 100 2000
2
4
6
8
Peak Storey Shear (kN)
Sto
rey
0 100 200 300 4000
2
4
6
8
Peak Moment (kN−m)
Sto
rey
80 40 0 0 40
−36
36
Bottom Gap Opening (mm)
Bot. Jt.(kN)
80 40 0 0 40
−1818
Top Gap Opening (mm)
Top Jt.(kN)
SCED El.@ 1%
−15 0 15−100
0
100
SCED Elongation (mm)
SC
ED
For
ce (
kN)
−200 −100 0 1000
2
4
6
8
Left Column Force (kN)
Sto
rey
−200 −100 0 1000
2
4
6
8
Right Column Force (kN)
Sto
rey
1M0V2M0V
1M1V2M1V
Design / Reference
C-15
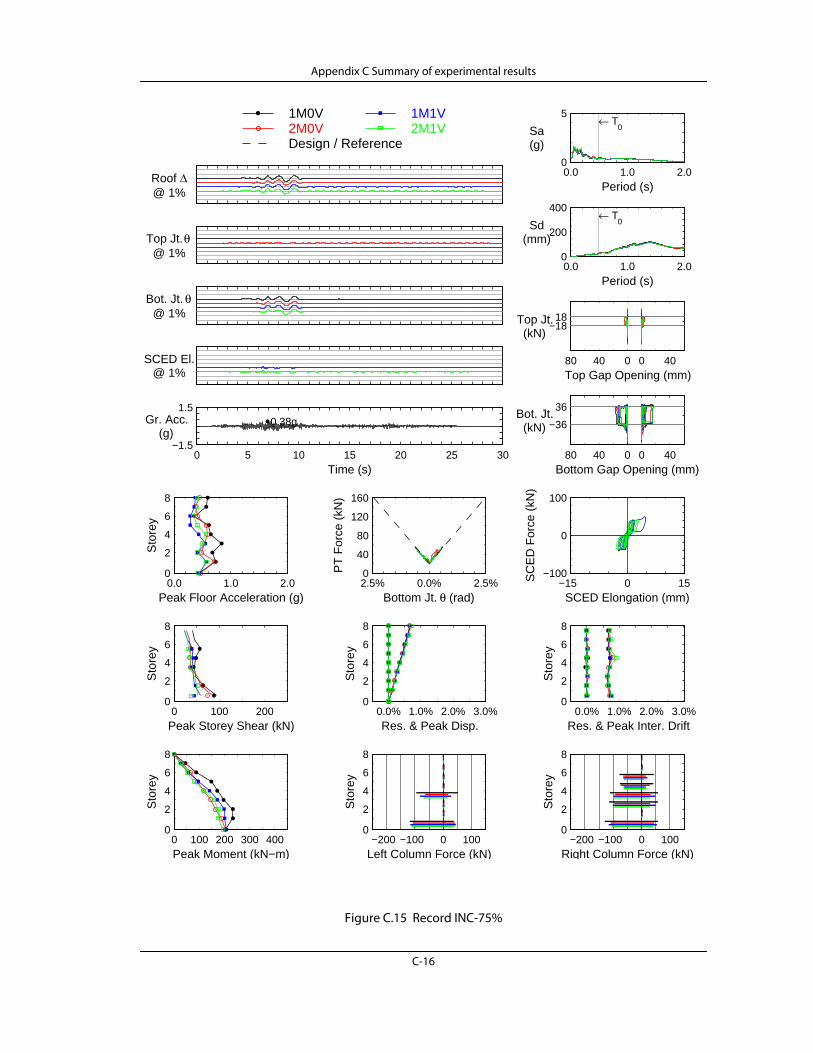
Appendix C Summary of experimental results
Figure C.15 Record INC-75%
0 5 10 15 20 25 30−1.5
1.5 0.38g
Time (s)
Gr. Acc.(g)
Roof Δ@ 1%
Bot. Jt. θ@ 1%
Top Jt. θ@ 1%
0.0 1.0 2.00
5← T
0Sa(g)
Period (s)
0.0 1.0 2.00
200
400← T
0Sd(mm)
Period (s)
2.5% 0.0% 2.5%0
40
80
120
160
Bottom Jt. θ (rad)
PT
For
ce (
kN)
0.0 1.0 2.00
2
4
6
8
Peak Floor Acceleration (g)
Sto
rey
0.0% 1.0% 2.0% 3.0%0
2
4
6
8
Res. & Peak Disp.
Sto
rey
0.0% 1.0% 2.0% 3.0%0
2
4
6
8
Res. & Peak Inter. Drift
Sto
rey
0 100 2000
2
4
6
8
Peak Storey Shear (kN)
Sto
rey
0 100 200 300 4000
2
4
6
8
Peak Moment (kN−m)
Sto
rey
80 40 0 0 40
−36
36
Bottom Gap Opening (mm)
Bot. Jt.(kN)
80 40 0 0 40
−1818
Top Gap Opening (mm)
Top Jt.(kN)
SCED El.@ 1%
−15 0 15−100
0
100
SCED Elongation (mm)
SC
ED
For
ce (
kN)
−200 −100 0 1000
2
4
6
8
Left Column Force (kN)
Sto
rey
−200 −100 0 1000
2
4
6
8
Right Column Force (kN)
Sto
rey
1M0V2M0V
1M1V2M1V
Design / Reference
C-16

Appendix C Summary of experimental results
Figure C.16 Record INC-100%
0 5 10 15 20 25 30−1.5
1.5 0.50g
Time (s)
Gr. Acc.(g)
Roof Δ@ 1%
Bot. Jt. θ@ 1%
Top Jt. θ@ 1%
0.0 1.0 2.00
5← T
0Sa(g)
Period (s)
0.0 1.0 2.00
200
400← T
0Sd(mm)
Period (s)
2.5% 0.0% 2.5%0
40
80
120
160
Bottom Jt. θ (rad)
PT
For
ce (
kN)
0.0 1.0 2.00
2
4
6
8
Peak Floor Acceleration (g)
Sto
rey
0.0% 1.0% 2.0% 3.0%0
2
4
6
8
Res. & Peak Disp.
Sto
rey
0.0% 1.0% 2.0% 3.0%0
2
4
6
8
Res. & Peak Inter. Drift
Sto
rey
0 100 2000
2
4
6
8
Peak Storey Shear (kN)
Sto
rey
0 100 200 300 4000
2
4
6
8
Peak Moment (kN−m)
Sto
rey
80 40 0 0 40
−36
36
Bottom Gap Opening (mm)
Bot. Jt.(kN)
80 40 0 0 40
−1818
Top Gap Opening (mm)
Top Jt.(kN)
SCED El.@ 1%
−15 0 15−100
0
100
SCED Elongation (mm)
SC
ED
For
ce (
kN)
−200 −100 0 1000
2
4
6
8
Left Column Force (kN)
Sto
rey
−200 −100 0 1000
2
4
6
8
Right Column Force (kN)
Sto
rey
1M0V2M0V
1M1V2M1V
Design / Reference
C-17
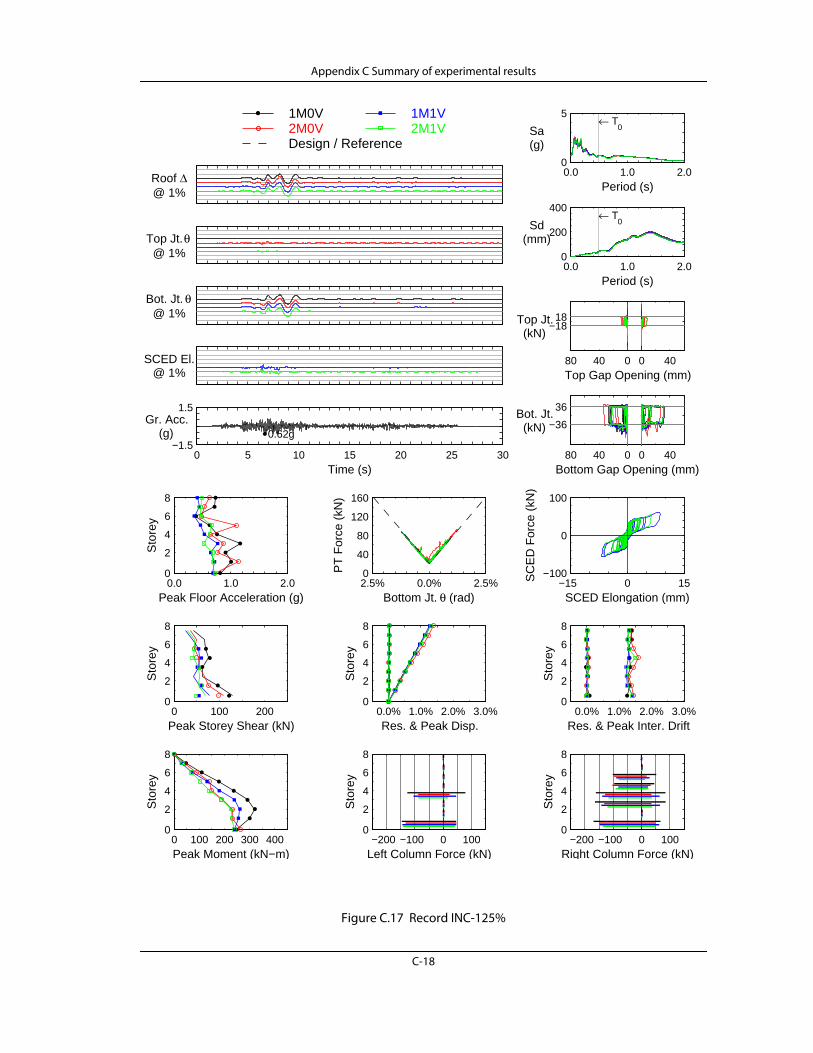
Appendix C Summary of experimental results
Figure C.17 Record INC-125%
0 5 10 15 20 25 30−1.5
1.5
0.62g
Time (s)
Gr. Acc.(g)
Roof Δ@ 1%
Bot. Jt. θ@ 1%
Top Jt. θ@ 1%
0.0 1.0 2.00
5← T
0Sa(g)
Period (s)
0.0 1.0 2.00
200
400← T
0Sd(mm)
Period (s)
2.5% 0.0% 2.5%0
40
80
120
160
Bottom Jt. θ (rad)
PT
For
ce (
kN)
0.0 1.0 2.00
2
4
6
8
Peak Floor Acceleration (g)
Sto
rey
0.0% 1.0% 2.0% 3.0%0
2
4
6
8
Res. & Peak Disp.
Sto
rey
0.0% 1.0% 2.0% 3.0%0
2
4
6
8
Res. & Peak Inter. Drift
Sto
rey
0 100 2000
2
4
6
8
Peak Storey Shear (kN)
Sto
rey
0 100 200 300 4000
2
4
6
8
Peak Moment (kN−m)
Sto
rey
80 40 0 0 40
−36
36
Bottom Gap Opening (mm)
Bot. Jt.(kN)
80 40 0 0 40
−1818
Top Gap Opening (mm)
Top Jt.(kN)
SCED El.@ 1%
−15 0 15−100
0
100
SCED Elongation (mm)
SC
ED
For
ce (
kN)
−200 −100 0 1000
2
4
6
8
Left Column Force (kN)
Sto
rey
−200 −100 0 1000
2
4
6
8
Right Column Force (kN)
Sto
rey
1M0V2M0V
1M1V2M1V
Design / Reference
C-18

Appendix C Summary of experimental results
Figure C.18 Record INC-150%
0 5 10 15 20 25 30−1.5
1.5 0.76g
Time (s)
Gr. Acc.(g)
Roof Δ@ 1%
Bot. Jt. θ@ 1%
Top Jt. θ@ 1%
0.0 1.0 2.00
5← T
0Sa(g)
Period (s)
0.0 1.0 2.00
200
400← T
0Sd(mm)
Period (s)
2.5% 0.0% 2.5%0
40
80
120
160
Bottom Jt. θ (rad)
PT
For
ce (
kN)
0.0 1.0 2.00
2
4
6
8
Peak Floor Acceleration (g)
Sto
rey
0.0% 1.0% 2.0% 3.0%0
2
4
6
8
Res. & Peak Disp.
Sto
rey
0.0% 1.0% 2.0% 3.0%0
2
4
6
8
Res. & Peak Inter. Drift
Sto
rey
0 100 2000
2
4
6
8
Peak Storey Shear (kN)
Sto
rey
0 100 200 300 4000
2
4
6
8
Peak Moment (kN−m)
Sto
rey
80 40 0 0 40
−36
36
Bottom Gap Opening (mm)
Bot. Jt.(kN)
80 40 0 0 40
−1818
Top Gap Opening (mm)
Top Jt.(kN)
SCED El.@ 1%
−15 0 15−100
0
100
SCED Elongation (mm)
SC
ED
For
ce (
kN)
−200 −100 0 1000
2
4
6
8
Left Column Force (kN)
Sto
rey
−200 −100 0 1000
2
4
6
8
Right Column Force (kN)
Sto
rey
1M0V2M0V
1M1V2M1V
Design / Reference
C-19
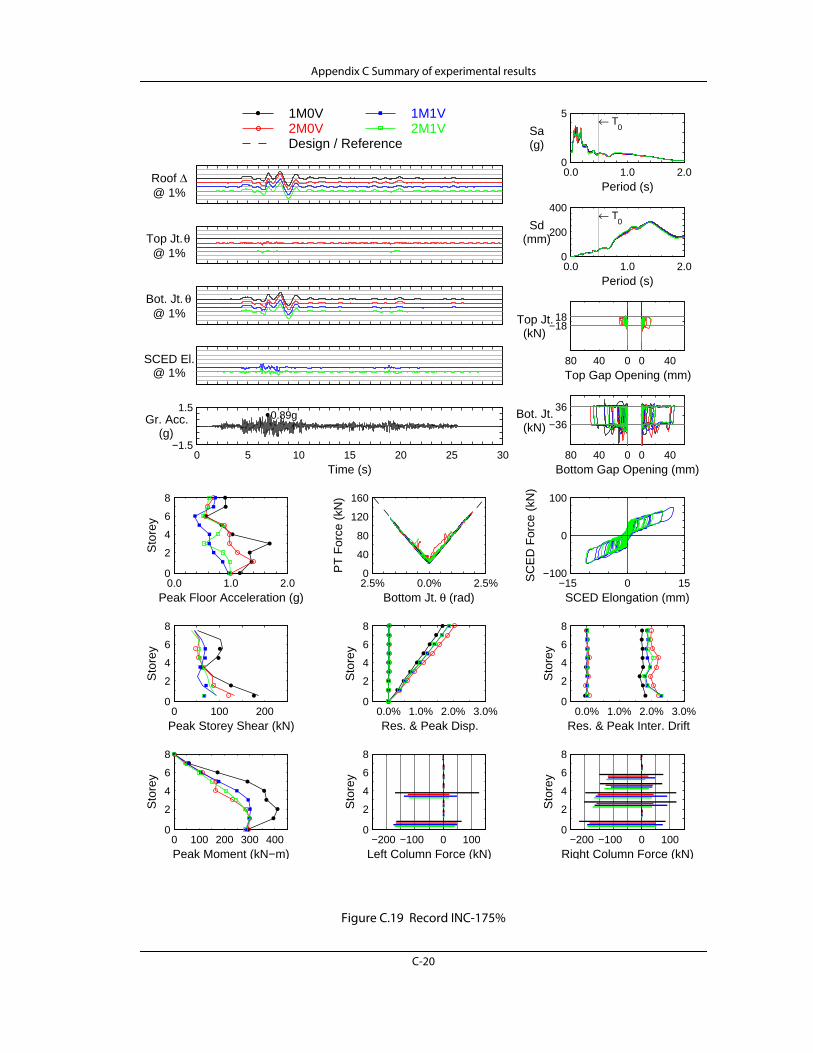
Appendix C Summary of experimental results
Figure C.19 Record INC-175%
0 5 10 15 20 25 30−1.5
1.5 0.89g
Time (s)
Gr. Acc.(g)
Roof Δ@ 1%
Bot. Jt. θ@ 1%
Top Jt. θ@ 1%
0.0 1.0 2.00
5← T
0Sa(g)
Period (s)
0.0 1.0 2.00
200
400← T
0Sd(mm)
Period (s)
2.5% 0.0% 2.5%0
40
80
120
160
Bottom Jt. θ (rad)
PT
For
ce (
kN)
0.0 1.0 2.00
2
4
6
8
Peak Floor Acceleration (g)
Sto
rey
0.0% 1.0% 2.0% 3.0%0
2
4
6
8
Res. & Peak Disp.
Sto
rey
0.0% 1.0% 2.0% 3.0%0
2
4
6
8
Res. & Peak Inter. Drift
Sto
rey
0 100 2000
2
4
6
8
Peak Storey Shear (kN)
Sto
rey
0 100 200 300 4000
2
4
6
8
Peak Moment (kN−m)
Sto
rey
80 40 0 0 40
−36
36
Bottom Gap Opening (mm)
Bot. Jt.(kN)
80 40 0 0 40
−1818
Top Gap Opening (mm)
Top Jt.(kN)
SCED El.@ 1%
−15 0 15−100
0
100
SCED Elongation (mm)
SC
ED
For
ce (
kN)
−200 −100 0 1000
2
4
6
8
Left Column Force (kN)
Sto
rey
−200 −100 0 1000
2
4
6
8
Right Column Force (kN)
Sto
rey
1M0V2M0V
1M1V2M1V
Design / Reference
C-20

Appendix C Summary of experimental results
Figure C.20 Record INC-200%
0 5 10 15 20 25 30−1.5
1.5 1.01g
Time (s)
Gr. Acc.(g)
Roof Δ@ 1%
Bot. Jt. θ@ 1%
Top Jt. θ@ 1%
0.0 1.0 2.00
5← T
0Sa(g)
Period (s)
0.0 1.0 2.00
200
400← T
0Sd(mm)
Period (s)
2.5% 0.0% 2.5%0
40
80
120
160
Bottom Jt. θ (rad)
PT
For
ce (
kN)
0.0 1.0 2.00
2
4
6
8
Peak Floor Acceleration (g)
Sto
rey
0.0% 1.0% 2.0% 3.0%0
2
4
6
8
Res. & Peak Disp.
Sto
rey
0.0% 1.0% 2.0% 3.0%0
2
4
6
8
Res. & Peak Inter. Drift
Sto
rey
0 100 2000
2
4
6
8
Peak Storey Shear (kN)
Sto
rey
0 100 200 300 4000
2
4
6
8
Peak Moment (kN−m)
Sto
rey
80 40 0 0 40
−36
36
Bottom Gap Opening (mm)
Bot. Jt.(kN)
80 40 0 0 40
−1818
Top Gap Opening (mm)
Top Jt.(kN)
SCED El.@ 1%
−15 0 15−100
0
100
SCED Elongation (mm)
SC
ED
For
ce (
kN)
−200 −100 0 1000
2
4
6
8
Left Column Force (kN)
Sto
rey
−200 −100 0 1000
2
4
6
8
Right Column Force (kN)
Sto
rey
1M0V2M0V
1M1V2M1V
Design / Reference
C-21
D Design of example buildings
This appendix presents detailed calculations for the design of the example structures that
are discussed in Chapter 8. The performance-based method is used for the design of each
base rocking joint, and key results are compared to what would be obtained using the
code-consistent approach.
D.1 Two-storey building
D.1.1 Step 0: Establishing design parameters
The building footprint, locations of seismic force resisting systems, and seismic loading
parameters are given in Chapter 8. To avoid amplification of column forces while rocking
(Section 7.4.1), the rocking frame will not be designed to carry any gravity load. There-
fore, in order to maintain the layout of the gravity system, the rocking frame will be
designed with a width of 5.18 m (17 ft) between centrelines of vertical elements, so as to
fit between two gravity columns. Because the rocking system is relatively squat, post-ten-
sioning bars will be used rather than tendons in order to maximize the displacement
capacity of the system prior to post-tensioning rupture. Energy dissipation will be pro-
vided using a friction device.
D-1

D Design of example buildings
D.1.2 Step 1: Design of base rocking joint
Determination of displacement limits
Having established the key design parameters, the first step of the performance-based
design methodology is to determine the limiting peak displacement of the equivalent
SDOF at the IO and CP performance levels, as described in Section 7.3.3. At the IO per-
formance level, equation 7.10 suggests a maximum allowable SDOF displacement of
1.2%. The maximum allowable displacement is also related to the post-tensioning proper-
ties according to equation 7.11. In order to maximize the displacement capacity of the
system before the post-tensioning yields, it will be placed at the centre of the frame
( m or 8.5 ft) and will extend over the full height of the frame
( m or 20 ft). The yield strain of post-tensioning bars is approximately 0.004,
the modulus of elasticity is 205 GPa (29700 ksi), and the ultimate strength is 1030 MPa
(150 ksi) [DSI 2006]. Using equation 7.11, the maximum SDOF displacement prior to
PT yielding is 0.94%, even if no prestress is applied. Rather than meet this strict require-
ment, the decision is made to allow some limited yielding of the post-tensioning bars at
the IO performance level. For varying levels of prestress, Table D.1 shows the expected
inelastic strain in the bars at a peak displacement of 1.2%. Because a friction energy dissi-
pation system is to be used, no displacement limits are required to prevent deterioration of
the energy dissipation at the IO performance level.
At the CP performance level, equation 7.13 limits the allowable SDOF displacement to
2.5%. Taking the fracture strain of post-tensioning as 0.009 [DSI 2006], Table D.1 shows
the maximum allowable SDOF displacement for varying amounts of initial prestress.
Assuming an initial prestress of 25% of ultimate, the maximum allowable SDOF displace-
ment at the CP performance level is 1.82%. For a real structure, it may be advisable to
provide a lock-up device that will limit the base rotation to this quantity, so as to avoid
fracturing the post-tensioning. However, such a device is not designed for this frame in
order to understand what the demand would be without the lock-up device. Like the IO
dPT 2.59=
LPT 6.10=
D-2

D Design of example buildings
performance level, the CP performance level does not require any displacement limits to
prevent deterioration of the energy dissipation.
Calculation of properties of SDOF model
Table D.2 summarizes the calculations used to develop an SDOF representation of the
two-storey structure. The seismic mass at each level was described in Section 8.1. The
effective height is calculated as:
(D.1)
The centroid of the tributary weight is located at:
(D.2)
Assuming base rotations of 1.82% and 1.2% at the CP and IO performance levels, respec-
tively, the design displacement at each level is calculated from equation 7.17 as 87 mm and
57 mm, respectively.
Table D.1. Relationship between initial prestress, inelastic post-tensioning strain at 1.2% SDOF displacement, and SDOF displacement at post-tensioning fracture strain
Prestress(Percentage of Ultimate)
Inelastic post-tensioning strainat 1.2% SDOF displacement
SDOF displacement atpost-tensioning fracture strain
0% 0.11% 2.12%10% 0.16% 2.00%20% 0.21% 1.88%30% 0.26% 1.76%40% 0.31% 1.64%50% 0.36% 1.53%
Table D.2. Calculations for equivalent SDOF model of two-storey frame
storeyheight,
(m)seismic weight,
(kN) (kN-m) (kN-m2)
2 6.096 6437 39 241 239 2121 3.048 10 088 30 748 93 721
total: 16 525 69 989 332 933
Heff332933 kN-m2
69989 kN-m------------------------------------- 4.76 m= =
HW69989 kN-m
16525 kN------------------------------- 4.24 m= =
hi W i
W ihi W ihi2
D-3

D Design of example buildings
The total effective mass for the building is found from equation 7.18 as:
(D.3)
Estimation of fundamental period
The initial period of the structure is estimated from equation 7.19 as 0.27 s.
Selection of target hysteretic parameters
Figure 7.8 is used to determine the hysteretic properties that will achieve the target dis-
placements. For a relatively squat structure, the post-tensioning will provide a relatively
large post-uplift stiffness, so the plots with are assumed for initial design.
Maximum energy dissipation of is selected. Reading from the bottom right plot
in Figure 7.8, the force reduction factor should be approximately 6 based on the CP
performance requirements. To meet the requirements of the IO performance level, a dis-
placement of mm is used to obtain .
The more critical value of is the same as is recommended for the code-consistent
approach (Section 7.3.4). However, the code-consistent approach assumes a smaller fun-
damental period and uses the total tributary mass for each frame, rather than the effective
mass. Both of these result in a larger elastic base shear with the code-consistent approach.
Determination of minimum base rocking moment
The target base rocking moment for the structure is given by equation 7.22 as:
(D.4)
where is taken from the median of the set of ground motions to be used for
analysis (see Figure 8.2).
me69989 kN-m g 2
332933 kN-m2 g ------------------------------------------------ 14713 kN/g= =
k 10 s 2–=
1.0=
R
1.5 57 86= R 1.5 6 9= =
R 6=
Mb rock1.94 g 14713 kN g 4.76 m
6 2 frames ------------------------------------------------------------------------------- 11290 kN-m= =
Sa 0.27 s
D-4

D Design of example buildings
Estimation of contribution from self-weight
Since the frame will not be designed to carry any of the gravity load of the structure, the
moment resistance contributed by the self-weight of the frame is estimated (see Section
7.3.3) as:
(D.5)
The associated self-weight is .
Design of energy dissipation
The friction energy dissipation will be placed at the centre of the frame, and the target slip
load is calculated from equation 7.25 as:
(D.6)
To ensure a fully self-centring response without providing unnecessary overstrength, a
slightly lower slip load of 2000 kN is selected.
Design of post-tensioning
Using equation 7.26 with the post-tensioning at the centre of the frame, the target pre-
stressing force is calculated as:
(D.7)
This prestress is provided using 12 1-1/4” Dywidag bars with a prestress of 25% of the
ultimate tensile strength, such that .
Checking of design assumptions and other requirements
The post-tensioning and energy dissipation were selected to be consistent with the
assumptions that were made to determine the displacement limits of the system.
MW 0.05 11290 kN-m 565 kN-m= =
565 2.59 218 kN=
EDMb rock
dED-----------------
2--- 11290 kN-m
2.59 m------------------------------- 1
2-- 2180 kN= = =
PT 011290 kN-m 565 kN-m 2000 kN 2.59 m + –
2.59 m---------------------------------------------------------------------------------------------------------------------- 2140 kN= =
PT 0 12 0.25 834kN 2500 kN= =
D-5

D Design of example buildings
The minimum expected base rocking moment is computed from equation 7.23:
(D.8)
As desired, this is slightly larger than the minimum required base rocking moment.
The normalized nonlinear stiffness is calculated from equation 7.27:
(D.9)
This is an order of magnitude larger than the assumed value of 10. However, Figure 7.8
shows little sensitivity to the post-uplift stiffness for short-period structures with ,
so no iteration is considered necessary.
The energy dissipation parameter is calculated from equation 7.28:
(D.10)
As desired, this is less than one.
Equation 7.6 is checked to avoid overturning at the CP drift of 1.82%, which is associated
with the ultimate strength of the post tensioning bars:
(D.11)
In addition, equation 7.9 is checked to avoid global uplift:
(D.12)
Checking for uplift due to wind loading
The base moment for each frame that is associated with the factored ULS wind load
according to ASCE 7-10 [ASCE 2010] is 370 kN-m, which is much less than .
Therefore, rocking is not expected under any considered level of wind loading.
Mb rock min 565 2000 2.59 2500 2.59 + + 12230 kN-m= =
k
12 806 205000 6096
------------------------------------------ 2591 2 8262605 4235 –
7356572 9810 4760 2-------------------------------------------------------------------------------------------------------------- 127 s 2–= =
R 10
2 2000 2.59 12230
----------------------------------- 0.847= =
565 2000 2.59 12 834 2.59 + + 31700= 8263 4.24 0.0182 637=
2502 218+ 2720 2000=
Mb rock min
D-6
D Design of example buildings
D.1.3 Step 2: Capacity design of system
Calculation of total tributary seismic weight
The total tributary weight is given in Table D.2 as 16525 kN for the building, or 8263 kN
per frame.
Calculation of base overturning moment at maximum expected base rotation
The maximum expected base rotation is taken as the target normalized displacement at
the CP performance level, 1.82%. This displacement is associated with the ultimate
strength of the post-tensioning bars, so the maximum base moment for each frame is cal-
culated from equation 7.40 as:
(D.13)
Estimation of fundamental period
The fundamental period of the structure is estimated from equation 7.19 as 0.27 s.
Checking whether response can be computed from three modes
Since there are only two floor levels, only two modes will be used. Equation 7.39 is
checked to verify that vertical accelerations may be neglected:
(D.14)
Estimation of periods of second and third modes
The second-mode period is estimated from equation 7.43 as 0.091 s. No additional
modes are considered.
Mb max 565 2000 2.59 12 834 2.59 + + 31700 kN-m= =
12 0.004 205000 806 1000 0.25 834 – 5430 218=
D-7

D Design of example buildings
Determination of spectral accelerations at periods of higher modes
The median-plus-standard-deviation spectral acceleration at a period of 0.091 s is read
from Figure 8.2 as 2.05 g.
Calculation of storey shear, overturning moment, and floor acceleration design envelopes
The first-mode floor acceleration, storey shear, and overturning moment envelopes are
calculated using equations 7.45-7.47, respectively, and are shown in Table D.3. The sec-
ond-mode accelerations, shears, and moments are calculated from equations 7.54, 7.63,
and 7.68, respectively, and are also shown in Table D.3. To calculate the accelerations asso-
ciated with the truncated higher modes using equation 7.74, the product of the peak
ground acceleration and the associated load factor, , is taken as the median-plus-
standard-deviation peak ground acceleration, 1.21 g. The resulting contribution to the
envelope is shown in Table D.3.
The modal contributions to each quantity are combined according to equations 7.70-
7.72, gives the results that are shown in Table D.4. The first mode accounts for most of the
design envelopes, although the second mode contributes some additional shears and mid-
height moment. The truncated higher modes have only a minor influence on the floor
acceleration envelope above the base, but they make the base acceleration equal to the
design peak ground acceleration. The shear at the upper level is not equal to the inertial
force associated with the estimated peak acceleration at the roof level because the pro-
posed design envelopes are based on the assumption of a continuous shear beam with an
infinite number of degrees of freedom, whereas the two-storey frame has only two
degrees of freedom.
Table D.3. Capacity design calculations for two-storey structure
storey,
(g),
(g),
(g),
(kN),
(kN),
(kN-m),
(kN-m)
2 1.89 1.14 0.07 0 0 0 01 0.94 0.91 0.24 5850 870 11 900 36900 0.00 0.00 1.21 7790 2600 31 700 0
iPGA
a1 hi a2 hi ar hi V 1 hi V 2 hi M 1 hi M 2 hi
D-8

D Design of example buildings
Design of elements of frame, shear transfer devices, diaphragms, and collectors
Figure D.1 a shows a preliminary frame configuration and defines the joints of that frame.
The analysis assumes pinned connections at all locations and that the floor diaphragms are
connected to the rocking system at the centre of each level (nodes B and E). Therefore,
the uppermost horizontal elements are not expected to carry any load. To resist any nom-
inal loads that may develop, the same sections are specified for these elements as for those
at the level below.
Based on the free body diagram of the upper part of the frame that is shown in Figure
D.1 b, the braces at the upper level are designed for the axial compression associated with
the ultimate strength of the post-tensioning, together with the axial load due to the shear
at that level, assuming that both are divided equally between the two braces:
(D.15)
This brace compression causes the horizontal element at the first-storey level to act as a
tension tie, as seen from the free body diagram of joint F in Figure D.1 c. Therefore, the
design tension for this element is calculated as:
(D.16)
The braces at the lower level are designed for the combined compression due to the shear
at that level, assuming it is divided equally between the two braces (Figure D.1 d), and the
compression associated with the slip load of the friction energy dissipation device (Figure
D.1 e):
(D.17)
Table D.4. Capacity design accelerations, shears, and moments for two-storey structure
storey,
(g),
(kN),
(kN-m)
2 3.09 0 01 2.09 6720 15 6000 1.21 10 400 31 700
a hi V hi M hi
C fbrace 2 12 834 kN
2 49.6sin----------------------------- 6720 kN
2 49.6cos------------------------+ 11750 kN= =
T fbeam 1 11750 kN 49.6cos 7610 kN= =
C fbrace 1 10400 kN
2 46.6cos------------------------ 2000 kN
2 46.6sin-----------------------+ 8950 kN= =
D-9

D Design of example buildings
Assuming that the base bumpers act only in compression, Figure D.1 f shows a free body
diagram of joint G at the time of maximum tension in the connecting first-storey brace.
This tension is equal to the design compression force, so the design compression for the
lowermost horizontal element is:
(D.18)
Finally, the vertical elements will be designed to be continuous over both levels, even
though they are not expected to carry any load at the upper level other than the tributary
frame self-weight. Referring to Figure D.1 d, the vertical elements at the lower level are
designed for the moment couple associated with the capacity design moment at the base.
In addition, each vertical element must also carry half of the ultimate post-tensioning
force and half of the estimated self-weight of the upper half of the frame. The force from
the energy dissipation does not affect the design forces for these elements because it is
transferred to the foundation through the braces. Thus, the vertical element design com-
pression is calculated as:
(D.19)
Members were chosen to satisfy the requirements of AISC 360-10 [AISC 2010] under the
forces that were calculated above. Other than making the columns continuous over both
Figure D.1. Capacity design scenarios for two-storey frame: (a) definition of joints; (b) upper portion of frame at time of maximum second-storey shear and post-tensioning force; (c) joint F at time of maximum brace compression; (d) section of first storey at time of design first-storey shear and moment; (e) forces on joint E due to energy dissipation force only; (f) joint G at time when bottom left bumper is not in contact
(a)PT
ED ED
A B C
PT
V2
A B C
DE
F
G H
CfCbrace 2
CfCbrace 2
(b)
V1
M1
PT + W(d)
(c)
F
bracecompressiondue to shear
bracecompressiondue to ED
TfTbeam 1
G
total bracetension
CfCbeam 0
CfCcolumn 1
E
(e) (f )
49.6°
46.6°
C fbeam 0 8950 kN 46.6cos 6140 kN= =
C f column 1 31700 kN-m
5.182 m------------------------------- 12 834 kN
2----------------------------- 218 kN 2
2------------------------------+ + 11170 kN= =
D-10

D Design of example buildings
storeys, no attempt is made to improve constructability by repeating the same sections.
Table D.5 summarizes these calculations, and Figure D.2 shows the final frame layout. The
self-weight of the frame as designed is 121 kN, which is less than the 218 kN that was
assumed in design. However, this difference is not significant relative to the quantities that
were calculated above.
Checking response to wind loading
Calculations not shown verified that the members are adequate to carry the factored wind
loads at the ULS level, and that the deflection at the SLS level is less than the limit of
0.25% of the height [CSA 2009].
Table D.5. Summary of design loads for members of two-storey frame
memberdesign loada
(kN)
a. (c) denotes compression; (t) denotes compression; the more critical is given in each case
(mm)section name
(Canada)section name
(US) or
(kN)
top beam 0 2590 W310x202 W12x136 7430 (c)top braces 11750 (c) 4000 W310x375 W12x252 12590 (c)
centre beam 7610 (t) 2590 W310x202 W12x136 8010 (t)lower braces 8950 (c) 3770 W310x283 W12x190 9420 (c)lower beam 6140 (c) 5180 W310x226 W12x152 6650 (c)
columns 11170 (c) 2740 W310x313 W12x210 11230 (c)
Figure D.2. Summary of design of two-storey controlled rocking steel frame
L Cr T r
W31
0x31
3W
12x2
10W
310x
313
W12
x210
W31
0x31
3W
12x2
10W
310x
313
W12
x210
W310x202W12x136
W310x202W12x136
W310x202W12x136
W310x3
75W
12x252
W310x2
83
W12x1
90
W310x375
W12x252
W310x283
W12x190
W310x202W12x136
W310x226W12x152
US designationCanadian designation
PT: 12 x 1-1/4” bars @ 25% fpu(shown curved to emphasize lack
of connection at central joint)
ED: friction devicewith 2000 kN slip load
2 @
3.0
5 m
= 6
.10
m (
20’)
5.18 m (17’)
D-11

D Design of example buildings
D.1.4 Step 2a (optional): Design of higher mode mitigation
Deciding whether to mitigate higher mode effects
Because the design demands come mostly from the first mode for this low-rise frame, no
alternative configurations with higher mode mitigation are considered.
D.1.5 Step 3: Detailing of members and connections
The detailed design of connections is not considered within the scope of this example. For
modelling purposes, it is assumed that the connections will be detailed to respond elasti-
cally at all load levels.
D-12
D Design of example buildings
D.2 Six-storey building
D.2.1 Step 0: Establishing design parameters
Like the two-storey frame, the six-storey frame will not be designed to carry any gravity
load. Therefore, in order to fit between two gravity columns, the frame will be designed
with a width of 8.23 m (27 ft) between centrelines of vertical elements. An unbonded
monostrand post-tensioning system will be used, and energy dissipation will be provided
using either a cast steel yielding brace system [Gray et al. 2012] or a buckling-restrained
brace.
D.2.2 Step 1: Design of base rocking joint
Determination of displacement limits
At the IO performance level, equation 7.10 suggests a maximum allowable SDOF dis-
placement of 1.2%. The energy dissipation will be located at the centre of the frame
( m or 13.5 ft). It is assumed that the energy dissipation can sustain repeated
loading with a maximum displacement of 40 mm at the IO performance level. Equation
7.12 shows that this requires limiting the base rotation to .
For this structure, the post-tensioning is limited to the elastic range more easily than it was
for the two-storey frame, so the post-tensioning will be located along the two column
lines ( m or 27 ft) but will still extend over the full height of the frame
( m or 90 ft). The yield stress, ultimate stress, and modulus of elasticity for
the unbonded tendons as 1670 MPa (243 ksi), 1860 MPa (1270 ksi), and 195000 MPa
(28500 ksi), respectively [DSI 2006]. Table D.6 summarizes the maximum expected strain
in the post-tensioning at a base rotation of , computed using equation
7.11. Assuming a yield strain of %, any prestress up to 60% of the
ultimate strength of the tendons will avoid yield at a base rotation of 0.97%.
dED 4.11=
max 0.97%=
dPT 8.23=
LPT 27.4=
max 0.97%=
1670 195000 0.86=
D-13

D Design of example buildings
At the CP performance level, equation 7.13 limits the allowable SDOF displacement to
2.5%. From equation 7.15, the displacement demand on the energy dissipation is 103 mm
at the CP performance level, which is assumed to be acceptable based on testing of cast
steel yielding brace systems with a similar force capacity to the final design [Gray et al.
2012]. Table D.6 summarizes the maximum expected strain in the post-tensioning at a
base rotation of 2.5%, computed using equation 7.11. In previous tests of controlled rock-
ing systems by Eatherton et al. [2010b], some post-tensioning wires fractured beginning at
strains as low as 0.85%. However, Ma [2010] reached post-tensioning elongations of 1.3%
without fracture of any wires by stressing the strands to 70% of their ultimate strength
before anchoring them at 36% of their ultimate strength. For this reason, it is assumed that
any amount of prestress less than 60% of the ultimate stress will not lead to fracture at a
base rotation of 2.5%.
Calculation of properties of SDOF model
Table D.7 summarizes the calculations that were used to develop an SDOF representation
of the six-storey structure. The seismic mass at each level was described in Section 8.1.
The effective height is calculated as:
(D.20)
The centroid of the tributary weight is located at:
(D.21)
Table D.6. Post-tensioning strain at IO and CP base rotations for different prestress levels
prestress(percentage of ultimate stress)
post-tensioning strain at 0.97% base rotation
post-tensioning strain at 2.5% base rotation
0% 0.29% 0.75%10% 0.39% 0.85%20% 0.48% 0.94%30% 0.58% 1.04%40% 0.67% 1.13%50% 0.77% 1.23%60% 0.86% 1.32%
Heff16442042 kN-m2
868423 kN-m------------------------------------------- 18.93 m= =
HW868423 kN-m
56877 kN---------------------------------- 15.27 m= =
D-14
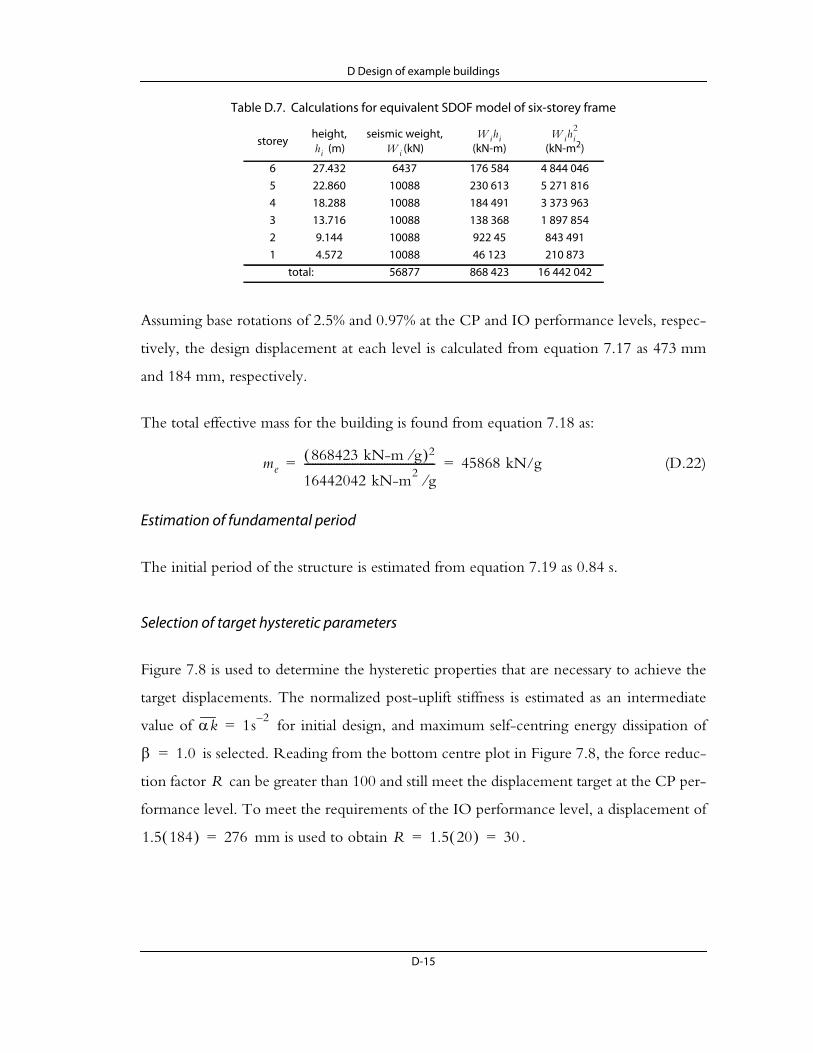
D Design of example buildings
Assuming base rotations of 2.5% and 0.97% at the CP and IO performance levels, respec-
tively, the design displacement at each level is calculated from equation 7.17 as 473 mm
and 184 mm, respectively.
The total effective mass for the building is found from equation 7.18 as:
(D.22)
Estimation of fundamental period
The initial period of the structure is estimated from equation 7.19 as 0.84 s.
Selection of target hysteretic parameters
Figure 7.8 is used to determine the hysteretic properties that are necessary to achieve the
target displacements. The normalized post-uplift stiffness is estimated as an intermediate
value of for initial design, and maximum self-centring energy dissipation of
is selected. Reading from the bottom centre plot in Figure 7.8, the force reduc-
tion factor can be greater than 100 and still meet the displacement target at the CP per-
formance level. To meet the requirements of the IO performance level, a displacement of
mm is used to obtain .
Table D.7. Calculations for equivalent SDOF model of six-storey frame
storeyheight,
(m)seismic weight,
(kN) (kN-m) (kN-m2)
6 27.432 6437 176 584 4 844 0465 22.860 10088 230 613 5 271 8164 18.288 10088 184 491 3 373 9633 13.716 10088 138 368 1 897 8542 9.144 10088 922 45 843 4911 4.572 10088 46 123 210 873
total: 56877 868 423 16 442 042
hi W i
W ihi W ihi2
me868423 kN-m g 2
16442042 kN-m2 g------------------------------------------------- 45868 kN/g= =
k 1s 2–=
1.0=
R
1.5 184 276= R 1.5 20 30= =
D-15

D Design of example buildings
The more critical value of is twice the value that is recommended for the code-
consistent approach (Section 7.3.4). In this case, the code-consistent approach is consider-
ably more conservative than the performance-based approach.
Determination of minimum base rocking moment
The target base rocking moment for the structure is given by equation 7.22 as:
(D.23)
where is taken from the median of the set of ground motions to be used for
analysis (see Figure 8.2).
Estimation of contribution from self-weight
Since the frame will not be designed to carry any of the gravity load of the structure, the
moment resistance contributed by the self-weight of the frame is estimated (see Section
7.3.3) as:
(D.24)
The associated self-weight is .
Design of energy dissipation
The yielding energy dissipation will be placed at the centre of the frame, and the target
yield load is calculated from equation 7.25 as:
(D.25)
To ensure a fully self-centring response without providing unnecessary overstrength, a
slightly lower strength of 1800 kN is selected.
R 30=
Mb rock1.07 g 45868 kN g 18.93 m
30 2 frames ---------------------------------------------------------------------------------- 15530 kN-m= =
Sa 0.84 s
MW 0.05 15530 kN-m 776 kN-m= =
776 4.11 189 kN=
EDMb rock
dED-----------------
2--- 15530 kN-m
4.11 m------------------------------- 1
2-- 1890 kN= = =
D-16

D Design of example buildings
Design of post-tensioning
Using equation 7.26 with the post-tensioning at the edges of the frame, the target pre-
stressing force is calculated as:
(D.26)
This prestress is provided using 14 0.6” Dywidag tendons with a prestress of 25% of the
ultimate tensile strength, such that .
Checking of design assumptions and other requirements
The post-tensioning and energy dissipation were selected to be consistent with the
assumptions that were made to determine the displacement limits of the system.
The minimum expected base rocking moment is computed from equation 7.23:
(D.27)
As desired, this is slightly larger than the minimum required base rocking moment.
The normalized nonlinear stiffness is calculated from equation 7.27:
(D.28)
Although this is less than the assumed value of 1 s-2, the force reduction factor that was
chosen previously would not change with (bottom left corner of Figure
7.8), so no iteration is necessary.
The energy dissipation parameter is calculated from equation 7.28:
(D.29)
As desired, this is less than one.
PT 015530 kN-m 776 kN-m 1800 kN 4.11 m + –
8.23 m---------------------------------------------------------------------------------------------------------------------- 892 kN= =
PT 0 14 0.25 260.7 kN 912 kN= =
Mb rock min 776 1800 4.11 912 8.23 + + 15690 kN-m= =
k
14 140 195000 27432
------------------------------------------ 8230 2 28438733 15268 –
22933856 9810 18933 2-------------------------------------------------------------------------------------------------------------------- 0.61 s 2–= =
k 0.1 s 2–=
2 1800 4.11 15690
----------------------------------- 0.94= =
D-17

D Design of example buildings
Equation 7.6 is checked to avoid overturning at the CP drift of 2.5%. At this drift, equa-
tion 7.7 gives the strain in the post-tensioning as 0.99%, which is more than the yield
strain but less than the assumed ultimate strain of 1.3%. Conservatively underestimating
the force in each tendon as the yield force of 234.5 kN and neglecting any strain harden-
ing of the energy dissipation:
(D.30)
In addition, equation 7.9 is checked to avoid global uplift. It is foreseen that the require-
ments of this equation could be relaxed somewhat to allow some small amount of global
uplift without damage to the frame. In order to provide data on how this would influence
the response, a strain hardening ratio of 1.0 is assumed for the energy dissipator, even
though the strength of this element is expected increase due to strain hardening.
(D.31)
Checking for uplift due to wind loading
The base moment for each frame that is associated with the factored ULS wind load
according to the Directional Procedure of ASCE 7-10 [ASCE 2010] is 13 400 kN-m,
which is less than . Therefore, rocking is not expected under any considered
level of wind loading.
D.2.3 Step 2: Capacity design of system
Calculation of total tributary seismic weight
The total tributary weight is given in Table D.7 as 56900 kN for the building, or
28400 kN per frame.
Calculation of base overturning moment at maximum expected base rotation
The maximum expected base rotation is taken as the target normalized displacement at
the CP performance level, 2.5%. The post-tensioning force is conservatively estimated as
776 1800 4.11 14 234.5 8.23 + + 35200= 28439 15.268 0.025 10860=
2 912 189+ 2014 1.0 1800 =
Mb rock min
D-18

D Design of example buildings
equal to its ultimate strength. Unlike the global uplift check above, where strain hardening
of the energy dissipator was neglected, the strain hardening ratio is estimated as 1.5 [Choi
et al. 2008] for the capacity design of the system. This is done because it is not envisioned
that this requirement could be relaxed, since this could result in damage to the frame.
The maximum base moment for each frame is calculated from equation 7.40 as:
(D.32)
Estimation of fundamental period
The fundamental period of the structure is estimated from equation 7.19 as 0.84 s.
Checking whether response can be computed from three modes
Using the properties of the design spectrum from Table 8.2, the corner period of the
acceleration spectrum is calculated from equation 7.42:
(D.33)
Since the fundamental period is less than three times , equation 7.41 is satisfied and no
more than three modes are required.
Equation 7.39 is checked to verify that vertical accelerations may be neglected:
(D.34)
Estimation of periods of second and third modes
The second- and third-mode periods are estimated from equations 7.43 and 7.44 as
0.280 s and 0.168 s, respectively.
Mb max 776 1.5 1800 4.11 14 260.7 8.23 + + 41900 kN-m= =
TS
23-- 1.50 0.60
23-- 1.0 1.5 ---------------------------------- 0.6 s= =
TS
14 234.5 0.25 260.7 – 2370 189=
D-19

D Design of example buildings
Determination of spectral accelerations at periods of higher modes
The median-plus-standard-deviation spectral accelerations at periods of 0.280 s and
0.168 s are read from Figure 8.2 as 2.98 g and 2.73 g, respectively.
Calculation of storey shear, overturning moment, and floor acceleration design envelopes
The first-mode floor acceleration, storey shear, and overturning moment envelopes are
calculated using equations 7.45-7.47, respectively, and are shown in Table D.8. The sec-
ond- and third-mode accelerations, shears, and moments are calculated from equations
7.54-7.55, 7.63-7.64, and 7.68-7.69, respectively, and are also shown in Table D.8. To cal-
culate the accelerations associated with the truncated higher modes using equation 7.74,
the product of the peak ground acceleration and the associated load factor, , is
taken as the median-plus-standard-deviation peak ground acceleration, 1.21 g. The result-
ing contribution to the envelope is shown in Table D.8.
The modal contributions to each quantity are combined according to equations 7.70-
7.72, giving the results that are shown in Table D.9. The first mode accounts for most of
the base overturning moment, but the second mode dominates most other response quan-
tities. The truncated higher modes have only a minor influence on the floor acceleration
envelope above the base, but they make the base acceleration equal to the design peak
ground acceleration.
Table D.8. Capacity design calculations for six-storey structure
storey(g) (g) (g) (g) (kN) (kN) (kN) (kN-m) (kN-m) (kN-m)
6 0.16 1.65 0.63 0.21 0 0 0 0 0 05 0.13 0.96 0.10 0.04 700 6510 1980 4100 16 300 55004 0.11 0.25 0.57 0.15 1270 8260 690 9300 52 300 12 8003 0.08 1.32 0.42 0.05 1720 4360 2020 15 700 83 100 94002 0.05 1.69 0.34 0.23 2040 3120 2240 23 300 86 600 17001 0.03 1.15 0.61 0.17 2230 10 170 350 32 000 55 200 65000 0.00 0.00 0.00 1.21 2290 13 020 2010 41 900 0 0
iPGA
a1 hi a2 hi a3 hi ar hi V 1 hi V 2 hi V 3 hi M 1 hi M 2 hi M 3 hi
D-20

D Design of example buildings
Design of elements of frame, shear transfer devices, diaphragms, and collectors
Each brace is designed to carry half of the larger of the shear at the floor level above and
that at the floor level below. In addition, the first-storey braces are designed to also carry
half the compression associated with the maximum expected force in the energy dissipa-
tion element, assuming a strain hardening ratio of 1.5. Table D.10 summarizes these calcu-
lations, together with the members that are chosen to satisfy the requirements of AISC
360-10 [AISC 2010]. No attempt is made to improve constructability by maintaining the
same sections along the height of the building.
At each level, the moment demand is taken as the larger of the moments at the storeys
above and below (Table D.9) and is designed to be carried as a tension-compression cou-
ple between the two columns. In addition, the top two levels of columns are designed for
the ultimate strength of the post-tensioning at each column, which is slightly more load
than is expected at the design base rotation of 2.5% at the CP performance level. For the
lower four storeys, since only one of the two sets of post-tensioning is elongated at a time,
Table D.9. Capacity design accelerations, shears, and moments for six-storey structure
storey(g) (kN) (kN-m)
6 2.14 0 05 1.14 7500 21 2004 0.88 9560 63 1003 1.52 6520 99 3002 2.01 5870 109 9001 1.50 12 400 87 6000 1.21 15 470 41 900
Table D.10. Summary of brace design calculations for six-storey frame
storeyload due toshear (kN)
load due toED (kN)
total designload (kN) (mm)
section name (Canada)
section name(US) (kN)
6 5610 0 5610 6150 W360x196 W14x132 57305 7150 0 7150 6150 W360x237 W14x159 71604 7150 0 7150 6150 W360x237 W14x159 71603 4880 0 4880 6150 W360x179 W14x120 52202 9270 0 9270 6150 W360x314 W14x211 95401 11 140 1880 13 020 5930 W360x421 W14x283 13 260
a hi V hi M hi
L Cr
D-21
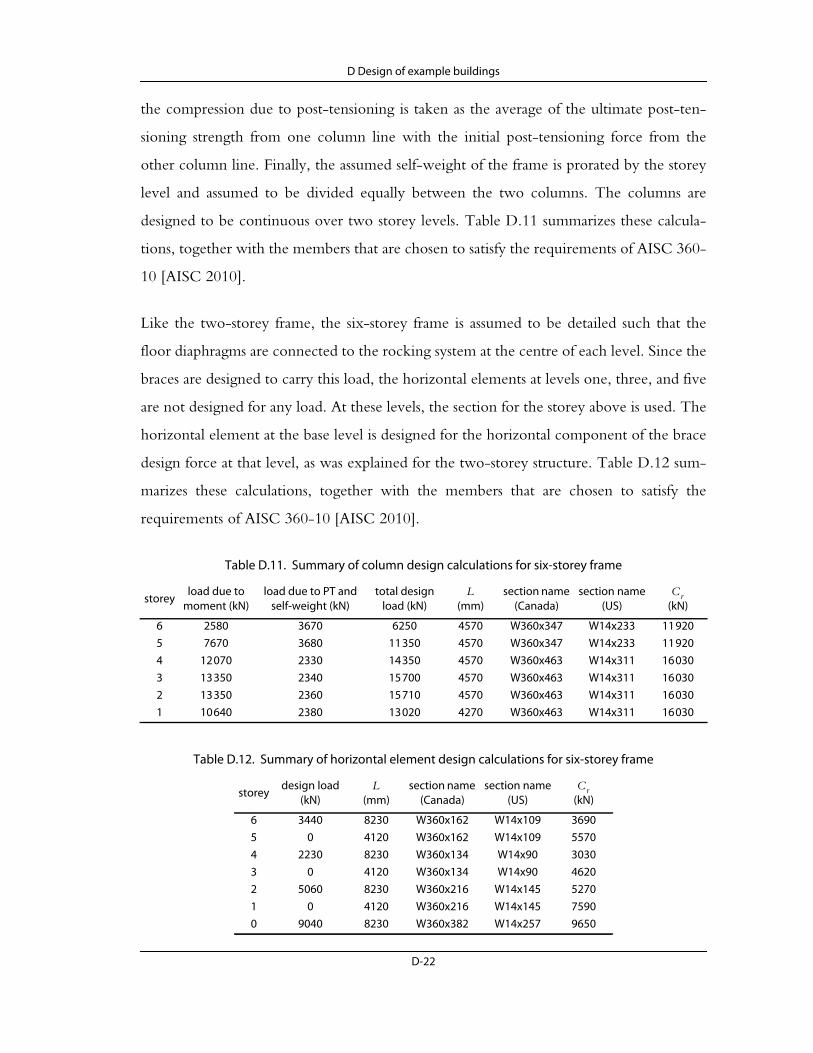
D Design of example buildings
the compression due to post-tensioning is taken as the average of the ultimate post-ten-
sioning strength from one column line with the initial post-tensioning force from the
other column line. Finally, the assumed self-weight of the frame is prorated by the storey
level and assumed to be divided equally between the two columns. The columns are
designed to be continuous over two storey levels. Table D.11 summarizes these calcula-
tions, together with the members that are chosen to satisfy the requirements of AISC 360-
10 [AISC 2010].
Like the two-storey frame, the six-storey frame is assumed to be detailed such that the
floor diaphragms are connected to the rocking system at the centre of each level. Since the
braces are designed to carry this load, the horizontal elements at levels one, three, and five
are not designed for any load. At these levels, the section for the storey above is used. The
horizontal element at the base level is designed for the horizontal component of the brace
design force at that level, as was explained for the two-storey structure. Table D.12 sum-
marizes these calculations, together with the members that are chosen to satisfy the
requirements of AISC 360-10 [AISC 2010].
Table D.11. Summary of column design calculations for six-storey frame
storeyload due to
moment (kN)load due to PT and
self-weight (kN)total design
load (kN) (mm)section name
(Canada)section name
(US) (kN)
6 2580 3670 6250 4570 W360x347 W14x233 11 9205 7670 3680 11 350 4570 W360x347 W14x233 11 9204 12 070 2330 14 350 4570 W360x463 W14x311 16 0303 13 350 2340 15 700 4570 W360x463 W14x311 16 0302 13 350 2360 15 710 4570 W360x463 W14x311 16 0301 10 640 2380 13 020 4270 W360x463 W14x311 16 030
Table D.12. Summary of horizontal element design calculations for six-storey frame
storeydesign load
(kN) (mm)section name
(Canada)section name
(US) (kN)
6 3440 8230 W360x162 W14x109 36905 0 4120 W360x162 W14x109 55704 2230 8230 W360x134 W14x90 30303 0 4120 W360x134 W14x90 46202 5060 8230 W360x216 W14x145 52701 0 4120 W360x216 W14x145 75900 9040 8230 W360x382 W14x257 9650
L Cr
L Cr
D-22
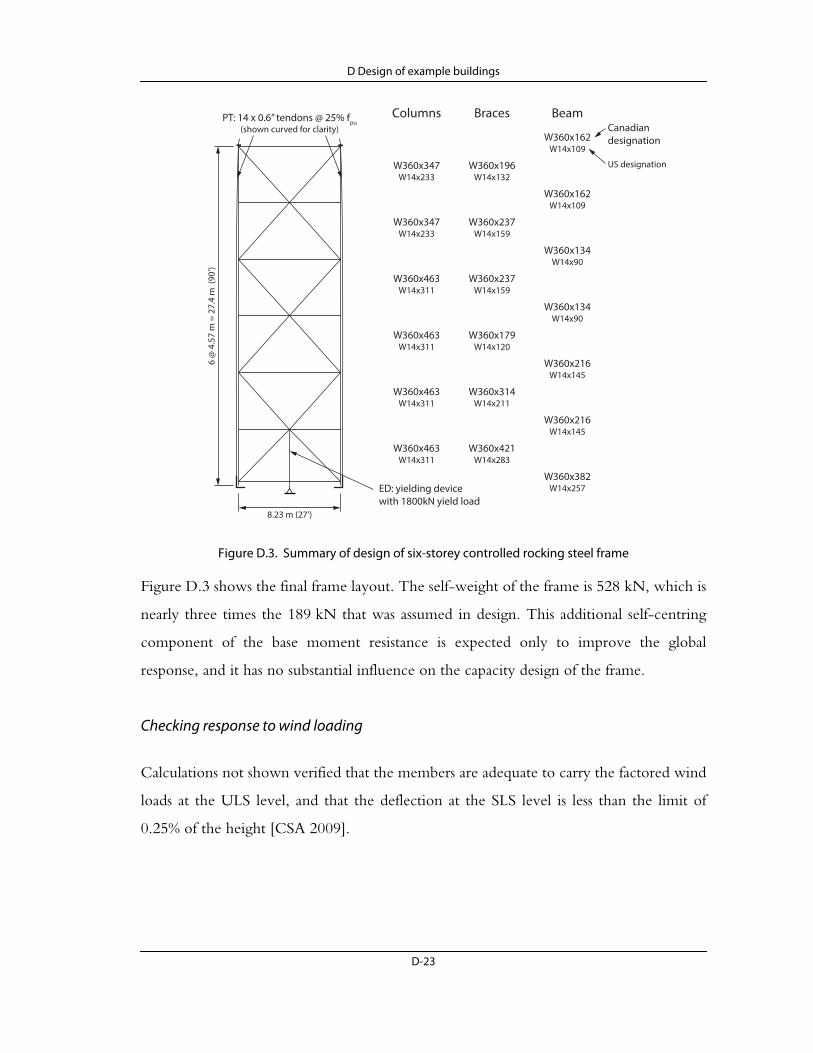
D Design of example buildings
Figure D.3 shows the final frame layout. The self-weight of the frame is 528 kN, which is
nearly three times the 189 kN that was assumed in design. This additional self-centring
component of the base moment resistance is expected only to improve the global
response, and it has no substantial influence on the capacity design of the frame.
Checking response to wind loading
Calculations not shown verified that the members are adequate to carry the factored wind
loads at the ULS level, and that the deflection at the SLS level is less than the limit of
0.25% of the height [CSA 2009].
Figure D.3. Summary of design of six-storey controlled rocking steel frame
W360x347W14x233
Columns
W360x196W14x132
Braces
W360x162W14x109
W360x347W14x233
W360x237W14x159
W360x162W14x109
W360x463W14x311
W360x237W14x159
W360x134W14x90
W360x463W14x311
W360x179W14x120
W360x134W14x90
W360x463W14x311
W360x314W14x211
W360x216W14x145
W360x463W14x311
W360x421W14x283
W360x216W14x145
W360x382W14x257
Beam
US designation
Canadiandesignation
ED: yielding devicewith 1800kN yield load
6 @
4.5
7 m
= 2
7.4
m (
90’)
8.23 m (27’)
PT: 14 x 0.6” tendons @ 25% fpu(shown curved for clarity)
D-23

D Design of example buildings
D.2.4 Step 2a (optional): Design of higher mode mitigation
Deciding whether to mitigate higher mode effects and selecting mitigation technique
Table D.8 showed that the second mode contributed more the capacity design envelopes
for this frame than the first mode did. In order to mitigate these higher mode effects, an
alternative configuration with two rocking sections is also considered. Because the largest
second-mode moment is at the second storey (Table D.8), the upper rocking joint is
placed there. Other locations could also be considered, but the greatest effect is expected
by placing the joint where the moment demand is the greatest.
Design of upper rocking joint
The base rocking moment of the system was calculated in equation D.27 as 15690 kN-m.
Therefore, equation 7.75 states that the rocking moment at the upper joint should be:
(D.35)
From equations 7.76 and D.29, the energy dissipation parameter at the upper rocking
joint should be at least 0.94. The moment resistance contributed by the self-weight of the
frame is estimated by assuming a uniform distribution of the frame weight from equation
D.24:
(D.36)
The post-tensioning tendons that were already designed will continue across the upper
joint and will contribute the same overturning moment resistance there as they do at the
base:
(D.37)
Therefore, equation 7.76 requires:
(D.38)
Mupper rock 15690 1 1.5 9.14427.432---------------- – 0.5 9.144
27.432---------------- 2
+ 8720 kN-m=
Mupper W 189 9.14427.432---------------- 4.11 518 kN-m= =
Mupper PT 912 8.23 7510 kN-m= =
upper2Mupper ED
Mupper ED Mupper W Mupper PT+ +------------------------------------------------------------------------------------- 0.94=
D-24

D Design of example buildings
so . This will be provided in the same way as at the base, with a
central energy dissipation element that has a yield strength of 1800 kN such that:
(D.39)
In addition, equation 7.9 is checked to avoid global uplift. As at the base joint, a strain
hardening ratio of 1.0 is assumed so as to demonstrate how this influences the response.
(D.40)
As shown in Figure D.4, the braces at the second storey are reversed to provide a lower
anchorage for this energy dissipator.
Modification of design envelopes
The capacity design forces for the frame with two rocking sections are calculated using the
maximum base moment from equation D.32, together with a moment at the upper rock-
ing joint that is calculated with the same assumptions as at the base:
(D.41)
Linear interpolation between at the base, at the upper rocking joint,
and zero at the roof gives the values for the first-mode overturning moments that are sum-
marized in Table D.13. Although these values are larger than they were with rocking only
at the base, it will be seen that the total design overturning moments are less than they
were in that case. The moments in the second and third modes are calculated from equa-
tions 7.68 and 7.69 with for the lower section and
Table D.13. Capacity design calculations for six-storey structure with upper rocking joint
storey(g) (g) (g) (g) (kN) (kN) (kN) (kN-m) (kN-m) (kN-m)
6 0.16 0.83 0.32 0.21 0 0 0 0 0 05 0.13 0.48 0.05 0.04 700 3260 990 10 400 16 200 47004 0.11 0.13 0.29 0.15 1270 4130 340 20 800 40 600 44003 0.08 0.66 0.21 0.05 1720 2180 1010 31 200 36 600 26002 0.05 0.84 0.17 0.23 2040 1560 1120 41 700 0 01 0.03 0.58 0.30 0.17 2230 5080 170 41 800 6500 5000 0.00 0.00 0.00 1.21 2290 6510 1000 41 900 0 0
Mupper ED 7180 kN-m
Mupper ED 1800 4.11 7400 kN-m= =
2 912 189 9.14427.432---------------- + 1950 kN 1800 kN=
Mupper max 516 14 260.7 8.23 1.5 1800 4.11 + + 41700 kN-m= =
Mb max Mupper max
Wtrib 10088 10088 2+ 2 kN=
a1 hi a2 hi a3 hi ar hi V 1 hi V 2 hi V 3 hi M 1 hi M 2 hi M 3 hi
D-25

D Design of example buildings
for the upper section. For each sec-
tion, and are taken relative to the rocking joint at the base of that section, is cal-
culated from equation 7.19 with those heights, and and are estimated using
equations 7.43 and 7.44. Table D.14 summarizes the properties of the upper and lower
sections, including the median-plus-standard-deviation spectral accelerations that are used
for .
The first-mode accelerations and shears in Table D.13 are the same as they were without
an upper rocking joint, as are the accelerations associated with the truncated higher
modes. All second- and third-mode accelerations and shears are half of what they were
without an upper rocking joint. The modal contributions according to equations 7.70-
7.72 are given in Table D.15.
Table D.14. Estimated periods and spectral accelerations for rocking sections of six-storey frame
quantityvalue for lower rocking section
value for upper rocking section
height, 9.14 m 18.29 m
first-mode period, 0.368 s 0.619 s
second-mode period, 0.123 s 0.206 s
third-mode period, 0.074 s 0.124 s
second-mode median-plus-standard-deviation spectral acceleration, 2.61 g 2.97 g
third-mode median-plus-standard-deviation spectral acceleration, 1.77 g 2.62 g
Wtrib 6437 3 10088 10088 2+ + 2 kN=
z H T 1
T 2 T 3
iSa
H
T 1
T 2
T 3
Sa T 2
Sa T 2
D-26

D Design of example buildings
Design of elements of frame, shear transfer devices, diaphragms, and collectors
The member capacity design forces are calculated in a similar manner to what was done
for the previous two examples. Relative to the previous six-storey frame design, the main
differences are:
• The second-storey braces are oriented in the opposite direction in order to provide an
anchorage point for the energy dissipator at the upper rocking joint.
• To accommodate the upper joint, the braces above the upper rocking joint are slightly
shorter and at a different inclination.
• Considering the transfer of forces through the upper rocking joint, the vertical mem-
bers below the upper rocking joint are designed for the combined load due to the
weight of the upper rocking section, the maximum expected post-tensioning force
from one set of tendons and the initial post-tensioning force from the other set, and
the overstrength force in the energy dissipator.
• The beam above the upper rocking joint is designed for the horizontal component of
the design force in the third-storey brace.
• The beam below the upper rocking joint is designed to carry the third-storey shear in
tension.
• The first-storey beam is designed for the horizontal component of the design force in
the second-storey brace.
Table D.15. Capacity design accelerations, shears, and moments for six-storey structure with upper rocking joint
storey(g) (kN) (kN-m)
6 1.25 0 05 0.66 4100 27 3004 0.57 5420 61 7003 0.83 4120 68 0002 1.14 3960 41 7001 0.85 7310 48 3000 1.21 8880 41 900
a hi V hi M hi
D-27

D Design of example buildings
Tables D.16-D.18 summarize these calculations, together with the members that are cho-
sen to satisfy the requirements of AISC 360-10 [AISC 2010]. The columns are designed
in two-storey sections, but no other attempt is made to improve constructability by main-
taining the same sections along the height of the building.
Table D.16. Summary of brace design calculations for six-storey frame with upper rocking joint
storeyload due toshear (kN)
load due toED (kN)
total designload (kN) (mm)
section name (Canada)
section name(US) (kN)
6 3070 0 3070 6150 W360x134 W14x90 38905 4050 0 4050 6150 W360x147 W14x99 42804 4050 0 4050 6150 W360x147 W14x99 42803 2970 1880 4840 5930 W360x179 W14x120 53302 5470 1820 7280 6150 W360x262 W14x176 79701 6400 1880 8270 5930 W360x287 W14x193 8920
Table D.17. Summary of column design calculations for six-storey frame with upper rocking joint
storeyload due to
moment (kN)load due to PT, ED,
and self-weight (kN)total design
load (kN) (mm)section name
(Canada)section name
(US) (kN)
6 3320 3670 6990 4570 W360x347 W14x233 11 9205 7490 3680 11170 4570 W360x347 W14x233 11 9204 8260 2330 10590 4570 W360x314 W14x211 10 7303 8260 2340 10600 4570 W360x314 W14x211 10 7302 N/A 7420 7420 4570 W360x237 W14x159 80701 N/A 7450 7450 4270 W360x237 W14x159 8220
Table D.18. Summary of horizontal element design calculations for six-storey frame with upper rocking joint
storeydesign load
(kN) (mm)section name
(Canada)section name
(US) (kN)
6 2020 8230 W360x134 W14x90 30305 0 4120 W360x134 W14x90 46204 1440 8230 W360x134 W14x90 30303 0 4120 W360x134 W14x90 4620
2+ 3360 8230 W360x162 W14x109 3690
2-4120
(tension)4120 W360x110 W14x74
4350 (tension)
1 4870 4120 W360x147 W14x99 50800 5740 8230 W360x237 W14x159 5810
L Cr
L Cr
L Cr
D-28

D Design of example buildings
Figure D.4 shows the final frame layout. The self-weight of the frame as designed is
393 kN, which is 26% less than the self-weight of the frame that was designed to rock
only at the base.
Checking response to wind loading
Calculations not shown verified that the members are adequate to carry the factored wind
loads at the ULS level, and that the deflection at the SLS level is less than the limit of
0.25% of the height [CSA 2009].
Figure D.4. Summary of design of six-storey controlled rocking steel frame with two rocking sections
W360x347W14x233
Columns
W360x134W14x90
Braces
W360x134W14x90
W360x347W14x233
W360x147W14x99
W360x134W14x90
W360x314W14x211
W360x147W14x99
W360x134W14x90
W360x314W14x211
W360x179W14x120
W360x134W14x90
W360x237W14x159
W360x262W14x176
W360x110W14x74
W360x162W14x109
W360x237W14x159
W360x287W14x193
W360x147W14x99
W360x237W14x159
Beam
US designation
Canadiandesignation
PT: 14 x 0.6” tendons @ 25% fpu(shown curved for clarity)
ED: yielding devicewith 1800kN yield load
6 @
4.5
7 m
= 2
7.4
m (
90’)
8.23 m (27’)
D-29
D Design of example buildings
D.2.5 Step 3: Detailing of members and connections
The detailed design of connections is not considered within the scope of this example. For
modelling purposes, it is assumed that the connections will be detailed to respond elasti-
cally at all load levels.
D-30
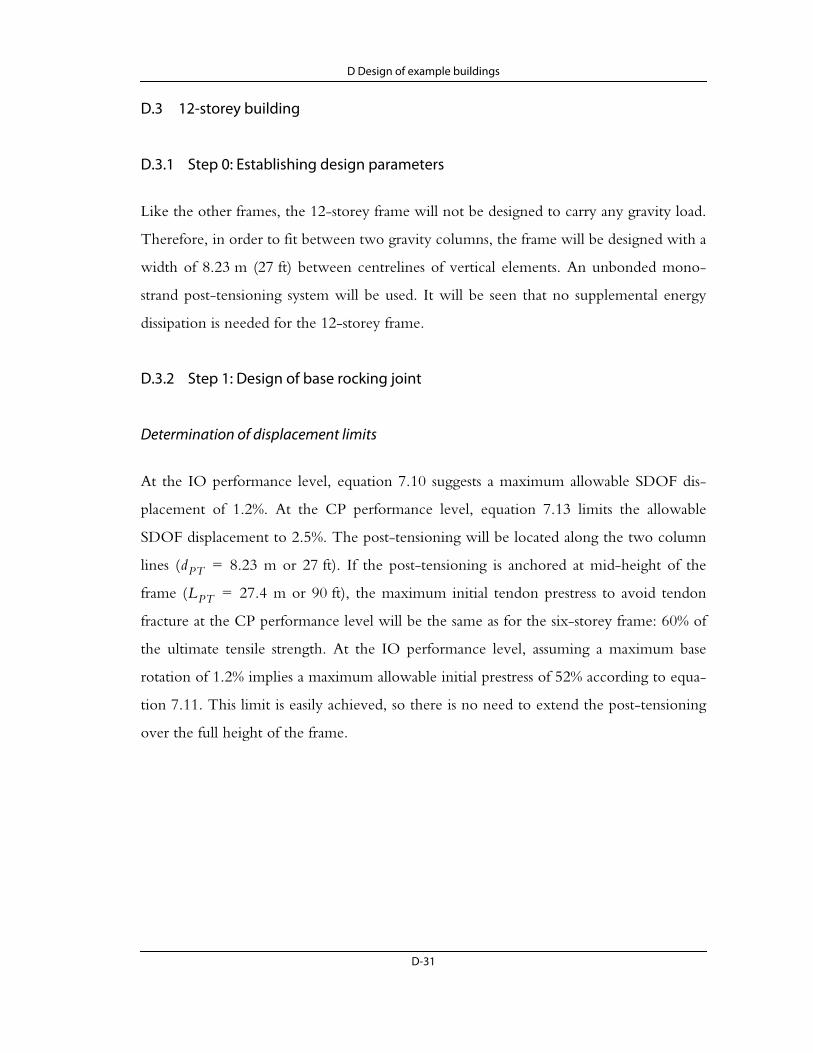
D Design of example buildings
D.3 12-storey building
D.3.1 Step 0: Establishing design parameters
Like the other frames, the 12-storey frame will not be designed to carry any gravity load.
Therefore, in order to fit between two gravity columns, the frame will be designed with a
width of 8.23 m (27 ft) between centrelines of vertical elements. An unbonded mono-
strand post-tensioning system will be used. It will be seen that no supplemental energy
dissipation is needed for the 12-storey frame.
D.3.2 Step 1: Design of base rocking joint
Determination of displacement limits
At the IO performance level, equation 7.10 suggests a maximum allowable SDOF dis-
placement of 1.2%. At the CP performance level, equation 7.13 limits the allowable
SDOF displacement to 2.5%. The post-tensioning will be located along the two column
lines ( m or 27 ft). If the post-tensioning is anchored at mid-height of the
frame ( m or 90 ft), the maximum initial tendon prestress to avoid tendon
fracture at the CP performance level will be the same as for the six-storey frame: 60% of
the ultimate tensile strength. At the IO performance level, assuming a maximum base
rotation of 1.2% implies a maximum allowable initial prestress of 52% according to equa-
tion 7.11. This limit is easily achieved, so there is no need to extend the post-tensioning
over the full height of the frame.
dPT 8.23=
LPT 27.4=
D-31

D Design of example buildings
Calculation of properties of SDOF model
Table D.19 summarizes the calculations used to develop an SDOF representation of the
12-storey structure. The seismic mass at each level was described in Section 8.1. The
effective height is calculated as:
(D.42)
The centroid of the tributary weight is located at:
(D.43)
Assuming base rotations of 2.5% and 1.2% at the CP and IO performance levels, respec-
tively, the design displacement at each level is calculated from equation 7.17 as 928 mm
and 445 mm, respectively.
The effective mass is found from equation 7.18 as:
(D.44)
Table D.19. Calculations for equivalent SDOF model of 12-storey frame
storeyheight,
(m)seismic weight,
(kN) (kN-m) (kN-m2)
12 54.864 6437 353 168 19 376 18511 50.292 10088 507 349 25 515 59210 45.720 10088 461 226 21 087 2669 41.148 10088 415 104 17 080 6858 36.576 10088 368 981 13 495 8507 32.004 10088 322 858 10 332 7606 27.432 10088 276 736 7 591 4165 22.860 10088 230 613 5 271 8164 18.288 10088 184 491 3 373 9633 13.716 10088 138 368 1 897 8542 9.144 10088 922 45 843 4911 4.572 10088 46 123 210 873
total: 117406 3 397 261 126 077 750
Heff126077750 kN-m2
3397261 kN-m--------------------------------------------- 37.1 m= =
HW3397261 kN-m
117406 kN------------------------------------- 28.9 m= =
me3397261kN-m g 2
126077750kN-m2 g ------------------------------------------------------- 91542 kN g= =
hi W i
W ihi W ihi2
D-32
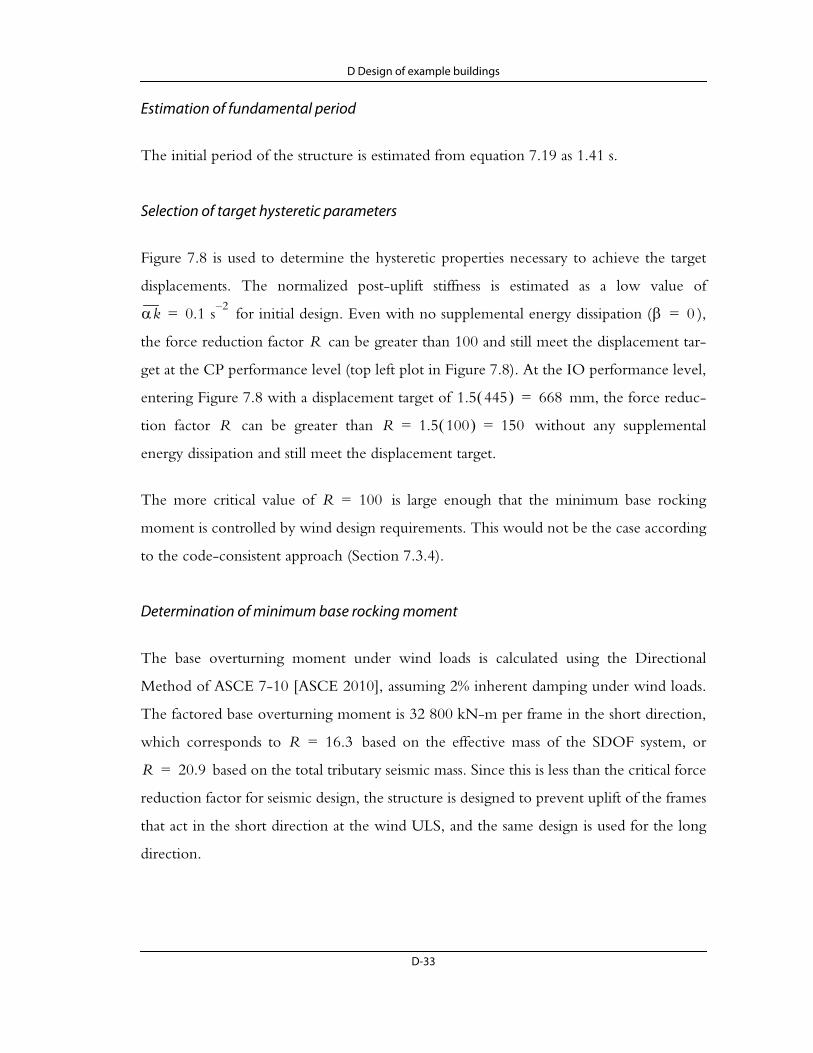
D Design of example buildings
Estimation of fundamental period
The initial period of the structure is estimated from equation 7.19 as 1.41 s.
Selection of target hysteretic parameters
Figure 7.8 is used to determine the hysteretic properties necessary to achieve the target
displacements. The normalized post-uplift stiffness is estimated as a low value of
for initial design. Even with no supplemental energy dissipation ( ),
the force reduction factor can be greater than 100 and still meet the displacement tar-
get at the CP performance level (top left plot in Figure 7.8). At the IO performance level,
entering Figure 7.8 with a displacement target of mm, the force reduc-
tion factor can be greater than without any supplemental
energy dissipation and still meet the displacement target.
The more critical value of is large enough that the minimum base rocking
moment is controlled by wind design requirements. This would not be the case according
to the code-consistent approach (Section 7.3.4).
Determination of minimum base rocking moment
The base overturning moment under wind loads is calculated using the Directional
Method of ASCE 7-10 [ASCE 2010], assuming 2% inherent damping under wind loads.
The factored base overturning moment is 32 800 kN-m per frame in the short direction,
which corresponds to based on the effective mass of the SDOF system, or
based on the total tributary seismic mass. Since this is less than the critical force
reduction factor for seismic design, the structure is designed to prevent uplift of the frames
that act in the short direction at the wind ULS, and the same design is used for the long
direction.
k 0.1 s 2–= 0=
R
1.5 445 668=
R R 1.5 100 150= =
R 100=
R 16.3=
R 20.9=
D-33

D Design of example buildings
Estimation of contribution from self-weight
Since the frame will not be designed to carry any of the gravity load of the structure, the
moment resistance contributed by the self-weight of the frame is estimated (see Section
7.3.3) as:
(D.45)
The associated self-weight is .
Design of energy dissipation
No energy dissipation is needed to meet the design requirements for the 12-storey frame.
Design of post-tensioning
Using equation 7.26 with the post-tensioning at the edges of the frame, the target pre-
stressing force is calculated as:
(D.46)
This prestress will be provided using 30 0.6” Dywidag tendons with a prestress of 50% of
the ultimate tensile strength, such that .
Checking of design assumptions and other requirements
The post-tensioning and was selected to be consistent with the assumptions that were
made to determine the displacement limits of the system.
The minimum expected base rocking moment is computed from equation 7.23:
(D.47)
As desired, this is slightly larger than the minimum required base rocking moment.
MW 0.05 32800 kN-m 1640 kN-m= =
1640 4.11 399 kN=
PT 032800 kN-m 1640 kN-m–
8.23 m------------------------------------------------------------------ 3790 kN= =
PT 0 30 0.50 260.7 kN 3910 kN= =
Mb rock min 1640 3910 8.23 + 33800 kN-m= =
D-34

D Design of example buildings
The normalized nonlinear stiffness is calculated from equation 7.27:
(D.48)
This is between 0.1 s-2 and 1.0 s-2, and Figure 7.8 shows that can be taken as greater
than 100 in either case without any supplemental energy dissipation and still meet the
seismic displacement targets. Therefore, no iteration is required.
Equation 7.6 is checked to avoid overturning at the CP drift of 2.5%. At this drift, equa-
tion 7.7 gives the strain in the post-tensioning as 0.99%, which is more than the yield
strain but less than the assumed ultimate strain of 1.3%. Conservatively underestimating
the force in each tendon as the yield force of 234.5 kN and neglecting any strain harden-
ing of the energy dissipation:
(D.49)
Global uplift will not occur because there is no supplemental energy dissipation, so equa-
tion 7.9 need not be checked.
Checking for uplift due to wind loading
As noted previously, the base rocking moment was selected to avoid rocking under the
factored ULS wind loads.
D.3.3 Step 2: Capacity design of system
Although seismic considerations did not govern the design of the base rocking joint, they
do govern the design of the members of the rocking frame. The following sections
describe the capacity design process for the 12-storey frame.
k
30 140 195000 27432
------------------------------------------ 8230 2 29351462 28936 –
22885447 9810 28936 2-------------------------------------------------------------------------------------------------------------------- 0.36 s 2–= =
R
1640 30 234.5 8.23 + 59500= 29351 28.936 0.025 21200=
D-35

D Design of example buildings
Calculation of total tributary seismic weight
The total tributary weight is given in Table D.19 as 117400 kN for the building, or
29400 kN per frame.
Calculation of base overturning moment at maximum expected base rotation
The maximum expected base rotation is taken as the target normalized displacement at
the CP performance level, 2.5%. Conservatively estimating the post-tensioning force as its
ultimate strength, the maximum base moment for each frame is calculated from equation
7.40 as:
(D.50)
Estimation of fundamental period
The fundamental period of the structure is estimated from equation 7.19 as 1.41 s.
Checking whether response can be computed from three modes
The corner period of the acceleration spectrum was calculated in equation D.33 as 0.6 s.
Since the fundamental period is less than three times , equation 7.41 is satisfied and no
more than three modes are required.
Equation 7.39 is checked to verify that vertical accelerations may be neglected:
(D.51)
Estimation of periods of second and third modes
The second- and third-mode periods are estimated from equations 7.43 and 7.44 as
0.470 s and 0.282 s, respectively.
Mb max 1640 30 260.7 8.23 + 66000 kN-m= =
TS
30 234.5 0.50 260.7 – 3120 399=
D-36

D Design of example buildings
Determination of spectral accelerations at periods of higher modes
The median-plus-standard-deviation spectral accelerations at periods of 0.470 s and
0.282 s are read from Figure 8.2 as 3.07 g and 2.97 g, respectively.
Calculation of storey shear, overturning moment, and floor acceleration design envelopes
The first-mode floor acceleration, storey shear, and overturning moment envelopes are
calculated using equations 7.45-7.47, respectively, and are shown in Table D.20. The sec-
ond- and third-mode accelerations, shears, and moments are calculated from equations
7.54-7.55, 7.63-7.64, and 7.68-7.69, respectively, and are also shown in Table D.20. To
calculate the accelerations associated with the truncated higher modes using equation
7.74, the product of the peak ground acceleration and the associated load factor, ,
is taken as the median-plus-standard-deviation peak ground acceleration, 1.21 g. The
resulting contribution to the envelope is given in Table D.20.
The modal contributions to each quantity are combined according to equations 7.70-
7.72, gives the results that are shown in Table D.21. The first mode accounts for most of
Table D.20. Capacity design calculations for 12-storey structure
storey(g) (g) (g) (g) (kN) (kN) (kN) (kN-m) (kN-m) (kN-m)
12 0.12 1.71 0.67 0.21 0 0 0 0 0 011 0.11 1.45 0.49 0.08 290 3940 1470 3000 9400 350010 0.10 0.99 0.11 0.04 550 6940 2220 6400 34 700 12 3009 0.09 0.39 0.32 0.13 790 8650 1960 10 300 70 900 22 2008 0.08 0.26 0.61 0.15 1000 8810 770 147 00 111 400 28 7007 0.07 0.87 0.67 0.08 1190 7410 850 19 500 149 100 28 6006 0.06 1.37 0.45 0.05 1350 4650 2270 24 800 177 100 21 2005 0.05 1.67 0.05 0.18 1490 900 2910 30 500 190 100 90004 0.04 1.74 0.36 0.23 1600 3320 2520 36 700 1846 00 38003 0.03 1.58 0.64 0.12 1690 7420 1250 43 300 159 800 12 6002 0.02 1.19 0.65 0.17 1750 10840 390 50 400 117 700 14 6001 0.01 0.64 0.41 0.64 1790 13100 1740 58 000 62 400 95000 0.00 0.00 0.00 1.21 1800 13890 2260 66 000 0 0
iPGA
a1 hi a2 hi a3 hi ar hi V 1 hi V 2 hi V 3 hi M 1 hi M 2 hi M 3 hi
D-37

D Design of example buildings
the base overturning moment, but the second mode dominates most other response quan-
tities. The truncated higher modes have only a minor influence on the floor acceleration
envelope at all levels but the first and the base.
Design of elements of frame, shear transfer devices, diaphragms, and collectors
Each brace is designed to carry half of the larger of the shear at the storey above and that
at the storey below. Table D.22 summarizes these calculations, together with the members
Table D.21. Capacity design accelerations, shears, and moments for 12-storey structure
storey(g) (kN) (kN-m)
12 2.17 0 011 1.72 4490 13 00010 1.14 7840 43 2009 0.73 9650 84 6008 0.90 9850 129 7007 1.25 8650 171 3006 1.55 6530 203 2005 1.90 4540 220 8004 2.05 5770 221 3003 1.85 9220 203 6002 1.55 12 600 169 0001 1.41 15 010 121 1000 1.21 15 870 66 000
Table D.22. Summary of brace design calculations for 12-storey frame
storeydesign load
(kN) (mm)section name
(Canada)section name
(US) (kN)
12 3350 6150 W360x134 W14x90 388011 5860 6150 W360x216 W14x145 653010 7220 6150 W360x262 W14x176 79709 7360 6150 W360x262 W14x176 79708 7360 6150 W360x262 W14x176 79707 6470 6150 W360x216 W14x145 65306 4880 6150 W360x179 W14x120 52205 4310 6150 W360x162 W14x109 47004 6890 6150 W360x237 W14x159 71603 9420 6150 W360x314 W14x211 95402 11 220 6150 W360x382 W14x257 11 7601 11 440 5930 W360x382 W14x257 12 000
a hi V hi M hi
L Cr
D-38

D Design of example buildings
that were chosen to satisfy the requirements of AISC 360-10 [AISC 2010]. No attempt is
made to improve the constructability of the frame by maintaining the same sections along
the height of the building.
At each level, the moment demand is taken as the larger of the moments at the storeys
above and below (Table D.21) and is designed to be carried as a tension-compression cou-
ple between the two columns. In addition, the fifth and sixth levels of columns are
designed for the ultimate strength of the post-tensioning at that column location, which is
slightly more load than is expected at the design base rotation of 2.5% at the CP perfor-
mance level. For the lower four storeys, since only one of the two sets of post-tensioning
is elongated at a time, the compression due to post-tensioning is taken as the average of
the ultimate post-tensioning strength from one column line with the initial post-tension-
ing force from the other column line. Finally, the assumed self-weight of the frame is pro-
rated by the storey level and assumed to be divided equally between the two columns. The
columns are designed to be continuous over two storey levels. Table D.23 summarizes
these calculations, together with the members that are chosen to satisfy the requirements
of AISC 360-10 [AISC 2010].
Like the other frames, the 12-storey frame is assumed to be detailed such that the floor
diaphragms are connected to the rocking system at the centre of each level. Since the
Table D.23. Summary of column design calculations for 12-storey frame
storeyload due to
moment (kN)load due to PT and
self-weight (kN)total design
load (kN) (mm)section name
(Canada)section name
(US) (kN)
12 1580 20 1600 4570 W360x162 W14x109 540011 5250 30 5290 4570 W360x162 W14x109 540010 10 280 50 10 330 4570 W360x463 W14x311 16 0309 15 770 70 15 830 4570 W360x463 W14x311 16 0308 20 820 80 20 900 4570 W360x744 W14x500 26 0607 24 690 100 24 790 4570 W360x744 W14x500 26 0606 26 830 7940 34 770 4570 W360x990 W14x665 349905 26 890 7950 34 850 4570 W360x990 W14x665 349904 26 890 5820 32 710 4570 W360x990 W14x665 349903 24 750 5840 30 580 4570 W360x990 W14x665 349902 20 530 5850 26 390 4570 W360x818 W14x550 287101 14 710 5870 20 580 4270 W360x818 W14x550 28710
L Cr
D-39

D Design of example buildings
braces are designed to carry this load, the horizontal elements at all odd-numbered levels
are not designed for any load. At these levels, the section for the storey above is used. The
horizontal element at the base level is designed for the horizontal component of the brace
design force at that level, as was explained for the two-storey structure. Table D.24 sum-
marizes these calculations, together with the members that are chosen to satisfy the
requirements of AISC 360-10 [AISC 2010].
Figure D.5 shows the final frame layout. The self-weight of the frame is 1259 kN, which is
3.2 times the 399 kN that was assumed in design. When the calculations shown above are
repeated with this adjustment in the assumed self-weight, the factored resistance of every
member is at least 99% of the estimated capacity design demand. This is considered colse
enough to omit a second design iteration. It would be possible to reduce the initial post-
tensioning force because of the increased base moment resistance provided by the self-
weight of the frame, but this is not done for simplicity.
Table D.24. Summary of horizontal element design calculations for 12-storey frame
storeydesign load
(kN) (mm)section name
(Canada)section name
(US) (kN)
12 1740 8230 W360x134 W14x90 303011 0 4120 W360x134 W14x90 462010 1440 8230 W360x134 W14x90 30309 0 4120 W360x134 W14x90 46208 1130 8230 W360x101 W14x68 11707 0 4120 W360x101 W14x68 29206 1960 8230 W360x134 W14x90 30305 0 4120 W360x134 W14x90 46204 2590 8230 W360x134 W14x90 30303 0 4120 W360x134 W14x90 46202 1960 8230 W360x134 W14x90 30301 0 4120 W360x134 W14x90 46200 7930 8230 W360x347 W14x233 8680
L Cr
D-40

D Design of example buildings
Figure D.5. Summary of design of 12-storey controlled rocking steel frame
W360x990W14x665
W360x179W14x120
W360x162W14x109
W360x990W14x665
W360x237W14x159
W360x314W14x211
W360x818W14x550
W360x382W14x257
W360x382W14x257
PT each side:30 x 0.6” tendons @ 50% fpuanchored at level 6(shown curved for clarity)
W360x162W14x109
W360x134W14x90
W360x134W14x90
W360x134W14x90
W360x134W14x90
W360x134W14x90
W360x134W14x90
W360x134W14x90
W360x134W14x90
W360x134W14x90
W360x134W14x90
W360x134W14x90
W360x347W14x233
W360x216W14x145
W360x463W14x311
W360x262W14x176
W360x262W14x176
W360x262W14x176
W360x744W14x500
W360x990W14x665
W360x990W14x665
W360x818W14x550
W360x162W14x109
W360x463W14x311
W360x744W14x500
W360x216W14x145
W360x101W14x68
W360x101W14x68
US designation
Canadiandesignation
12 @
4.5
7 m
= 5
4.9
m (
180’
)
8.23 m (27’)
D-41

D Design of example buildings
Checking response to wind loading
Calculations not shown verified that the members are adequate to carry the factored wind
loads at the ULS level, and that the deflection at the SLS level is less than the limit of
0.25% of the height [CSA 2009].
D.3.4 Step 2a (optional): Design of higher mode mitigation
Deciding whether to mitigate higher mode effects and selecting mitigation technique
Table D.20 showed that the second mode contributed more the capacity design envelopes
for the 12-storey frame than the first mode did. Like the six-storey frame, an alternative
configuration with two rocking sections is considered, with the upper rocking joint at the
fifth storey because the second-mode moment is largest there (Table D.20).
An alternative higher mode mitigation technique is to replace the first-storey braces with
SCED braces. This option is considered as a third design for the 12-storey frame.
Design of upper rocking joint
The base rocking moment of the system was calculated in equation D.47 as 33800 kN-m.
Therefore, equation 7.75 states that the rocking moment at the upper joint should be:
(D.52)
From equation 7.76, no energy dissipation is required at the upper rocking joint.
The moment resistance contributed by the self-weight of the frame is estimated by assum-
ing a uniform distribution of the frame weight from equation D.45:
(D.53)
Mupper rock 33800 1 1.5 22.86054.864---------------- – 0.5 22.860
54.864---------------- 2
+ 15610 kN-m=
Mupper W 399 32.00454.864---------------- 4.11 957 kN-m= =
D-42

D Design of example buildings
The post-tensioning tendons that were already designed will continue across the upper
joint and will contribute the same overturning moment resistance there as they do at the
base:
(D.54)
This is more than the required moment resistance at the upper rocking joint, so no sup-
plemental energy dissipation is needed to generate enough moment resistance at the upper
rocking joint. With no supplemental energy dissipation, it is not necessary to check equa-
tion 7.9 to avoid global uplift.
Modification of design envelopes
The capacity design forces for the frame with two rocking sections are calculated using the
maximum base moment from equation D.50, together with a moment at the upper rock-
ing joint that is calculated with the same assumptions as at the base:
(D.55)
Linear interpolation between at the base, at the upper rocking joint,
and zero at the roof gives the values for the first-mode overturning moments that are sum-
marized in Table D.25. The moments in the second and third modes are calculated from
Table D.25. Capacity design calculations for 12-storey structure with upper rocking joint
storey(g) (g) (g) (g) (kN) (kN) (kN) (kN-m) (kN-m) (kN-m)
12 0.12 0.85 0.34 0.21 0 0 0 0 0 011 0.11 0.72 0.24 0.08 290 1970 730 9300 9200 330010 0.10 0.49 0.05 0.04 550 3470 1110 18 700 31100 90009 0.09 0.20 0.16 0.13 790 4320 980 28 000 54200 98008 0.08 0.13 0.31 0.15 1000 4410 390 37 300 66700 38007 0.07 0.44 0.33 0.08 1190 3710 430 46 700 60900 34006 0.06 0.68 0.23 0.05 1350 2320 1140 56 000 36300 48005 0.05 0.84 0.03 0.18 1490 450 1460 65 300 0 04 0.04 0.87 0.18 0.23 1600 1660 1260 65 500 7800 24003 0.03 0.79 0.32 0.12 1690 3710 620 65 600 23100 42002 0.02 0.59 0.33 0.17 1750 5420 200 65 700 30900 9001 0.01 0.32 0.20 0.64 1790 6550 870 65 900 22100 21000 0.00 0.00 0.00 1.21 1800 6940 1130 66 000 0 0
MPT 3910 kN 8.23 m 32200 kN-m= =
Mupper max 957 30 260.7 8.23 + 65300 kN-m= =
Mb max Mupper max
a1 hi a2 hi a3 hi ar hi V 1 hi V 2 hi V 3 hi M 1 hi M 2 hi M 3 hi
D-43

D Design of example buildings
equations 7.68 and 7.69 with for the lower
section and for the upper section. For
each section, and are taken relative to the rocking joint at the base of that section,
is calculated from equation 7.19 with those heights, and and are estimated
using equations 7.43 and 7.44. Table D.14 summarizes the properties of the upper and
lower sections, including the median-plus-standard-deviation spectral accelerations that
are used for . Table D.26 summarizes the properties of the upper and lower sections,
including the median-plus-standard-deviation spectral accelerations that are used for
.
The first-mode accelerations and shears in Table D.25 are the same as they were without
an upper rocking joint, as are the accelerations associated with the truncated higher
modes. All second- and third-mode accelerations and shears are half of what they were
without an upper rocking joint. The modal contributions according to equations 7.70-
7.72 are given in Table D.27.
Table D.26. Estimated periods and spectral accelerations for rocking sections of 12-storey frame
quantityvalue for lower rocking section
value for upper rocking section
height, 22.86 m 32.00 m
first-mode period, 0.732 s 0.942 s
second-mode period, 0.244 s 0.314 s
third-mode period, 0.146 s 0.188 s
second-mode median-plus-standard-deviation spectral acceleration, 3.10 g 3.03 g
third-mode median-plus-standard-deviation spectral acceleration, 2.68 g 2.92 g
Wtrib 4 10088 10088 2+ 4 kN=
Wtrib 6437 6 10088 10088 2+ + 4 kN=
z H
T 1 T 2 T 3
iSa
iSa
H
T 1
T 2
T 3
Sa T 2
Sa T 2
D-44
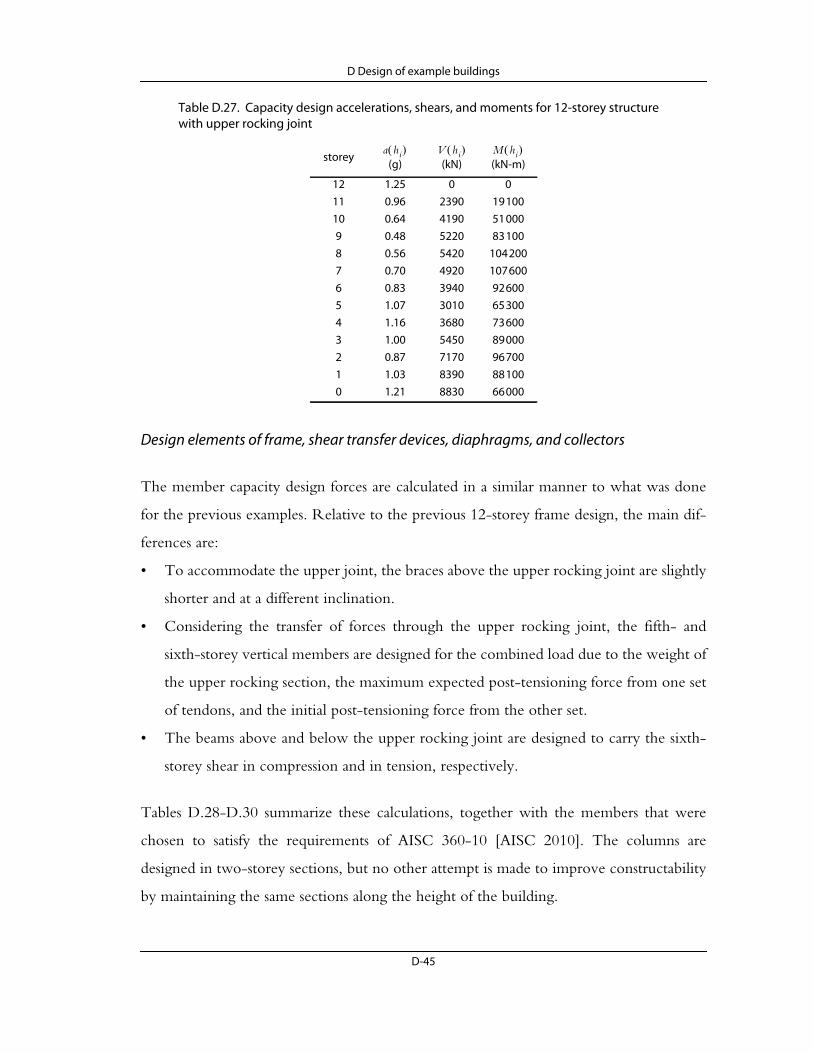
D Design of example buildings
Design elements of frame, shear transfer devices, diaphragms, and collectors
The member capacity design forces are calculated in a similar manner to what was done
for the previous examples. Relative to the previous 12-storey frame design, the main dif-
ferences are:
• To accommodate the upper joint, the braces above the upper rocking joint are slightly
shorter and at a different inclination.
• Considering the transfer of forces through the upper rocking joint, the fifth- and
sixth-storey vertical members are designed for the combined load due to the weight of
the upper rocking section, the maximum expected post-tensioning force from one set
of tendons, and the initial post-tensioning force from the other set.
• The beams above and below the upper rocking joint are designed to carry the sixth-
storey shear in compression and in tension, respectively.
Tables D.28-D.30 summarize these calculations, together with the members that were
chosen to satisfy the requirements of AISC 360-10 [AISC 2010]. The columns are
designed in two-storey sections, but no other attempt is made to improve constructability
by maintaining the same sections along the height of the building.
Table D.27. Capacity design accelerations, shears, and moments for 12-storey structure with upper rocking joint
storey(g) (kN) (kN-m)
12 1.25 0 011 0.96 2390 19 10010 0.64 4190 51 0009 0.48 5220 83 1008 0.56 5420 104 2007 0.70 4920 107 6006 0.83 3940 92 6005 1.07 3010 65 3004 1.16 3680 73 6003 1.00 5450 89 0002 0.87 7170 96 7001 1.03 8390 88 1000 1.21 8830 66 000
a hi V hi M hi
D-45

D Design of example buildings
Figure D.6 shows the final frame layout. The self-weight of this frame is 764 kN, which is
39% less than the self-weight of the frame that was designed to rock only at the base.
Checking response to wind loading
Calculations not shown verified that the members are adequate to carry the factored wind
loads at the ULS level, and that the deflection at the SLS level is less than the limit of
0.25% of the height [CSA 2009].
Table D.28. Summary of brace design calculations for 12-storey frame with upper rocking joint
storeydesign
load (kN) (mm)section name
(Canada)section name
(US) (kN)
12 1780 6150 W360x101 W14x68 198011 3140 6150 W360x134 W14x90 391010 3900 6150 W360x147 W14x99 42809 4050 6150 W360x147 W14x99 42808 4050 6150 W360x147 W14x99 42807 3680 6150 W360x134 W14x90 38806 2840 5930 W360x134 W14x90 39705 2750 6150 W360x134 W14x90 38804 4080 6150 W360x147 W14x99 42803 5370 5930 W360x196 W14x132 57302 6280 6150 W360x216 W14x145 65301 6370 5930 W360x216 W14x145 6660
Table D.29. Summary of column design calculations for 12-storey frame with upper rocking joint
storeyload due to
moment (kN)load due to PT and
self-weight (kN)total design
load (kN) (mm)section name
(Canada)section name
(US) (kN)
12 2320 20 2340 4570 W360x196 W14x132 656011 6200 30 6230 4570 W360x196 W14x132 656010 10 100 50 10 150 4570 W360x382 W14x257 13 1609 12 660 70 12 720 4570 W360x382 W14x257 13 1608 13 080 80 13 160 4570 W360x382 W14x257 13 1607 13 080 100 13 180 4570 W360x382 W14x257 13 1606 N/A 11 460 11 460 4270 W360x347 W14x233 12 1345 N/A 11 470 11 470 4570 W360x347 W14x233 11 9204 10 820 5820 16 640 4570 W360x509 W14x342 17 6303 11 750 5840 175 80 4570 W360x509 W14x342 17 6302 11 750 5850 17 600 4570 W360x509 W14x342 17 6301 10 710 5870 16 580 4270 W360x509 W14x342 17 940
L Cr
L Cr
D-46
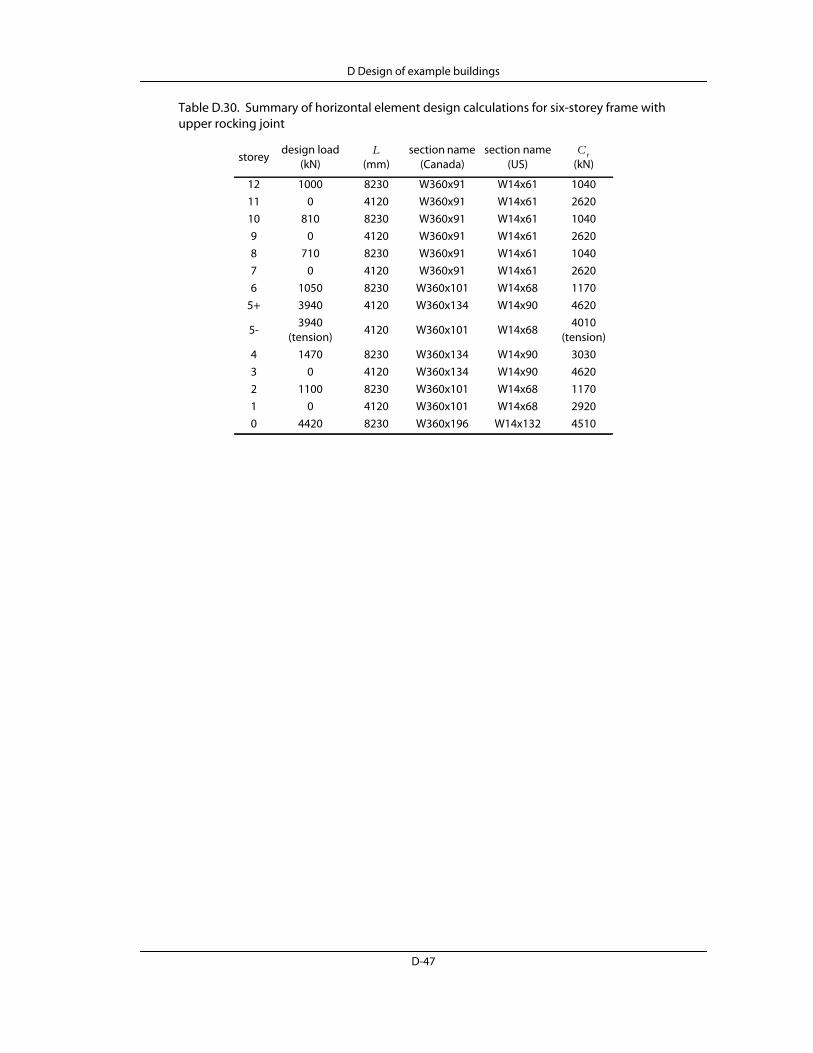
D Design of example buildings
Table D.30. Summary of horizontal element design calculations for six-storey frame with upper rocking joint
storeydesign load
(kN) (mm)section name
(Canada)section name
(US) (kN)
12 1000 8230 W360x91 W14x61 104011 0 4120 W360x91 W14x61 262010 810 8230 W360x91 W14x61 10409 0 4120 W360x91 W14x61 26208 710 8230 W360x91 W14x61 10407 0 4120 W360x91 W14x61 26206 1050 8230 W360x101 W14x68 1170
5+ 3940 4120 W360x134 W14x90 4620
5-3940
(tension)4120 W360x101 W14x68
4010 (tension)
4 1470 8230 W360x134 W14x90 30303 0 4120 W360x134 W14x90 46202 1100 8230 W360x101 W14x68 11701 0 4120 W360x101 W14x68 29200 4420 8230 W360x196 W14x132 4510
L Cr
D-47

D Design of example buildings
Figure D.6. Summary of design of 12-storey controlled rocking steel frame with two rocking sections
W360x347W14x233
W360x134W14x90
W360x134W14x90
W360x347W14x233
W360x147W14x99
W360x196W14x132
W360x216W14x145
W360x216W14x145
W360x196W14x132
W360x196W14x132
W360x196W14x132
W360x101W14x68
W360x134W14x90
W360x382W14x257
W360x509W14x342
W360x509W14x342
W360x509W14x342
W360x509W14x342
W360x382W14x257
W360x382W14x257
W360x382W14x257
W360x147W14x99
W360x147W14x99
W360x147W14x99
W360x134W14x90
W360x101W14x68
W360x101W14x68
W360x101W14x68
W360x134W14x90
W360x134W14x90
W360x101W14x68
W360x134W14x90
W360x91W14x61
W360x91W14x61
W360x91W14x61
W360x91W14x61
W360x91W14x61
W360x91W14x61
US designation
Canadiandesignation
12 @
4.5
7 m
= 5
4.9
m (
180’
)
8.23 m (27’)
PT each side:30 x 0.6” tendons @ 50% fpuanchored at level 6(shown curved for clarity)
D-48

D Design of example buildings
Design of nonlinear braces
The base shear associated with the target activation load is given by equation 7.78 as:
(D.56)
and the target brace activation force is calculated from equation 7.77 as:
(D.57)
From equation 7.79, the SCED brace should have an energy dissipation parameter of at
least . A preliminary design of the SCED brace that satisfies these require-
ments was evaluated using the SCED Mechanics Simulator developed by Erochko [2013]
and found to have an activation load of 3100 kN, an initial stiffness of 1550 kN/mm, a
post-activation stiffness ratio of , and an energy dissipation parameter of
. The brace is designed with an external fuse that slips at a brace elongation of
30 mm, which corresponds to a first-storey drift of 1.0% and to a brace force of 5700 kN.
Modification of design envelopes
The capacity design forces for the other members of the frame are calculated as described
in Section 7.4.4. The higher mode reduction factor is calculated as:
(D.58)
where the unreduced second-mode base shear is taken from Table D.21. Table D.31 sum-
marizes the capacity design calculations of the shear force and overturning moment enve-
lopes. The first-mode envelopes are the same as in Table D.20, the second-mode
envelopes are the values from Table D.20 multiplied by , and the third-mode envelopes
are zero. Table D.32 gives the total design acceleration, shear, and overturning moment
envelopes, calculated using equations 7.70-7.72.
V b SCED design1.5 33800 kN-m
54.864 m-------------------------------------------- 0.25 13890 kN + 4400 kN= =
Fact4400 kN2 46.0cos------------------------ 3170 kN=
SCED 0.8=
0.06=
0.8=
2 5700 kN 46.0cos 1.5 66000 kN-m
54.864 m------------------------------- –
13890 kN------------------------------------------------------------------------------------------------------- 0.44= =
D-49
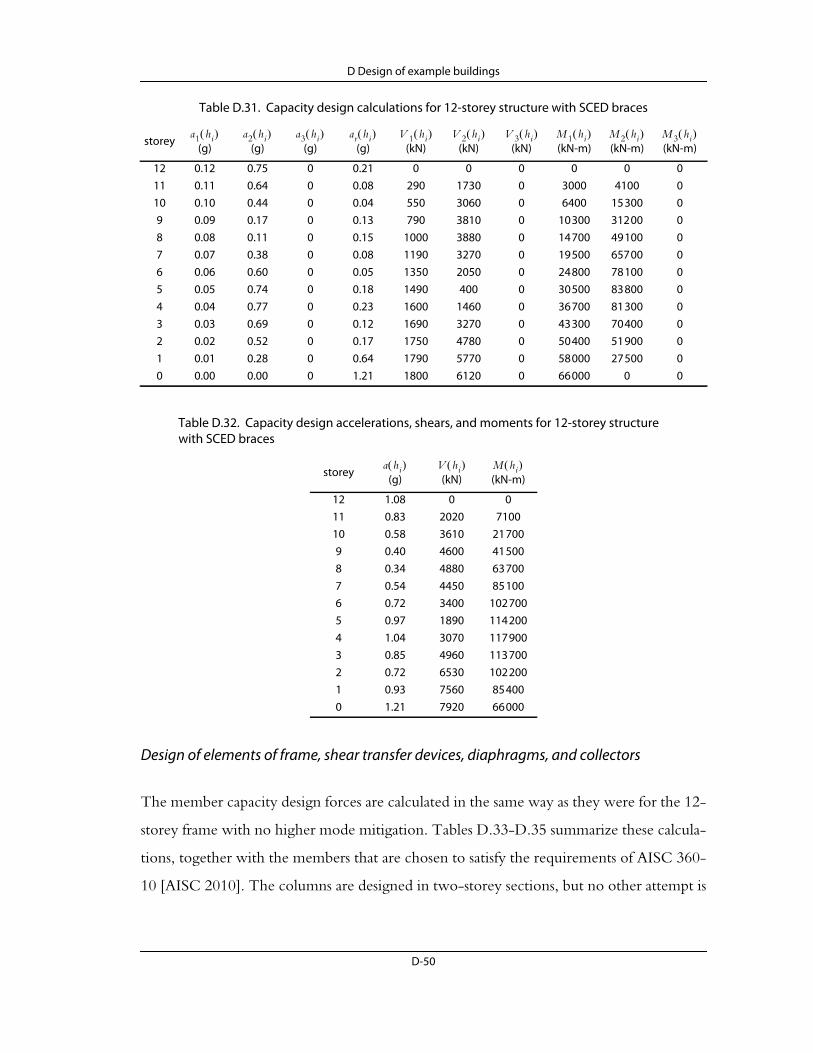
D Design of example buildings
Design of elements of frame, shear transfer devices, diaphragms, and collectors
The member capacity design forces are calculated in the same way as they were for the 12-
storey frame with no higher mode mitigation. Tables D.33-D.35 summarize these calcula-
tions, together with the members that are chosen to satisfy the requirements of AISC 360-
10 [AISC 2010]. The columns are designed in two-storey sections, but no other attempt is
Table D.31. Capacity design calculations for 12-storey structure with SCED braces
storey(g) (g) (g) (g) (kN) (kN) (kN) (kN-m) (kN-m) (kN-m)
12 0.12 0.75 0 0.21 0 0 0 0 0 011 0.11 0.64 0 0.08 290 1730 0 3000 4100 010 0.10 0.44 0 0.04 550 3060 0 6400 15 300 09 0.09 0.17 0 0.13 790 3810 0 10 300 312 00 08 0.08 0.11 0 0.15 1000 3880 0 14 700 49 100 07 0.07 0.38 0 0.08 1190 3270 0 19 500 657 00 06 0.06 0.60 0 0.05 1350 2050 0 24 800 78 100 05 0.05 0.74 0 0.18 1490 400 0 30 500 83 800 04 0.04 0.77 0 0.23 1600 1460 0 36 700 81 300 03 0.03 0.69 0 0.12 1690 3270 0 43 300 70 400 02 0.02 0.52 0 0.17 1750 4780 0 50 400 51 900 01 0.01 0.28 0 0.64 1790 5770 0 58 000 27 500 00 0.00 0.00 0 1.21 1800 6120 0 66 000 0 0
Table D.32. Capacity design accelerations, shears, and moments for 12-storey structure with SCED braces
storey(g) (kN) (kN-m)
12 1.08 0 011 0.83 2020 710010 0.58 3610 21 7009 0.40 4600 41 5008 0.34 4880 63 7007 0.54 4450 85 1006 0.72 3400 102 7005 0.97 1890 114 2004 1.04 3070 117 9003 0.85 4960 113 7002 0.72 6530 102 2001 0.93 7560 85 4000 1.21 7920 66 000
a1 hi a2 hi a3 hi ar hi V 1 hi V 2 hi V 3 hi M 1 hi M 2 hi M 3 hi
a hi V hi M hi
D-50

D Design of example buildings
made to improve constructability by maintaining the same sections along the height of the
building.
Figure D.7 shows the final frame layout. The self-weight of this frame is 792 kN, which is
37% less than the self-weight of the frame that was designed to rock only at the base and
4% more than the self-weight of the frame that was designed with two rocking sections.
Table D.33. Summary of brace design calculations for 12-storey frame with SCED braces
storeydesign
load (kN) (mm)section name
(Canada)section name
(US) (kN)
12 1510 6150 W360x91 W14x61 177011 2700 6150 W360x134 W14x90 388010 3440 6150 W360x134 W14x90 38809 3650 6150 W360x134 W14x90 38808 3650 6150 W360x134 W14x90 38807 3330 6150 W360x134 W14x90 38806 2540 6150 W360x134 W14x90 38805 2290 6150 W360x122 W14x82 24004 3710 6150 W360x134 W14x90 38803 4880 6150 W360x179 W14x120 52202 5650 6150 W360x196 W14x132 57301 3100 activation 5930 SCED SCED 3100 activation
Table D.34. Summary of column design calculations for 12-storey frame with SCED braces
storeyload due to
moment (kN)load due to PT and
self-weight (kN)total design
load (kN) (mm)section name
(Canada)section name
(US) (kN)
12 870 20 880 4570 W360x101 W14x68 272011 2640 30 2670 4570 W360x101 W14x68 272010 5050 50 5100 4570 W360x237 W14x159 80709 7740 70 7810 4570 W360x237 W14x159 80708 10 340 80 10 430 4570 W360x382 W14x257 13 1607 12 480 100 12 580 4570 W360x382 W14x257 13 1606 13 870 7940 21 810 4570 W360x677 W14x455 23 6705 14 330 7950 22 290 4570 W360x677 W14x455 23 6704 14 330 5820 20 150 4570 W360x592 W14x398 20 6103 13 810 5840 19 650 4570 W360x592 W14x398 20 6102 12 420 5850 18 270 4570 W360x551 W14x370 19 0901 10 380 5870 16 250 4270 W360x551 W14x370 19 420
L Cr
L Cr
D-51

D Design of example buildings
Check response to wind loading
The roof displacement of the frame under the serviceability level wind loads is 0.052% of
the building height, which satisfies the criteria given in Annex D of CAN/CSA S16-09
[CSA 2009]. Calculations not shown verified that the members are also adequate to carry
the factored wind loads at the ULS level
D.3.5 Step 3: Detailing of members and connections
The detailed design of connections is not considered within the scope of this example. For
modelling purposes, it is assumed that the connections will be detailed to respond elasti-
cally at all load levels.
Table D.35. Summary of horizontal element design calculations for 12-storey frame with SCED braces
storeydesign load
(kN) (mm)section name
(Canada)section name
(US) (kN)
12 870 8230 W360x91 W14x61 104011 0 4120 W360x91 W14x61 262010 730 8230 W360x91 W14x61 10409 0 4120 W360x91 W14x61 26208 430 8230 W360x72 W14x48 4907 0 4120 W360x72 W14x48 16706 900 8230 W360x91 W14x61 10405 0 4120 W360x91 W14x61 26204 1310 8230 W360x122 W14x82 14203 0 4120 W360x122 W14x82 35202 910 8230 W360x91 W14x61 10401 0 4120 W360x91 W14x61 26200 3960 8230 W360x179 W14x120 4100
L Cr
D-52

D Design of example buildings
Figure D.7. Summary of design of 12-storey controlled rocking steel frame with SCED braces at the first storey
W360x677W14x455
W360x592W14x398
W360x551W14x370
SCEDActivation: 3100 kN
k0: 1550 kN/mmα: 0.06β: 0.80
W360x179W14x120
W360x101W14x68
W360x91W14x61
W360x134W14x90
W360x237W14x159
W360x382W14x257
W360x677W14x455
W360x237W14x159
W360x382W14x257
W360x592W14x398
W360x551W14x370
W360x101W14x68
W360x122W14x82
W360x134W14x90
W360x134W14x90
W360x134W14x90
W360x134W14x90
W360x134W14x90
W360x134W14x90
W360x179W14x120
W360x196W14x132
W360x122W14x82
W360x122W14x82
W360x91W14x61
W360x91W14x61
W360x91W14x61
W360x91W14x61
W360x91W14x61
W360x91W14x61
W360x91W14x61
W360x91W14x61
W360x72W14x48
W360x72W14x48
US designation
Canadiandesignation
12 @
4.5
7 m
= 5
4.9
m (
180’
)
8.23 m (27’)
PT each side:30 x 0.6” tendons @ 50% fpuanchored at level 6(shown curved for clarity)
D-53
Recommended