
Appendix 1
1. Natural variation of carotene and vitamin C in fruit and vegetables and contribution to dietary intake
The concentrations of certain vitamins in some fruits and vegetables may be affected by
irradiation but it is important to recognise that the natural variation in vitamin content in fruits
and vegetables is very large. Vitamin levels depend on the plant cultivar, growing conditions,
maturity of the edible portion, post-harvest handling and storage conditions (World Health
Organization 1994). On this basis, changes in the concentrations of vitamins observed in
individual studies must be interpreted in the context of this variation. To this effect, a
quantitative review of natural variation in the content of radiation-sensitive vitamins is
provided for pome, stone, berry, citrus, tropical and other fruits, as well as cucurbit and
flowering vegetables. Where appropriate, the effect of common processing techniques on
carotene and vitamin C content is included.
Published data were searched using EBSCOhost. The search strategy involved searching
combinations of the specific fruit or vegetable name with the following terms:
Cultivar; storage; season; processing
Ascorbate; ascorbic acid; vitamin C
Carotene; carotenoid; vitamin A
Folate
Vitamin E or tocopherol
Nutrient variation
Hand searching of reference lists was also used to extend publications included in the
review. References and data were cross-checked with the Food Composition Database for
Biodiversity developed by FAO (Stadlmayr et al. 2011).
The purpose of this section was not to provide a systematic review of all available data.
Instead, the aim was to capture the extent of natural variation in nutrient composition of fruits
and vegetables that is present in the published literature.
Terminology and abbreviations used in this appendix include:
Vitamin C termso AA: ascorbic acid (reduced form)o DHAA: dehydroascorbic acid (oxidised AA)o Total vitamin C: value represents both AA and DHAA.
1

Vitamin A termso -carotene: pro-vitamin A carotenoido -carotene equivalents: estimated using the following formula: β-carotene (µg)
+ α-carotene/2 (µg) + β-cryptoxanthin/2 (µg)o Carotene: non-oxygenated carotenoido Carotenoid: hydrocarbon pigments synthesised by plantso Retinol equivalents1: calculation of total vitamin A activity of a food. Estimated
using the formula: retinol (µg) + (β-carotene/6 + α-carotene/12 + β-cryptoxanthin/12 (µg)).
Othero HPLC: high pressure liquid chromatographyo NUTTAB: nutrient tables for food available in Australiao USDA: nutrient tables for food in the US
1.1. Pome fruitsIn Australia and New Zealand, pome fruits were not major contributors to dietary intakes of
carotene or vitamin C, with the exception of vitamin C intakes in 4-8 year old boys (6% of
dietary intake) and 9-13 year old girls (5% of dietary intake) in New Zealand. Pome fruit
contribute 5-8% of dietary folate intake in Australian children <16 years of age, but not other
population groups. Pome fruit did not contribute to >5% of dietary intakes of thiamin,
riboflavin, niacin, vitamin E or B6.
As detailed in Table 1.1.1, raw apples and pears contain relatively low levels of both
carotene and vitamin C, but the reported levels show a large range with up to 4-fold variation
between cultivars. While the majority of pome fruits are consumed raw, a proportion of
apples and pears are cooked or canned before consumption. Carotene levels tend to be
higher in cooked apples, but the effect on vitamin C levels was mixed; in Australian and US
food composition tables vitamin C was not detected or very low in cooked (baked or boiled)
apples. In contrast, New Zealand food composition data showed 50% more vitamin C in
stewed apples. The effect of canning on pears was more consistent, with vitamin A not
detected, and vitamin C decreasing 66-83%. However, due to differences in the time that
samples were collected and analysed, the validity of direct comparisons is limited in this
case.
Published data on different apple cultivars found vitamin C level ranged from 0.4-35 mg/100
g, with lower levels in early-harvest fruit and higher levels in later-harvest fruits (Table 1.1.2)
(Davey and Keulemans 2004; Vrhovsek et al. 2004; Lata 2007; Kevers et al. 2011). In the
1 For an alternate approach, calculating Retinol Activity Equivalents (RAE), please see the “DRI Essential Guide to Nutrient Requirements” (2006), available at http://www.nap.edu/openbook.php?record_id=11537&page=170
2

Davey study (2004), storage of apples at room temperature for 10 days led to 35% loss of
vitamin C, and cold storage (1C) for 3 months decreased vitamin C by 23%. Greater losses
were reported by Kevers (2011), with up to 75% of AA lost during 7 days storage at room
temperature, and up to 90% lost with 3-9 months cold storage in either air or low oxygen
atmosphere. The greater losses reported by Kevers et al. may be due to estimation of AA
only, and the use of the titrimetric method of analysis. These large storage-associated losses
may explain why vitamin C values in food composition tables lie at the low end of the range.
For example, data for some apple varieties in Australian data tables (NUTTAB 2010) were
store bought, and therefore may have undergone extended storage.
Table 1.1.1 -carotene and vitamin C contents of raw and processed pome fruits
Fruit-carotene (µg/100 g) Vitamin C (mg/100 g)
NUTTABa NZ NUTTABa NZ USDAApple 0-19 11 2-6 8 5Apple (cooked)
90 39 0 12 <1
Pear 0-20 0-10 4-6 3 4Pear (canned)
0b 0-15c 1b 1c 1b
aWhere values are provided for different varieties a range is given. bDrained fruit canned in either juice,
syrup or intense sweetened liquid. cUndrained fruit canned in either juice or syrup
Vitamin C content in apples also varied with season, with the effect of season being cultivar
dependent (Lata 2007). While the mean and range vitamin C content was similar overall, 10
of 19 cultivars exhibited lower vitamin C levels in the 2004 season (-10 to -47%), 7 of 19 had
greater levels (+9 to +46%), with the remaining two cultivars having similar vitamin C content
between seasons. In addition, vitamin C content varies with fruit position within the tree;
vitamin C levels were 21% lower in peel and 24% lower in flesh of shaded compared to sun
exposed Gala apples (Li et al. 2009).
Vitamin C content of seven pear cultivars ranged from 5-30 mg/100 g (Silva et al. 2010;
Kevers et al. 2011). Vitamin C levels decreased with fruit maturation in Conference pears,
with ~3-fold reduction during on-tree maturation, and levels continued to decrease during
post-harvest storage (Franck et al. 2003). At harvest, vitamin C concentration was ~6 mg/100
g, but after 3 weeks storage it decreased to 1-3 mg/100g, depending on storage conditions
and remained in this range up to 7 months after harvest. Similar effects of storage and
maturity were observed in Rocha pears, with minimal effect of post-harvest treatments on AA
3

losses (Silva et al. 2010). In Conference pears, no seasonal effect was observed for vitamin
C content (Franck et al. 2003).
Table 1.1.2 Summary of data from published literature on variation in vitamin C (mg/100 g)
content of whole pome fruit with variety, season and storage.
Study Variety Season Storage31 apple cultivars. AA, DHAA and total vitamin C analysed at harvest, after 10 days at ambient temperature and after 3 months at 1C.AA and DHAA by HPLC.
Davey, 2004
Total vitamin CAt harvest:Mean: 12.7Range: 7.1-25.5
Not determined
Total vitamin CAmbient:Mean: 8.3 (-35%)Range: 1.9-23.1Cold Storage:Mean: 10.3 (-19%)Range: 2.8-28.0
19 apple cultivars. Total vitamin C measured in 2 consecutive seasons by derivatization.
ata, 2007Ƚ
See adjacent season column.
Total vitamin CMean (range)2004 (hot, dry):12.0 (5.9-24.2)2005 (hot): 11.6 (4.5-25.0)
Not determined
8 apple cultivars.AA measured by HPLC.
Vrhovsek, 2004
AAMean: 4.1Range: 0.4-8.1
Not determined Not determined
4 apple cultivars.AA by titration method.
Bhusan, 1998
AAMean: 2.6Range: 1.5-3.3
AA6 months, 2-4C:Mean: 0.7 (-69%)Range: 0.4-1.5(-30% to -89%)
14 apple and 6 pear cultivars. AA measured at harvest and after storage, with effect of season assessed in select cultivars.Changes estimated from graphical data.AA by titration method.
Kevers, 2011
AA at harvestApples:Mean: 23.8Range: 11.6-35.3Pears:Mean: 18.8Range: 7.5-29.7
Not determined for AA, but phenolics and antioxidant capacity differed by ~15% to ~65%.No significant effect of harvest time within a season
AA in apples7 days, 20C: -75%3-9 months, 1C:-70% to -90%
Conference pear cultivar. Vitamin C measured during ripening and storage in air or controlled atmosphere (CA).Changes estimated from graphical data.AA and DHAA by HPLC.
Franck, 2003
Not determined
Total vitamin C similar(Harvest season 2001 and 2002)
Total vitamin C3 weeks post-harvest:On tree: -40%Air, -1C: -55%CA, -1C: -75%
Rocha pear cultivar. AA, Not determined Not determined Total vitamin C
4

Study Variety Season StorageDHAA and total vitamin C measured at early, optimal and late harvest, and throughout 240 days storage.AA by derivatization.
Silva, 2008
At harvest: 5.2-6.6At 240d: ~4 (-20-40%)Minimal effect of post-harvest treatmentNB: estimated from graph
In summary, there is a wide range of vitamin C levels in different pome fruit cultivars, and
while some are susceptible to seasonal variations, the overall differences between seasons
appears limited. In pome fruit, total vitamin C content decreases rapidly after harvest, and
these storage-associated changes may underlie the relatively low values for vitamin C
content for pome fruit in nutrient data tables. Carotenoid levels are low in pome fruits, with
little published data available on the effects of cultivar, season and storage in these fruit.
1.2. Stone FruitStone fruit were not major contributors to dietary intake of vitamin C, folate, thiamin,
riboflavin, niacin, vitamin E or vitamin B6 in any of the age or gender groups studied in
Australia and New Zealand. Similar results were found for carotene, with the exception of
New Zealand females aged 19-29 and 50-69; in these groups stone fruit contributed to 5% of
dietary carotene intake (expressed as β-carotene equivalents).
Data from food composition tables indicates a wide range in -carotene and vitamin C
content for different stone fruits (see Table 1.2.1). In canned stone fruit, carotene levels are
generally similar, whereas vitamin C levels decrease >40% and in some cases by >90%.
However, some of these differences, in particular in carotene levels, may be due to the
different cultivars and stage of ripeness used for canned stone fruits.
5

Table 1.2.1 -carotene (µg/100 g) and vitamin C (mg/100 g) contents of raw and canned
stone fruits
Fruit-carotene Vitamin C
NUTTABa NZ NUTTABa NZ USDAa
Apricot 197 5170 12 7 10Apricot (canned) 590-1750b 800c 4-5b 4c 3d
Cherry 56 26 19 20 7Nectarine 65 362 12 4 5Peach 147 477 9 10 7Peach (canned)b 216-360b 617c 3-10b 4c 1c
Plum 147 417 5 3 10Plum (canned) 130c 479c 0c 2c <1c
aWhere values are provided for different varieties a range is given. bRange presented for drained fruit canned in either juice, syrup or intense sweetened liquid. cDrained fruit canned in heavy syrup. dCanned in water, solids and liquids
As detailed in Table 1.2.2, studies of vitamin C levels in stone fruit found levels vary from 1.3-
fold (yellow nectarines) to >5-fold (apricots) between cultivars of the same fruit (Girard and
Kopp 1998; Gil et al. 2002; Hegedüs et al. 2010). In cherries, storage was associated with
decreases in AA content by up to 70-80%, with controlled atmosphere attenuating these
losses (Tian et al. 2004; Akbudak et al. 2009). However, as demonstrated in a study of
peaches, measurement of AA alone can be misleading. In Rojo Rito peaches, AA content
decreased by 66% over 14 days ambient temperature storage, but there were concomitant
increases in DHAA, with total vitamin C levels actually increasing by 10% (Flores et al.
2008).
Carotene levels also exhibit a high degree of inter-cultivar variability, with apricots showing
>10-fold difference between cultivars (Ruiz et al. 2005; Flores et al. 2008), and levels varying
1.4 to 3.3-fold in cherry, nectarine, peach and plum cultivars (See Table 1.2.2) (Girard and
Kopp 1998; Gil et al. 2002; Di Vaio et al. 2008). In plums, AA and total carotenoid levels
increased with ripening and 3-weeks storage, but levels for both nutrients decreased after 6-
weeks (Khan et al. 2009). In Rojo Rito peaches, carotenoid levels increased ~60% during 14
days storage at ambient temperature (Flores et al. 2008). Similarly, carotene and other
carotenoids increased ~2-fold with 8 days ambient temperature storage in Spring Belle
peaches (Caprioli et al. 2009). -carotene levels also increased in apricots during 14 days
cold storage, with levels 27-57% higher than harvest levels (Leccese et al. 2010).
6
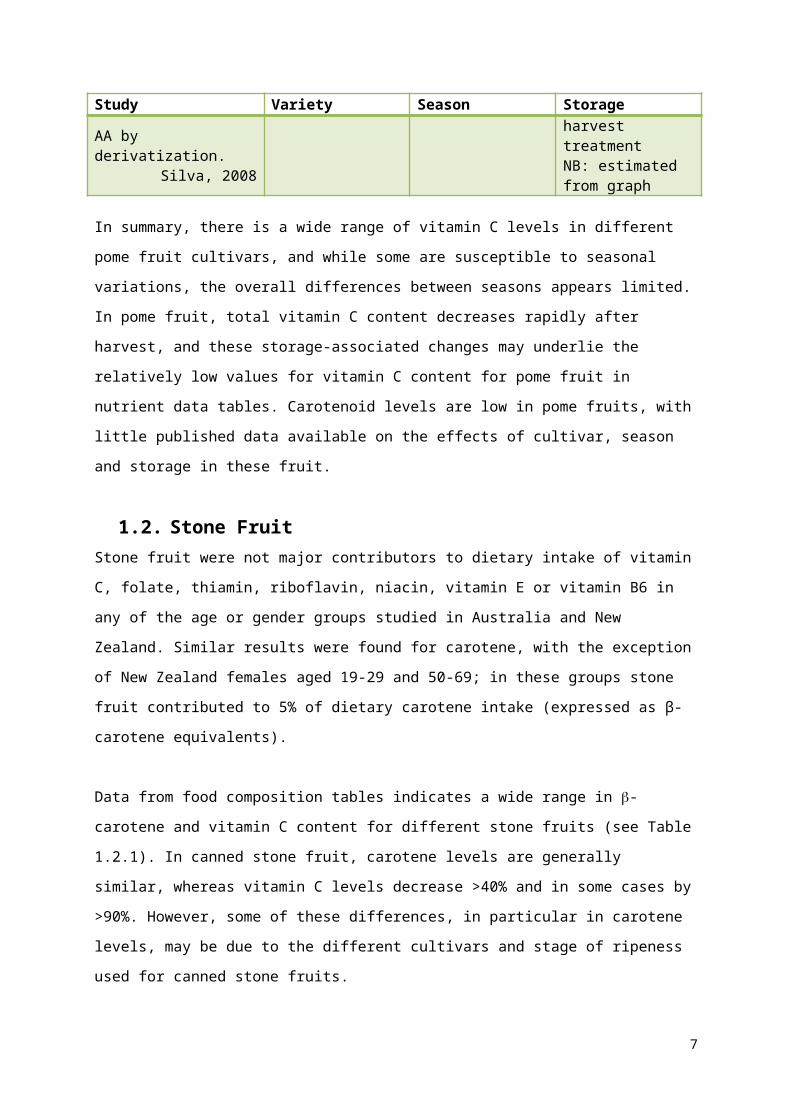
Table 1.2.2 Natural variation and effects of season and storage on carotene (g/100 g) and vitamin C (mg/100 g) levels in whole stone fruit1.
StudyVariety
Season / Growing conditions
Storage
15 apricot genotypes. Vitamin C (not specified) by HPLC method.
Hegedus, 2010
Vitamin CMean: 8.5Range: 3.0-16.2
Not determined
Not determined
37 apricot varieties, including white, yellow, light orange and orange-fleshed varieties.Carotenoids by HPLC.
Ruiz, 2005
Total carotenoidMean: 6627Range: 1512-16500
Not determined
Not determined
29 apricot cultivars and hybrids. Total carotenoids measured spectrophotometrically.
Drogoudi, 2008
Total carotenoidMean: 2320Range: 950-3780
Not determined
Not determined
5 apricot cultivars grown under integrated and organic systems at harvest and after 7 and 14 days cold storage. Carotene data presented for 2 varieties measured by HPLC .
Leccese, 2010
-carotene at harvest in integrated apricots:Cafona: 1153Pellecchiella: 1680
-carotene at harvest in organic apricots:Cafona: 799(-31%)Pellecchiella: 2218 (+24%)
-carotene Integrated (7d: 14d):Cafona: 1154: 1560 (+35%)Pellecchiella: 1840: 2505 (+49%)Organic (7d: 14d):Cafona: 915: 1261 (+57%)Pellecchiella: 2009: 2807 (+27%)
12 cherry cultivars.AA by HPLC
Girard, 1998
AAMean: 12.7Range: 8.4-17.6
Not determined
Not determined
Storage of ‘0900 Ziraat’ cherry for 30 and 60 days at 0C, and 60 days at 0C followed by 2 days at 20C with controlled atmosphere (CA).Spectrophotometric determination of AA.
Akbudak, 2009
AAAt harvest: 24.5
Not determined
AANormal air:30d: 12.7 (-48%)60d: 10.1 (-59%)60+2d: 7.3 (-70%)CA (25% CO2:5% O2):30d: 19.8 (-19%)60d: 17.0 (-31%)60+2d: 13.4 (-45%)
5 cultivars for white and yellow peaches (WP, YP), white and yellow nectarines (WN, YN) and plums (25 total).AA, DHAA and total
Total vitamin Cmean (range):WP: 7.1 (5.9-8.6)YP: 8.0 (3.8-13.3)WN: 9.5 (5.1-13.9)YN: 6.4 (5.9-7.2)Plum: 6.1 (2.6-10.7)
Not determined
Not determined
7

StudyVariety
Season / Growing conditions
Storage
carotenoids measured 5 days after harvest by HPLC.
Gil, 2002
Total CarotenoidsWP: 12 (8-18)YP: 139 (100-207)WN: 10 (8-12)YN: 135 (91-171)Plum: 135 (87-285)
7 yellow peach cultivars and 5 yellow nectarine cultivars and 1 white nectarine cultivar. -carotene measured at harvest and after 7 days cold storage by HPLC.
Di Vaio, 2008
-carotene Yellow peach:Mean: 48Range: 38-62Yellow nectarine:Mean: 32Range: 26-37White nectarine:12
Not determined
-carotene Peach:Mean: 45 (-7%)Range: 34-61Nectarine:Mean: 31 (-1%)Range: 27-36White nectarine:9 (-27%)
Rojo Rito peaches stored for 14 days at 20 in the presence or absence of nitric oxide (NO) gas. AA and DHAA by HPLC analysis, total carotenoids by spectrophotometry.
Flores, 2008
AA: 10.5DHAA: 4.4Total vitamin C: 14.9Carotenoids: 2790
AAAir: 3.6 (-66%)NO: 5.1 (-51%)DHAAAir: 8.0 (+82%)NO: 7.8 (+77%)Total vitamin CAir: 11.6 (+10%)NO: 12.9 (+23%)CarotenoidsAir: 4440 (+60%)NO: 4480 (+61%)
1Studies summarised in this table are restricted to those where numerical data were presented in the publications
In summary, there is a wide range of vitamin C and carotene levels in stone fruit, as reported
in nutrient data tables and published literature. AA content is susceptible to decreases with
processing and storage, but it is important to consider conversion of AA to DHAA when
considering these effects on total vitamin C. In contrast to vitamin C, carotene levels were
generally unaffected or increased with processing and storage of stone fruits.
1.3. Berry fruitBerries are a rich source of vitamin C, but despite this berries did not contribute >5% of
dietary vitamin C intake. Similarly, berries did not constitute a major contributor to carotene,
folate, thiamin, riboflavin, niacin, vitamin E or vitamin B6 intakes in any of the age or gender
groups studied in Australia and New Zealand.
As detailed in Table 1.3.1, there is a large range in carotene and vitamin C levels between
different berry types and in levels reported from different countries. Berries are commonly
8

canned or frozen, with both these processes impacting on nutrient levels. Carotene is
relatively stable during these processes, with the exception of an 85% decrease in canned
blueberries in Australian data. In contrast, vitamin C is generally lower in frozen berries
(mean; -29%, range; -30% to -86%), with larger losses occurring in canned berries (mean; -
76%, range; -46% to -90%). As for stone fruit, some caution needs to be applied in making
direct comparisons between fresh and frozen or canned berries, as the effects of season,
growing location and cultivar may also influence nutrient composition.
Table 1.3.1 -carotene and vitamin C (mg/100 g) levels of fresh, frozen and canned berries.
Fruit-carotene (µg/100 g) Vitamin C (mg/100 g)
NUTTABa NZ NUTTABa NZ USDAa
Blackberry 150 76 38 20 21Blackberry (canned)
n.a. n.a. n.a. n.a. 3c
Blueberry 39 8 13 4 10Blueberry (canned)
20b n.a. 2b n.a. <1b
Blueberry (frozen)
38 15 9 6 3
Raspberry 28 0 32 14 26Raspberry (canned)
0b n.a. 5b n.a. 9c
Raspberry (frozen)
26 n.a. 22 n.a. 17
Strawberry 0 6 45 46 59Strawberry (canned)
11b n.a. 12b n.a. 32c
Strawberry (frozen)
0 n.a. 32 n.a. 41
bDrained fruit canned in syrup. cUndrained fruit canned in syrup
Studies of strawberry cultivars demonstrate a strong effect of genotype on vitamin C levels,
with content ranging from 23-185 mg/100 g in different cultivars (Table 1.3.2) (Shin et al.
2008; Tulipani et al. 2008; Josuttis et al. 2012; Pincemail et al. 2012). In two studies of 3 and
12 cultivars, mean AA contents were 70 and 106 mg/100 g, respectively (Josuttis et al. 2012;
Pincemail et al. 2012). These values are higher than those reported in nutrient data tables for
Australia, New Zealand and the US, but the values in these tables still fall within the range
reported in published literature. Vitamin C content in strawberries also varied with harvest
time, season, location and growing conditions (Josuttis et al. 2012; Pincemail et al. 2012).
Table 1.3.2 Natural variation and effects of season and storage on vitamin C (mg/100 g) levels in berry fruits.
9

Study Variety Season / Growing conditions
Storage
6 blackberry cultivars.AA and DHAA by titration following solid phase extraction.
Thomas, 2005
AAMean: 9.1Range: 8.3-10.3DHAAMean: 1.1Range: 0.2-2.9Total Vitamin CMean: 10.1Range: 8.4-11.9
Not determined Not determined
13 raspberry cultivars and 2 experimental genotypes harvested from 3 growing sitesin 3 consecutive years.AA by LC-MS
Pirogovskaia, 2012
AA(12 cultivars)Mean: 20.9Range: 7.0-40.6
AASeason:Mean (range)2008: 13.7 (7.0-24.5)2009: 23.4 (11.3-40.6)2010: 25.6 (14.6-34.1)Site:Genotype 36: 27.1-35.3C. Delight: 20.5-21.6Malahat: 23.1-37.6
Not determined
11 wild raspberry genotypes and 1 commercial cultivar harvested over 2 years.AA by commercial assay
Tosun, 2009
AAMean: 28Range: 21-36
No significant effect of year (data not shown): pooled data presented
Not determined
4 raspberry cultivars. Assessed at harvest, after 1 day at 20C and after 3 days at 2-4C + 1 day at 20C.AA by titration.
Krüger, 2011
AAMean: 29.0Range: 18.3-33.3
Not determined
AA1d: 28.73+1d: 28.3Not significant
5 commercial strawberry cultivars and 4 experimental genotypes.AA by HPLC.
Tulipani, 2008
AARange: 23-47
Not determined Not determined
3 strawberry cultivars, 4 locations and 2 consecutive years.AA by titration.
Josuttis, 2012
AAMean: 70.1Range: 36.5-98.0
AASeason:Mean (range)2008: 64.8 (36.5-88.7)2009: 74.2 (46.8-98.0)Site:Range (no. of sites)Elsanta: 74.2-91.6 (4)Korona: 50.8-57.8 (3)Clery: 65.2-80.0 (2)
Not determined
12 strawberry cultivars grown under various
AAMean: 105.9
AAElsanta cv., different
Not determined
10

Study Variety Season / Growing conditions
Storage
conditions and harvested (1) at various times within a growing season ad (2) in 2 consecutive years.AA by titration.
Pincemail, 2012
Range: 51.0-184.7
growing conditions May-Nov harvest:Mean: 75.2Range: 33.7-115.5
Significant effect of year (graphical data)
2 strawberry cultivars stored at 3C for 1-20 days in either air or 20% CO2.Total vitamin C, AA, and DHAA by enzyme assay.
Shin, 2008
At harvest:AANortheaster: 32.3Earliglow: 44.9DHAANortheaster: 0.5Earliglow: 0Total vitamin CNortheaster: 32.8Earliglow: 44.9
Not determined
Day 20, Northeaster:AAAir: 44.2 (+27%)CO2: 28.6 (-11%)DHAAAir: 0CO2: 1.7 (+250%)Total vitamin CAir: 42.0*CO2: 30.3 (-8%)Day 20, Earliglow:AAAir: 52.4 (+17%)CO2: 24.2 (-46%)DHAAAir: 3.9CO2: 13.9Total vitamin CAir: 56.3 (+25%)CO2: 38.1 (-15%)*Total vitamin C value as reported in paper is lower than AA value
Published data on raspberry vitamin C content reported a range from 7-41 mg/100 g
between cultivars: the values in nutrient data tables fall within this range (Tosun et al. 2009;
Pirogovskaia et al. 2012). AA content was also influenced by growing site and was
significantly different between seasons, with levels varying up to 1.9-fold between years
(Pirogovskaia et al. 2012). A study of blackberry cultivars reported a range in Total vitamin C
from 8-12 mg/100g; these values are ~3-fold lower than values reported in the nutrient data
tables (Thomas et al. 2005).
A study on nutrient stability in different berry fruits over 8 days at temperatures between 0-
30C showed vitamin C levels were relatively stable in strawberries and highbush blueberries
(Kalt et al. 1999). In contrast, vitamin C levels decreased by 22% and 46% in raspberries at
20 and 30C respectively. There was also a significant, albeit small, decline in vitamin C
levels with storage at higher temperatures in lowbush blueberries. In other studies of
raspberries, vitamin C and anthocyanin content was stable over 3-4 days storage, and also
11

with freezing (Mullen et al. 2002; Krüger et al. 2011). In contrast, a study of raspberries
stored for 9 days in either controlled atmosphere or high CO2 at 1C reported total vitamin C
declined by 90% (Agar et al. 1997; Mullen et al. 2002). In strawberries, there was a
significant effect of atmosphere on Total vitamin C levels during storage; levels increased 28-
29% in air, but decreased by 8-13% in 20% CO2 over 20 days (Shin et al. 2008). Similarly,
total vitamin C levels were stable in strawberries stored in controlled atmosphere or high CO2
at 1C for 20 days, but the proportion of DHAA increased from ~10% to ~50-75% in
strawberries stored in 20% CO2 (Agar et al. 1997). In the same study, further storage in
controlled atmosphere and removal of berries to ambient conditions to mimic shelf-life
resulted in higher levels of DHAA, and also loss of total vitamin C (approximately -30% from
day 0). In blackberries, total vitamin C levels were stable over 9 days storage, but there was
an increase in DHAA levels (Agar et al. 1997).
In summary, vitamin C levels vary up 8-fold between berry cultivars, and are also affected by
growing season and location. Vitamin C levels are relatively stable in berries during short-
term storage, but the proportion of DHAA rose during storage. Prolonged storage was
associated with losses of total vitamin C. Large losses of vitamin C occur in frozen berries,
with even greater losses in canned berries.
1.4. Citrus fruitCitrus fruit are a major dietary contributor to vitamin C in all age and gender groups in
Australia and New Zealand, with the exception of 17-18 year old Australian females. Citrus
fruit provide 5-17% of vitamin C intake. Citrus are not a major source of dietary carotene,
thiamin, riboflavin, niacin, folate or vitamins E and B6 in Australia and New Zealand.
Vitamin A and C contents of different citrus fruits, as reported in nutrient composition tables
for Australia, New Zealand and the USA, are summarised in Table 1.4.1. These data indicate
a large range of carotene and vitamin C content between citrus fruit types, and between
cultivars of different citrus fruits. However, vitamin C levels are consistently high across all
citrus types.
Table 1.4.1 -carotene (µg/100 g) and C (mg/100 g) levels in citrus fruits from nutrient reference tables
Fruit-carotene Vitamin C
NUTTABa NZ NUTTABa NZ USDAa
Grapefruit 11 0 40 40 31-79Lemon 10 7 48 52 53
12

Fruit-carotene Vitamin C
NUTTABa NZ NUTTABa NZ USDAa
Lime 30 NA 47 na 29Mandarin 46-290 67 28-58 42 27Orange 56-140 85 44-58 36 45-59aWhere values are provided for different varieties a range is given. na, data not available
As summarised in table 1.4.2, data on vitamin C levels in citrus fruits from published scientific
literature are generally consistent with the values reported in the nutrient reference tables
(Ladaniya et al. 2003; Dhuique-Mayer et al. 2005; Erkan et al. 2005; González-Molina et al.
2008; Milella et al. 2011; Bermejo and Cano 2012). There is a strong effect of cultivar
(genotype) on vitamin C levels, with a 1.4-fold range in oranges and 2.1- to 4.6- fold
differences within mandarin and clementine varieties (Dhuique-Mayer et al. 2005; Milella et
al. 2011; Bermejo and Cano 2012). AA levels decreased by 22-31% over 3-6 months
storage, but as DHAA levels were not reported in these studies it is unclear if these losses
are representative of changes in total vitamin C (Ladaniya et al. 2003; Erkan et al. 2005).
The comparison of carotene levels between published data and nutrient reference tables is
complicated by the varied units in which carotenes are reported (for example as -carotene,
total carotenoids or retinol equivalents). However, similar levels of carotene were observed in
the juice of 8 orange cultivars (13-38 µg RE/100 mL), but higher levels were observed for
mandarins (96-115 µg RE/100 mL) in comparison to nutrient reference tables (Dhuique-
Mayer et al. 2005). Similar variations in carotenoids content for oranges and mandarins were
reported by another two studies (see Table 1.4.2; (Fanciullino et al. 2008; Dhuique-Mayer et
al. 2009)).
13

Table 1.4.2 Natural variation and effects of season and storage on carotene (g/100 g, or as
indicated) and vitamin C (mg/100 g) levels in citrus fruits.
Study Variety Season / Growing conditions
Storage
8 orange cultivars, 1 mandarin and 1 clementine. Carotenoids and total vitamin C by HPLC.
Dhuique-Mayer, 2005
Total vitamin COrange:Mean: 55.3Range: 46.2-62.7Mandarin: 41.3Clementine: 53.1
Vitamin A(µg RE/100 mL)Orange:Mean: 24.3Range: 13.2-38.1Mandarin: 115.4Clementine: 96.0
Not determined Not determined
3 orange cultivars, 2 mandarin and 1 clementine. Carotenoids measured in 2-5 growing locations, and oranges assessed in 3 consecutive years.Carotenoids by HPLC.
Dhuique-Mayer, 2009
-carotene mg/100 mLOrange:Mean: 3.7Range: 0.8-6.9
MandarinMean: 11.6Range: 4.0-19.8
-carotene Mean (range)over 3 seasons:Valenica: 4.6 (3.5-5.5)Sanguinelli: 4.3 (3.8-5.4)Pera: 5.0 (3.6-6.9)
Growing location (no.):Valenica (5): 2.0 (0.8-4.8)Sanguinelli (2): 1.0-3.7Pera (2): 2.6-6.8Mandarin (2): 4.0-19.8Hansen mandarin (3): 11.4 (7.0-19.7)Clementine (2): 1.7-6.8
Not determined
6 mandarin, 3 hybrid, 3 orange, 2 grapefruit, 2 pummelo, 2 lime, 1 citron and 1 lemon cultivars on different rootstocks, harvested up to 11 times between September and March.Total vitamin C by HPLC*Subset of data for single time point assessed
Bermejo, 2012
Total vitamin C*mean (range if>2 cultivars)Mandarin: 40.2 (25.9-54.8)Hybrid: 31.0 (16.9-55.9)Orange: 56.9 (53.1-60.2)Grapefruit: 48.0Pummelo: 53.1Lime: 29.6Citron: 33.4Lemon: 58.9
Effect of Rootstock:9 cultivars studied. Significant effect at all 5 harvest dates for lemon and citron, and 1-2 harvest dates for 5 citrus
See text for more details.
Not determined
4 orange cultivars.Total carotenoids by
Total carotenoids (mg/100 mL)
Not determined Not determined
14

Study Variety Season / Growing conditions
Storage
HPLCFanciullino, 2008
Mean: 2.7Range: 0.3-4.7
2 Fino lemon clones (49-5, 95) harvested at 3 sampling times over 3 consecutive years.AA and DHAA by HPLC
Gonzalez-Molina, 2008
Total vitamin CRange:Clone 49-5: 21.6-40.1Clone 95: 21.9-35.1
Total vitamin CClone 49-5 / 95Year:2004: 39.5 / 30.62005: 30.9 / 30.12006: 24.2 / 24.0Harvest time:Early: 34.9 / 29.9Mid:26.3 / 25.3Late: 29.0 / 27.7
Not determined
13 clementine cultivar and 2 hybrids.Vitamin C (not specified) by HPLC
Milella, 2011
Vitamin CMean: 57.4Range: 20.6-95.5
Not determined Not determined
Valencia oranges, stored up to 6 months following no treatment, curing at 48-53C, or hot-water dipping.AA by titration.
Erkan, 2005
AAAt harvest: 60.3
Not determined
AA6 months:Control: 44.3 (-27%)Curing: 44.4-46.9(-22% to -26%)Hot water: 43.2-46.7(-22% to -27%)
Lime, mandarin and orange stored for 75 (mandarin) to 90 (lime and orange) days at 6-8C.AA by titration
Ladaniya, 2003
AAAt harvest:Lime: 31.8Mandarin: 24.2Orange: 40.4
Not determined
AAAfter 75-90d storage:Lime: 32.2Mand.: 22.1 (-9%)Orange: 27.9 (-31%)
Effects of season and harvest time on vitamin C and carotene levels have also been
assessed in citrus fruits. In two clones of Fino lemons, total vitamin C ranged from 24-40 and
24-31 mg/100 g over three harvest seasons, despite similar climatic conditions (González-
Molina et al. 2008). In the same study, total vitamin C levels also fluctuated with harvest time,
with lowest levels in mid-season harvest fruit. Similar observations were made for -carotene
levels in orange cultivars harvested in three consecutive years, with 1.4- to 1.9- fold
differences between levels within the same cultivar (Dhuique-Mayer et al. 2009). The effect
of growing location was also assessed in this study. -carotene levels varied up to 6-fold
between fruit of the same cultivar grown in different locations in the same year.
In a study of 9 citrus cultivars there was a variable effect of rootstock on total vitamin C
levels. In the citron and lemon cultivars studied, total vitamin C content varied 12-33% and 9-
15

21%, respectively, between fruit from the same cultivar grown on two different rootstocks and
harvested at 5 intervals. In other citrus fruit, rootstock had less of an effect on vitamin C
levels, with either no difference, or differences at only 1 or 2 of the time-points assessed
(Bermejo and Cano 2012).
In summary, these data demonstrate that there is a high level of variation in both carotene
and vitamin C content in citrus fruits, with the greatest variation coming from cultivar type.
Growing season, location and harvest time also influence nutrient composition of citrus fruits.
Post-harvest treatments and storage were also associated with vitamin C losses, although
the susceptibility to these changes varied with fruit type.
1.5. Tropical fruitTropical fruits do not contribute more that 5% of dietary carotene intake in Australia and New
Zealand. In contrast, 5-6% of dietary vitamin C intake in females over 50 and Australian
males over 70 is derived from tropical fruits. Tropical fruits contribute 5-19% of vitamin B6
levels in the majority of population groups, except 14-18 year old Australians, 9-13 year old
male Australians and female 14 year old New Zealanders. The major fruit contributing to this
intake of vitamin B6 is bananas. Tropical fruits do not contribute to >5% dietary intake of
thiamin, riboflavin, niacin, folate or vitamin E.
Table 1.5.1 -carotene (µg/100 g) and vitamin C (mg/100 g) levels in tropical fruits from
nutrient reference tables
Fruit-carotene Vitamin C
NUTTABa NZ NUTTABa NZ USDAa
Avocado 20-29 50 6-13 7 9-17Banana 23-35 75 4-19 8 9Custard apple 0 n.a. 43 n.a. 19
Guava 380 n.a. 243 n.a. 228Litchi 0 n.a. 49 n.a. 72Mango 1433 1200 26 30 36Pawpaw (papaya) 240 n.a. 60 n.a. 61
Pineapple 10 60 17 25 17-56Pineapple (canned) 15-17b 15-22b 8-12b 10-14b 7-10c
Rambutan 0 n.a. 70 n.a. n.a.aWhere values are provided for different varieties a range is given. bFruit canned in syrup or juice, drained, cFruit canned in syrup or juice, solids and liquids
16

Nutrient composition data for tropical fruits are presented in Table 1.5.1. Avocados are lipid-
rich, and show a high level of variability in both carotene and vitamin C between cultivars. In
Hass avocados, -carotene levels varied from 10-100 g/100 g in fruit depending on growing
location and harvest time (Lu et al. 2009).
Bananas also exhibit variation in vitamin content; one report found total provitamin A
carotenoids varied 20% within individual fruits, and further variation of ±7% to ±43% occurred
within the hand of bananas from different varieties. Total provitamin A carotenoid content
ranged from 3-76 nmol/g dry weight (i.e. 161-4080 µg/100 g) between six banana and
plantain varieties (Davey et al. 2007; Lu et al. 2009). In another study of two banana
cultivars, -carotene content ranged from 43-131 g/100 g, and vitamin C from 3-18 mg/100
g (Wall 2006a). In Southeast Asia there are a number of banana cultivars with orange to red
coloured flesh, with -carotene levels of up to 1370 g/100 g in these banana cultivars
(Englberger et al. 2003).
A study of 5 mango varieties reported a range of mean -carotene levels from 500-2600
µg/100 g between varieties, with intra-variety variations of 1.4 to 7.0-fold depending on
location and harvest time (Manthey and Perkins-Veazie 2009). Vitamin C levels ranged from
12-125 mg/100g between varieties, and the intra-variety variation ranged from 1.1 to 2.6-fold.
In a study on the effects of fruit handling on -carotene and vitamin C levels in mango and
papaya, the effect of fruit-to-fruit variation was greater than that of handling, particularly for
vitamin C (standard deviation was >40% of mean) (Oliveira et al. 2010). In green mangoes,
vitamin C levels decreased 50% and 58% over 15 days in whole and fresh-cut fruit,
respectively (Robles-Sánchez et al. 2009). Losses of -carotene were similar in fresh-cut fruit
(-40%), but levels were stable in whole-fruit over 15 days.
Nutrient composition varied between two pineapple varieties; -carotene, total carotenoids
and total vitamin C content were 2.4-, 3.0- and 1.9-fold higher, respectively, in Del Monte
Hawaii Gold compared to Smooth Cayenne pineapples (Ramsaroop and Saulo 2007).
Vitamin C and total phenol content also varied within pineapple, with highest levels in the
middle third of fruits, and levels 8-13% lower in the top third and 10-21% lower in the bottom
third of the fruit (Montero-Calderón et al. 2010). Pineapples are commonly canned, and this
process can decrease vitamin C content by >30% (see Table 1.5.1).
17

Table 1.5.2 Natural variation and effects of season and storage on carotene (g/100 g, or as
indicated) and vitamin C (mg/100 g) levels in tropical fruits.
Study Variety Season / Growing conditions
Storage
Hass avocado grown in 4 locations and harvested at 4 times.Carotenoids by HPLC.
Lu, 2009
Not determined
-carotene Effect of location:Mean (range)January: 26 (10-41)April: 65 (56-78)July: 79 (58-88)September: 69 (52-101)
Total carotenoidsRange: 590-4220
Not determined
2 banana and 5 papaya cultivars grown in 2-7 locations.AA and carotene (µg RE/100 g) by HPLC
Wall, 2006a
AAMean (range):Banana: 9.7 (4.5-12.7)Papaya: 51.2 (45.3-55.6)REBanana: 10.9 (8.2-12.4)Papaya: 44.1 (20.4-50.3)
AABanana:Dwarf: 6.3-17.5Williams: 2.5-6.3Papaya:Rainbow: 46.6-60.4Sunrise: 46.8-64.5REBanana:Dwarf: 7.7-17.1Williams: 6.1-9.3Papaya:Rainbow: 32.0-74.0Sunrise: 18.7-72.5
Not determined
6 banana/plantain cultivars assessed in fruit from 1-3 plants.Pro-vitamin A carotenoids (pVAC) by HPLC
Davey, 2007
pVAC(nmol/g dry weight)Mean: 36.7Range: 2.7-76.3
Not determinedNot determined
Guava grown in 3 locations.AA by HPLC.
Gull, 2012
Not determinedAAMean: 175.7Range: 129.5-247.9
Not determined
2 longan, 3 litchi and 6 rambutan cultivars harvested from 3-5 locations.AA by HPLC.
Wall, 2006b
AAMean (range):Longan: 60.1 (44.7-79.2)Litchi: 27.6 (21.0-36.0)Rambutan: 36.4 (22.0-47.8)
AARange for cultivars grown in ≥1 locationLongan:Biew Kiew: 44.7-79.2Sri Chompo: 51.2-59.0Litchi:Bosworth: 21.0-24.0Kaimana: 30.7-36.0Rambutan:Rongrien: 37.6-39.3
Not determined
18
Study Variety Season / Growing conditions
Storage
5 mango cultivars, 1-4 growing locations and 1-4 harvests within a season for each location.AA measured spectrophotometrically, and -carotene by HPLC.
Manthey, 2009
AAMean: 37.8Range: 11.5-134.5
-carotene Mean: 1160Range: 310-3900
Growing location by cultivarAATommy Atkins: 17.0-20.3Haden: 27.5-31.7Kent: 22.6-27.4 -carotene Tommy Atkins: 450-580Haden: 490-810Kent: 840-2180
Not determined
9 cultivars of Thai mango, 4-7 days post-harvest ripening, 2 consecutive years.Carotene (µg RE/100g dry weight) by HPLC.
Vasquez-Caicedo, 2005
REMean: 1037Range: 281-2049
RESeason:Mean (range)2001: 1061 (281-1573)2002: 1013 (397-2049)
Difference by cultivar:0.5 to 1.6-fold
Carotene increase up to 8.8-fold with ripening
2 pineapple cultivarsTotal vitamin C and carotene by HPLC
Ramsaroop, 2007
Total vitamin CRange: 35-68
-carotene Range: 17.2-41.6
Not determinedNot determined
Within-fruit variation in vitamin C of pineapple.Total vitamin C by HPLC
Montero-Calderon, 2010
Total vitamin CUpper third: 30.5Middle third: 35.1Bottom third: 33.3
Not determinedNot determined
A study of papaya cultivars in Hawaii found -carotene ranged from 81-410 g/100 g, and
vitamin C ranged from 45-65 mg/100 g (Wall 2006a). In litchi, vitamin C content varied from
21-36 mg/100g, depending on cultivar and location (Wall 2006b). Storage of litchi was
associated with rapid decline in AA content, with ~40% decrease after 8 days storage at
ambient temperature, and losses of approximately 35% during 8 weeks cold storage
(Mahajan and Goswami 2004). Similar losses were observed in two other litchi cultivars, with
40-45% decrease in AA during 28 days cold storage (Khan et al. 2012). Vitamin C was also
variable in rambutans, with levels ranging from 22-48 mg/100 g (Wall 2006b). In guava,
vitamin C content increased with fruit ripeness, and also varied with geographic growing
location; vitamin C content in unripe fruit ranged from 73-136 mg/100 g, and in ripe fruit from
129-248 mg/100 g (Gull et al. 2012).
In summary, the tropical fruit category encompasses a wide variety of fruits, with some rich in
either vitamin C, carotene or both. Across all fruit types, there is a large variation in nutrient
composition with cultivar, and for the fruits where data were available it was evident that
19

harvest time and location also effect vitamin C and carotene content. Vitamin C levels
decline rapidly with storage in mango and litchi, but carotene levels increased with ripening in
stored mangos.
1.6. Other fruitGrapes, rockmelon (cantaloupe), honeydew melon, watermelon, kiwifruit and persimmon are
included in “other fruit” in the Australian and New Zealand nutrition surveys. The other fruit
category contributed to 7% and 5% of dietary carotene intake in Australian male children
aged 2-3 and 4-8 years old, respectively. For vitamin C, other fruit contributed 5-6% of
dietary intake in Australian 2-3 year olds and female 4-8 year olds. In New Zealand, other
fruit made a major contribution to vitamin C intake in females aged 14 years (7%), 50-69
years (6%) and ≥70 years (9%).
As summarised in Table 1.6.1, yellow-fleshed kiwifruit tend to have higher vitamin C content
in comparison to green-fleshed species. A study of kiwifruit species and cultivars found total
vitamin C content ranged from 26-185 mg/100 g in green-fleshed fruit. The most commonly
consumed kiwifruit cultivar is Hayward, and the inter-fruit variation in vitamin C content in this
cultivar was 26%, with a mean concentration of 55 mg/100 g (Nishiyama et al. 2004). Vitamin
C content is still dependent on cultivar in yellow-fleshed kiwifruit, with concentrations ranging
from 64-206 mg/100 g (Table 1.6.2, (Nishiyama et al. 2004)). During storage, AA levels
decreased with time, with 32% reduction between 1 and 5 months (Aghdam et al. 2011).
Treatment with methyl salicylate decreased the storage-associated diminution of AA.
However, without DHAA or total vitamin C data it is unclear whether these changes represent
destruction or conversion of AA.
As shown in Table 1.6.1, there is a large range in carotene and vitamin C content in grapes.
The range of -carotene levels in black grapes was 40-91 µg/100 g, with +9 to -38% variation
in -carotene levels observed between two consecutive seasons (Oliveira et al. 2004). The
same study also showed that -carotene levels were higher in shaded fruit, in fruit grown at a
greater plant height and that levels decreased with ripening.
20

Table 1.6.1 -carotene (µg/100 g) and C (mg/100 g) levels in grapes, kiwifruit, persimmon
and watermelon.
Fruit-carotene Vitamin C
NUTTABa NZ NUTTABa NZ USDAGrape 0-50 54-91 0-7 4 3Honeydew melon 30-50 30 12-20 50 18
Kiwifruit (gold) 45 43 110 109 105
Kiwifruit (green) 50 54 71 85 93
Passionfruit 360 10 18 20 30Persimmon 200 825 14 10 8Rockmelon 836 205 41 27 37Watermelon 427 20 8 8 8aWhere values are provided for different varieties a range is given.
Published data for carotene in Chinese-grown persimmons is lower than that in nutrient data
tables, with levels ranging 12-91 g RE/100 g in astringent cultivars, and 9-35 g RE/100 g
in non-astringent cultivars (Zhou et al. 2011). Published values for vitamin C content of
persimmon (8-14 mg/100 g) were similar to the values in the nutrient data tables (12
mg/100g) (Celik and Ercisli 2008).
-carotene levels vary 2-10-fold between watermelon cultivars (Perkins-Veazie et al. 2006;
Tlili et al. 2011a). Vitamin C levels also varied between watermelon cultivars, with levels
varying from 11-34 mg/100 g in ripe fruit (Tlili et al. 2011a; Tlili et al. 2011b). The vitamin C
content also varies within watermelon, with the distribution of AA and DHAA within fruit
varying with cultivar (Tlili et al. 2011b).
Honeydew melon and rockmelon are cultivars of muskmelon. As detailed in Table 1.6.1 there
is a wide range of carotene and vitamin C content as reported in nutrient composition tables.
In a study of recombinant inbred lines of melon, -carotene levels varied between lines and
were also affected by growing location and season (Cuevas et al. 2008). Overall, -carotene
levels ranged from 330-2440 g/100 g. Another study compared standard, hybrid and grafted
melons and found AA levels ranged from 5-22 mg/100 g (Kolayli et al. 2010). In a study of
four honeydew melon cultivars, total vitamin C levels ranged from ~13-26 mg/100 g, with up
to 3-fold variation in vitamin C levels between fruit harvested in 2 consecutive years (Lester
and Crosby 2002).
21

Table 1.6.2 Natural variation and effects of season and storage on carotene (g/100 g) and
vitamin C (mg/100 g) levels in grape, melon, kiwifruit and persimmon.
Study Variety Season / Growing conditions
Storage
8 grape cultivars harvested in 2 consecutive seasons.-carotene by HPLC.
Oliveira, 2004
-carotene Mean: 59.8Range: 40.2-91.0
-carotene Mean (range)2001: 66.2 (45.6-91.0)2002: 53.3 (40.2-62.1)
Not determined
21 kiwifruit cultivars; 14 green-fleshed and 7 yellow-fleshed.Total vitamin C by HPLC.
Nishiyama, 2004
Total vitamin CGreen-fleshed:Mean: 76.0Range: 25.5-184.6Yellow-fleshed:Mean: 125.4Range: 64.4-205.8
Not determined Not determined
Kiwifruit stored for 1-5 months at 0.5C ± pre-treatment with methyl salicylate (MeSA) vapour.AA by titration.
Aghdam, 2011
Not determined Not determined
AA(% of 1 m control)Control:1 m: 605 m: 41 (-32%)8-32L/L MeSA:1m: 63-75 (+5 to +25%)5m: 46-58 (-3 to -23%)
3 commercial melon cultivars (and other inbred lines), 2 growing locations and 2 consecutive years.-carotene by HPLC.
Cuevas, 2008
-carotene Mean: 1310Range: 880-1960
-carotene Mean (range) of 2 years and 2 locations for each cultivar:Sol Dorado: 1520 (1070-1960)Esteem: 1080 (880-1240)Top-Mark: 1330 (1050-1790)
Not determined
3 melon types.AA measured spectrophotometrically
Kolayli, 2010
AAMean: 15.4Range: 5.4-22.5
Not determined Not determined
46 persimmon cultivars; 42 astringent and 14 non-astringent.Carotenoids by HPLC
Zhou, 2011
Retinol equivalentsAstringent:Mean: 39.9Range: 11.8-90.6Non-astringent:Mean: 19.6Range: 8.6-35.4
Not determined Not determined
5 watermelon cultivars.Total vitamin C measured
Total vitamin CMean: 14.9
Not determined Not determined
22

Study Variety Season / Growing conditions
Storage
spectrophotometrically, carotenoids by HPLC
Tlili, 2011a
Range: 12.0-20.4 -carotene Mean: 150Range: 100-210LycopeneMean: 5270Range: 4450-6450
6 watermelon cultivars.Total vitamin C measured spectrophotometrically
Tlili, 2011b
Total vitamin CMean: 17.7Range: 10.5-24.0
Not determined Not determined
Total carotenoids measured in 26 watermelon cultivars by HPLC.
Perkins-Veazie, 2006
Total carotenoidsMean: 7780Range: 3710-12190
Not determined Not determined
In summary, as with other fruit classes, vitamin C and carotene contents varied greatly
between cultivars of the same fruit, with up to 8 to 10-fold variations in AA content of kiwifruit
and carotene content of persimmon cultivars, respectively. AA content also decreased by up
to 32% with storage of kiwifruit.
1.7. Cucurbit vegetablesIn the national nutrition surveys, cucurbit vegetables were grouped under the “other fruiting
vegetables” category in Australia, and as “other vegetables” and “orange vegetables” in New
Zealand. In Australian children aged 2-16 years, “other fruiting vegetables” were not a major
contributor to carotene or vitamin C intake. In Australians aged 17 years or over, 9-18% of
dietary carotene was derived from other fruiting vegetables. In Australian females aged 19-
29 years, and both male and female Australians aged 30 years or over, 5-6% of dietary
vitamin C intake was derived from “other fruiting vegetables”, with vitamin C from capsicum
likely being a major contributor to this intake. “Other vegetables” did not make a major
contribution to carotene or vitamin C intakes in any of the New Zealand population groups
studied. However, “orange vegetables” contributed to 35-61% of dietary carotene intakes in
all New Zealand populations. These vegetable categories were not major contributors to
vitamin E, B6, thiamin, riboflavin, niacin or folate intakes.
The cucurbits include various types of pumpkin, also known as winter squash, as well as
zucchini and cucumber. As shown in Table 1.7.1, the carotene levels vary >100-fold between
different cucurbits. Vitamin C levels also range up to 10-fold, with similar values reported in
23

published literature (Mawamba et al. 2009). The effects of cooking are more varied, with
good preservation of carotene in boiled and baked pumpkin (see Table 1.7.1). In contrast,
boiling is associated with 13-27% loss of vitamin C, and steaming led to 44-66% vitamin C
losses, depending on the type of pumpkin or squash (Table 1.7.1 (Mawamba et al. 2009)). In
this study, steaming also led to 74-91% loss of -carotene, which is in contrast to the effects
of boiling or baking as detailed in Table 1.7.1. -carotene levels in different cucurbits varied
from 5-67 g/g, with lower levels in zucchini, and higher levels in pumpkins (Azevedo-Meleiro
and Rodriguez-Amaya 2007). Intra-variety differences in this study ranged from 13-29%.
Table 1.7.1 -carotene (µg/100 g) and C (mg/100g) content of cucurbit vegetables.
Fruit-carotene Vitamin C
NUTTABa NZ NUTTABa NZ USDAa
Cucumber 78-250 59-83 7-13 1-13 3Pumpkin (winter squash)
433-2710 n.a. 8-24 n.a. 2-21
Pumpkin (baked) 484-3029 3170 8-24 10 10-15
Pumpkin (boiled) 406-1575 3530 7-19 19 4-7
Zucchini 80-243 610 22-30 0 18Zucchini (boiled) 86-275 n.a. 22-29 n.a. 13aWhere values are provided for different varieties a range is given.
In summary, little published data were available on the effects of cultivar, growing condition
and storage on nutrient composition of cucurbit vegetables. From nutrient composition
tables, the vitamin C and carotene content varied between cultivars of cucumber, pumpkin
and zucchini. In contrast to fruits, these nutrients were relatively stable during cooking.
1.8. Fruiting vegetablesIn the nutrition surveys, fruiting vegetables are included in the minor food groups “tomato and
tomato products”, “other fruiting vegetables” and “other vegetables”, with sweet corn in the
“beans/peas/corn” group for the New Zealand surveys.
Tomato and tomato products contributed to 5% of carotene intake in Australian boys aged
14-16 years, but were not major contributors to carotene intake in other population groups.
Tomato and tomato products contributed to 5-8% of vitamin C intake in Australian and New
Zealand adults aged 30 years and above, but not in younger age groups. As indicated in the
previous section, “other fruiting vegetables” contributed 9-18% of carotene intakes in
24

Australian adults, but this was due to the inclusion of pumpkins in this food group. “Other
fruiting vegetables” contributed to 5-6% of dietary vitamin C intake in Australian adults aged
over 30, and Australian females aged 19-30 years. None of the minor food groups “tomato
and tomato products”, “other fruiting vegetables”, or “other vegetables” made a major
contribution to vitamin E, B6, thiamin, riboflavin, niacin or folate intakes. In New Zealand,
beans/peas/corn were not major contributors to vitamin A, C, E, B6, thiamin, riboflavin, niacin
or folate intakes.
Table 1.8.1 -carotene (µg/100 g) and vitamin C (mg/100 g) content of fruiting vegetables
Fruit-carotene Vitamin C
NUTTABa NZ NUTTABa NZ USDAa
Capsicum (green)
161 117 98 24 80
Capsicum (red/yellow)
282 930 152 144 184 (yellow)
Chilli 140-1370 n.a. 128-201 n.a. 45-243Eggplant 39 n.a. 3 n.a. 2Eggplant (cooked)
38-62 n.a. 2-4 n.a. 2
Sweet corn 60 n.a. 5 n.a. 7Sweet corn (boiled)
6 120 4 3 6
Sweet corn (canned)
23 158 3 5 2
Sweet corn (frozen)
6 n.a. 4 n.a. 6
Tomato 60-460 549 16-28 24 9-16Tomato (canned)
393-420 209 10 8 8-9
Large variations in AA were observed in a study of fourteen tomato genotypes, with levels
ranging from 1-35 mg/100 g (Roselló et al. 2011). In this study, tomatoes were grown in
Spain in either a glasshouse during spring/summer and autumn/winter, or in an open-field
during spring/summer. Genotype was the main source of variation, but environment also
affected AA levels, with lowest levels in tomatoes grown during autumn/winter. -carotene
content was less dependent on environment, but showed similar variation between genotype,
with levels ranging from 400-3500 µg/100 g (Roselló et al. 2011). In twelve salad tomato
varieties, AA ranged from 15-21 mg/100 g and total carotenoids ranged from 6.3-9.9 mg/100
g (Abushita et al. 2000).
In a study of three tomato cultivars, AA levels increased 1.3- to 2-fold with ripening, and Total
vitamin C content ranged from 8-15 mg/100 g between ripe fruit (Periago et al. 2009). A
25

study of cherry tomatoes found no significant change in AA content with ripening, but total
carotenoid levels increased >10-fold (Raffo et al. 2002). However, in cherry tomatoes harvest
time had a significant effect on AA, total vitamin C and carotenoid levels (Raffo et al. 2012).
In this study total vitamin C levels ranged 2.3-fold and AA levels 2.8-fold, with AA
representing 38-61% of total vitamin C in tomatoes harvested at 6 times within a 12 month
period (see Table 1.8.2 for details). Carotenoid levels also varied by 1.8-fold, but neither
vitamin C nor carotenoid levels showed a clear correlation with harvest time, solar radiation
or temperature. Year-to-year variation is also evident in tomatoes, with mean AA levels
varying 1.9-fold between consecutive years in a study of 16 cultivars (Erge and Karadeniz
2011). Total carotenoids were less effected by year, but varied by up to 3.9-fold between
cultivars.
The effect of storage in tomatoes is dependent on cultivar, time and temperature. In a study
of five cultivars stored for 5 days at 15C, AA levels decreased 12-34% in four strains, but
increased 16% in another cultivar (Molyneux et al. 2004). In another study of 4 tomato
cultivars, AA levels increased in tomatoes stored for 15 days and 6C and 12C, but
decreased by 15% in tomatoes stored at 25C (Vinha et al. 2013). In industrial tomatoes, AA
levels were similar between cultivars, but decreased 55% with processing to tomato paste,
while total carotenoids ranged from 6.8-13.2 mg/100 g, and were increased in tomato paste
in association with higher lycopene levels (Abushita et al. 2000). Processing of tomatoes to
sauce or soup did not significantly change AA levels, whereas baking (at 180-220C for 45
minutes) and juicing with sterilization decreased AA content by 42-66% (Gahler et al. 2003).
Similarly, thermal processing of tomatoes at 88C for 2-30 minutes decreased vitamin C
content by 10-29% (Dewanto et al. 2002). The nutrient compositions of canned tomatoes
also demonstrate large losses of carotene and vitamin C (Table 1.8.1).
26

Table 1.8.2 Natural variation and effects of season, storage and processing on carotene
(g/100 g) and vitamin C (mg/100 g) levels in tomato
Study Variety Season / Growing conditions
Storage or processing
3 tomato cultivars.AA and lycopene by HPLC.
Periago, 2009
AAMean: 10.4Range: 7.9-15.4Lycopene1
Mean: 5.0Range: 3.0-6.8
Not determined Not determined
5 tomato cultivars, stored for 2 or 5 days at 15C in the dark.AA by titration and lycopene by spectrophotometry.NOTE: data in mg/100 g dry weight
Molyneux, 2004
AAMean: 212Range: 192-237Lycopene1
Mean: 35.0Range: 27.5-46.1
Not determined
AAMean (range)2d: 205 (173-247) -3%5d: 185 (133-224)-12%Lycopene1
2d: 38.9 (28.5-55.1) +11%5d: 47.1 (32.2-62.4) +35%
2 cherry tomato cultivars (pooled for analysis), harvested at ripe stage in April, June, July, December, January and March.AA, total vitamin C, and carotenoids by HPLC.
Raffo, 2012
Not determined
AAMean: 28Range: 16-44Total vitamin CMean: 56Range: 31-71Total carotenoidsMean: 11779Range: 8353-15119
Not determined
3 tomato cultivars and 11 experimental genotypes grown in 2 locations and 2 seasons as indicated.AA by capillary zone electrophoresis and carotenoids by spectrophotometry.
Rosello, 2011
Overall mean and range (all seasons and locations)AAMean: 14.5Range: 0.6-34.6 -carotene Mean: 1560Range: 400-3500
AATuris Spring/Summer: 18.5 (11.3-34.6)Valencia Spring/Summer:15.2 (10.9-25.0)Valencia Autumn/Winter:9.9 (0.6-33.1)
Not determined
27 tomato cultivars; 12 for fresh-eating, 15 for processing. Processing of one cultivar to tomato paste.AA and carotenoids by HPLC
Abushita, 2000
AAFresh-eating:Mean: 17Range: 15-21Processing:Mean: 19Range: 17-21 -carotene Fresh-eating:Mean: 424Range: 285-617Processing:
Not determined AAmg/g dry matterRaw: 3.2Hot-break extract: 2.0 (-38%)Paste: 1.5 (-53%)
27

Study Variety Season / Growing conditions
Storage or processing
Mean: 310Range: 210-447
16 tomato cultivars harvested in 2 consecutive years.AA and carotenoids by HPLC.
Erge, 2011
Not determined
AAMean (range)2003: 4.0 (2.2-7.4)2004: 7.5 (2.7-13.8)Total carotenoids2003: 19.4 (8.1-31.6)2004: 23.2 (13.1-34.1)
Not determined
4 tomato cultivars stored at 6C, 12C and 25C for 15 days.AA by titration and lycopene by spectrophotometry.
Vinha, 2013
Day 1:AAMean: 50.8Range: 39.8-72.1LycopeneMean: 50.4Range: 40.5-60.1
Not determined
Day 15:AA6C: 60.2 (+18%)12C: 56.6 (+11%)25C: 43.4 (-15%)Lycopene6C: 44.6 (-12%)12C: 41.5 (-18%)25C: 39.8 (-21%)
Cooking of tomatoes by baking for 15-45 min at 180-220C, or boiling peeled tomatoes with cream to process to soup.AA by HPLC
Gahler, 2003
Not determined Not determined
AABaking:0 min: 12.815 min: 12.930 min: 10.1 (-21%)45 min: 6.4 (-50%)Soup:0 min: 12.450 min: 11.5
1Lycopene data presented for tomatoes when total carotenoid data not available
Carotenoid content in capsicum increases with maturity in all species, with large differences
between species and cultivars (Table 1.8.3, Howard, 2000). For example, -carotene levels
ranged from 18-247 g/100 g in immature C. annuum cultivars, and increased to 337-800
g/100 g in mature fruit. AA also increased with maturity with levels ranging from 102-202
mg/100 g in mature capsicums (Howard et al. 2000). Similar patterns in carotenoid and AA
levels were observed with other capsicum species, including chilli (Howard et al. 2000; Marín
et al. 2004). In ripe red capsicum, AA levels decreased by 24-26% with 10 to 20 days
storage at room temperature, and by 16% after 20 days at 4C (Martínez et al. 2005). In the
same study, AA losses of 20-25% were reported after canning, 12% after blanching, and 13-
40% after freezing.
Table 1.8.3 Natural variation and effects of season and storage on carotene (g/100 g) and vitamin C (mg/100 g) levels in fruiting vegetables other than tomato.
28

Study VarietySeason / Growing conditions
Storage or processing
7 capsicum cultivars (including sweet and tabasco and habanero chillis).AA and carotenoids (µg RE/100 g) by HPLC
Howard, 2000
AAMean: 127.0Range: 74.6-202.4
REMean: 177Range: 0.3-336
Not determined Not determined
Fresno de la Vega capsicum harvested in 2 consecutive years and stored for 10 or 20 days at 4C and 20C. Effect of blanching, freezing (with 30 d storage), drying and canning on AA also measured.Enzymatic analysis of AA.
Martinez, 2005
Not determined
AA1997: 148.91998: 159.6
Not significant
AA10 days:4C: 153.8 (-4%)20C: 121.8 (-24%)20 days:4C: 134.1 (-16%)20C: 118.8 (-26%)Processing:Blanch: 140.7 (-12%)Freeze: 95.5 (-40%)Blanch + Freeze: 138.4 (-13%)Freeze dry: 19.2 (-88%)Fry / roast then can: 119.7 / 127.7(-25% / -20%)
87 inbred corn lines grown in 2 consecutive years.Carotenoids measured by HPLC.
Chander 2008
Pool of 2 years -carotene Mean: 44.9Range: 1.6-172.6Total carotenoidsMean: 1030Range: 10-2250
Year: -carotene 2004: 37.12005: 52.8Total carotenoids2004: 8722005: 1188
Not determined
44 corn genotypes including sweet and dent corn.Carotenoids measured by HPLC as g/100g dry weight.
Kurilich, 1999
-carotene Mean: 68Range: 7-764Total carotenoidsMean: 1041Range: 15-3311
Not determined Not determined
35 eggplant genotypes grown in 2 consecutive years.Total vitamin C by titration and presented mg/100g dry weight.
Hanson, 2006
AAMean: 86Range: 56-129
Significant effect of year, but details of individual years not presented
Not determined
69 eggplant genotypes, including varieties of S. melongena Spanish, African and Caribbean
AAS. melongena:Spanish: 1.8 (1.5-2.2)African: 1.3 (1.0-1.8)Caribbean: 2.0
Not determined Not determined
29

Study VarietySeason / Growing conditions
Storage or processing
landraces, commercial hybrids and non-hybrids, experimental hybrids as well as 2 varieties of S. aethiopicum and S. macrocarpon.AA by titration.
Prohens, 2007
Hybrid: 1.7 (1.6-1.9)Non-hybrid: 1.5 (1.0-2.1)Asian: 1.7 (1.3-2.2)Experimental: 1.8 (1.3-2.1)S. aethiopicum:1.7-2.3S. macrocarpon:1.8-2.0
The major carotenoids in corn are lutein and zeaxanthin, which are not vitamin A precursors.
-carotene is also found in corn, with levels ranging from 2-173 g/100 g in a study of inbred
lines, and 7-764 g/100 g dry weight in a study of 44 corn types selected for variation in
kernel colour, lipid and protein contents (Kurilich and Juvik 1999; Chander et al. 2008). As
detailed in Table 1.8.1, boiled, frozen and canned corn has lower levels of carotene and
vitamin C.
AA levels ranged from 56-129 mg/100 g in a study of 35 different eggplants (Hanson et al.
2006); these values are for dry mass and are therefore higher than those reported in food
composition tables (see Table 1.8.1). In another study of 69 different eggplant varieties and
hybrids the AA content ranged from 1-2 mg/100 g (Prohens et al. 2007). Carotene and
vitamin C levels were minimally affected by cooking (Table 1.8.1).
In summary, there is a wide range in carotene and vitamin C levels in tomatoes, and this
variability is further exaggerated by the influence of growing season, location and year. The
effects of storage are variable, with some studies indicating reduced carotene and increased
AA, and others showing the opposite. Other fruiting vegetables also show a large variation in
nutrient composition between cultivars. Processing was associated with large reductions in
vitamin C levels in both tomatoes and capsicums.
30

1.9. Summary of variation in nutrient composition in fruits and vegetables
From the above data, it is evident that the numerical values provided in nutrient composition
tables provide only a general indication of carotene and vitamin C content in fruits and
vegetables. For the majority of fruits and vegetables in this review, the vitamin C values in
food composition tables were within the range reported in published literature. However, both
apple and watermelon had higher vitamin C levels reported in the literature compared to that
in nutrient composition tables. A likely source of this difference may be storage-associated
diminution of vitamin C; in apples as much as 90% of vitamin C may be lost during storage.
Overall, these data emphasise the extensive variation in carotene and vitamin C levels that
occurs between cultivars, and the additional influence of growing conditions, location and
season, as well as postharvest handling and storage on nutrient composition of fruits and
vegetables. These factors have a significant impact on the vitamin content of fruits and
vegetables that are ultimately consumed by the Australian and New Zealand populations.
31

2. ReferencesAbushita AA, Daood HG, Biacs PA (2000) Change in carotenoids and antioxidant vitamins in tomato as a function of varietal and technological factors. J Agr Food Chem 48(6):2075–2081
Agar IT, Streif J, Bangerth F (1997) Effect of high CO2 and controlled atmosphere (CA) on the ascorbic and dehydroascorbic acid content of some berry fruits. Postharvest Biol Tech 11:47–55
Aghdam MS, Motallebiazar A, Mostofi Y, Moghaddam JF, Ghasemnezhad M (2011) Methyl Salicylate Affects the Quality of Hayward Kiwifruits during Storage at Low Temperature. J Agr Sci 3(2):149–156
Akbudak B, Tezcan H, Eris A (2009) Evaluation of messenger plant activator as a preharvest and postharvest treatment of sweet cherry fruit under a controlled atmosphere. Int J Food Sci Nutr 60(5):374–386
Azevedo-Meleiro CH, Rodriguez-Amaya DB (2007) Qualitative and quantitative differences in carotenoid composition among Cucurbita moschata, Cucurbita maxima, and Cucurbita pepo. J Agr Food Chem 55(10):4027–4033
Bermejo A, Cano A (2012) Analysis of Nutritional Constituents in Twenty Citrus Cultivars from the Mediterranean Area at Different Stages of Ripening. Food Nutr Sci 3:639–650
Caprioli I, Lafuente MT, Rodrigo MJ, Mencarelli F (2009) Influence of postharvest treatments on quality, carotenoids, and abscisic acid content of stored "spring belle" peach (prunus persica) fruit. J Agr Food Chem 57(15):7056–7063
Celik A, Ercisli S (2008) Persimmon cv. Hachiya (Diospyros kaki Thunb.) fruit: some physical, chemical and nutritional properties. Int J Food Sci Nutr 59(7-8):599–606
Chander S, Yijiang M, Yirong Z, Jianbing Y, Jiansheng L (2008) Comparison of nutritional traits variability in selected eighty-seven inbreds from Chinese maize (Zea mays L.) germplasm. J Agr Food Chem 56(15):6506–6511
Cuevas HE, Staub JE, Simon PW, Zalapa JE, McCreight JD (2008) Mapping of genetic loci that regulate quantity of beta-carotene in fruit of US Western Shipping melon (Cucumis melo L.). Theor Appl Genet 117(8):1345–1359
Davey MW, Keulemans J (2004) Determining the potential to breed for enhanced antioxidant status in Malus: mean inter- and intravarietal fruit vitamin C and glutathione contents at harvest and their evolution during storage. J Agr Food Chem 52(26):8031–8038
Davey MW, Stals E, Ngoh-Newilah G+, Tomekpe K, Lusty C, Markham R, Swennen R, Keulemans J (2007) Sampling strategies and variability in fruit pulp micronutrient contents of west and central african bananas and plantains (Musa species). J Agr Food Chem 55(7):2633–2644
Dewanto V, Xianzhong W, Adom KK, Rui HL (2002) Thermal processing enhances the nutritional value of tomatoes by increasing total antioxidant activity. J Agr Food Chem 50(10):3010–3014
Dhuique-Mayer C, Fanciullino AL, Dubois C, Ollitrault P (2009) Effect of genotype and environment on citrus juice carotenoid content. J Agr Food Chem 57(19):9160–9168
32

Dhuique-Mayer C, Caris-Veyrat C, Ollitrault P, Curk F, Amiot MJ (2005) Varietal and interspecific influence on micronutrient contents in citrus from the Mediterranean area. J Agr Food Chem 53(6):2140–2145
Di Vaio C, Graziani G, Marra L, Cascone A, Ritieni A (2008) Antioxidant capacities, carotenoids and polyphenols evaluation of fresh and refrigerated peach and nectarine cultivars from Italy. Eur Food Res Technol 227:1225–1231
Englberger L, Darnton-Hill I, Coyne T, Fitzgerald MH, Marks GC (2003) Carotenoid-rich bananas: a potential food source for alleviating vitamin A deficiency. Food Nutr Bulletin 24(4):303–318
Erge HS, Karadeniz F (2011) Bioactive compounds and antioxidant activity of tomato cultivars. Int J Food Prop 14:968–977
Erkan M, Pekmezci M, Wang CY (2005) Hot water and curing treatments reduce chilling injury and maintain post-harvest quality of 'Valencia' oranges. Int J Food Sci Tech 40:91–96
Fanciullino AL, Cercós, nuel, Dhique, yer, Froelic, r Y, Talón, n, l, Ollitrault P, Morillon R (2008) Changes in carotenoid content and biosynthetic gene expression in juice sacs of four orange varieties (Citrus sinensis) differing in flesh fruit color. J Agr Food Chem 56(10):3628–3638
Flores FB, Sanchez-Bel P, Valdenegro M, Romojaro F, Martinez C, Egea MI (2008) Effects of a pretreatment with nitric oxide on peach (Prunus persica L.) storage at room temperature. Eur Food Res Tech 227:1599–1611
Franck C, Baetens M, Lammertyn J, Verboven P, Davey MW, Nicola+» BM (2003) Ascorbic acid concentration in Cv. conference pears during fruit development and postharvest storage. J Agr Food Chem 51(16):4757–4763
Gahler S, Otto K, Boehm V (2003) Alterations of vitamin C, total phenolics, and antioxidant capacity as affected by processing tomatoes to different products. J Agr Food Chem 51(27):7962–7968
Gil MI, Tomás-Barberán FA, Hess-Pierce B, Kader AA (2002) Antioxidant capacities, phenolic compounds, carotenoids, and vitamin C contents of nectarine, peach, and plum cultivars from California. J Agr Food Chem 50(17):4976–4982
Girard B, Kopp TG (1998) Physicochemical Characteristics of Selected Sweet Cherry Cultivars. J Agr Food Chem 46(2):471–476
González-Molina E, Moreno DA, García-Viguera C (2008) Genotype and harvest time influence the phytochemical quality of Fino lemon juice (Citrus limon (L.) Burm. F.) for industrial use. J Agr Food Chem 56(5):1669–1675
Gull J, Sultana B, Anwar F, Naseer R, Ashraf M, Ashrafuzzaman M (2012) Variation in antioxidant attributes at three ripening stages of guava (Psidium guajava L.) fruit from different geographical regions of Pakistan. Molecules (Basel, Switzerland) 17(3):3165–3180
Hanson PM, Yang R, Tsou SCS, Ledesma D, Engle L, Lee T (2006) Diversity in eggplant (Solanum melongena) for superoxide scavenging activity, total phenolics, and ascorbic acid. J Food Compos Anal 19:594–600
Hegedüs A, Engel R, Abrankó L, Balogh E, Blázovics A, Hermán R, Halász J, Ercisli S, Pedryc A, Stefanovits-Bányai É (2010) Antioxidant and antiradical capacities in apricot
33

(Prunus armeniaca L.) fruits: variations from genotypes, years, and analytical methods. J Food Sci 75(9):C722–C730
Howard LR, Talcott ST, Brenes CH, Villalon B (2000) Changes in phytochemical and antioxidant activity of selected pepper cultivars (Capsicum species) as influenced by maturity. J Agr Food Chem 48(5):1713–1720
Josuttis M, carlen C, Crespo P, Nestby R, Toldam-Andersen TB, Dietrich H, Krüger E (2012) A comparison of bioactive compounds of strawberry fruit from Europe affected by genotype and latitude. J Berry Res 2:73–95
Kalt W, Forney CF, Martin A, Prior RL (1999) Antioxidant capacity, vitamin C, phenolics, and anthocyanins after fresh storage of small fruits. J Agr Food Chem 47(11):4638–4644
Kevers C, Pincemail J, Tabart J, Defraigne JO, Dommes J (2011) Influence of cultivar, harvest time, storage conditions, and peeling on the antioxidant capacity and phenolic and ascorbic acid contents of apples and pears. J Agr Food Chem 59(11):6165–6171
Khan AS, Singh Z, Swinny EE (2009) Postharvest application of 1-Methylcyclopropene modulates fruit ripening, storage life and quality of 'Tegan Blue' Japanese plum kept in ambient and cold storage. Int J Food Sci Tech 44:1272–1280
Khan AS, Ahmad N, Malik AU, Amjad M (2012) Cold Storage Influences the Postharvest Pericarp Browning and Quality of Litchi. Int J Agr Biol 14:389–394
Kolayli S, Kara M, Tezcan F, Erim FB, Sahin H, Ulusoy E, Aliyazicioglu R (2010) Comparative study of chemical and biochemical properties of different melon cultivars: standard, hybrid, and grafted melons. J Agr Food Chem 58(17):9764–9769
Krüger E, Dietrich H, Schöpplein E, Rasim S, Kürbel P (2011) Cultivar, storage conditions and ripening effects on physical and chemical qualities of red raspberry fruit. Postharvest Biol Tech 60:31–37
Kurilich A, Juvik J (1999) Simultaneous quantification of carotenoids and tocopherols in corn kernal extracts by HPLC. J Liq Chromatogr R T 22(19):2925
Ladaniya MS, Singh SP, Wadhawan AK (2003) Response of 'Nagpur' mandarin, 'Mosambi' sweet orange and 'Kagzi' acid lime to gamma radiation. Radiat Phys Chem 67:665–675
Lata B (2007) Relationship between apple peel and the whole fruit antioxidant content: year and cultivar variation. J Agr Food Chem 55(3):663–671
Leccese A, Bureau S, Reich M, Renard MG, Audergon JM, Mennone C, Bartolini S, Viti R (2010) Pomological and nutraceutical properties in apricot fruit: cultivation systems and cold storage fruit management. Plant Foods Hum Nutr 65(2):112–120
Lester GE, Crosby KM (2002) Ascorbic acid, folic acid, and potassium content in postharvest green-flesh honeydew muskmelons: influence of cultivar, fruit size, soil type and year. J Am Soc Hort Sci 127(5):843–847
Li M, Ma F, Shang P, Zhang M, Hou C, Liang D (2009) Influence of light on ascorbate formation and metabolism in apple fruits. Planta 230(1):39–51
Lu QY, Zhang Y, Wang Y, Wang D, Lee Rp, Gao K, Byrns R, Heber D (2009) California Hass avocado: profiling of carotenoids, tocopherol, fatty acid, and fat content during maturation and from different growing areas. J Agr Food Chem 57(21):10408–10413
34

Mahajan PV, Goswami TK (2004) Extended storage of litchi fruit using controlled atmosphere and low temperature. J Food Process Pres 28:388–403
Manthey JA, Perkins-Veazie P (2009) Influences of harvest date and location on the levels of beta-carotene, ascorbic acid, total phenols, the in vitro antioxidant capacity, and phenolic profiles of five commercial varieties of mango (Mangifera indica L.). J Agr Food Chem 57(22):10825–10830
Marín A, Ferreres F, Tomás-Barberán FA, Gil MI (2004) Characterization and quantitation of antioxidant constituents of sweet pepper (Capsicum annuum L.). J Agr Food Chem 52(12):3861–3869
Martínez S, López M, González-Raurich M, Bernardo Alvarez A (2005) The effects of ripening stage and processing systems on vitamin C content in sweet peppers (Capsicum annuum L.). Int J Food Sci Nutr 56(1):45–51
Mawamba D, Gouado I, Leng M, Touridomon IS, Mbiapo FT (2009) Steamed-Dried Squashes (Cucurbita sp.) Can Contribute to Alleviate Vitamin A Deficiency. Am J Food Tech 4(4):170–176
Milella L, Caruso M, Galgano F, Favati F, Padula MC, Martelli G (2011) Role of the cultivar in choosing Clementine fruits with a high level of health-promoting compounds. J Agr Food Chem 59(10):5293–5298
Molyneux S, Lister C, Savage G (2004) An investigation of the antioxidant properties and colour of glasshouse grown tomatoes. Int J Food Sci Nutr 55(7):537–545
Montero-Calderón M, Rojas-Graü MA, Martín-Belloso O (2010) Mechanical and chemical properties of Gold cultivar pineapple flesh (Ananas comosus). Eur Food Res Technol 230:675–686
Mullen W, Stewart AJ, Lean MEJ, Gardner P, Duthie GG, Crozier A (2002) Effect of freezing and storage on the phenolics, ellagitannins, flavonoids, and antioxidant capacity of red raspberries. J Agr Food Chem 50(18):5197–5201
Nishiyama I, Yamashita Y, Yamanaka M, Shimohashi A, Fukuda T, Oota T (2004) Varietal difference in vitamin C content in the fruit of kiwifruit and other actinidia species. J Agr Food Chem 52(17):5472–5475
Oliveira C, Ferreira AC, Costa P, Guerra J, Guedes De Pinho P (2004) Effect of some viticultural parameters on the grape carotenoid profile. J Agr Food Chem 52(13):4178–4184
Oliveira DDS, Lobato AL, Ribeiro SMR, Santana ÂMC, Chaves JBP, Pinheiro-Sant'Ana HM (2010) Carotenoids and Vitamin C during Handling and Distribution of Guava (Psidium guajava L.), Mango (Mangifera indica L.), and Papaya (Carica papaya L.) at Commercial Restaurants. J Agr Food Chem 58(10):6166–6172
Periago M-J, Garcia-Alonso J, Jacob K, Olivares AB, Bernal MJ, Iniesta MD, Martinez C, Ros G (2009) Bioactive compounds, folates and antioxidant properties of tomatoes (Lycopersicum esculentum) during vine ripening. Int J Food Sci Nutr 60(8):694–708
Perkins-Veazie P, Collins JK, Davis AR, Roberts W (2006) Carotenoid content of 50 watermelon cultivars. J Agr Food Chem 54(7):2593–2597
35

Pincemail J, Kevers C, Tabart J, Defraigne JO, Dommes J (2012) Cultivars, culture conditions, and harvest time influence phenolic and ascorbic acid contents and antioxidant capacity of strawberry (Fragaria x ananassa). J Food Sci 77(2):C205–C210
Pirogovskaia T, Kempler C, Kitts DD, Lund ST (2012) Phenotypic diversity in antioxidant phytochemical composition among fruits from several genotypes of red raspberry (Rubus idaeus L.). J Berry Res 2:229–238
Prohens J, Rodriguez-Burruezo A, Raigon MD, Nuez F (2007) Total phenolic concentration and browning susceptibility in a collection of different varietal types and hybrids of eggplant: implications for breeding for higher nutritional quality and reduced browning. J Am Soc Hort Sci 132(5):638–646
Raffo A, La Malfa G, Fogliano V, Maiani G, Quaglia G (2012) Seasonal variations in antioxidant components of cherry tomatoes (Lycopersicon esculentum cv. Naomi F1). J Food Compos Anal 19:11–19
Raffo A, Leonardi C, Fogliano V, Ambrosino P, Salucci M, Gennaro L, Bugianesi R, Giuffrida F, Quaglia G (2002) Nutritional value of cherry tomatoes (Lycopersicon esculentum Cv. Naomi F1) harvested at different ripening stages. J Agr Food Chem 50(22):6550–6556
Ramsaroop RES, Saulo AA (2007) Comparative consumer and physiochemical analysis of Del Monte Hawaii Gold and Smooth Cayenne pineapple cultivars. J Food Quality 30(2):135–159
Robles-Sánchez RM, Islas-Osuna MA, Astiazarán-García H, Vázquez-Ortiz FA, Martín-Belloso O, Gorinstein S, González-Aguilar GA (2009) Quality index, consumer acceptability, bioactive compounds, and antioxidant activity of fresh-cut "ataulfo" mangoes (mangifera indica L.) as affected by low-temperature storage. J Food Sci74(3):S126–S134
Roselló S, Adalid AM, Cebolla-Cornejo J, Nuez F (2011) Evaluation of the genotype, environment and their interaction on carotenoid and ascorbic acid accumulation in tomato germplasm. J Sci Food Agr 91(6):1014–1021
Ruiz D, Egea J, Tomas-Barberan FA, Gil MI (2005) Carotenoids from new apricot (Prunus armeniaca L.) varieties and their relationship with flesh and skin color. J Agr Food Chem 53(16):6368–6374
Shin Y, Ryu JA, Liu RH, Nock JF, Polar-Cabrera K, Watkins CB (2008) Fruit quality, antioxidant contents and activity, and antiproliferative activity of strawberry fruit stored in elevated CO2 atmospheres. J Food Sci 73(6):S339–S344
Silva FJP, Gomes MH, Fidalgo F, Rodrigues JA, Almeida DPF (2010) Antioxidant properties and fruit quality during long-term storage of "Rocha" pear: effects of maturity and storage conditions. J Food Quality 33:1–20
Stadlmayr B, Nilsson E, Mouille B, Medhammar E, Burlingame B, Charrondiere U (2011) Nutrition indicator for biodiversity on food composition-A report on the progress of data availability. J Food Compos Anal 24(4-5):692–698
Thomas RH, Woods FM, Dozier WA, Ebel RC, Nesbitt M, Wilkins B, Himelrick DG (2005) Cultivar Variation in Physicochemical and Antioxidant Activity of Alabama-Grown Blackberries . Small Fruits Rev 4(2):57–71
Tian S, Jiang A, Xu Y, Wang Y (2004) Responses of physiology and quality of sweet cherry fruit to different atmospheres in storage. Food Chemistry 87:43–49
36
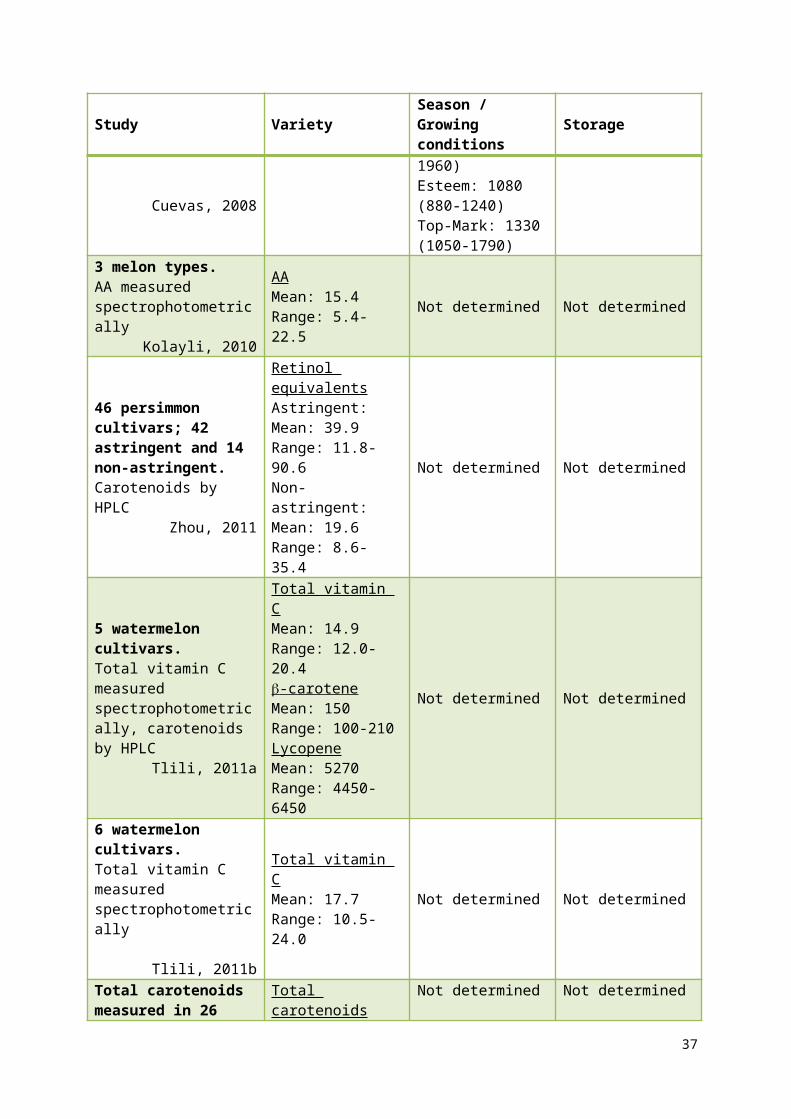
Tlili I, Hdider C, Lenucci MS, Ilahy R, Jebari H, Dalessandro G (2011a) Bioactive compounds and antioxidant activities during fruit ripening of watermelon cultivars. J Food Compos Anal 24(7):923–928
Tlili I, Hdider C, Lenucci MS, Riadh I, Jebari H, Dalessandro G (2011b) Bioactive compounds and antioxidant activities of different watermelon (Citrullus lanatus (Thunb.) Mansfeld) cultivars as affected by fruit sampling area. J Food Compos Anal 24(3):307–314
Tosun M, Ercisli S, Karlidag H, Sengul M (2009) Characterization of red raspberry (Rubus idaeus L.) genotypes for their physicochemical properties. J Food Sci 74(7):C575–C579
Tulipani S, Mezzetti B, Capocasa F, Bompadre S, Beekwilder J, de Vos CHR, Capanoglu E, Bovy A, Battino M (2008) Antioxidants, phenolic compounds, and nutritional quality of different strawberry genotypes. J Agr Food Chem 56(3):696–704
Vinha AF, Barreira SVP, Castro A, Costa A, Oliveira MBPP (2013) Influence of the Storage Conditions on the Physicochemical Properties, Antioxidant Activity and Microbial Flora of Different Tomato (Lycopersicon esculentum L.) Cultivars. J Agr Sci 5(2):118–128
Vrhovsek U, Rigo A, Tonon D, Mattivi F (2004) Quantitation of polyphenols in different apple varieties. J Agr Food Chem 52(21):6532–6538
Wall MM (2006a) Ascorbic acid, vitamin A, and mineral composition of banana (Musa sp.) and papaya (Carica papaya) cultivars grown in Hawaii. J Food Compos Anal 19(5):434–445
Wall MM (2006b) Ascorbic acid and mineral composition of longan (Dimocarpus longan), lychee (Litchi chinensis) and rambutan (Nephelium lappaceum) cultivars grown in Hawaii. J Food Compos Anal 19(6--7):655–663
World Health Organization (1994) Safety and nutritional adequacy of irradiated food. Geneva
Zhou C, Zhao D, Sheng Y, Tao J, Yang Y (2011) Carotenoids in fruits of different persimmon cultivars. Molecules 16(1):624–636
37
Recommended


