0
Date: 08-05-2018 MktYard.com Weekly Commodity Market Monitor
HOME
• Cotton • Sugar • Soyben • RM Seed • Castor seed • Turmeric • Jeera
NCoMM
NCML COMMODITY MARKET MONITOR
Cotton | Sugar | Soybean | RM Seed | Castor seed | Turmeric | Jeera
OUTLOOK
OTHER DATA Sowing progress | Advance estimates | Kharif and rabi MSP
ANSWERS & LUCKY WINNER OF PREVIOUS WEEK’S MktYard.com Weekly Commodity Market Monitor
Sugar • Tur • Wheat • Maize • Chana • Paddy/Rice • Guar seed

0
Date: 08-05-2018 MktYard.com Weekly Commodity Market Monitor
• The Indian sugar industry is currently going through a crisis due to high
domestic production coupled with fall in sugar prices internationally.
• India’s sugar production amounted to a record 31.03 mn tonnes till April 30.
With 130 sugar mills still operating, majorly in Uttar Pradesh, the sugar
production during the current season might end up touching 32 mn tonnes
in the current season (Oct-Sep) as per ISMA. This is a substantial increase
from last year’s 20.3 mn tonnes produced.
• Till April 30, Sugar mills in Maharashtra produced 10.65 mn tonnes and
barring 15 mills all others in the state had ended their operations. UP mills
produced 11.2 mn tonnes of sugar till and 80 out of 119 sugar mills are
continuing their crushing. Some of these mills are closing fast, whereas few
are expected to continue crushing till the second week of May 2018. In
Karnataka, all the sugar mills have stopped their operations and they
produced 3.63 mn tonnes during the current season.
• On May 2, the government today approved a subsidy of Rs 5.5 per quintal to
cane farmers for the produce they sell to sugar mills to help millers clear
cane arrears that have surged to about Rs 20,000 crore due to sharp fall in
ex-mill sugar prices.
• ISMA has said sugar prices have been under severe pressure in the last 4-5
months. Compared to the cost of production, the ex-mill sugar prices are
around Rs 8/kg lower & sugar mills are incurring substantial losses.
• India had abolished a surcharge on sugar, or cess, after the introduction of
the nationwide GST last year, but the central government has proposed
reintroducing 5% sugar cess in view of current glut.
• The government had last month mandated a MIEQ (Minimum Indicative
Export Quota) of 2 mn tonnes sugar exports to move surplus stocks out of
country but India is not able to export sugar due to export disparity as a
result of depressed world sugar prices on global sugar surplus.
• The government had earlier doubled import duty on sugar to 100%, scrapped
the 20% export duty on sugar and placed stockholding limits on sugar mills
but could not counteract the trend of falling prices.
• The world’s sugar traders are experiencing the biggest ever global surplus.
The Green Pool Commodity Specialists expect the glut to reach 18.4 mn
tonnes this season.
• Excess supplies forecast for next season will also be bigger than previously
expected, and that could drive further declines in the price of sugar, which is
trading near the lowest since 2015.
• Sugar mills in Brazil’s Centre/South crushed 22.214 mn tonnes of cane in the
first half of April, up from 17.681 mn in the same period a year ago.
Thailand’s sugar production seen at 14.6 million tons this season, 100,000
tonnes higher than a previous forecast.
Mandi Price in Rs/ Quintal
07-05-2018 30-05-2018
%Change
Kohlapur 2703.35 2713.75 -0.38
Muzzafar -nagar
2702 2716.55 -0.54
Delhi 2757.85 2792 -1.22
2,100
2,400
2,700
3,000
3,300
3,600
3,900
Jan
-14
Jul-1
4
Jan
-15
Jun
-15
De
c-15
Jun
-16
No
v-16
May
-17
No
v-17
Ap
r-18
Sugar - M-grade : Muzaffarnagar
FUNDAMENTAL SUMMARY
Price Drivers Impact
Record domestic sugar production to touch 32 mn tonnes against only 20.3 mn tonnes last year
Bearish
Subsidy of Rs 5.5 per qtl to cane farmers for the produce they sell to sugar mills by the government
Bullish
Proposal for imposition of 5% sugar cess Bullish
Ongoing wedding and summer season demand
Bullish
MIEQ (Minimum Indicative Export Quota) of 2 mn tonnes mandated by government
Bullish
Export disparity due to low global sugar prices
Bearish
Scrapping off the 20% export duty on sugar by the government
Bullish
Doubling of import duty from 50% to 100%
Bullish
Based on Primary & Secondary Sources
Fundamental Report SUGAR
STATE-WISE SUGAR PRODUCTION (LAKH TONNES)
STATE 2014-15 2015-16 2016-17 2017-18*
Uttar Pradesh 71.02 68.41 87.78 115.00
Maharashtra 105.07 84.24 42.38 107.00
Karntaka 49.35 40.49 21.44 36.50
Gujarat 11.54 11.68 8.85 11.00
Punjab 5.37 6.71 6.61 8.25
Andhra Pradesh# 8.86 8.28 5.01 8.00
Harayana 5.76 5.39 6.68 7.25
Bihar 5.26 5.03 5.26 7.00
Tamil Nadu 12.18 13.62 10.62 6.00
Madhya Pradesh 3.86 3.41 3.43 5.50
Uttarakhand 3.24 2.73 3.45 4.50
Others 1.62 1.26 1.11 1.00
All India 283.13 251.25 202.62 317.00 *Projected, #Includes Telangana, Source-Indian Express

0
Date: 08-05-2018 MktYard.com Weekly Commodity Market Monitor
Fundamental Report TUR
• The notification issued by the Directorate General of Foreign Trade
(DGFT) on May 4 2018 specifically mentions that the ban imposed on
urad and moong dal in August 2017 has been extended.
• The Government had fixed a cap on imports of pulses like tur, urad and
moong up to 3 lakh tonnes in Aug 2017. In the recent notification, the
Government has not only continued the 3 lakh tonne cap for pulses, but
also included the processed dals imported by the traders. Earlier,
processed dals were not included in the allowed quota.
• Although no notification has been received for tur so far, we are
expecting a similar extension for tur too.
• As per the second advance estimates released by the government, tur
production 2017-18 is pegged at 4.02 mn tonnes, down 17.45% from 4.87
mn tonnes in 2016-18. The area under tur this year declined to 43.5 lakh
hectares, from 53.2 lakh hectares last year.
• Despite lower production, Tur prices continue to be in a glut due to
higher supplies and large previous year’s stocks.
• Demand for Tur and Tur dal too has not been not up to the mark,
however the wedding season may lift the demand a bit.
• The Centre has granted extension to the Maharashtra government for
procurement of tur (arhar) under at MSP up to May 15 instead of the
earlier deadline of 18 April. Private buying remains restricted as govt.
agencies remained active to procure at MSP.
• Until April 18, the government procured 25.45 lakh quintals from the key
producing regions of Maharashtra and met nearly 65% of its target
which has been set at 44.67 lakh quintals from February 1. Tur
procurement was stopped in some parts of the state because of lack of
storage space due to previous year’s stock.
• Over 95% of 67.34 lakh quintals of tur procured last year by Maharashtra
government is yet to be processed to make dal out of it, which may lead
to losses to the tune of Rs 1,000 crore.
• The average trading price of tur in most of the markets in the state was
around Rs 4,250/qtl, below the MSP of Rs 5,400/qtl.
• Record purchases of tur by the government agencies in Karnataka,
whichended last month too did not reverse the bearish price trend. In
Gulbarga market Tur is being traded at Rs 3750 to Rs 4350 per qtl.
• Quotes for Myanmar pulses have decreased further diminishing export
possibility in India in the first half of the year despite removal of export
ban on pulses by India. Myanmar is offering Tur at $300 per tonne, basis
Indian port, down by almost $30 per tonne in last two weeks.
• Lower realization from the crop this year is likely to encourage farmers
to shift tur area to other lucrative crops like groundnut, chilli, turmeric &
others. Tur area may decline by 15 to 20% in India in 2018-19.
2500
6500
10500
14500
Jun
-15
Oct
-15
Feb
-16
May
-16
Se
p-1
6
Jan
-17
May
-17
Se
p-1
7
Jan
-18
Ap
r-18
Lemon tur FAQ-Myanmar origin : Mumbai
TUR FUNDAMENTAL SUMMARY
Price Drivers Impact
Huge pile up of previous year’s stocks
Bearish
Restricted private buying Bearish
Expected notification on import restriction
Bullish
Export disparity Bearish
Lower 2017-18 production estimate
Bullish
Government extending procurement in Maharashtra
Bearish
Fall in tur acreage expected in 2018-19
Bullish
Based on Primary & Secondary Sources
Mandi Price in Rs/ Quintal
07-05-2018 30-04-2018 %Change
Yavatmal 3975 3475 14.39
Amravati 3850 3756 2.50
Akola 3910 3725 4.97
• The harvested tur has a shelf life of 6
months to 1 year without being
processed.
• 95% of tur procured before June 2017
by Maharashtra government is lying
unprocessed.
• The state had procured tur at Rs 5,050
/qtl, but today the market value of tur
is not more than Rs 3,200/qtl.
• The total cost of the procurement was
Rs 3,341.32 crore.

0
Date: 08-05-2018 MktYard.com Weekly Commodity Market Monitor
Fundamental Report WHEAT
• Recent unseasonal rains and hailstorm in many parts of north
India may slow down the wheat procurement as it has wet the
grains lying on the ground. The farmers will now have to wait to
dry the crop before selling it to the government. Moreover,
standing wheat crop, which was late sown is reported damaged
in many parts of Uttar Pradesh.
• According the latest report of Food Corporation of India (FCI), as
on 04th May 2018, wheat procurement has reached 287.78 lakh
metric tonnes. Of the total quantity procured, around 119.37 lakh
tonnes have been procured from Punjab, 8.63 lakh tonnes from
Haryana, 21.83 lakh tonnes from Uttar Pradesh, 52.71 lakh tonnes
have been procured from Madhya Pradesh, 10.39 in Rajasthan,
0.41 lakh tonnes from Uttarakhand, 0.14 lakh tonnes from
Chandigarh and 0.30 lakh tonnes from Gujarat. In Rabi marketing
season 2018-19 government has set procurement target of 32
million MT.
• Buoyed by the forecast of a normal monsoon this year, the
agriculture ministry has targeted 100 million tonnes of wheat
production in 2018-19. In 2017-18 production of wheat is
estimated at 97.11 million tonnes, according to the second
advance estimates released by the ministry in February.
However, most trade sources are currently estimating the crop
in the range of 91-94 million MT for 2017-18.
• According to APEDA, India wheat export is reported at 2.29 lakh
MT for 2017-18 which is 12.59 percent lower than the export of
2.62 lakh MT for 2016-17. Export demand of Indian wheat is lower
due to price disparity with other exporting countries.
• According to latest monthly report of IGC, world wheat
production is projected at 739 million MT for 2018-19 against 758
million tonnes forecast for 2017-18, while the ending stocks are
projected lower at 257 million tonnes against 263 million tonnes
last year.
1500
1700
1900
2100
2300
2500
Mar
-16
Jun
-16
Se
p-1
6
De
c-16
Mar
-17
Jul-1
7
Oct
-17
Jan
-18
Ap
r-18
Wheat: Standard mill quality : Delhi
FUNDAMENTAL SUMMARY
Price Drivers Impact
Slow procurement activities Bearish
Higher production estimate for 2018-19
Bearish
Lower wheat exports Bearish
Lower world wheat production Bullish
Based on Primary & Secondary Sources
Mandi Price in Rs/ Quintal
07-05-2018 30-04-2018 %Change
Delhi 1756.25 1730.8 1.47
Indore 1766.95 1754.7 0.70
Kanpur 1642.5 1647.5 -0.30
0
Date: 08-05-2018 MktYard.com Weekly Commodity Market Monitor
Fundamental Report CHANA
• The All-India Dal Mills Association has demanded a ban on futures
trading in chana due to falling prices in the domestic market.
According to them, big cartel is running the market causing impractical
price movement which is hampering the interests of small
businessmen and farmers.
• Moreover, All-India Dal Mills Association are also demanding
immediate ban on imports of chana to support the domestic prices. At
present, the import duty on chana is 60 per cent.
• As of 07th May, imported Australian chana is being traded at Rs 3500
per quintal in Mumbai market and Rs 3525 per quintal at Mundra port.
• According to the market participants, export incentive on chana
should be increased to 10-15 percent and 25 lakh MT of chana should
be exported to support the falling prices of Chana. At present the
export incentive to chana is 7 per cent under the Merchandise Export
from India Scheme (MEIS) for a period of three months till June 20,
2018.
• To ease the process of export of chana, DGFT has removed mandatory
roasted chana/ chana dal export in consumer pack of one kg. Now it
can be shipped in bulk.
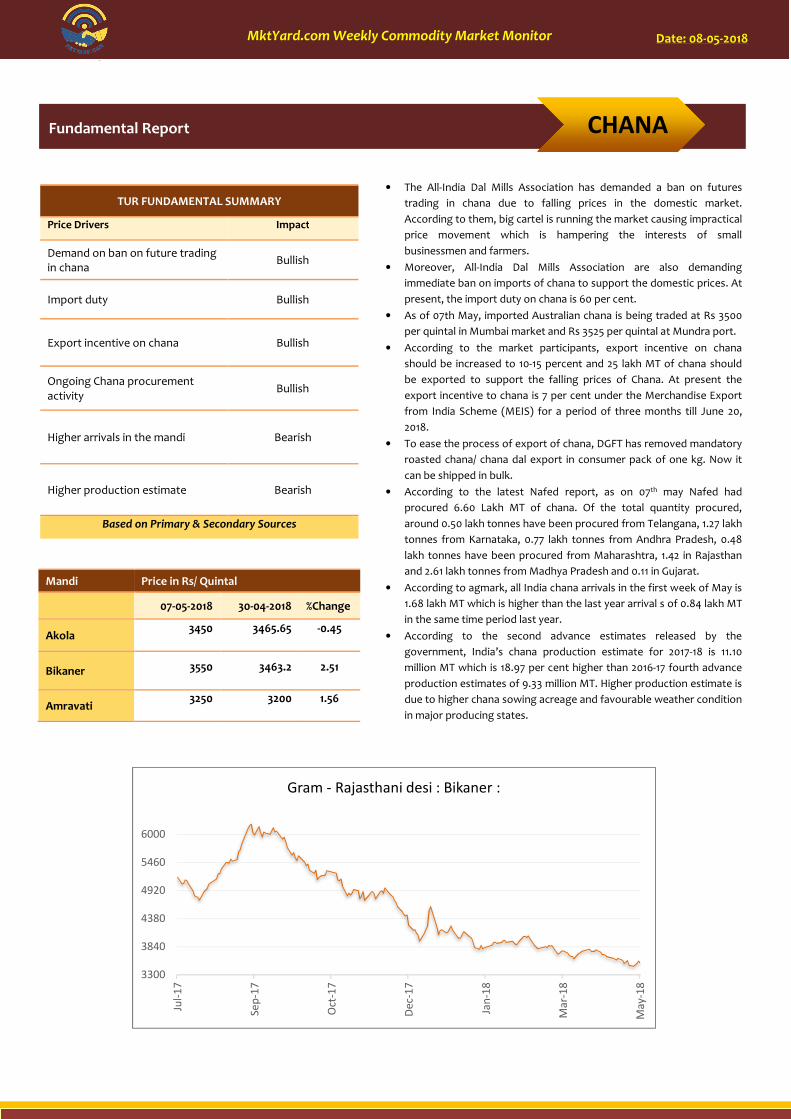
• According to the latest Nafed report, as on 07th may Nafed had
procured 6.60 Lakh MT of chana. Of the total quantity procured,
around 0.50 lakh tonnes have been procured from Telangana, 1.27 lakh
tonnes from Karnataka, 0.77 lakh tonnes from Andhra Pradesh, 0.48
lakh tonnes have been procured from Maharashtra, 1.42 in Rajasthan
and 2.61 lakh tonnes from Madhya Pradesh and 0.11 in Gujarat.
• According to agmark, all India chana arrivals in the first week of May is
1.68 lakh MT which is higher than the last year arrival s of 0.84 lakh MT
in the same time period last year.
• According to the second advance estimates released by the
government, India’s chana production estimate for 2017-18 is 11.10
million MT which is 18.97 per cent higher than 2016-17 fourth advance
production estimates of 9.33 million MT. Higher production estimate is
due to higher chana sowing acreage and favourable weather condition
in major producing states.
3300
3840
4380
4920
5460
6000
Jul-
17
Se
p-1
7
Oct
-17
De
c-1
7
Jan
-18
Ma
r-1
8
Ma
y-1
8
Gram - Rajasthani desi : Bikaner :
TUR FUNDAMENTAL SUMMARY
Price Drivers Impact
Demand on ban on future trading in chana
Bullish
Import duty Bullish
Export incentive on chana Bullish
Ongoing Chana procurement activity
Bullish
Higher arrivals in the mandi Bearish
Higher production estimate Bearish
Based on Primary & Secondary Sources
Mandi Price in Rs/ Quintal
07-05-2018 30-04-2018 %Change
Akola 3450 3465.65 -0.45
Bikaner 3550 3463.2 2.51
Amravati 3250 3200 1.56
0
Date: 08-05-2018 MktYard.com Weekly Commodity Market Monitor
Fundamental Report MAIZE
Mandi Price in Rs/ Quintal
07-05-2018 30-04-2018 %Change
Erode 1375 1365.45 0.70
Gulab bagh 1166.9 1203.9 -3.07
Nizamabad 1240 1260 -1.59
FUNDAMENTAL SUMMARY
Price Drivers Impact
Higher Production estimates Bearish
Higher arrivals Bearish
Higher rabi area estimates Bearish
Lower world corn stocks for
the previous year (2017-18) Bullish
Expected Imports coming in Bearish
Based on Primary & Secondary Sources
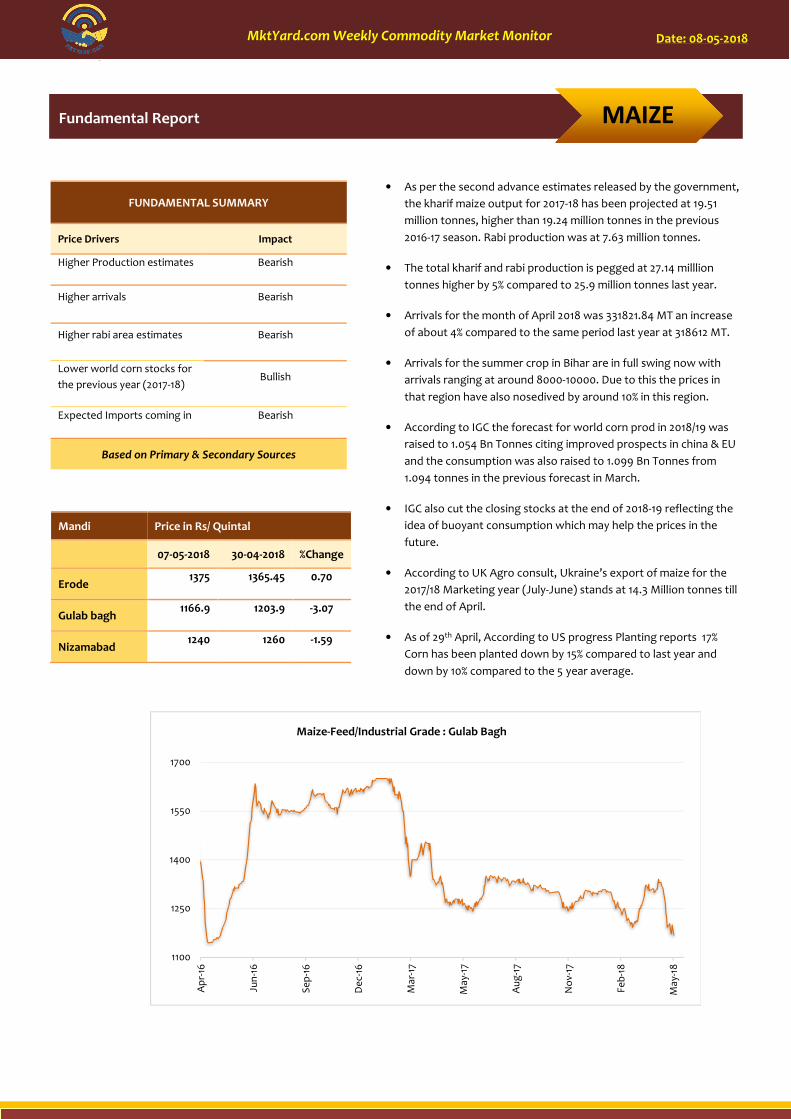
• As per the second advance estimates released by the government,
the kharif maize output for 2017-18 has been projected at 19.51
million tonnes, higher than 19.24 million tonnes in the previous
2016-17 season. Rabi production was at 7.63 million tonnes.
• The total kharif and rabi production is pegged at 27.14 milllion
tonnes higher by 5% compared to 25.9 million tonnes last year.
• Arrivals for the month of April 2018 was 331821.84 MT an increase
of about 4% compared to the same period last year at 318612 MT.
• Arrivals for the summer crop in Bihar are in full swing now with
arrivals ranging at around 8000-10000. Due to this the prices in
that region have also nosedived by around 10% in this region.
• According to IGC the forecast for world corn prod in 2018/19 was
raised to 1.054 Bn Tonnes citing improved prospects in china & EU
and the consumption was also raised to 1.099 Bn Tonnes from
1.094 tonnes in the previous forecast in March.
• IGC also cut the closing stocks at the end of 2018-19 reflecting the
idea of buoyant consumption which may help the prices in the
future.
• According to UK Agro consult, Ukraine’s export of maize for the
2017/18 Marketing year (July-June) stands at 14.3 Million tonnes till
the end of April.
• As of 29th April, According to US progress Planting reports 17%
Corn has been planted down by 15% compared to last year and
down by 10% compared to the 5 year average.
1100
1250
1400
1550
1700
Ap
r-16
Jun
-16
Se
p-1
6
De
c-16
Mar
-17
May
-17
Au
g-1
7
No
v-17
Feb
-18
May
-18
Maize-Feed/Industrial Grade : Gulab Bagh

0
Date: 08-05-2018 MktYard.com Weekly Commodity Market Monitor
Fundamental Report RICE/PADDY
• According to the latest available data as on 26th April, Rice
procurement by FCI and its state agencies stood at 321.62 lakh tonnes
as compared to 336.09 lakh tonnes last year same period. The target
procurement in 2017-18 (Oct-Sept) is 430 lakh tonnes.
• Punjab showed an increase of 118.33 lakh tonnes over last year 110.52
lakh tonnes, Haryana Rice procurement was 39.67 lakh tonnes
compared to 35.70 lakh tonnes and in Andhra Pradesh procurement
stood at 30.15 lakh tonnes as against 29.59 lakh tonnes last year.
• Chhattisgarh procured around 32.07 lakh tonnes. Madhya Pradesh and Odisha procurement has reached 10.96 and 25.16 lakh tonnes respectively. Procurement in West Bengal and other rice growing states is still underway and reached to 0.35 lakh tons.
• Rice procurement declined in states like Chhattisgarh, Bihar, Madhya
Pradesh, Maharashtra, Odisha and West Bengal over last year.
• Rice stock at the central pool as on 01st April 2018 stood at 248.73 lakh
tonnes as against 230.81 lakh tonnes last year same period.
• As per the Second Advance Estimates for 2017-18 the total Rice
production for 2017-18 estimated to increase at 111.01 million tonnes as
against 109.70 million tonnes. Kharif Rice output estimated at 96.48
million tonnes as against 96.30 million tonnes in 2016-17. Rabi season
Rice production for 2017-18 is estimated at 14.53 million tonnes as
compared to 13.40 million tonnes in 2016-17.
• The IGC forecasted Rice production in 2018-19 at 493 million tonnes, up
from 492 million tonnes in March and up from 486 million tonnes in
2017-18. Rice consumption also is forecast higher, at 493 million
tonnes, which compares with 491 million tonnes in March and 487
million tonnes in 2017-18.
• As per trade sources, total rice export in the month of March was 13.03
lakh tonnes, in which basmati rice contribution is 33.05 per cent of
total with quantity of 4.30 lakh tonnes and non-basmati contribution
was 66.94 per cent with quantity of 8.72 lakh tonnes.
• Iran would continue to import Rice until 22nd July and there will be no
changes in the customs tariffs on the imports of the product due to
current water crisis in the country. Iran normally allows imports of rice
in late September when the local farmers have concluded cultivating
the cereal grain and again limits the imports in late July.
Mandi Price in Rs/ Quintal
07-05-2018 27-04-2018 %Change
Hanumangarh (1121 Pusa)
3300 3300 0.00
Muzaffarnagar(common)
2700 2665 1.31
Aligarh (1121) 3000 3200 -6.25
1600
2000
2400
2800
3200
3600
Jul-1
5
Se
p-1
5
No
v-15
Jan
-16
Mar
-16
May
-16
Jul-1
6
Se
p-1
6
No
v-16
Jan
-17
Mar
-17
Ap
r-17
Jun
-17
Au
g-1
7
Oct
-17
De
c-17
Feb
-18
Ap
r-18
Paddy - 1121 pusa : Hanumangarh
RICE/PADDY FUNDAMENTAL SUMMARY
Price Drivers Impact
Government procurement of Rice
Bullish
Higher stocks position at central pool
Bearish
Lower procurement in Chhattisgarh, Bihar, Madhya Pradesh and West Bengal
Bullish
Record rice production in 2017-18
Bearish
Iran to import rice till 22nd July
Bullish
Based on Primary & Secondary Sources
0
Date: 08-05-2018 MktYard.com Weekly Commodity Market Monitor
Fundamental Report GUAR SEED
2,900
3,200
3,500
3,800
4,100
4,400
4,700
May
-16
Jul-1
6
Oct
-16
De
c-16
Mar
-17
Jun
-17
Au
g-1
7
No
v-17
Jan
-18
Ap
r-18
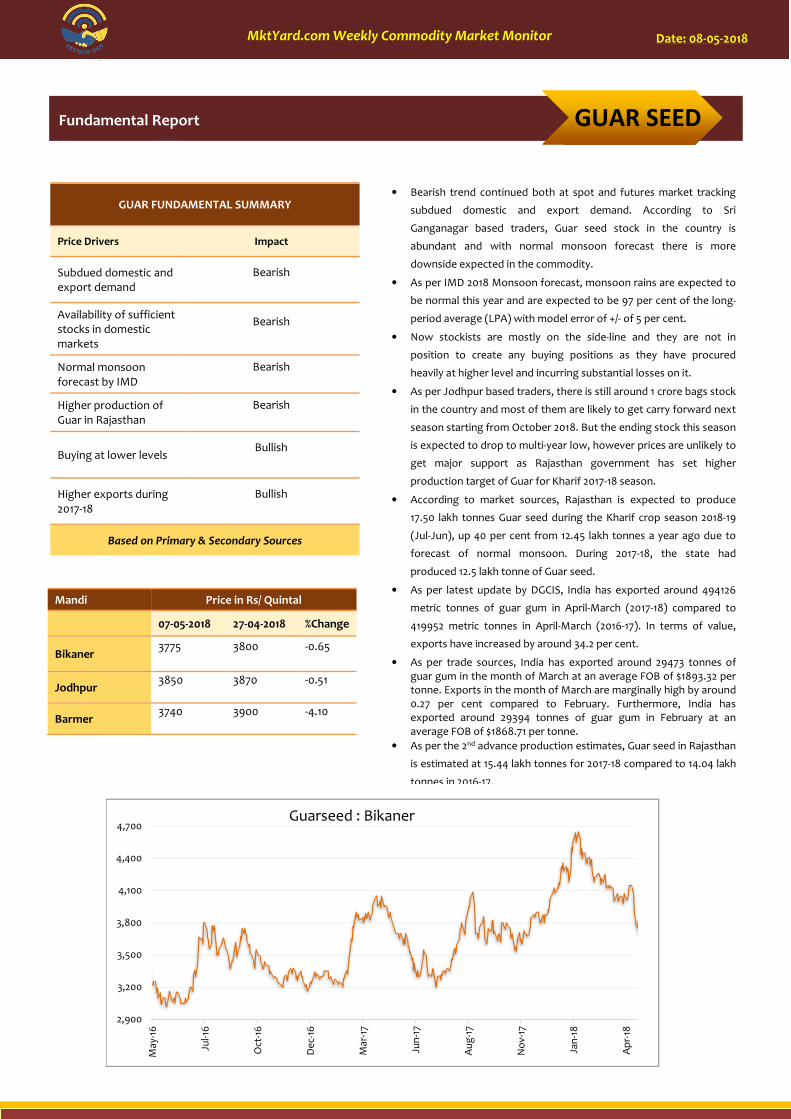
Guarseed : Bikaner
GUAR FUNDAMENTAL SUMMARY
Price Drivers Impact
Subdued domestic and export demand
Bearish
Availability of sufficient stocks in domestic markets
Bearish
Normal monsoon forecast by IMD
Bearish
Higher production of Guar in Rajasthan
Bearish
Buying at lower levels Bullish
Higher exports during 2017-18
Bullish
Based on Primary & Secondary Sources
Mandi Price in Rs/ Quintal
07-05-2018 27-04-2018 %Change
Bikaner 3775 3800 -0.65
Jodhpur 3850 3870 -0.51
Barmer 3740 3900 -4.10
• Bearish trend continued both at spot and futures market tracking
subdued domestic and export demand. According to Sri
Ganganagar based traders, Guar seed stock in the country is
abundant and with normal monsoon forecast there is more
downside expected in the commodity.
• As per IMD 2018 Monsoon forecast, monsoon rains are expected to
be normal this year and are expected to be 97 per cent of the long-
period average (LPA) with model error of +/- of 5 per cent.
• Now stockists are mostly on the side-line and they are not in
position to create any buying positions as they have procured
heavily at higher level and incurring substantial losses on it.
• As per Jodhpur based traders, there is still around 1 crore bags stock
in the country and most of them are likely to get carry forward next
season starting from October 2018. But the ending stock this season
is expected to drop to multi-year low, however prices are unlikely to
get major support as Rajasthan government has set higher
production target of Guar for Kharif 2017-18 season.
• According to market sources, Rajasthan is expected to produce
17.50 lakh tonnes Guar seed during the Kharif crop season 2018-19
(Jul-Jun), up 40 per cent from 12.45 lakh tonnes a year ago due to
forecast of normal monsoon. During 2017-18, the state had
produced 12.5 lakh tonne of Guar seed.
• As per latest update by DGCIS, India has exported around 494126
metric tonnes of guar gum in April-March (2017-18) compared to
419952 metric tonnes in April-March (2016-17). In terms of value,
exports have increased by around 34.2 per cent.
• As per trade sources, India has exported around 29473 tonnes of guar gum in the month of March at an average FOB of $1893.32 per tonne. Exports in the month of March are marginally high by around 0.27 per cent compared to February. Furthermore, India has exported around 29394 tonnes of guar gum in February at an average FOB of $1868.71 per tonne.
• As per the 2nd advance production estimates, Guar seed in Rajasthan
is estimated at 15.44 lakh tonnes for 2017-18 compared to 14.04 lakh
tonnes in 2016-17.
0
Date: 08-05-2018 MktYard.com Weekly Commodity Market Monitor
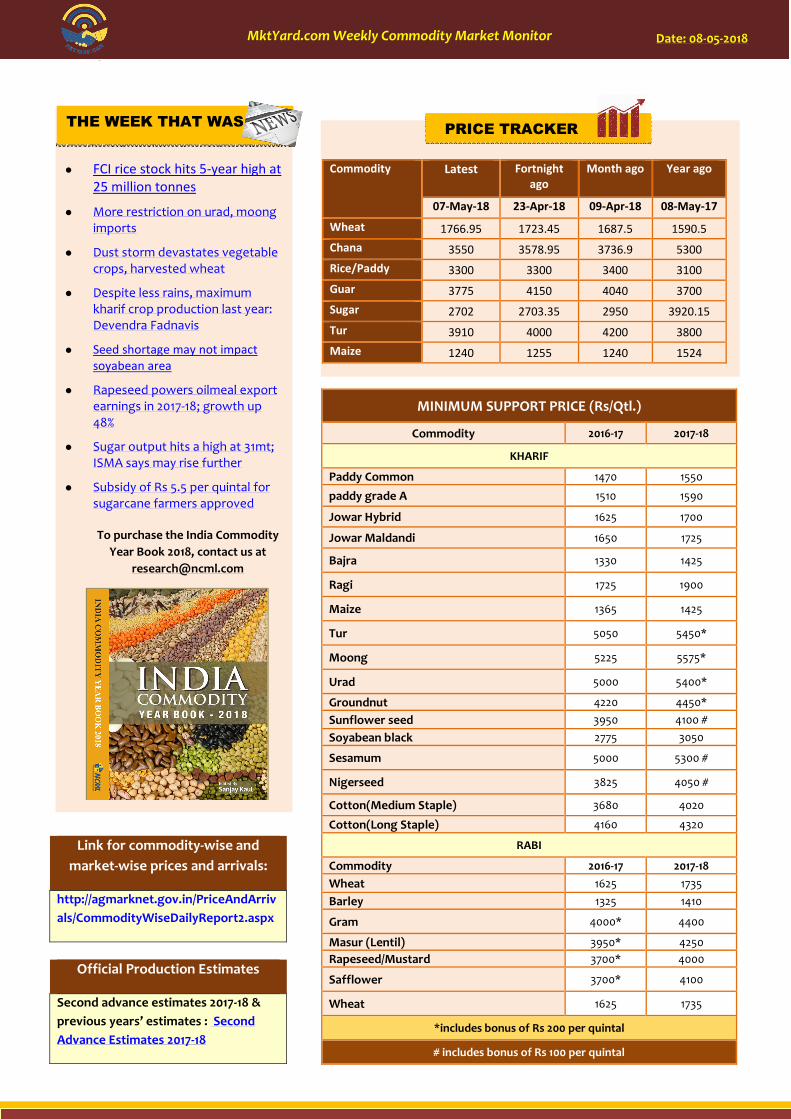
� FCI rice stock hits 5-year high at
25 million tonnes
� More restriction on urad, moong imports
� Dust storm devastates vegetable crops, harvested wheat
� Despite less rains, maximum kharif crop production last year: Devendra Fadnavis
� Seed shortage may not impact
soyabean area
� Rapeseed powers oilmeal export earnings in 2017-18; growth up 48%
� Sugar output hits a high at 31mt; ISMA says may rise further
� Subsidy of Rs 5.5 per quintal for sugarcane farmers approved
To purchase the India Commodity
Year Book 2018, contact us at
Official Production Estimates
Second advance estimates 2017-18 &
previous years’ estimates : Second
Advance Estimates 2017-18
MINIMUM SUPPORT PRICE (Rs/Qtl.)
Commodity 2016-17 2017-18
KHARIF
Paddy Common 1470 1550
paddy grade A 1510 1590
Jowar Hybrid 1625 1700
Jowar Maldandi 1650 1725
Bajra 1330 1425
Ragi 1725 1900
Maize 1365 1425
Tur 5050 5450*
Moong 5225 5575*
Urad 5000 5400*
Groundnut 4220 4450*
Sunflower seed 3950 4100 #
Soyabean black 2775 3050
Sesamum 5000 5300 #
Nigerseed 3825 4050 #
Cotton(Medium Staple) 3680 4020
Cotton(Long Staple) 4160 4320
RABI
Commodity 2016-17 2017-18
Wheat 1625 1735
Barley 1325 1410
Gram 4000* 4400
Masur (Lentil) 3950* 4250
Rapeseed/Mustard 3700* 4000
Safflower 3700* 4100
Wheat 1625 1735
*includes bonus of Rs 200 per quintal
# includes bonus of Rs 100 per quintal
Commodity Latest Fortnight
ago
Month ago Year ago
07-May-18 23-Apr-18 09-Apr-18 08-May-17
Wheat 1766.95 1723.45 1687.5 1590.5
Chana 3550 3578.95 3736.9 5300
Rice/Paddy 3300 3300 3400 3100
Guar 3775 4150 4040 3700
Sugar 2702 2703.35 2950 3920.15
Tur 3910 4000 4200 3800
Maize 1240 1255 1240 1524
PRICE TRACKER
Link for commodity-wise and
market-wise prices and arrivals:
http://agmarknet.gov.in/PriceAndArriv
als/CommodityWiseDailyReport2.aspx
THE WEEK THAT WAS

0
Date: 08-05-2018 MktYard.com Weekly Commodity Market Monitor
Disclaimer:
This consultancy report has been prepared by National Collateral Management Services Limited (NCML) for the sole benefit of the
addressee. Neither the report nor any part of the report shall be provided to third parties without the written consent of NCML. Any
third party in possession of the report may not rely on its conclusions without the written consent of NCML. NCML has exercised
reasonable care and skill in preparation of this consultancy report but has not independently verified information provided by others.
No other warranty, express or implied, is made in relation to this report. Therefore, NCML assumes no liability for any loss resulting
from errors, omissions or misrepresentations made by others. Any recommendations, opinions and findings stated in this report are
based on circumstances and facts as they existed at the time of preparation of this report. Any change in circumstances and facts on
which this report is based may adversely affect any recommendations, opinions or findings contained in this report.
© National Collateral Management Services Limited (NCML) 2017
Recommended


![Castor Seed Oil- Processing[1]](https://img.dokumen.tips/doc/110x75/546abb76b4af9f7a2c8b4889/castor-seed-oil-processing1.jpg)


