HAL Id: hal-00512921https://hal.archives-ouvertes.fr/hal-00512921
Submitted on 1 Sep 2010
HAL is a multi-disciplinary open accessarchive for the deposit and dissemination of sci-entific research documents, whether they are pub-lished or not. The documents may come fromteaching and research institutions in France orabroad, or from public or private research centers.
L’archive ouverte pluridisciplinaire HAL, estdestinée au dépôt et à la diffusion de documentsscientifiques de niveau recherche, publiés ou non,émanant des établissements d’enseignement et derecherche français ou étrangers, des laboratoirespublics ou privés.
Analyzing the Effects of Lean Manufacturing using aValue Stream Mapping based simulation generator
Yang-Hua Lian, Hendrik van Landeghem
To cite this version:Yang-Hua Lian, Hendrik van Landeghem. Analyzing the Effects of Lean Manufacturing using a ValueStream Mapping based simulation generator. International Journal of Production Research, Taylor &Francis, 2007, 45 (13), pp.3037-3058. �10.1080/00207540600791590�. �hal-00512921�

For Peer Review O
nly
Analyzing the Effects of Lean Manufacturing using a Value
Stream Mapping based simulation generator
Journal: International Journal of Production Research
Manuscript ID: TPRS-2005-IJPR-0075.R1
Manuscript Type: Original Manuscript
Date Submitted by the Author:
09-Mar-2006
Complete List of Authors: LIAN, Yang-Hua; Ghent University, Department of Industrial Management Van Landeghem, Hendrik; Ghent University, Department of Industrial Management
Keywords: LEAN MANUFACTURING, DISCRETE EVENT SIMULATION, DESIGN OF PRODUCTION SYSTEMS
Keywords (user): Value Stream Mapping
http://mc.manuscriptcentral.com/tprs Email: [email protected]
International Journal of Production Research

For Peer Review O
nly
1
Analyzing the Effects of Lean Manufacturing
using a Value Stream Mapping based simulation generator
Yang-Hua LIAN and Hendrik VAN LANDEGHEM
Industrial Management, Ghent University, Belgium
Technologiepark, 903, B-9052 GENT, BELGIUM
Tel: +32-9-264.55.01
Fax: +32-9-264.58.47
email: [email protected]
Corresponding author: Hendrik VAN LANDEGHEM
Word count of article main text: 6696 words
Manuscript ID: TPRS-2005-IJPR-0075
Page 1 of 38
http://mc.manuscriptcentral.com/tprs Email: [email protected]
International Journal of Production Research
123456789101112131415161718192021222324252627282930313233343536373839404142434445464748495051525354555657585960

For Peer Review O
nly
2
Analyzing the Effects of Lean Manufacturing using a Value Stream Mapping
based simulation generator
Abstract:
Value Stream Mapping (VSM) has become a popular implementation method for
Lean Manufacturing in recent years. However, its limitations such as being time-
consuming, its inability to detail dynamic behavior of production processes and to
encompass their complexity, have spurred us to turn to simulation. This paper
introduces two new elements to the Value Stream Mapping Method. First, it describes
how the Value Stream Mapping Paradigm (VSMP) can be adapted for use in
simulation, introducing specially designed VSM objects. Secondly, based on the VSMP
and these objects, it presents a formal modeling method and its related database
structure, that drives a generator which automatically yields a simulation model of the
Value Stream Map. In this way, a model generator, using the set of objects and the
model database, can generate simulation models of current and future VSM scenarios
quickly and automatically. Additionally, algorithms for converting raw ERP data and
information from a VSM drawing into tables of the structured database are developed.
Finally, the formal modeling method is applied to a real company case. A Current State
model of the manufacturing system and three scenarios of Future States are generated to
see the effects of lean when transforming part of the system from push to pull.
Page 2 of 38
http://mc.manuscriptcentral.com/tprs Email: [email protected]
International Journal of Production Research
123456789101112131415161718192021222324252627282930313233343536373839404142434445464748495051525354555657585960
For Peer Review O
nly
3
Keywords
Lean Manufacturing, Value Stream Mapping, Object-Oriented Simulation, Model
Generator
Page 3 of 38
http://mc.manuscriptcentral.com/tprs Email: [email protected]
International Journal of Production Research
123456789101112131415161718192021222324252627282930313233343536373839404142434445464748495051525354555657585960

For Peer Review O
nly
4
1. Introduction
Womack, Jones, and Roos define ‘Lean’ as the elimination of muda (waste) in the
book ‘The Machine that Changed the World’ (1990). Several cases are illustrated in the
sequel ‘Lean Thinking’ (Womack and Jones 1996). In this book, crises of the
companies in various industries (manufacturing tools, cars, airplanes, etc.) are tackled
by applying the key principles of Lean Manufacturing (Womack and Jones 1996;
Rother and Shook 1999). The surveyed companies are scattered around the world with
different cultures (America, Germany, Japan) and sizes (a little company with 400
people to a big enterprise with 29 000 employees). The key principles are:
1. Define Value from the perspective of the customer,
2. Identify the Value Streams, and eliminate Waste from them
3. Create Flow,
4. Introduce Pull,
5. Strive to Perfection.
Despite the apparent simplicity of the Lean approach, its successful adoption by
manufacturing companies has progressed slowly, both in the US as in Europe
(Drickhammer, 2004; Engardio and Roberts 2004; Van Landeghem, 2005). One reason
for this is the difficulty in accurately determining the impact of Lean transformations,
especially when this requires changes in assets. Expensive factory layout redesigns,
such as replacing a production line with large machines of mass production by a
manufacturing cell with new, smaller machines is one example that has been reported
(Rahn 2001; Sullivan et al. 2002). A change in the supply chain infrastructure is another
one (Van Landeghem and Debuf 1997). In recent years, Value Stream Mapping (VSM)
has emerged as the preferred way to implement lean, both inside factories and at the
Page 4 of 38
http://mc.manuscriptcentral.com/tprs Email: [email protected]
International Journal of Production Research
123456789101112131415161718192021222324252627282930313233343536373839404142434445464748495051525354555657585960

For Peer Review O
nly
5
supply chain level linking those factories (Hines and Rich 1997; Hines, et al 1998a; id.
1998b; Hines and Taylor 2000; McDonald, et al 2000, id. 2002; Whitman et al. 2001;
Sullivan et al. 2002, etc.).
Value Stream Mapping (VSM) is a mapping paradigm used to describe the
configuration of value streams. It maps not only material flows but also information
flows that signal and control these material flows (Rother and Shook 1999). However,
since VSM is a paper and pencil method, it is limited in its modeling power. VSM is
also a static tool that cannot describe dynamic behavior and cannot handle neither
complexity nor uncertainty. Moreover, we might need at least a few months of a
continued monitoring to observe the effects of changes and improvements (Hines et al.
1998). On the other hand, we would like to preserve the VSM modeling language (i.e.
its standard icons), because of its ease of use and its widening dissemination within the
manufacturing community. Moreover, VSM also includes a step by step approach to
transform a current manufacturing state into a Lean future state, which is the basis of its
success in practice.
In the remainder of this paper, we first review some literature regarding enhanced
VSM tools. Since we use simulation as such a tool, studies concerning modular
simulation models and generators are also shortly reported on. Then, we describe the
formal Value Stream Mapping Paradigm (VSMP) in view of simulation and define the
framework and elements of an enhanced VSM approach, we call simulation-based VSM
(SimVSM) . The formal method is then applied to a real world company case. The
method’s algorithms for converting raw ERP data and information of a VSM map into
tables of the structured database are briefly illustrated on the case. A Current State
model of the real manufacturing system case and three scenarios of VSM Future States
are generated to see the effects of lean manufacturing by transforming part of the system
Page 5 of 38
http://mc.manuscriptcentral.com/tprs Email: [email protected]
International Journal of Production Research
123456789101112131415161718192021222324252627282930313233343536373839404142434445464748495051525354555657585960

For Peer Review O
nly
6
from push to pull. Via the use of SimVSM, managers can see the impact of lean
transformation before the actual implementation. This will increase confidence and
hopefully enhance the rate of adoption of Lean Thinking in our manufacturing
companies.
2. Literature review
The limitations of traditional VSM have stimulated some researchers to develop
ways to enhance it. Two types of enhanced tools are used in the literature: detailed
mapping and simulation.
Sullivan et al. (2002) illustrate an equipment replacement decision problem within
the context of lean manufacturing implementation and demonstrate how the seven VS
detailed mapping tools (Hines et al., 1997, id. 1998, id. 2000) can be used to picture the
current state of a production line and design a desired future state. Simulation, which
creates consensus by its model-building interface, visualization of dynamic views and
output analyzing capabilities, has also been applied as such an enhanced tool
(McDonald et al. 2000, id. 2002). Two ways of simulation are described in literature:
� Physical Simulations: Whitman et al. (2001) present a physical simulation game
where participants operate workstations along the assembly line in a mythical
aircraft plant. Through a series of four scenarios (with different value stream maps),
participants encounter problems with suppliers, service level, quality control and so
on. As a result of participating in this game, people implement and learn about lean
concepts such as cellular manufacturing, pull system, one-piece-flow, etc. We have
been using this approach ourselves (Lian and Van Landeghem 2002), modifying an
existing manufacturing game building Styrofoam trains, introduced by Van
Landeghem and Dams (1995), to illustrate the VSM method.
Page 6 of 38
http://mc.manuscriptcentral.com/tprs Email: [email protected]
International Journal of Production Research
123456789101112131415161718192021222324252627282930313233343536373839404142434445464748495051525354555657585960

For Peer Review O
nly
7
� Computer-Aided Simulations: In (Van Landeghem and Debuf 1997; Van
Landeghem 1998; McDonald et al. 2000; id. 2002; Rahn 2001) simulation is used to
model manufacturing processes for a core product family and to validate the current
supply chain map (or Current State map) as well as evaluating alternative scenarios.
However, they failed to fulfill one thing: ‘integration of VSM and simulation’. The
results are long simulation modeling times (e.g. forty hours for a Future State model
in McDonald, Van Aken and Rentes 2002) and models that are not reusable.
These shortcomings are typical for simulation studies (Valentin and Verbraeck 2001; id.
2002). One avenue of improvement has led to object-oriented modeling. Although
Oldfather et al. (1966) developed the earliest simulation generator already in 1966, the
concept of object-oriented modeling (or component-based modeling) used in
conjunction with model generators arose in the mid-1990s due to the advent of supply
chain integration, which increased the complexity of designing manufacturing systems
and aggravated the drawbacks of traditional simulation studies.
Alfieri and Brandimarte (1997) indicated that the variety of tasks to be modeled in
such systems calls for a modular approach which is characterized by reusable modules
and stable interfaces to connect them, enabling the designer to experiment with different
alternatives by simply assembling a set of predefined building blocks. Aytug and Dogan
(1998) introduced a generalized framework for modeling a specific class of Kanban-
controlled manufacturing systems, including a model generator based on this
framework. They developed five major building blocks (work center module,
production kanban monitoring module, withdrawal kanban monitoring module, material
order module and customer order module) in simulation code, as well as a database and
user interface. They illustrate the generator on a hypothetical manufacturing system.
Page 7 of 38
http://mc.manuscriptcentral.com/tprs Email: [email protected]
International Journal of Production Research
123456789101112131415161718192021222324252627282930313233343536373839404142434445464748495051525354555657585960

For Peer Review O
nly
8
This generator is an enhanced version of Christenson and Dogan’s (1995), where the
system assumes that all parts must follow the same process routing. Son et al. (2003)
describe a library of such formal, neutral models of simulation components for a
discrete-event simulation of the flow of jobs through a job shop, based on a pre-
provided schedule.
From our own research we found two additional benefits for using simulation models:
� Simulation as a Cost Saving Tool: The use of a simulation model can help managers
to see the effects before a big implementation: the impact of layout changes,
resource reallocation, etc. on key performance indicators before and after lean
transformation, and this without huge upfront investments (Van Landeghem and
Debuf 1997, Rahn 2001).
� Simulation as a Training Tool: Simulation has proven to be a powerful eye-opener
(Van Landeghem and Debuf 1997; Van Landeghem 1998; McDonald et al. 2000; id.
2002; Whitman et al. 2001. By combining simulation with the visual power of
Value Stream Maps, we aim for faster adoption and less resistance to change from
the workforce.
The integration of standard VSM icons and generated simulation models will enable
non-expert users (e.g. companies) to develop simulation models after few sessions of
practices. We achieved this integration in developing SimVSM.
3. Value Stream Mapping Paradigm
VSM provides a set of standard icons as a common language for describing
manufacturing processes. The list of VSM icons provided by Rother and Shook (1999)
fall into three categories: material flow, information flow and general icons. However,
in order to be able to simulate these flows, we need to clearly establish the function of
Page 8 of 38
http://mc.manuscriptcentral.com/tprs Email: [email protected]
International Journal of Production Research
123456789101112131415161718192021222324252627282930313233343536373839404142434445464748495051525354555657585960
For Peer Review O
nly
9
each icon and determine their interrelationships. We call this enhanced meta-level view
of VSM the Value Stream Mapping Paradigm (VSMP). To describe it, we need to
define a new classification for VSM icons:
1. Basic Flow Unit Entities and Flows,
2. Physical Entities,
3. Buffer Entities,
4. Flow Control Entities,
5. Data Table and Measurement Entities.
We can thus describe the VSMP as follows:
Basic flow unit entities (products, containers) are the objects that move through
physical entities (machines, manufacturing processes) and buffer entities (inventory,
queues) in the system. The flow control entity (production control, customer) using
information from the data entity (data tables) triggers the movements of basic flow unit
entities and thereby recreates the flows. Finally, measurement and monitor entities
extract run-time information in order to help us understand and revise the system.
Based on this paradigm, we develop a set of VSM building blocks for generating
manufacturing simulation models. We show the complete VSMP in Table 1, containing
a description of the functionality of each block, its related VSM icon and the
identification of the simulation atom. Note that these icons represent the modeling
power of standard VSM, which we tried to preserve as much as possible.
We have chosen as object-oriented simulation environment Enterprise Dynamics®
(ED). Within it we have developed a fully functional prototype of our SimVSM toolset.
Since the building blocks in ED are called "atoms", we will use this term in the
remainder of the text.
Insert Table 1 here.
Page 9 of 38
http://mc.manuscriptcentral.com/tprs Email: [email protected]
International Journal of Production Research
123456789101112131415161718192021222324252627282930313233343536373839404142434445464748495051525354555657585960

For Peer Review O
nly
10
4. Simulation-based formal modelling method of Value Stream Maps (SimVSM)
The formal method we introduce is a discrete-event simulation-based method, which
preserves the high-level modeling power of standard VSM, but compensates for the
drawbacks of static VSM, and generates the model automatically without any of the
limitations currently found in literature (such as single unit load, capacity limitations,
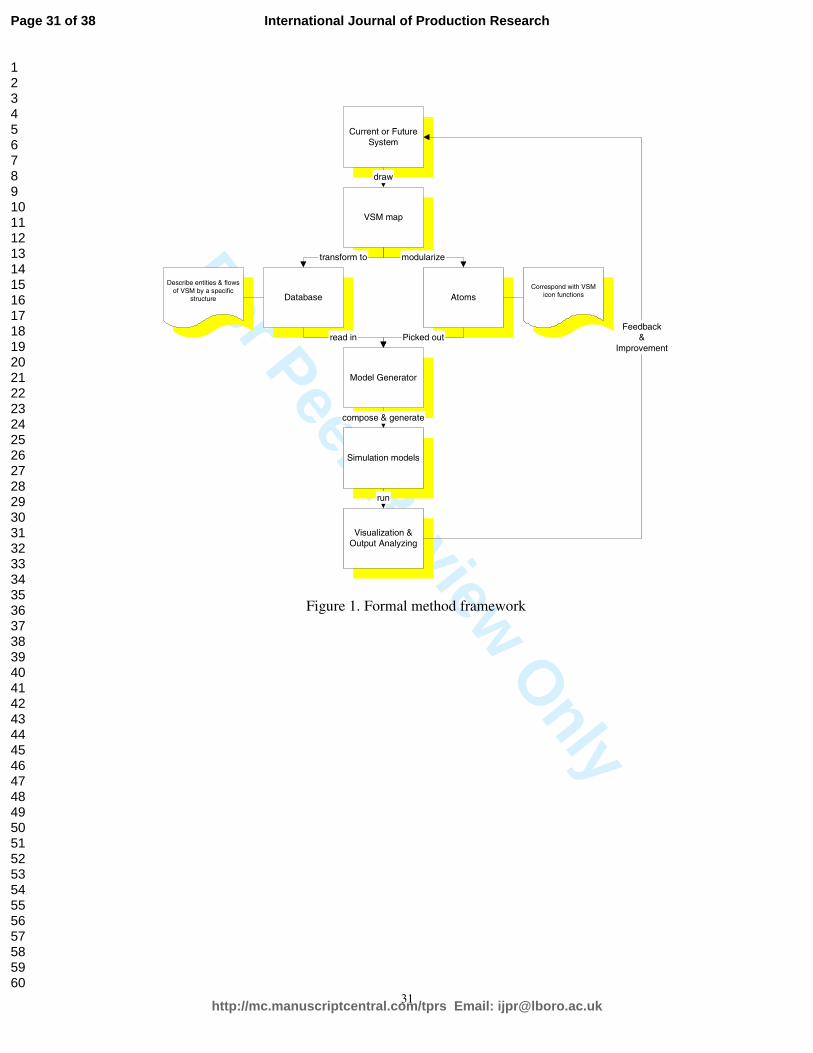
non-stochastic times, or push environment only). The framework of our formal method
is shown in Figure 1 and we explain its elements in what follows.
Insert Figure 1 here
4.1. Atom formalism and manipulation
We have designed twelve specific atoms for SimVSM (atom ID 1-11, 18 in Table 1).
The idea is that the functions, represented by the VSM icons, can be composed from
these atoms and (possibly) some ED standard atoms (atom ID 12-17, 19 in Table 1).
Then, simulation models for different VSM scenarios can be created automatically,
through a generator that reads from a structured database which atoms to put in the
model.
Atoms are object-oriented, self-contained modules describing the behavior of entities
(e.g. machine, product, buffer, storage, etc.) within a manufacturing system. In
connecting the atoms through links between the input/output channels of the atoms we
provide dynamic flow information. Of course, these connections must adhere strictly to
a set of rules, to guarantee that the model, once generated, can be run as a simulation
and is correct. These rules are specific for each atom, as we will illustrate below.
It should be noted at this point that most simulation software engines are based on a
‘push-through’ flow paradigm to operate their models. Therefore, modeling PULL flow
Page 10 of 38
http://mc.manuscriptcentral.com/tprs Email: [email protected]
International Journal of Production Research
123456789101112131415161718192021222324252627282930313233343536373839404142434445464748495051525354555657585960

For Peer Review O
nly
11
requires quite some intricate atoms to achieve working models. In addition, a simulation
model behaves as a close-coupled system, i.e. when the flow is blocked somewhere, all
previous entities in the flow are also blocked. To avoid this, queues (buffers) have to be
included at numerous places, typically before and after each process. For reasons of
conciseness, we describe only the formalism and operating logic of the supermarket
atom, which is part of the pull system. In a supermarket, a fixed amount of raw material,
work in process, or finished product is kept as a buffer to absorb variability or shield off
an incapable process. The amount is determined by the number of Kanbans, which also
serve to control its replenishment.
4.2. Supermarket atom description
A supermarket (Figure 2) is a buffer between two machines or processes, consisting
of N trays, one for each product type. Each tray i (i=1,..,N) is represented by one
supermarket atom (VSMSUPR02 in table 1) and is filled initially with Ki kanbans, each
containing Mi units. In a general situation, tray i contains ki non-empty kanbans, with at
most one of them partially emptied (containing ri units), for a total of pi product units.
Thus, the number of products available in the supermarket tray i at any time adheres to
Pi = (ki-1)*Mi+ri with 0 < ri � Mi
As shown in Figure 2, we can divide the flows into two parts. The first part, demand
delivery, is situated downstream of the supermarket atom. When a customer demand
(outside trigger) arrives into the system, it requests the order quantity xi from a
supermarket atom through an order-process/withdraw atom (VSMOPRO01). The
supermarket will then try to ship xi parts. If there are enough kanbans in the
supermarket atom (xi � Pi ), the demand trigger will cause xi products to proceed
Page 11 of 38
http://mc.manuscriptcentral.com/tprs Email: [email protected]
International Journal of Production Research
123456789101112131415161718192021222324252627282930313233343536373839404142434445464748495051525354555657585960

For Peer Review O
nly
12
downstream. A number of empty kanbans h will then be released upstream to replenish
the supermarket, with the remainder r'i ready for the next request. We find
h = �(xi-ri)/Mi�+1
r'I = (xi - ri) mod Mi, if xi � ri and r'I = (ri - xi) else
Otherwise, the unfilled portion of the demand will be put in a backlog queue until
enough products arrive from upstream.
The second part, kanban replenishment, is situated upstream of the supermarket
atom. The empty kanbans exiting from the supermarket are put in a staging queue,
controlled by a withdraw atom (VSMOPRO01). For each empty kanban, the withdraw
atom releases a production kanban to the production kanban wall (a queue itself). The
upstream manufacturing process atom (machine or work centre) then receives orders
from the kanban wall to produce its end-products to replenish the consumed parts of the
empty kanban. These products are attached to the waiting empty kanban in the withdraw
atom, until it is complete with its Mi units. The replenished full kanban is then sent back
to the supermarket to its tray i. Production thus replenishes one Kanban at the time.
Insert Figure 2 here
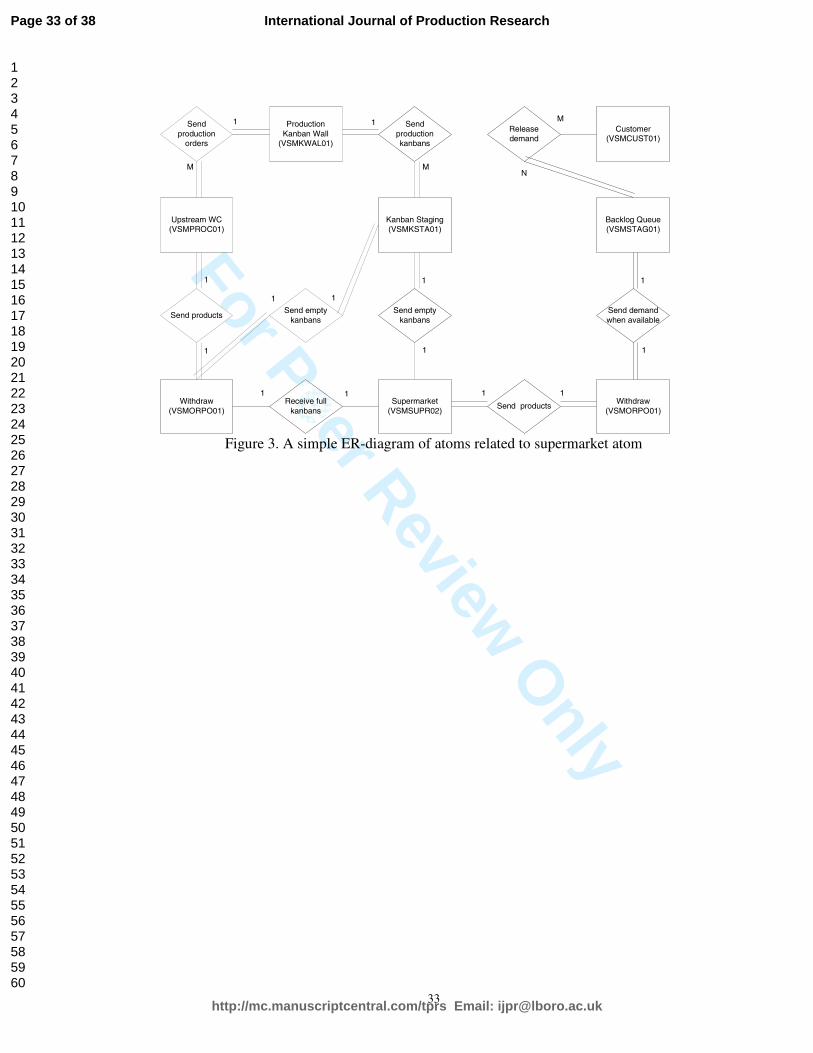
4.3. Supermarket model relationships
The relationships of the supermarket atom with other atoms, which have to be
obeyed to obtain a valid model, are displayed in Figure 3 using the Entity-Relationship
formalism (Chen, 1976). In this figure a ‘1’, ‘M’ or ‘N’ represent the cardinality of the
relationships: one-to-one, one-to-many, or many-to-many. A single or a double line
denotes an optional or a mandatory relationship and the naming of the relationships are
displayed inside diamond-shaped nodes. For each supermarket atom (one-to-one
relationship), there are three types of atoms that can be directly connected to it:
Page 12 of 38
http://mc.manuscriptcentral.com/tprs Email: [email protected]
International Journal of Production Research
123456789101112131415161718192021222324252627282930313233343536373839404142434445464748495051525354555657585960

For Peer Review O
nly
13
� The first output channel of the supermarket atom (VSMSUPR02) may (optionally)
be connected to a kanban staging atom (VSMKSTA01): i.e. a supermarket atom may
send empty kanbans to a kanban staging atom.
� The second output channel of the supermarket atom (VSMSUPR02) must
(mandatory) be connected to an order-processing/withdraw atom (VSMOPRO01): a
supermarket atom must send products to a withdraw atom.
� The only input channel of the supermarket atom (VSMSUPR02) may (optionally)
be connected to an order-processing/withdraw atom (VSMOPRO01): a supermarket
atom may receive full kanbans from an upstream withdraw atom.
Insert Figure 3 here
4.4. Database structure
In the SimVSM method, a model generator written in the Enterprise Dynamics
programming language reads the data from a database, taking the required atoms,
connecting them and generating the simulation model through a wholly automatic
process. This database describes the resources/entities, their layout and relationships
within a manufacturing system and contains the information that is mentioned in a
VSM. The database structure is displayed in Figure 4. Different data sets provided for
the same structure will create different simulation models through the model generator.
When executing the generated simulation model, output measurements of products or
orders such as lead-time, value-added time and value-added ratio are written into two
output tables of the same database file. The database tables can be classified into four
categories:
� Meta-model database tables: There are three tables belonging to this sort
(‘TypeInfo’, ‘ParameterDescriptors’, ‘AtomInfoPerType’). They contain data
Page 13 of 38
http://mc.manuscriptcentral.com/tprs Email: [email protected]
International Journal of Production Research
123456789101112131415161718192021222324252627282930313233343536373839404142434445464748495051525354555657585960

For Peer Review O
nly
14
respectively about the list of standard atoms, available for the generator, a list of
parameters with their description and a list indicating for each of those atoms which
parameters are needed. The generator does not query them and the data within the
tables do not change from models to model. Rather these tables contain the meta-
model on which the generator logic has been designed. Also, the user interface for
input of data uses this information to guide its query.
� Generator database tables: This type of database tables describes the resources
(atoms) of a manufacturing system, their layout location (X, Y, Z) and relationships
(connections). Via the information in the ‘Connections’ table, the generator then
constructs a ‘Channels’ table providing the identity of input and output related
entities for each specific entity. These tables are functional tables, which depict the
entities and contain the logic of the simulation model. The generator needs all these
tables to complete a simulation model (see data flow in Figure 4). The data within
these tables changes from model to model. There are four tables belonging to this
category: ‘Atoms’, ‘AtomConnections’, ‘AtomChannels’ and ‘ParameterValues’
tables.
� Input database tables: These tables provide data values for the specific tables linked
to an atom (a specific ED construct). For instance, the atom ‘VSMOPRO01’ has a
corresponding bill of material table to allow assembly processes; the atom ‘T098-
Table’ which is an ED standard atom can be used as order data or setup time matrix
table.
� Output database tables: Two tables are filled with values when a measurement atom
‘VSMDATA01’ is used in the model. We can evaluate our system by these output
measurements (lead time, value-added time, service level, etc) as well as using the
standard output data supported by ED itself such as machine utilization, queue size,
Page 14 of 38
http://mc.manuscriptcentral.com/tprs Email: [email protected]
International Journal of Production Research
123456789101112131415161718192021222324252627282930313233343536373839404142434445464748495051525354555657585960

For Peer Review O
nly
15
queuing time (WIP), etc. The definitions of some key measurements are given as
follows (Hopp and Spearman 1996; Rother and Shook 1999):
� Work in Process (WIP): The inventory between the start and end points of a
product routing. Inventory levels are converted to ‘inventory time’ in a VSM
map according to Rother and Shook, 1999.
� Lead-time (LT): The total time a customer must wait to receive a product after
placing an order. When a scheduling and production system is running at or
below capacity, lead-time and throughput time are the same. When demand
exceeds the capacity of a system, there is additional waiting time before the start
of scheduling and production, and lead-time exceeds throughput time.
� Utilization (U): Fraction of time a workstation is not idle for lack of parts. If a
workstation increases utilization without making other changes, average WIP
and lead-time will increase in a highly nonlinear fashion.
Insert Figure 4 here
4.5. Model generator
The model generator reads the data from a structured database, takes the required
atoms (entity types/names), locates the position (layout of the entities), connects them
(the relationships between the entities) and transforms the descriptions of a database
into a simulation model automatically. The model generator is data-driven so that
different data source under the same database structure will produce various simulation
models with the only generator.
Simulation models are the final products of atoms, database and model generator. By
changing the data in the database, we can yield a simulation model that corresponds to
the new data set without any effort whatsoever (e.g. only point to the menu option or
Page 15 of 38
http://mc.manuscriptcentral.com/tprs Email: [email protected]
International Journal of Production Research
123456789101112131415161718192021222324252627282930313233343536373839404142434445464748495051525354555657585960

For Peer Review O
nly
16
push the shortcut keys). In this way, different scenarios of VSM can be transformed into
simulation models in a short time and we can easily obtain feedback and improvements
to the system after analyzing and comparing the outputs of simulation models. This
allows for efficient analysis with the company people present, increasing their
involvement with the models. The generator thus allows us to follow closely the
standard VSM method of transforming the current state in one or more future states,
with different phases of execution. Now (for the first time) each phase of transformation
towards lean can be validated up front using specific generated simulation models.
4.6. SimVSM: the formal modeling procedure
We can summarize the modeling procedure of our formal method into five steps
(Figure 5):
Step 1: Determine the required raw input data through a VSM map
The aim of our VSM formal method is to enhance traditional VSM and compensate
the limitations of it. Therefore, the first step is to draw a VSM map of the system that
the manager would like to investigate. According to the VSM method both Current and
Future State VSM will be drawn. The static VSM provides basic information for the
model generator tables such as entities in the system, locations, simplified flows, setup
times and cycle times. To generate the links between atoms, we will need detailed flow
descriptions. It is important that a ‘routing table’ which describes the paths of all the
simulated products is supplied in this step. While the VSM map provides the ‘table of
contents’ of the model, and the basic topology of information and material flows, most
detailed data can be obtained directly from the company’s ERP database, possibly after
some reformatting and filtering.
Page 16 of 38
http://mc.manuscriptcentral.com/tprs Email: [email protected]
International Journal of Production Research
123456789101112131415161718192021222324252627282930313233343536373839404142434445464748495051525354555657585960

For Peer Review O
nly
17
Step 2: Data processing of the raw input data
Data processing is a step that transforms the raw input into the data format that can
be used by the model generator. After the processing, four generator database tables
(‘Atoms’, ‘AtomConnections’, ‘AtomChannels’ and ‘ParameterValues’) are produced.
The conversion algorithm of the ‘AtomConnections’ table will be briefly described
when applying it to the real company case.
Step 3: Model generation
In this step, the model generator completes its duty (select, connect atoms, etc.)
Step 4: Model execution
During model execution, the production control atom (VSMCUST02) will read in
the customer order data provided by a table atom (T098-Table). With these two atoms,
the release of orders can be simulated in two ways, push (MRP) or pull (Kanban). By
simply ticking a ‘Product’ box to ‘on’ or ‘off’ the production control atom will release
‘products’ or ‘containers’. In the first case, the released products will push to
downstream. In the second case, the containers request (pull) the order quantities from
upstream and flow them through the system.
Step 5: Analyzing simulation results
Operational output measurements such as lead-time, value-added time, value-added
ratio, machine utilization and queuing time are available after model execution for
analysis.
Insert Figure 5 here
5. Illustrating the formal method using a real company case: Current State
We illustrate SimVSM through a real company case. The company, located in
Belgium, is a major manufacturer of poultry and pig raising equipment, including
Page 17 of 38
http://mc.manuscriptcentral.com/tprs Email: [email protected]
International Journal of Production Research
123456789101112131415161718192021222324252627282930313233343536373839404142434445464748495051525354555657585960

For Peer Review O
nly
18
feeding, drinking, feed storage and feed transportation systems. The current
manufacturing system of their division ‘Components Production’ encounters a capacity
problem on a particular machine center (HYDRAP), leading to excessive lead-times that
jeopardize the due date performance of the final assembly line. The company wants to
introduce Lean into their operations, but hesitates because they do not clearly see the
consequences of this.
Step 1: Determine the required raw input data through a VSM map
The Current State VSM of the company is shown in Figure 6. This manufacturing
system consists of 31 main atoms (entities). Over the reference period to be simulated,
the production control center (atom ID 18) releases 975 production orders of 382
different components (i.e. product types) to the workstations. There are a total of 8
instances of workstations in the simulated system: (1) HYDRAP, (2) metal shear, (3)
laser-punching machine, (4) MULLER, (5) bending<2m, (6) bending<4m, (7)
Outsourcing, and (8) Others. Workstations 1, 2 and 4 are single-server workstations.
Workstation 3, 5 and 6 are stations with parallel machines (with respectively 3, 2, 2
machines). Workstation 7 is an outsourcing process whose cycle time is not considered
in the simulation and workstation 8 is a general workstation representing all ‘other’
machines in the system. Before each workstation, there is an entity of staging inventory
(IDs 10-17) presenting the work-in-process. Some other entities are: order staging (20),
warehouse (9), measurements (21), Order / flow type / cycle time / setup time data
tables (19, 24, 25-31). The 975 production orders are also represented by atoms in the
system, but they are only produced during model execution, not in the stage of model
generation. The released orders are determined only by the data in the order data table
(ID 19).
Insert Figure 6 here
Page 18 of 38
http://mc.manuscriptcentral.com/tprs Email: [email protected]
International Journal of Production Research
123456789101112131415161718192021222324252627282930313233343536373839404142434445464748495051525354555657585960

For Peer Review O
nly
19
In the production process, each component has a routing (flow type). A routing table
indicates for each flow type (first column) in consecutive columns the sequential atoms
to flow through, identified by their AtomID number. For example, a component with
flow type 1 (routing data ‘1-16-8-15-1-17-7-9’) will be manufactured through the
system with the following sequence: 1) going to WIP inventory 16 and wait for the
process of workstation 8, 2) processed by workstation 8, 3) going to WIP inventory 15
and wait for the process of workstation 1 of HYDRAP, 4) processed by workstation 1,
HYDRAP, 5) going to WIP inventory 17 and wait for outsourcing process, 6)
outsourcing process 7, 7) going to the warehouse (atom ID 9). Most information at this
stage can be entered manually, or can be generated automatically from an ERP database
taking into account the AtomID numbers. In this case we identified a total of 54
different flow types, covering the 382 product types.
Step 2: Data processing of the raw input data
Two of the database tables, ‘Atoms� and �ParameterValues�, can be readily filled in
from the data in the VSM map:
� ‘Atoms’ table: It contains information about the atoms needed for the simulation
model. For instance, the HYDRAP machine in the factory can be represented by
a manufacturing process atom called VSMPROC01 with TypeID 6 in the library.
Its location (X, Y, Z) is (36,0,0) as derived from the drawing, using ED
coordinates and its AtomID (1 in this case) will serve as reference for the
subsequent links that will be generated in the connection tables.
� ‘ParameterValues’ table: This table contains the parameter values. The required
input functionality is programmed into the Access model database using VBA.
The next step is to model the material and information flows as links or ‘channels’
inside the simulation model. Algorithms have been developed to convert raw data into
Page 19 of 38
http://mc.manuscriptcentral.com/tprs Email: [email protected]
International Journal of Production Research
123456789101112131415161718192021222324252627282930313233343536373839404142434445464748495051525354555657585960

For Peer Review O
nly
20
generator database data automatically. We shortly explain the algorithm to generate
atom ‘connections’ as follows.
First we generate a matrix, with as many columns and rows as there are atoms (31 in
our case). A programmed conversion algorithm reads raw data from the routing table,
converting the linear sequence of process steps into pairs of AtomIDs, for every two
consecutive steps. This information is stored in a FROM-TO matrix, but only if the
AtomIDs are present in the model. For example, the values of the first two consecutive
cells of flow type 11 are 10 and 2, representing a move from a storage to an operation
on the metal shear. The algorithm will therefore set the cell (10,2) to value 1. After all
combinations of two consecutive cells are read, the remaining cells are set to 0. The
algorithm then counts the number of input/output connections and generates
input/output channels ids (ic/oc) for each atom. These are written into the
‘AtomConnections’ table automatically. These programmed algorithms are written in
VBA inside the Access database.
Step 3&4: Model generation and execution
Through the model generator, a simulation model is generated automatically in terms
of the data set from the four generator database tables. Figure 7 is a screen shot of the
generated company model (Current State). Note the arcs, denoting the links or channels
that ‘wire’ the model, that were generated. They can be made invisible to enhance visual
inspection of the model.
Insert Figure 7 here
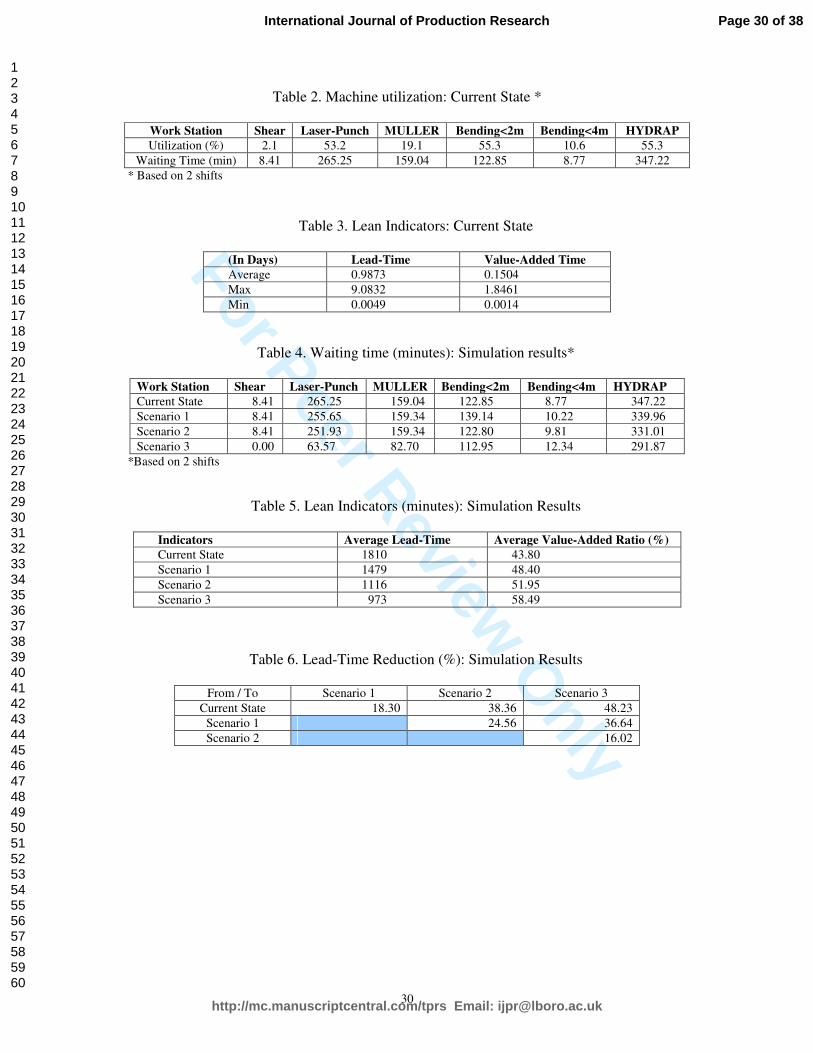
Step 5: Simulation results - Current State
We summarize the simulation output in Table 2 and 3. As we can also see in the
histogram ‘Utilization’ within the model of Figure 7, the utilization of HYDRAP is
high. Its average utilization is 55.3 % and average waiting time of each order is 347.22
Page 20 of 38
http://mc.manuscriptcentral.com/tprs Email: [email protected]
International Journal of Production Research
123456789101112131415161718192021222324252627282930313233343536373839404142434445464748495051525354555657585960

For Peer Review O
nly
21
minutes before it can be processed by HYDRAP. The average order lead-time is 0.987
days and the value-added time is 0.15 days. There are 300 orders that are fulfilled
beyond their due date. This is 31% of the 975 production orders that were released
during three months. This type of diagnostic information is clearly not available in the
static VSM.
Insert Table 2-3 here
Future State mapping of the case
There are seven guidelines to introduce lean thinking into a value stream, according
to Rother and Shook (1999). Applying them to our case study, we introduced the
following changes to our model:
� install supermarkets before HYDRAP, and control the upstream replenishment
processes through a pull system (using Kanbans) for the high-volume products (ten
types). This required introducing new atoms and ‘rewiring’ the information flow.
The material flow basically remains unchanged. The number of atoms increased to
84 in the Future State models, from 31 in the Current State
� synchronize the takt time of production on HYDRAP (the bottleneck) to match the
pace of customer demand by changing the release rate of the production orders.
Because transformation to Lean is best done in small steps we decided to limit the
Kanban-controlled products to ten types only. Our Future State thus forms a hybrid
push-pull system, which is fairly complex to grasp without simulation. The Future State
value stream map of the three scenarios is shown in Figure 8. We explain the scenarios
below.
Insert Figure 8 here
� Current State: 975 push orders.
Page 21 of 38
http://mc.manuscriptcentral.com/tprs Email: [email protected]
International Journal of Production Research
123456789101112131415161718192021222324252627282930313233343536373839404142434445464748495051525354555657585960

For Peer Review O
nly
22
� Scenario 1: Install supermarkets for ten product types before HYDRAP machine.
This leads to 946 push orders and 29 pull orders, being processed together in a
FIFO sequence by the HYDRAP.
� Scenario 2: same as scenario 1, but we now give priority to the kanbans released
from the supermarkets in each of the queues.
� Scenario 3: Same as scenario 2, but now push orders are released according to the
takt time which is defined as the available production time divided by the rate of
customer demand (Womack and Jones 1996; Rother and Shook 1999). For
example, if the customer demand is 160 units per day and the production capacity
is two shifts (16 hours), the production control will only release production
orders worth (approximately) ten units per hour. Pull orders of course will by
definition follow this takt time already.
Summary of simulation results: Current States v.s. Future States
In comparing the Future State simulations with the previous Current State, we can
measure the impact of the switch to lean on order lead-times, queuing times and
machine. The simulation results are shown in Tables 4-6. The queuing times before
machines are reduced significantly, especially for the high utilization machines like
laser-punch and HYDRAP (Table 4). Tables 5 and 6 are the results of 29 orders from
the ten chosen products in the Current State and three Future States. Average lead-times
are decreased nearly by half from current to scenario 3 of the Future State and the
average value-added ratios are raised about 15% (Tables 5-6). The effects of lean are
clearly shown by applying SimVSM to this real case study. It is worth stressing at this
point that the concept of prioritizing Kanban orders was not even contemplated by the
company involved, let alone that the beneficial effects were known in advance. It
Page 22 of 38
http://mc.manuscriptcentral.com/tprs Email: [email protected]
International Journal of Production Research
123456789101112131415161718192021222324252627282930313233343536373839404142434445464748495051525354555657585960
For Peer Review O
nly
23
illustrates the kind of additional information that can only be obtained from a simulation
model. The case study also showed us:
� the validity of the generated models, even for (relatively) large-scale models
based on real-world data
� the correctness of our choice to use the VSM paradigm as basis for our modeling
method, achieving a good balance between the complexity of the models, and
ease of use in the modeling itself
� the value of using simulation in the VSM approach in convincing companies to
adopt Lean as a guiding principle, clearing away much of the ‘uncertainties’ that
otherwise would hinder this adoption or block it altogether
Insert Table 4-6 here
6. Conclusions and further research
This article introduces two new elements to the Value Stream Mapping method of
Rother and Shook. First of all, a formal Value Stream Mapping Paradigm for the
purpose of simulation is defined, and its specifically designed meta-level building
blocks are presented. Second, the integration of simulation with Value Stream Mapping
into the SimVSM method has been developed, the appropriate tools built and tested on a
real life case. The framework and elements of the formal method: atoms, database
structure and model generator, are described and illustrated. Finally, the SimVSM
method is illustrated on a real case from a Belgian company. A Current State model of
the real manufacturing system and three scenarios of Future States are generated to see
the effects of lean by transforming part of the system from push to pull. Because of the
generator approach, making new scenarios, simulating them and discussing the results
with the company people can be done in limited time (typically one afternoon, the same
Page 23 of 38
http://mc.manuscriptcentral.com/tprs Email: [email protected]
International Journal of Production Research
123456789101112131415161718192021222324252627282930313233343536373839404142434445464748495051525354555657585960

For Peer Review O
nly
24
for modelling and discussion of Current State), which we believe is a considerable
improvement in operational modelling. The fact that our method preserves the power
and conciseness of the VSMP enables our method to be used in practice with limited
training or effort.
Through our simulation-based value stream mapping, static VSM maps of Current or
Future States are transformed automatically into dynamic simulation models. The
enhanced information, obtained from the simulation results, can provide feedback to
guide continuous improvements and hopefully will lead more enterprises to a lean
status.
Some focal points of future research will be:
1. Integrate VSM icons into Office templates (i.e. VISIO). After drawing a value
stream map in VISIO, most database tables could then be filled automatically.
2. Study the impact of data aggregation (SKU's into families, detailed routings into
manufacturing cells, etc.) on the results from the VSMP.
3. Focus on the generator technical structure, and broaden its appeal to different
paradigms (other than VSM), also related with manufacturing.
4. Adapt the generator to simulate business processes, using a slightly adapted form
of the VSMP.
Page 24 of 38
http://mc.manuscriptcentral.com/tprs Email: [email protected]
International Journal of Production Research
123456789101112131415161718192021222324252627282930313233343536373839404142434445464748495051525354555657585960
For Peer Review O
nly
25
Acknowledgment
Part of this research was sponsored by the Institute for the Promotion of Innovation
by Science and Technology in Flanders (IWT), whose support is gratefully
acknowledged.
References
Alfieri, A. and Brandimarte, P., 1997. ‘Object-oriented modeling and simulation of
integrated production/distribution systems’. Computer Integrated Manufacturing
Systems, Vol. 10, No. 4, 261-266.
Aytug, H. and Dogan, C., 1998. ‘A framework and a simulation generator for
Kanban-controlled manufacturing systems’. Computer and Industrial Engineering,
34(2), 337-350.
Chen, P., 1976. ‘The entity relationship model – towards a unified view of data’.
ACM Transaction on database systems, 1 (1), 9-16.
Christenson, K. and Dogan, C., 1995. ‘A simulation generator for dual-card Kanban-
controlled flow shops’. International Journal of Production Research, 33(9), 2615-
2631.
Drickhamer, D. (2004), 'Manufacturers like us', IndustryWeek.com, URL:
http://www.industryweek.com.
Engardio, P. and Roberts, D. (2004), 'The China Price', Business Week, European
Edition, December 6, 2004, pp. 42-49.
Hamoen, S.C. and D.J. Moens, 2002. ‘Logistic simulator for steel producing
factories’. Proceedings of the 2002 Winter Simulation Conference.
Hines, P., Rich, N., 1997. ‘The seven value stream mapping tools’. International
Journal of Operations and Production Management, 5(1), pp. 67-72.
Page 25 of 38
http://mc.manuscriptcentral.com/tprs Email: [email protected]
International Journal of Production Research
123456789101112131415161718192021222324252627282930313233343536373839404142434445464748495051525354555657585960

For Peer Review O
nly
26
Hines, P., Rich, N. and A. Esain, 1998. ‘Creating a lean supplier network: a
distribution industry case’. European Journal of Purchasing & Supply Management,
4(1998), pp. 235-246.
Hines, P., Rich N., Bicheno J., Brunt D., Butterworth C., Sullivan J., 1998. ‘Value
stream management’. International of Logistics Management, 9(1), pp. 25-42.
Hines, P. and Taylor, D., 2000. Going Lean. Cardiff, UK, Lean Enterprise Research
Centre Cardiff Business School.
Hopp, W. J. and M.L. Spearman. 1996. Factory Physics: Foundations of
Manufacturing Management, McGraw-Hill.
Incontrol Enterprise Dynamics, B.V., Maarssen, The Netherlands. 2001. Enterprise
Dynamics Software, Enterprise Dynamics User Manual, 4th edition.
Lian, Y.H. and H. Van Landeghem, 2002. ‘An application of simulation and value
stream mapping in lean manufacturing’, Proceedings of 2002 European Simulation
Symposium, Dresden, Germany. October 23-26, 2002.
McDonald, T.N., Van Aken, E.M., Butler, R.M. and Rentes, A.F., 2000. ‘Integration
of simulation and value stream mapping in transformation to lean production’.
Proceedings of 2000 Industrial Engineering Research Conference, Cleveland OH, May
22-24, 2000.
McDonald, T.N., Van Aken, E.M., Rentes, A.F., 2002. ‘Utilizing simulation to
enhance value stream mapping: a manufacturing case application’. International
Journal of Logistics: Research and Applications, 5(2), 213-232.
Oldfather, P.M., Ginsberg, A.S. and Markowitz, H.M., 1966. ‘Programming by
questionnaire: how to construct a program generator’. Rand report, RM-5129-PR, IBM
Corporation, LA, CA.
Page 26 of 38
http://mc.manuscriptcentral.com/tprs Email: [email protected]
International Journal of Production Research
123456789101112131415161718192021222324252627282930313233343536373839404142434445464748495051525354555657585960

For Peer Review O
nly
27
Rahn, R. 2001. ‘Lean manufacturing using computer aided simulation’. IIE Annual
Conference.
Rother, M. and J. Shook. 1999. Learning to See: Value Stream Mapping to Add
Value and Eliminate Muda, Lean Enterprise Institute, Brookline, MA.
Son, Y. J., Jones, A. T. and Wysk, R. A., 2003. ‘Component based simulation
modeling from neutral component libraries’. International Journal of Computer and
Industrial Engineering, 45, 141-165.
Sullivan, W.G., McDonald, T.N. and E. M. Van Aken, 2002. ‘Equipment
replacement decisions and lean manufacturing’. Robotics and Computer Integrated
Manufacturing, 18, 255-265.
Valentin, E.C. and Verbraeck, A., 2001. ‘The use of the building blocks to enhance
flexibility and maintainability of simulation models and simulation libraries’.
Proceedings of 2001 European Simulation Symposium, Ghent, Belgium.
Valentin, E.C. and Verbraeck, A., 2002. ‘Guidelines for designing simulation
building blocks’. Proceedings of the 2002 Winter Simulation Conference.
Van Landeghem, H. and S. Dams. 1995. ‘A holistic IE&PM game: JET game’.
Proceedings of the IEPM'95 Conference, Marrakech, 334-343.
Van Landeghem, H. and M. Debuf. 1997. ‘Supply chain characterization through
Monte Carlo simulation’. Proceedings of the Production Economics Conference,
Goteborg.
Van Landeghem, H. 1998. ‘Experiments with MISTRAL, a supply chain simulator’.
Proceedings of International Workshop, Riga.
Van Landeghem, H., 2005. Benchmarking to survive, a guide to best practices in
production and logistics, (in Dutch), Eurosis, Gent.
Page 27 of 38
http://mc.manuscriptcentral.com/tprs Email: [email protected]
International Journal of Production Research
123456789101112131415161718192021222324252627282930313233343536373839404142434445464748495051525354555657585960

For Peer Review O
nly
28
Whitman, L.; R. Underdown; and M. Deese. 2001. ‘A physical demonstration of lean
concepts’. IIE Annual Conference.
Womack, J.; D. Jones; and D. Roos. 1990. The Machine that Changed the World –
The History of Lean Production, Harper Perennial, New York.
Womack, J. and D. Jones. 1996. Lean Thinking – Banish Waste and Create Wealth in
Your Corporation, Simon & Schuster, New York.
Page 28 of 38
http://mc.manuscriptcentral.com/tprs Email: [email protected]
International Journal of Production Research
123456789101112131415161718192021222324252627282930313233343536373839404142434445464748495051525354555657585960

For Peer Review O
nly
29
Table 1. Value Stream Mapping Paradigm and its VSM Atoms
VSM Class Functionality Description VSM Icon VSM Atoms (ID)
(A) Basic Flow Units
Product � T050-a-Product (19)
Kanban � T059-a-Container (16)
(B) Flows
Information � Atom mechanism
� T059-a-Container (16)
Push Natural flow movement
1. Basic Flow Unit
Entities and Flows
The unit objects that pass
through or detain in other
categories of entities. The
movements of these unit
objects form the flows of the
system.
Pull � VSMOPRO01 (8)
� T059-a-Container (16)
Process box � VSMPROC01 (6)
� VSMMPRO01 (18)
Outside
source
� VSMSUPP01 (5)
� VSMCUST02 (10)
Supermarket � VSMSUPR02 (1)
2. Physical Entities Tangible objects in the
system, one-to-one (or
many-to-one) with real
situations.
Safety
Stock
� VSMSTOR01 (2)
Buffer � VSMSTAG01 (4)
� VSMPALL01 (7)
Kanban
Wall
� VSMKSTA01 (3)
3. Buffer Entities Objects that can be only
logical existence or the
actual ones in the system.
Kanban
Post
� VSMKWAL01 (9)
Production
control
� VSMCUST02 (10)
� T098-Table (15)
� VSMOPRO01 (8)
4. Flow Control
Entities
Objects that are needed to
control the simulation flows
such as push, pull, unpack
the products from a container
(box), flow separation and
flow termination, etc.
Others � T007-d-Unpack (12)
� T009-b-Splitter (17)
� T054-a-Sink (14)
Data Box � Atom Parameters
� T098-Table (15)
5. Data Table and
Measurement
Objects that are needed to
provide data for simulation
execution and extract or
monitor data from that due to
ED requirement.
Timeline � VSMDATA01 (11)
� T090-b-Monitor (13)
� ED Report
Page 29 of 38
http://mc.manuscriptcentral.com/tprs Email: [email protected]
International Journal of Production Research
123456789101112131415161718192021222324252627282930313233343536373839404142434445464748495051525354555657585960
For Peer Review O
nly
30
Table 2. Machine utilization: Current State *
Work Station Shear Laser-Punch MULLER Bending<2m Bending<4m HYDRAP
Utilization (%) 2.1 53.2 19.1 55.3 10.6 55.3
Waiting Time (min) 8.41 265.25 159.04 122.85 8.77 347.22
* Based on 2 shifts
Table 3. Lean Indicators: Current State
(In Days) Lead-Time Value-Added Time
Average 0.9873 0.1504
Max 9.0832 1.8461
Min 0.0049 0.0014
Table 4. Waiting time (minutes): Simulation results*
Work Station Shear Laser-Punch MULLER Bending<2m Bending<4m HYDRAP
Current State 8.41 265.25 159.04 122.85 8.77 347.22
Scenario 1 8.41 255.65 159.34 139.14 10.22 339.96
Scenario 2 8.41 251.93 159.34 122.80 9.81 331.01
Scenario 3 0.00 63.57 82.70 112.95 12.34 291.87
*Based on 2 shifts
Table 5. Lean Indicators (minutes): Simulation Results
Indicators Average Lead-Time Average Value-Added Ratio (%)
Current State 1810 43.80
Scenario 1 1479 48.40
Scenario 2 1116 51.95
Scenario 3 973 58.49
Table 6. Lead-Time Reduction (%): Simulation Results
From / To Scenario 1 Scenario 2 Scenario 3
Current State 18.30 38.36 48.23
Scenario 1 24.56 36.64
Scenario 2 16.02
Page 30 of 38
http://mc.manuscriptcentral.com/tprs Email: [email protected]
International Journal of Production Research
123456789101112131415161718192021222324252627282930313233343536373839404142434445464748495051525354555657585960
For Peer Review O
nly
31
Model Generator
Simulation models
Database Atoms
VSM map
Current or FutureSystem
Visualization &Output Analyzing
draw
transform to
compose & generate
run
modularize
Picked outread inFeedback
&
Improvement
Describe entities & flows
of VSM by a specificstructure
Correspond with VSMicon functions
Figure 1. Formal method framework
Page 31 of 38
http://mc.manuscriptcentral.com/tprs Email: [email protected]
International Journal of Production Research
123456789101112131415161718192021222324252627282930313233343536373839404142434445464748495051525354555657585960

For Peer Review O
nly
32
Figure 2. Supermarket (VSMSUPR02) atom formalism
Delivery
Create initial kanbans (K) in the supermarket
Let k=K
Repeat
(
a demand trigger
Check if [x i /M] <= k
if yes
do
(
open output chann el(deliver the demand)
close output channel after delivery
k= k- [xi /M]; h=[xi /M]
send a replenish trigger (#empty kanbans h) to upstream WC
replenishments (k=k+h)
)
Else
wait for replenishments (k=k+h)
)
Supermarket (one tray)
BACKLOG
Non-Empty
KANBAN
(3) Products
(1) Demand
Trigger from outside
Fulfill the order
Upstream
Work Center
(Production)
Production KB Wall Replenish trigger
(5) Products
Replenishment
(I) Constants1. Size of a Kanban: M (e.g. M=10 units)2. Number of Initial Non -empty Kanbans: K3. Number of Products: N (for multi -trays)
(II) Variables
1. Demand of Product i : xi (i=1...n)
2. Number of Non -empty Kanbans: k (k�Integer)
3. Number of Empty Kanbans: h (h�Integer)
(III) Attributes
1. Product ID (Product Type): i=1,2,...n (for
multi-trays)
PARA
ME
TERS
:
L
OGIC
:
xi /M
h
h×M
x i
Withdraw
h
Order-Process
(Withdraw)
Order-Process
(Withdraw)
(6) Full KBsFill Empty KBs
h
Empty
KANBAN
Staging
[x /M]h=
Empty
KANBAN
(4)MaterialWithdraw
(1) Empty Kanbans
(2) Withdraw Kanbans
(3)WithdrawKanbans
Withdraw
(IV) Channels Input Channels
Output Channels
(2) Production Kanbans
x i
k
Page 32 of 38
http://mc.manuscriptcentral.com/tprs Email: [email protected]
International Journal of Production Research
123456789101112131415161718192021222324252627282930313233343536373839404142434445464748495051525354555657585960
For Peer Review O
nly
33
Receive full
kanbans
Kanban Staging(VSMKSTA01)
Withdraw
(VSMORPO01)
Supermarket
(VSMSUPR02)
Withdraw
(VSMORPO01)
Send empty
kanbans
Send products
1
1
1 1 1 1
Production
Kanban Wall(VSMKWAL01)
Send empty
kanbans
Send
productionkanbans
Send
productionorders
Upstream WC(VSMPROC01)
Send products
M
11
M
1
1
11
Customer(VSMCUST01)
Backlog Queue(VSMSTAG01)
Send demand
when available
Releasedemand
N
M
1
1
Figure 3. A simple ER-diagram of atoms related to supermarket atom
Page 33 of 38
http://mc.manuscriptcentral.com/tprs Email: [email protected]
International Journal of Production Research
123456789101112131415161718192021222324252627282930313233343536373839404142434445464748495051525354555657585960

For Peer Review O
nly
34
Figure 4. Database structure
Generator
�Atoms�
AtomID, Name,
TypeID, Location
�AtomChannels�
AtomID, Icnumbers,
OC numbers
�ParameterValues�
AtomID, TypeID,
DescriptorID,
Parameter Values
�AtomConnections�
From (AtomID),
Ocnumber, To,
ICnumber
�AtomInfoPerType�
TypeID, DescriptorID
Simulation
Model
�
�
�
�
generate generate
VSM Data
Box
�TypeInfo�
TypeID, LibName
�ParameterDescriptors�
DescriptorID,
DescriptorName
Output Database Tables
Me
ta-M
od
elD
ata
ba
se
Ta
ble
sG
en
era
tor
Da
tab
ase
Ta
ble
s
Input Database Tables
Model data
Run data
Page 34 of 38
http://mc.manuscriptcentral.com/tprs Email: [email protected]
International Journal of Production Research
123456789101112131415161718192021222324252627282930313233343536373839404142434445464748495051525354555657585960

For Peer Review O
nly
35
Correct Raw Input Raw Data Processing Model generation Model execution Simulation results
- Draw a VSM Map
- Routings Table
- Setup Time Table
- Cycle Time Table
- Generator Tables
*Atoms
*Connections
*Channels
*Parameter
Values
- Converting
Algorithms
- Run Data (MRP or
Pull Orders)
Measurements:
- Order LT
- VAT
- VA Ratio
- Utilization
- Queue (Waiting
Time)
- Atoms (Building Block)
- A Model Generator
Figure 5. Modeling procedure of the simulation-based VSM formal method
Page 35 of 38
http://mc.manuscriptcentral.com/tprs Email: [email protected]
International Journal of Production Research
123456789101112131415161718192021222324252627282930313233343536373839404142434445464748495051525354555657585960

For Peer Review O
nly
36
Figure 6. Current State of the Value Stream Map of the company case (31 entities)
Metal Shear (2)
LaserPunch (3-1)
LaserPunch (3-2)
LaserPunch (3-3)
Muller (4)
Bending 2m (5-1)
Bending 2m (5-2)
Bending 4m (6-1)
Bending 4m (6-2)
HYDRAP (1)
Others (8) Outsourcing (7)
Warehouse
(9)10
11
12
13
14
15
1716
Production Control (18)
Order data box (19)
Flow Type data box
(24)
CO / CT data box
(25-31)
F.G
(22)
measurements
(21)
Monitor
(23)
(20) Order
Staging
Tra
nsp
ort
atio
n Transportatio
n
Page 36 of 38
http://mc.manuscriptcentral.com/tprs Email: [email protected]
International Journal of Production Research
123456789101112131415161718192021222324252627282930313233343536373839404142434445464748495051525354555657585960

For Peer Review O
nly
37
Figure 7. A screenshot of the running generated simulation model inside ED
Figure 7. . A screenshot of the running generated simulation model inside ED
Page 37 of 38
http://mc.manuscriptcentral.com/tprs Email: [email protected]
International Journal of Production Research
123456789101112131415161718192021222324252627282930313233343536373839404142434445464748495051525354555657585960

For Peer Review O
nly
38
Figure 8. Future State of the Value Stream Map of the company case (84 entities)
Metal Shear (2)
LaserPunch (3-1)
LaserPunch (3-2)
LaserPunch (3-3)
Muller (4)
Bending 2m (5-1)
Bending 2m (5-2)
Bending 4m (6-1)
Bending 4m (6-2)
HYDRAP (1)
Others (8) Outsourcing (7)
Warehouse
(9)10
11
12
13
14
15
1716
Production Control (18)
Order data box (19)
Flow Type data box
(24)
CO / CT data box
(25-31)
F.G
(22)measurements
(21)
Monitor
(23)
(20) Order
Staging
Tra
nsp
ort
atio
n Transportatio
n
Customer Pull Orders
(32)
Order data box (33)
(34) PullOrder Staging
Supermarket
(35-84)
Page 38 of 38
http://mc.manuscriptcentral.com/tprs Email: [email protected]
International Journal of Production Research
123456789101112131415161718192021222324252627282930313233343536373839404142434445464748495051525354555657585960
Recommended