An Overview of the Tapia Canyon Field
Static Geocellular Model and Simulation Study
Prepared for Sefton Resources Inc.
Jennifer Dunn, Chief Geologist Petrel Robertson Consulting Ltd.
Outline • Background • Definition of a Static Geocellular Model • Methodology for Model Creation
– Reviewing inputs – Interpretation – Model finalization – Work to date – Preparation for simulation software
• Conversion to a Dynamic Model – History match – Expected Timeframe
• Definition of the Simulation Process – Expected Timeframe
• Expected Outcomes

Background
• To date, three static geocellular models have been created in the Tapia Canyon Field by Petrel Robertson Consulting: – Hartje - Central Fault block – 2011 Full Field Model – 2012 Revised Full Field Model
• Steam Flood Simulation efforts on these models are underway and expected to be complete in 2013.
• Steam Flood Simulation is being conducted in CMG STARSTM software by Dr. Farouq Ali.

This is a 3D view of the 2011 Full Field Model

• Modelling and Simulation work are complex and iterative process
• This presentation seeks to outline: – The modelling process – Project timeframes – Simulation efforts
Figure from Riordan, 2009

Definition of a Static Geocellular Model • A static geocellular model captures a snapshot of the field at a moment
in time
-Usually the initial conditions of the field before production
• A geologic model incorporates all known and interpreted geologic and geophysical data available to the modelling team
• It can be a product in itself, useful for well planning for example
• It can be a basis for simulation efforts
• It is a 3-Dimensional grid representing the field separated into many tens of thousands of grid data cells.
• The data in each cell is a representation of the properties of the rock and fluids at that point in space.
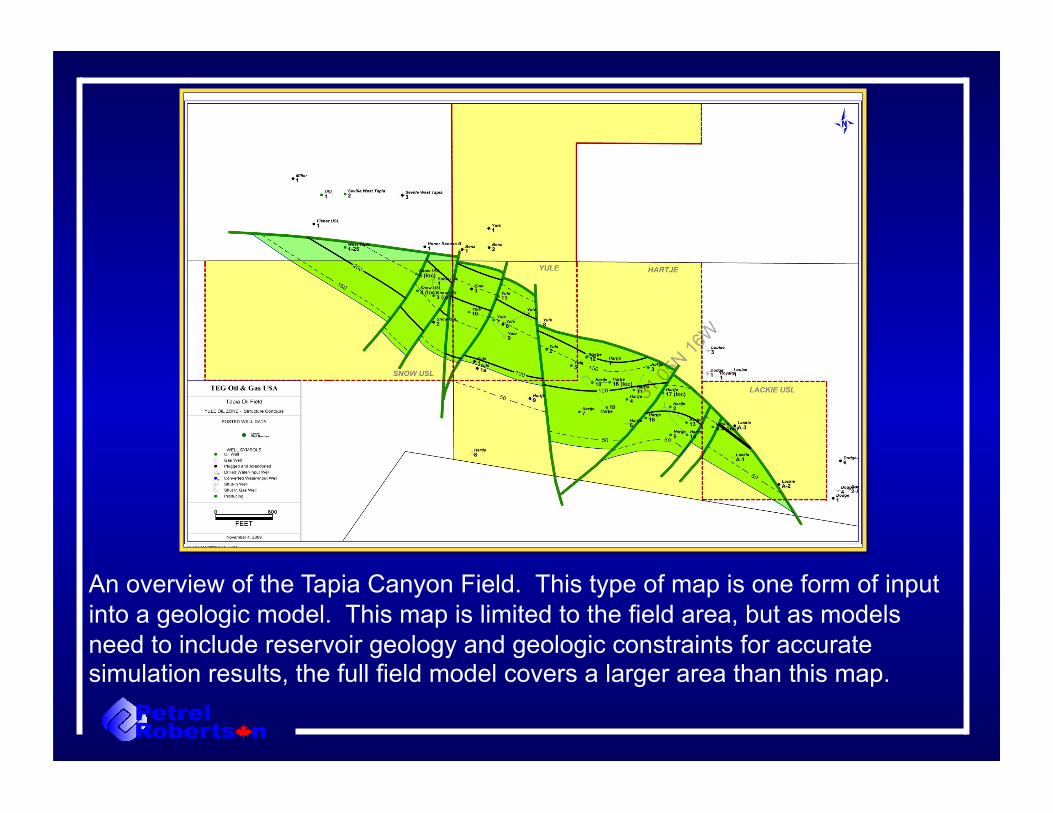
An overview of the Tapia Canyon Field. This type of map is one form of input into a geologic model. This map is limited to the field area, but as models need to include reservoir geology and geologic constraints for accurate simulation results, the full field model covers a larger area than this map.

Methodology
• Petrel Robertson Consulting uses PetrelTM software, an industry leading modelling product created by Schlumberger
• Inputs into the model must first be validated
• Data are then interpreted
• The model is created by our team of geocellular modelling specialists. – Our geomodellers have a background in geology, and familiarity
with geostatistics and geophysics – this particular case also used a specialist in clastic sedimentology (the Tapia Field’s oil is contained within a clastic rock)
Methodology – Reviewing Inputs • Before the model can be created, data need to be understood and
qualified
• In 2011, as part of the Hartje and Full Field Models, Petrel Robertson Consulting – Reviewed and petrophysically interpreted 73 wells to get a complete
geologic picture adequate for simulation
• Well data were of varying quality which affected the modelling process
– Well data had to be digitized, and then interpreted, this included:
• Calculating porosity
• Calculating water and oil saturation
• Verifying formation tops
• The complexity, amount and quality of the data will control how long this process takes – in this case about a three month’s total time prior to model creation (Jan-April 2011)

An example of the Petrophysical analysis conducted prior to model creation.
This allows an understanding of porosity, water saturations, and lithologies - all of which are necessary inputs to the model.
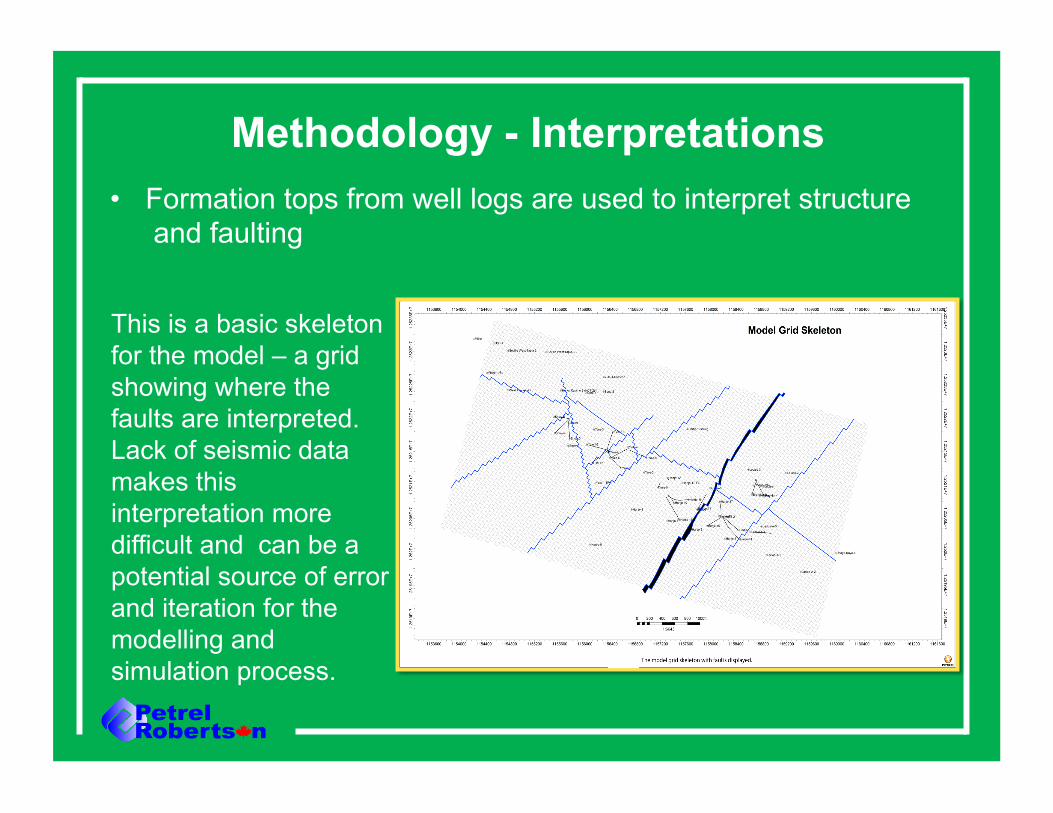
Methodology - Interpretations • Formation tops from well logs are used to interpret structure
and faulting
This is a basic skeleton for the model – a grid showing where the faults are interpreted. Lack of seismic data makes this interpretation more difficult and can be a potential source of error and iteration for the modelling and simulation process.
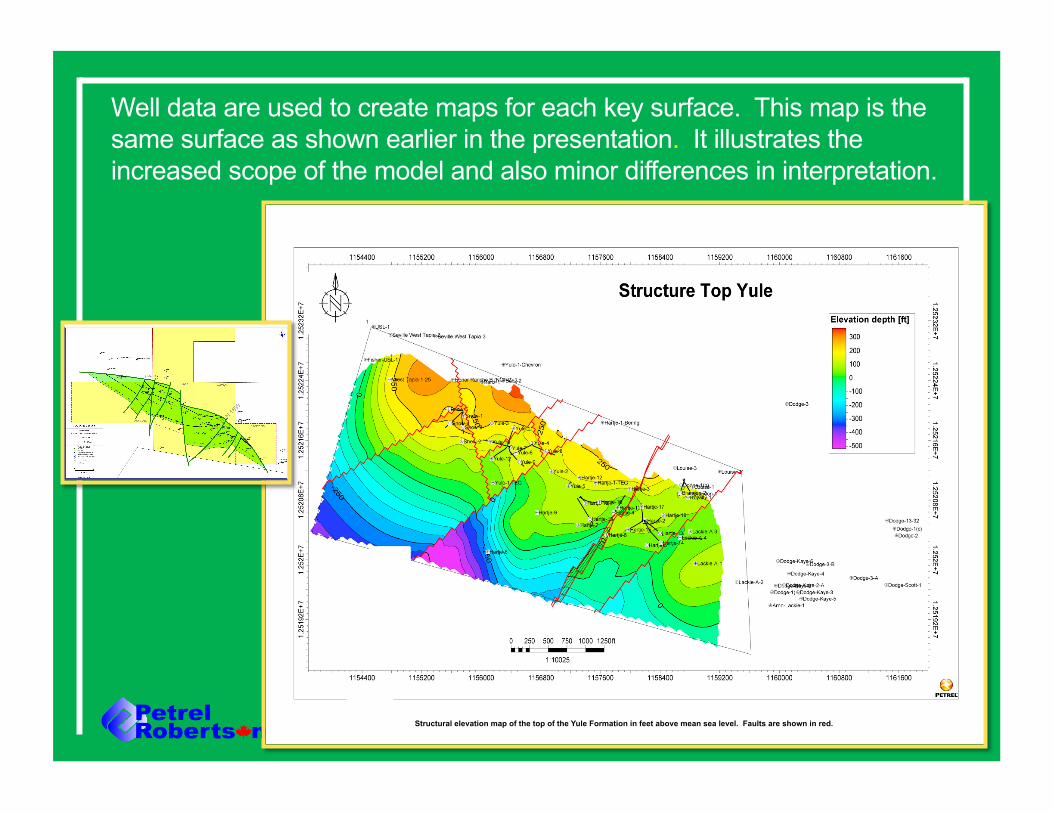
Well data are used to create maps for each key surface. This map is the same surface as shown earlier in the presentation. It illustrates the increased scope of the model and also minor differences in interpretation.
Structural elevation map of the top of the Yule Formation in feet above mean sea level. Faults are shown in red.

Methodology - Interpretations • Production data are incorporated to help with fault
interpretation and fluid contact interpretation
The varying contacts help define which fault blocks are connected within the field.
Steam flood simulation work will be essential for helping define faults.

Methodology – Interpretations • Distribution of Reservoir Facies are interpreted. This process
requires geologic interpretation and the results of the petrophysical analysis.
Each facies has a calculated range of porosity and permeability determined from core and log analysis, and modelled with geostatistics.
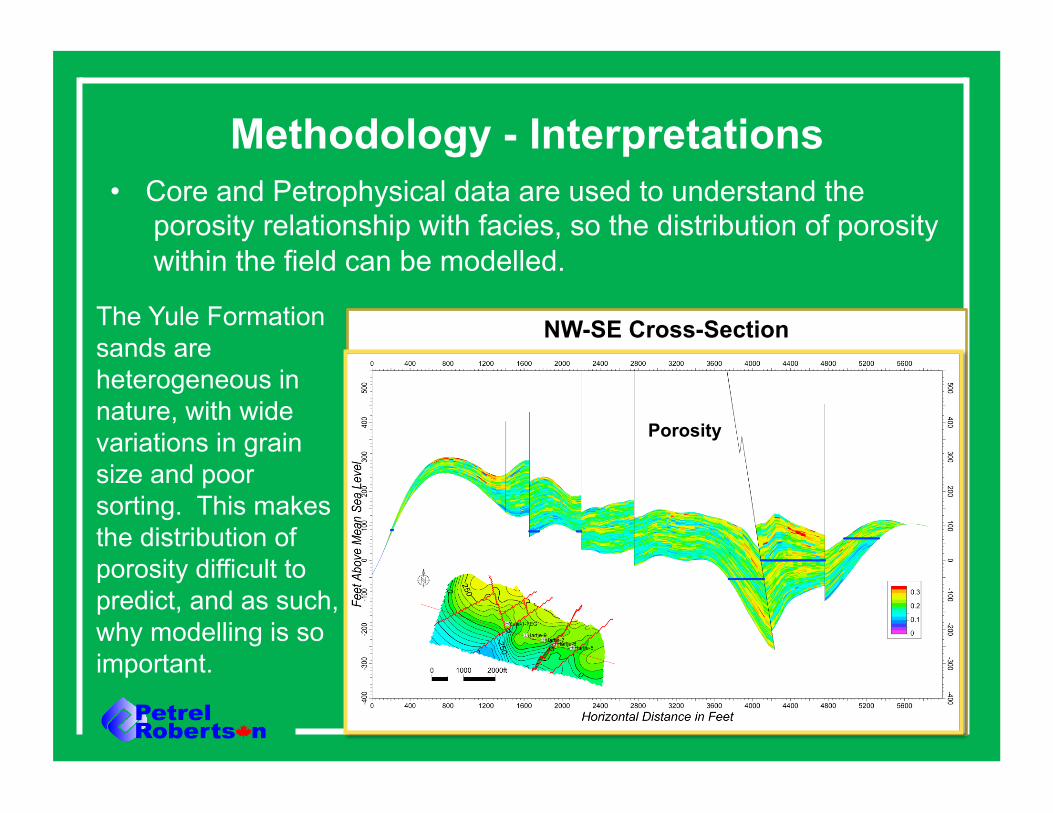
Methodology - Interpretations • Core and Petrophysical data are used to understand the
porosity relationship with facies, so the distribution of porosity within the field can be modelled.
The Yule Formation sands are heterogeneous in nature, with wide variations in grain size and poor sorting. This makes the distribution of porosity difficult to predict, and as such, why modelling is so important.
NW-SE Cross-Section
Porosity
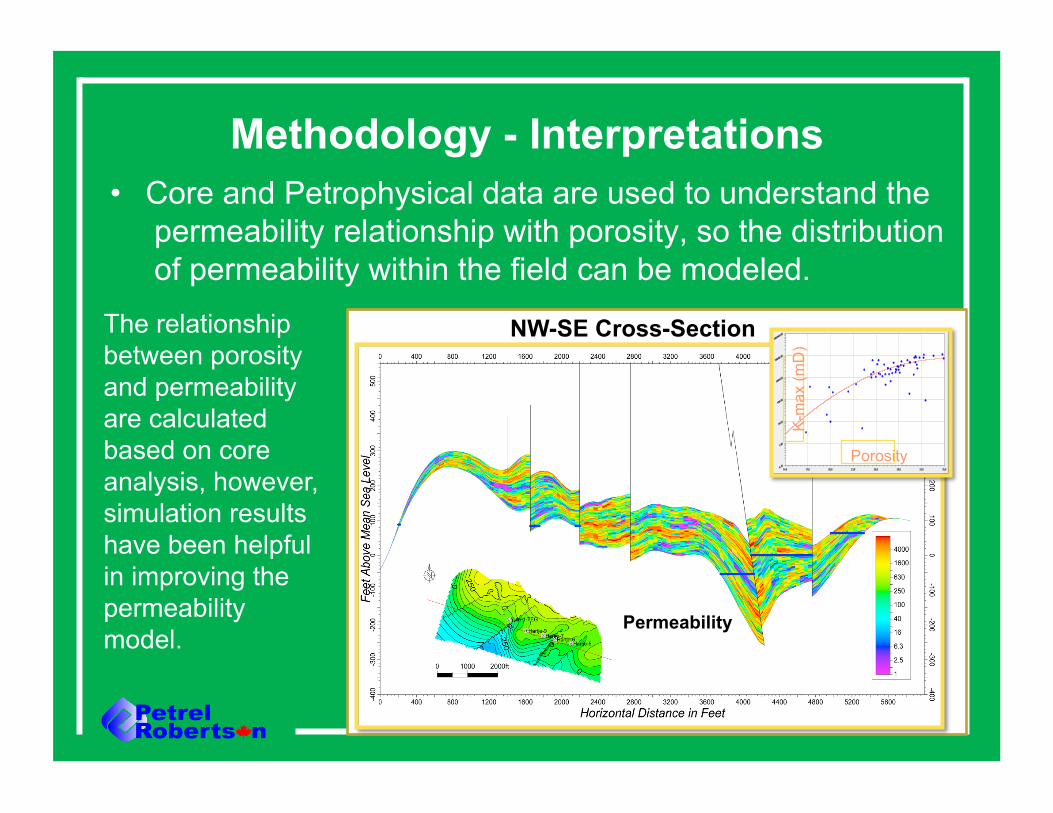
Methodology - Interpretations • Core and Petrophysical data are used to understand the
permeability relationship with porosity, so the distribution of permeability within the field can be modeled.
The relationship between porosity and permeability are calculated based on core analysis, however, simulation results have been helpful in improving the permeability model.
NW-SE Cross-Section
K-m
ax (m
D)
Porosity
NW-SE Cross-Section
Permeability

Methodology – Interpretations • Water Saturation distribution is calculated from petrophysical
analysis combined with facies and porosity distributions
Older vintage well logs increase uncertainty in water saturation calculations. This is an area where history matching during simulation may provide valuable input to the geologic model. History matching can be a tedious, time-consuming process.
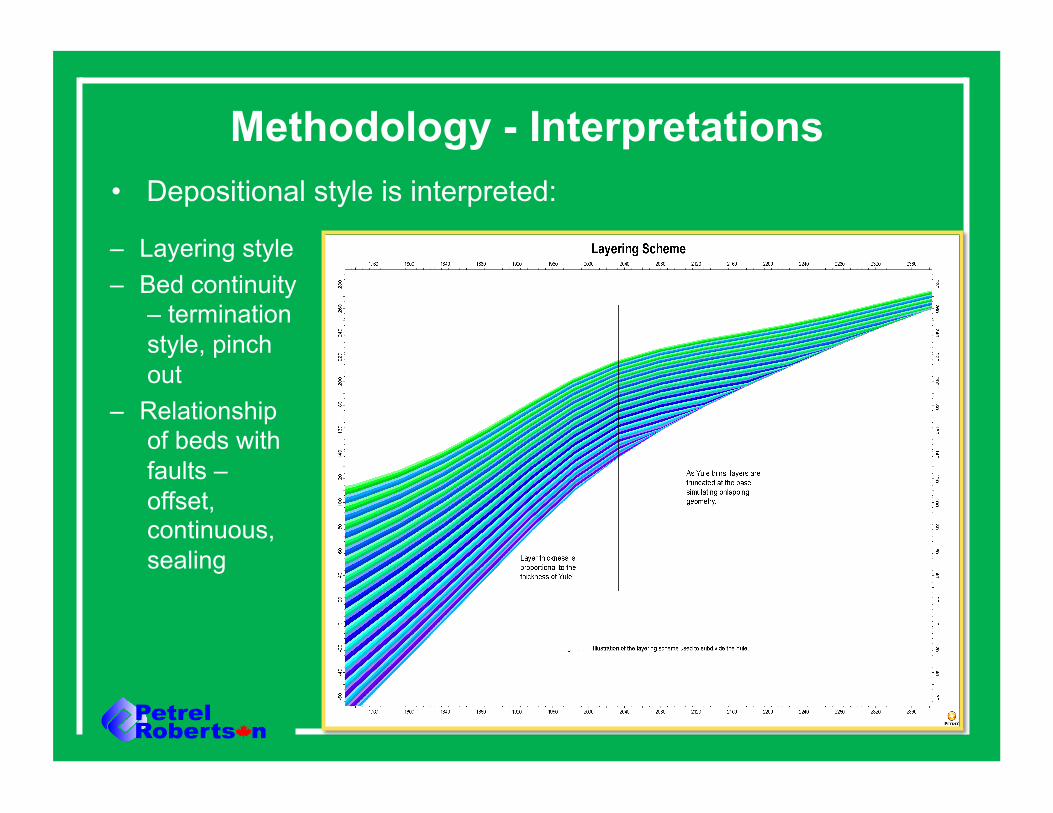
Methodology - Interpretations
– Layering style – Bed continuity
– termination style, pinch out
– Relationship of beds with faults – offset, continuous, sealing
• Depositional style is interpreted:

Summary: Methodology - Interpretations • Formation tops from well logs are used to understand
structure and faulting.
• Production data are incorporated to help with fault interpretation and fluid contact interpretation.
• Distribution of Reservoir Facies are interpreted.
• Core and Petrophysical data are used to understand the porosity and permeability relationships.
• Water Saturation distribution is calculated from petrophysical analysis combined with facies and porosity distributions.
• Depositional style is interpreted.

Model Finalization
• Once all of the inputs to the model have been verified and interpreted, the model can be used to generate data meaningful for development:
– Gross Pay within the Yule Formation
– Net Pay within the Yule Formation (using a 10mD permeability cutoff)
– Hydrocarbon Pore Volumes and Original Oil In Place (OOIP) calculations


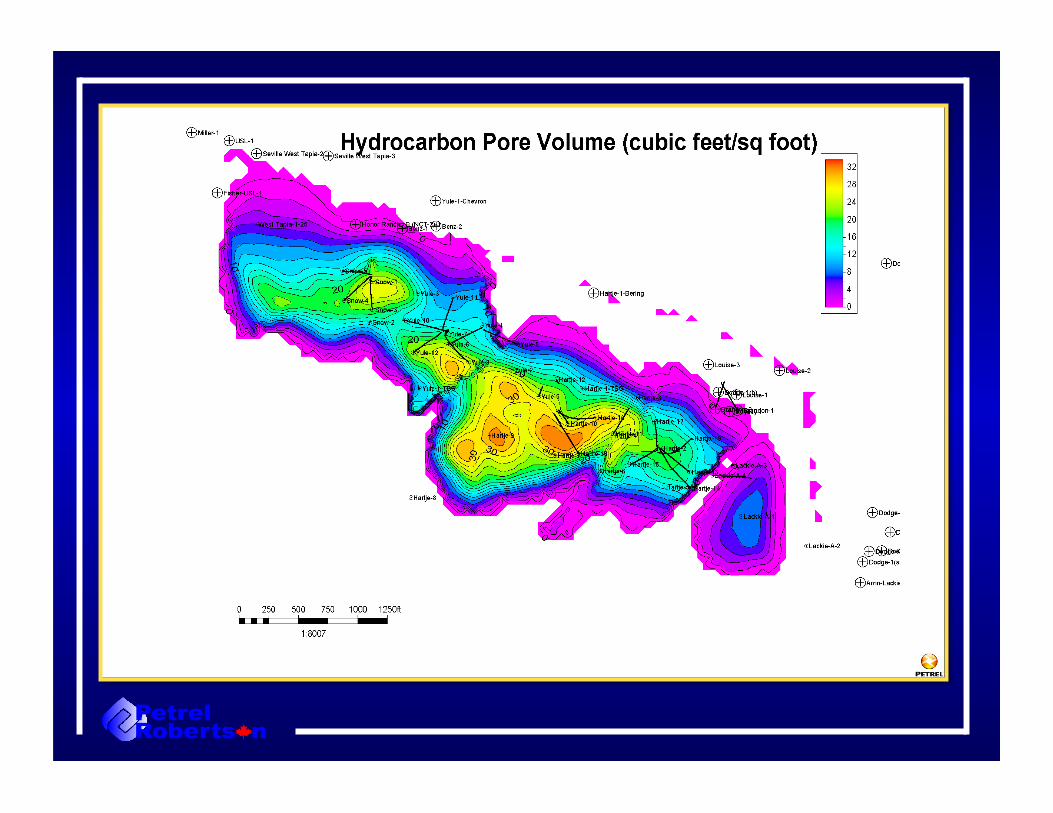

Top down view of a layer within the Yule formation showing well paths

Work to Date • Three months to process and analyse input data to model
• One month to create Hartje model
• One month to iterate with simulation software – The Hartje model is small and simplistic, so this process moved quickly
– The Hartje model is deemed inadequate to render usable simulation results
• Three months to create Full Field model
• Drilling program for 2011 commenced, decision was made to incorporate 2011 data prior to finalizing simulation – Final data from 2011 wells received in June 2012
• Revised Full Field Model signed off in September 2012

Preparation of Model for Simulation • Geocellular Models are incredibly complex and consist of many
cells, each containing multiple pieces of data. The Tapia Canyon Revised Full Field Model contains – Over 400,000 cells each 50ft x 50ft in area and a minimum of 1 foot in
thickness
– There are more than 90 layers within the model to represent the Yule Formation
• Simulation software would be unable to process this volume and complexity of data, so the model is ‘upscaled’.
• Upscaling is a compromise between maintaining the integrity of the geologic interpretation and making simulation efforts possible – The upscaled 2012 Revised Full Field model has 186,000 cells
– The upscaling requirements are dependent on the simulation software, computer hardware and project timeline

Conversion to a Dynamic Model • A static geocellular model reflects a snapshot of the field at one time –
initial conditions.
• A dynamic model reflects the changes to the field through time – for example, changes in saturations and contacts related to the effects
of production. • Simulations predict what will happen to the field in the future under certain
conditions – This can help understand what may happen during field development.
• Understanding what has happened in the past (history matching) is critical to success.
• At this point the upscaled geologic model is imported into the simulation software and conversion to a dynamic model can begin.
• The dynamic model is created by the simulation engineer.
Conversion to a Dynamic Model
• Engineering and Field data must be added to the static model. This will include production histories, pressure data, etc.
• Tapia Canyon Field has over 50 years of production history, making incorporating this data incredibly complex.
• As the Dynamic Model is created, input from the model may guide interpretation and result in changes to the Static Model.

Conversion to a Dynamic Model
• The Dynamic Model may provide data and inform interpretations on: – Structure – what parts of the field are in pressure communication with
each other? – Permeability – how soon do wells show pressure communication? – Water Saturation – how quickly do fluid contacts move? or water
production increase? – Heterogeneity/Anisotropy – is there a directionality to the field, or
distribution of the porosity and permeability that becomes evident with changes in pressure data?
• This may result in iterations between the static and dynamic models. It is imperative that the Geomodeller and Simulations Engineer work closely together

• History matching of the field’s production data is a critical step prior to forward looking simulation efforts
• Iteration with the static model may be required
• In a field with this much history, this process may be up to 90% of the simulation engineer’s work and project timeline
• History matching is conducted by repeatedly “running” the simulation software using the combined geologic and engineering data, until the results of the simulation from initial production to present day match. – The Tapia Canyon Revised Full Field model contains so much data
that each run takes 4-5 days to complete
Conversion to a Dynamic Model: History Matching
Timeframe
• Upload of static model and input of engineering data - 1 month
• History matching of production data – may take up to 2 to 3 months (as of November 2012, history matching is underway on the Revised Full Field model)
• Dynamic model is complete
• Simulation efforts can begin - up to 3 to 6 months, depending on number of scenarios
• Multiple development scenarios and variables will be considered to find the best fit for increased recovery with managed costs
The Simulation Process • Simulation allows a forward look for a field – a peek into the
future for different development scenarios
• Once the Dynamic Model is created, various scenarios can be investigated with simulation, including: – What are the effects of a continuous steam flood?
– How much steam would be required for injection and at what pressures?
– What would be the optimal position of injectors?
– What incremental recovery could be expected?
– How much would the different development scenarios cost?
• Finally development recommendations can be made, looking at the economic value of the different scenarios

The Simulation Process • Each scenario run within the simulation software may take days
to weeks of computer time to complete – Most full field optimization simulations will require 20-30 scenarios to be
investigated
• If alternate scenarios are investigated, this would add to total time. For example – What is the incremental recovery of a water flood versus a steamflood?
– What is the value of continuous steam versus cyclic steam
– Is there potential for a gas flood? And if so what type of incremental recovery would this provide?
– What are the economics for each of these different options
• Completion of Simulation Scenarios may take up to 3-6 months
• Interpretation of the results will follow

Timeframe: Going Forward • Completion of the Dynamic Model of the Tapia Canyon Field is almost
complete
• History match in process
• Simulation scenarios for full field optimization are expected to commence by December of 2012 (after history match completed).
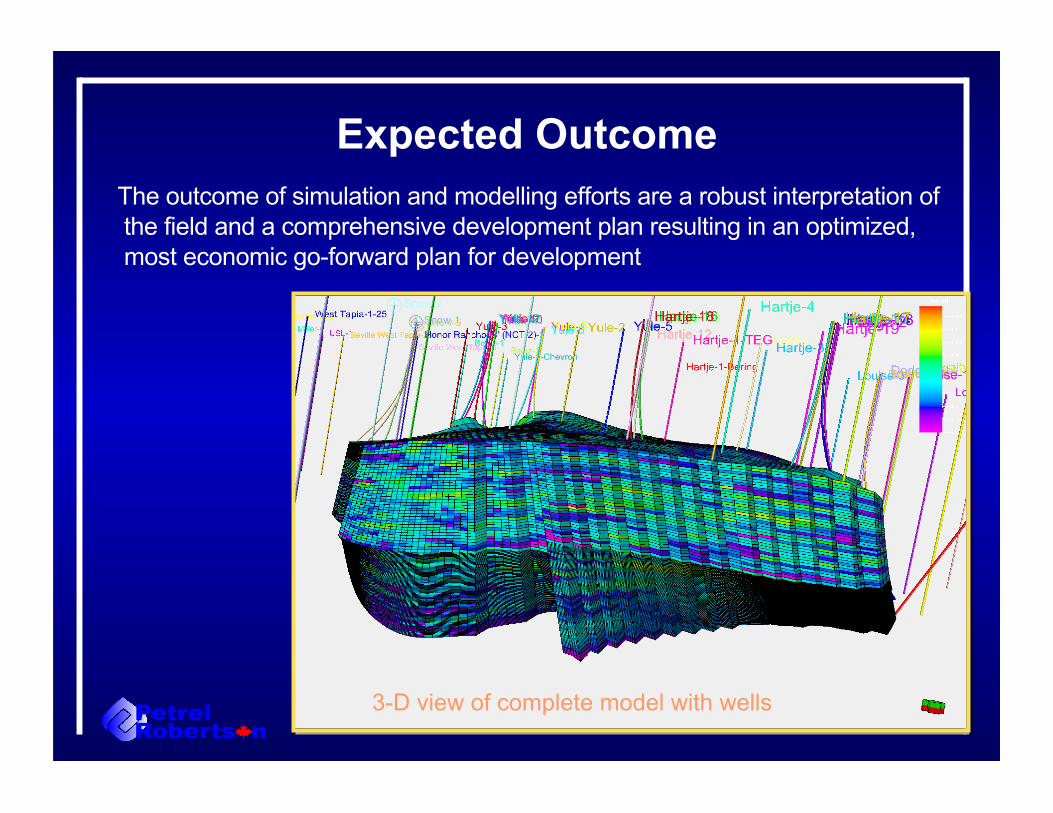
Expected Outcome The outcome of simulation and modelling efforts are a robust interpretation of the field and a comprehensive development plan resulting in an optimized, most economic go-forward plan for development
3-D view of complete model with wells

APPENDIX

2012 Revisions to the Full Field Model • Drilling of three new wells
verified the robust nature of the model – tops were very close to values predicted by 2011 model.
• Two new core were collected. This allowed:
– An update to the porosity and permeability models
– Inclusion of additional core data from the field
2012 Revisions to the Full Field Model
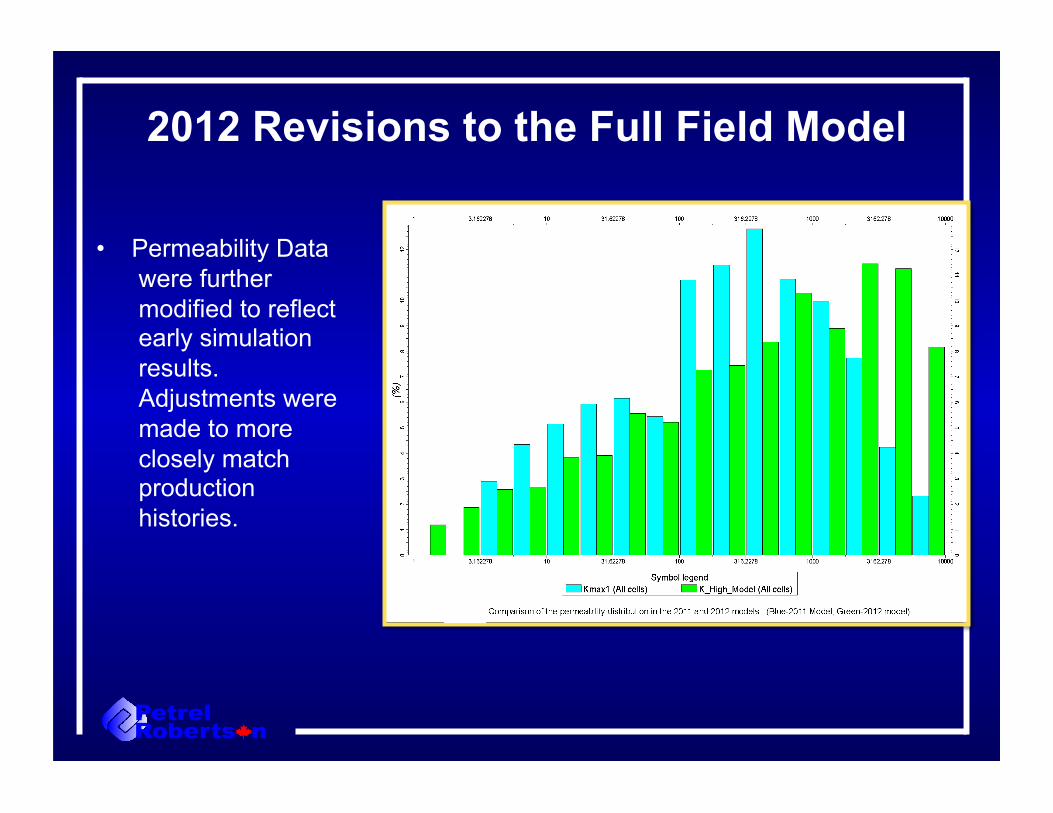
• Permeability Data were further modified to reflect early simulation results. Adjustments were made to more closely match production histories.
2012 Revisions to the Full Field Model
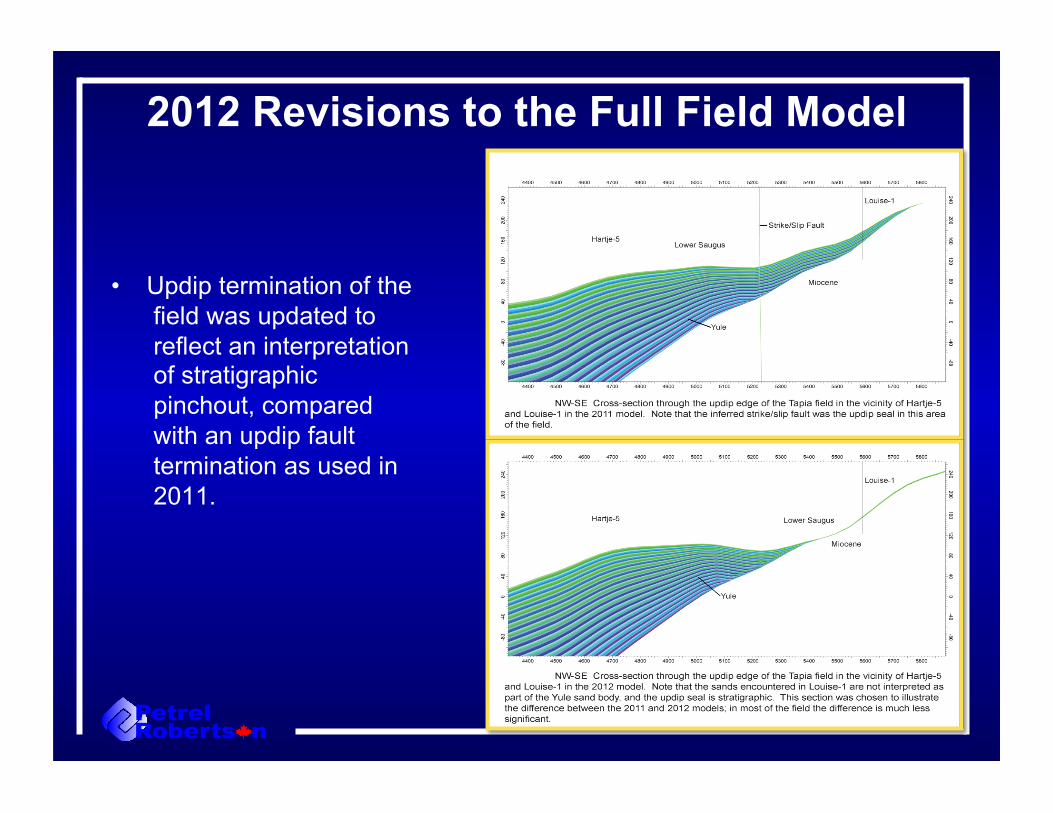
• Updip termination of the field was updated to reflect an interpretation of stratigraphic pinchout, compared with an updip fault termination as used in 2011.

Summary: Revisions to Full Field Model • Drilling of three new wells verified robust nature of the model – tops
were very close to predicted values by 2011 model • Two new core were collected. This allowed:
– An update to the porosity and permeability models
– Inclusion of additional core data from the field
• Permeability Data were conditioned to reflect early simulation results. Adjustments were made to more closely match production histories.
• Updip termination of the field was updated to reflect an interpretation of stratigraphic pinchout, compared with an updip fault termination as used in 2011.
Recommended