Member of the World Economic Forum Global Agenda Council
60
200
Countries
Occasions
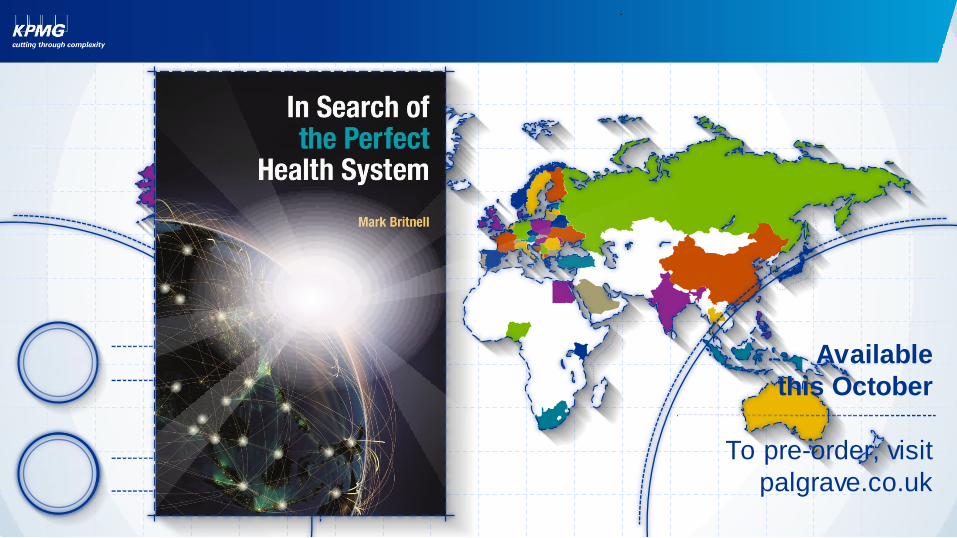
Available
this October
To pre-order, visit
palgrave.co.uk
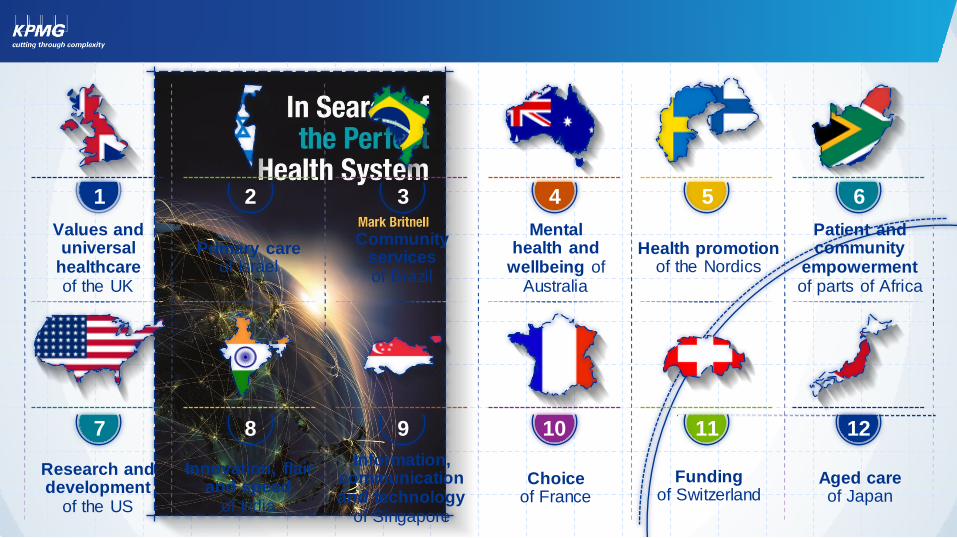
Values and universal
healthcare of the UK
Primary care of Israel
Community services of Brazil
Mental health and
wellbeing of Australia
Health promotion of the Nordics
Patient and community
empowerment of parts of Africa
Research and development
of the US
Innovation, flair and speed
of India
Information, communication and technology
of Singapore
Funding of Switzerland
Choice of France
Aged care of Japan
1 2 4 5 6
7 8 9 10 11 12
3
An overview of the
Mexican health system
Eduardo González Pier
Undersecretary of Integration and Development of the Health Sector September 2nd, 2015
5
Outline
Introduction
Health challenges
Health system response
Takeaways
6
Health challenges
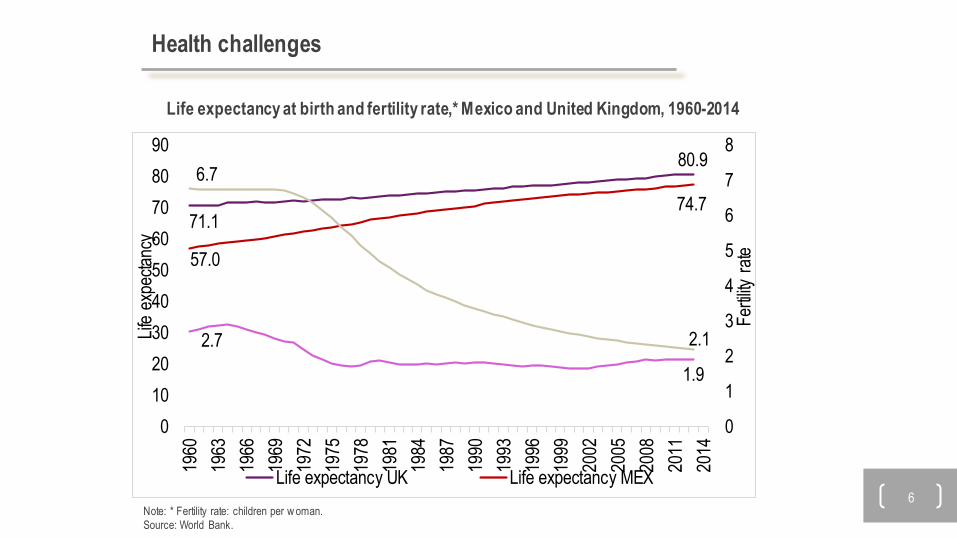
Note: * Fertility rate: children per w oman.
Source: World Bank.
Life expectancy at birth and fertility rate,* Mexico and United Kingdom, 1960-2014
71.1
80.9
57.0
74.7
2.7
1.9
6.7
2.1
0
1
2
3
4
5
6
7
8
0
10
20
30
40
50
60
70
80
90
1960
1963
1966
1969
1972
1975
1978
1981
1984
1987
1990
1993
1996
1999
2002
2005
2008
2011
2014
Fer
tility
rat
e
Life
exp
ecta
ncy
Life expectancy UK Life expectancy MEX
7
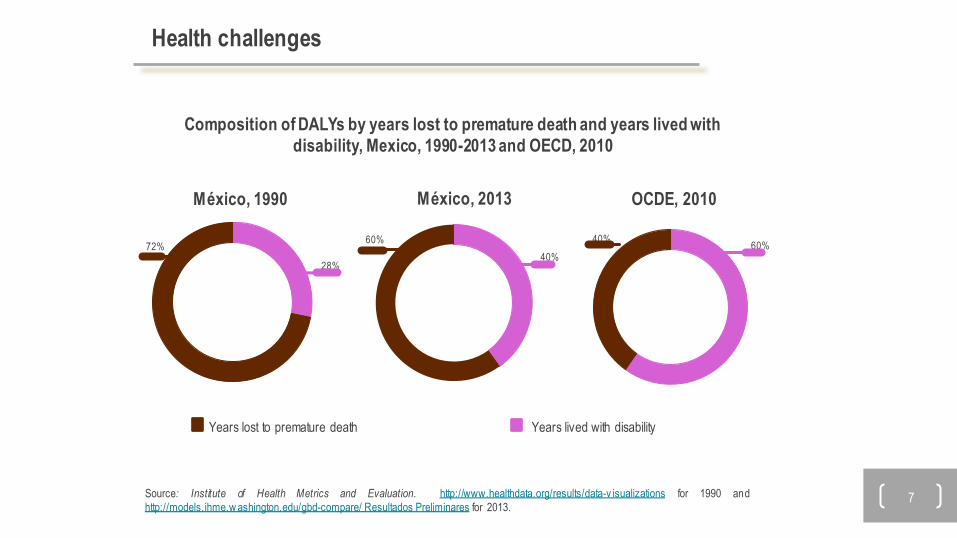
Years lived with disability
Composition of DALYs by years lost to premature death and years lived with
disability, Mexico, 1990-2013 and OECD, 2010
México, 1990
Years lost to premature death
28%
72% 60%
40%
México, 2013
40% 60%
OCDE, 2010
Source: Institute of Health Metrics and Evaluation. http://www.healthdata.org/results/data-v isualizations for 1990 and
http://models.ihme.w ashington.edu/gbd-compare/ Resultados Preliminares for 2013.
Health challenges
8
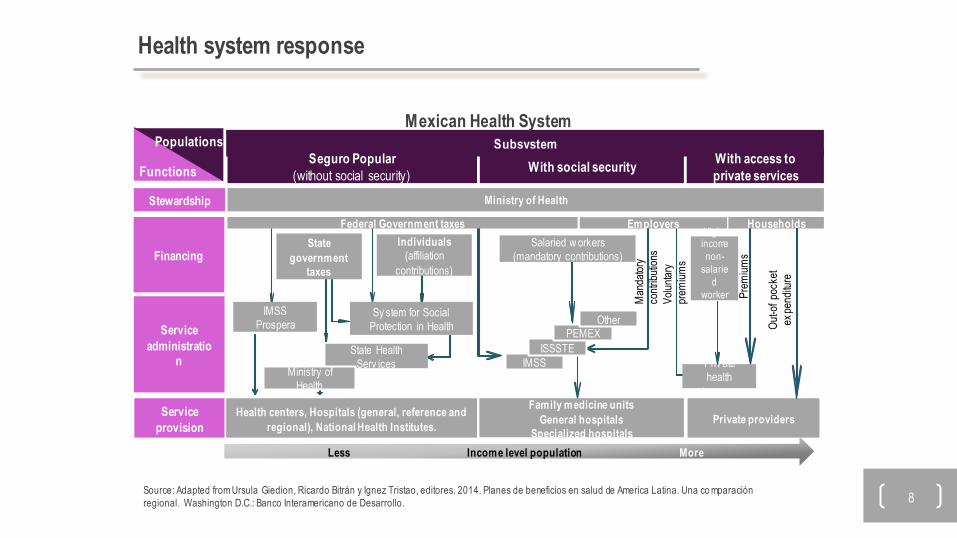
Functions
Populations Subsystem Seguro Popular
(without social security) With social security
With access to
private services
Stewardship
Ministry of Health
Financing
Federal Government taxes
Individuals
(affiliation
contributions)
Employers Households
Salaried w orkers
(mandatory contributions)
High-income
non-
salarie
d
worker
s
Service
provision
Health centers, Hospitals (general, reference and
regional), National Health Institutes.
Family medicine units
General hospitals
Specialized hospitals
Private providers
Service
administration
IMSS
Prospera
State Health
Serv ices
Sy stem for Social
Protection in Health
Ministry of
Health
IMSS
ISSSTE
PEMEX Other
Priv ate
health
insurers
Man
dato
ry
cont
ribut
ions
Vol
unta
ry
prem
ium
s
Pre
miu
ms
Less Income level population More
State
government
taxes
Out
-of
pock
et
expe
nditu
re
Health system response
Source: Adapted from Ursula Giedion, Ricardo Bitrán y Ignez Tristao, editores. 2014. Planes de beneficios en salud de America Latina. Una co mparación
regional. Washington D.C.: Banco Interamericano de Desarrollo.
Mexican Health System

9
Source: OECD Health Statistics 2013, http://dx .doi.org/10.1787/health-data-en; WHO Global Health Ex penditure Database.
1. In the Netherlands, it is not possible to clearly distinguish the public and private share related to investments.
2. Current health ex penditure.
3. Data refers to 2010.
4. Data refers to 2008.
8,50
8 5,
669
5,64
3 5,
099
4,
546
4,52
2
4,49
5 4,
448
4,
246
4,
118
4,
061
3,92
5 3,
800
3,70
0 3,
405
3,
374
3,32
2 3,
305
3,
213
3,18
2 3,
072
3,
012
2,61
9
2,42
1 2,
361
2,
239
2,19
8 1,
966
1,91
5
1,68
9
1,56
8
1,45
2 1,
316
1,30
3 1,
043
977
942
90
6 43
2 14
1
127
Uni
ted
Sta
tes
Nor
way
Sw
itzer
land
Net
herla
nds
1A
ustr
iaC
anad
aG
erm
any
Den
mar
kLu
xem
bour
gF
ranc
eB
elgi
um 2
Sw
eden
Aus
tral
ia 3
Irel
and
Uni
ted
Kin
gdom
Fin
land
OE
CD
34Ic
elan
dJa
pan
3N
ew Z
eala
nd 2
Spa
inIt
aly
Por
tuga
lS
love
nia
Gre
ece
Isra
elK
orea
Cze
ch R
epub
licS
lova
k R
epub
licH
unga
ryC
hile
Pol
and
Rus
sian
Fed
erat
ion
Est
onia
Bra
zil
Mex
ico
3S
outh
Afri
caT
urke
y 4
Chi
naIn
dia
Indo
nesi
a
US
D P
PP
s
Public Private
Health system response
Health expenditure per capita, 2011 (or nearest year)

10
Hospital beds, 2000 and 2011 (or nearest year)
(per 1,000 population)
14.7
4.
7 10
.7
9.1
8.0
7.8 8.0
7.9
7.5
7.2
5.5 6.
3 4.
7 4.
8 5.4
4.0 4.3 4.7
3.7 4.
3 4.
0 3.
7 3.
5 3.3
2.1
3.1
2.7
1.8
0.6
13.4
9.
6 9.
4 8.
3 7.
7 7.
2 6.
8 6.
6 6.
4 6.
4 6.
1 5.
5 5.
4 5.
3 5.
0 4.
9 4.
9 4.
7 4.
6 3.
8 3.
5 3.
4 3.
4 3.
3 3.
3 3.
3 3.
2 3.
1 3.
0 3.
0 2.
8 2.
8 2.
8 2.
7 2.
5 2.
4 2.
4 2.
2 1.
7 0.
7 0.
6
Japa
n
Rus
sian
Fed
.
Aus
tria
Cze
ch R
epub
lic
Fra
nce
Slo
vak
Rep
ublic
Luxe
mbo
urg
OE
CD
25
Gre
ece
Slo
veni
a
Den
mar
k
Por
tuga
l
Nor
way
Spa
in
Irel
and
New
Zea
land
Chi
na
Tur
key
Sou
th A
fric
a
Mex
ico
Indi
aBed
s pe
r 100
0 po
pula
tion
2000 2011
Source: OECD Health Statistics 2013
Health system response
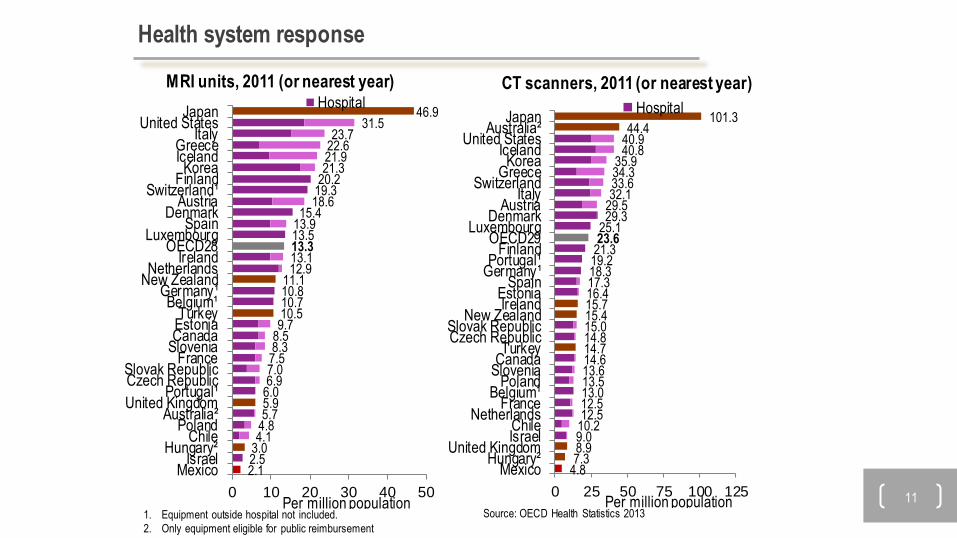
11
46.9 31.5
23.7 22.6 21.9 21.3
20.2 19.3 18.6
15.4 13.9 13.5 13.3 13.1 12.9
11.1 10.8 10.7 10.5 9.7
8.5 8.3 7.5 7.0 6.9
6.0 5.9 5.7
4.8 4.1
3.0 2.5 2.1
0 10 20 30 40 50
JapanUnited States
ItalyGreeceIcelandKorea
FinlandSwitzerland¹
AustriaDenmark
SpainLuxembourg
OECD28Ireland
NetherlandsNew Zealand
Germany¹Belgium¹
TurkeyEstoniaCanada
SloveniaFrance
Slovak RepublicCzech Republic
Portugal¹United Kingdom
Australia²Poland
ChileHungary²
IsraelMexico
Hospital
Per million population
101.3 44.4
40.9 40.8
35.9 34.3 33.6 32.1
29.5 29.3
25.1 23.6
21.3 19.2 18.3 17.3 16.4 15.7 15.4 15.0 14.8 14.7 14.6 13.6 13.5 13.0 12.5 12.5
10.2 9.0 8.9 7.3
4.8
0 25 50 75 100 125
JapanAustralia²
United StatesIcelandKorea
GreeceSwitzerland
ItalyAustria
DenmarkLuxembourg
OECD29Finland
Portugal¹Germany¹
SpainEstoniaIreland
New ZealandSlovak RepublicCzech Republic
TurkeyCanada
SloveniaPoland
Belgium¹France
NetherlandsChileIsrael
United KingdomHungary²
Mexico
Hospital
Per million population 1. Equipment outside hospital not included.
2. Only equipment eligible for public reimbursement
Source: OECD Health Statistics 2013
MRI units, 2011 (or nearest year) CT scanners, 2011 (or nearest year)
Health system response

12 12
Source: OECD Health Statistics 2013, http://dx .doi.org/10.1787/health-data-en.
1. Data include not only doctors providing di rect c are to patients, but also those working in the health sector as managers , educators, researchers , etc. (adding another
5-10% of doctors). 2. Data refer to all doctors licensed to practice (resulting in a large over-estimation of the number of practising doctors in Portugal).
6.1
5.0
4.8
4.1
4.0
3.
9 3.
8 3.
8 3.
8 3.
7 3.
6 3.
5 3.
5
3.3
3.3
3.3
3.3
3.
3
3.3
3.2
3.0
3.0
2.9
2.8
2.8
2.
7 2.
6 2.
5 2.
5 2.
4 2.
2 2.
2 2.
2 2.
0
1.8
1.7
1.6
1.5
0.8
0.
7 0.
2
Gre
ece¹
Rus
sian
…A
ustr
iaIt
aly
Por
tuga
l²S
wed
enG
erm
any
Sw
itzer
land
Spa
inN
orw
ayC
zech
Rep
.Ic
elan
d¹D
enm
ark
Aus
tral
iaF
ranc
e¹S
lova
k…E
ston
iaF
inla
nd¹
Isra
elO
EC
D34
Net
herla
n…H
unga
ryB
elgi
umU
nite
d…Lu
xem
bo…
Irel
and
New
…S
love
nia
Uni
ted…
Can
ada¹
Japa
nM
exic
oP
olan
dK
orea
Bra
zil
Tur
key¹
Chi
le²
Chi
naS
outh
…In
dia
Indo
nesi
a
2011 2000
Practicing doctors, 2000 and 2011 (or nearest year)
(per 1,000 population)
Health system response

13
Source: OECD Health Statistics 2013, http://dx .doi.org/10.1787/health-data-en.
16.6
15
.4
15.4
14
.8
12.9
12
.2
11.8
11
.4
11.3
11
.1
11.1
10
.3
10.1
10
.0
10.0
9.
3
8.8
8.
7 8.
6 8.
3 8.
0 8.
0 7.
8 6.
3 6.
2 6.
2 6.
1 5.
9 5.
5 5.
2
4.8
4.7
4.2
3.3
2.7
1.7
1.7
1.
5 1.
1 1.
0 0.
9
Sw
itzer
land
Den
mar
kB
elg
ium
²Ic
elan
d¹N
orw
ay
Irel
and¹
Net
herla
nds¹
Ger
man
yLu
xem
bou
rgU
nite
d S
tate
s¹S
wed
enF
inla
nd
Aus
tra
liaJa
pan
New
Zea
land
Can
ada
OE
CD
34F
ranc
e¹U
nite
d…
Slo
veni
aC
zech
…R
ussi
an F
ed.…
Aus
tria
³Ita
ly¹
Hun
gary
Est
oni
aP
ortu
gal¹
Slo
vak…
Spa
inP
ola
ndIs
rael
Kor
eaC
hile
²G
reec
e¹M
exi
coT
urke
y¹C
hina
Bra
zil
Sou
th A
fric
aIn
dia
Ind
ones
ia
1. Data include not only nurses prov iding direct care to patients, but also those w orking in the health sector as managers, educators,
researchers, etc.
2. Data refer to all nurses w ho are licensed to practice.
3. Austria reports only nurses employ ed in hospital.
Practicing nurses, 2011 and change between 2000 and 2011
(per 1,000 population)
Health system response

14
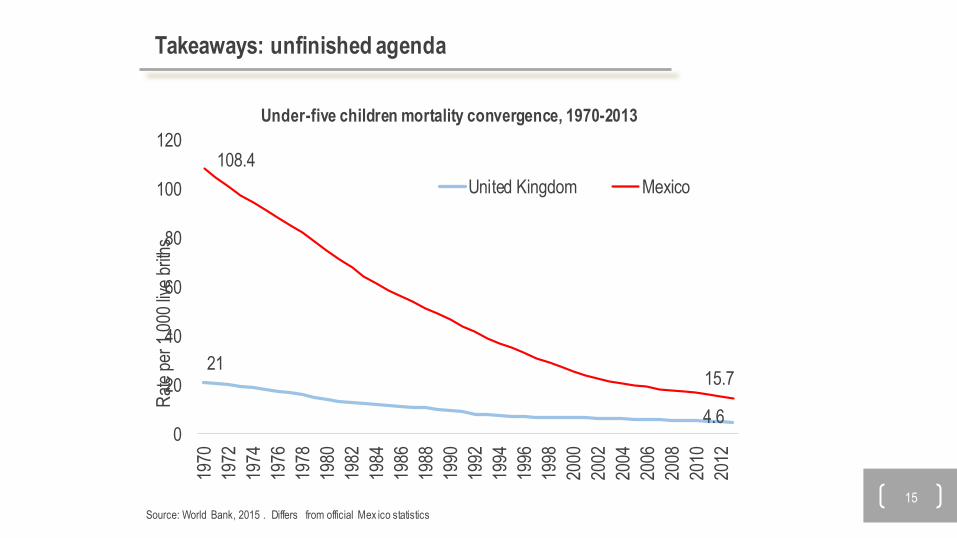
High maternal and infant
mortality rates and
infectous diseases that
can be preventable
Financial protection
agenda
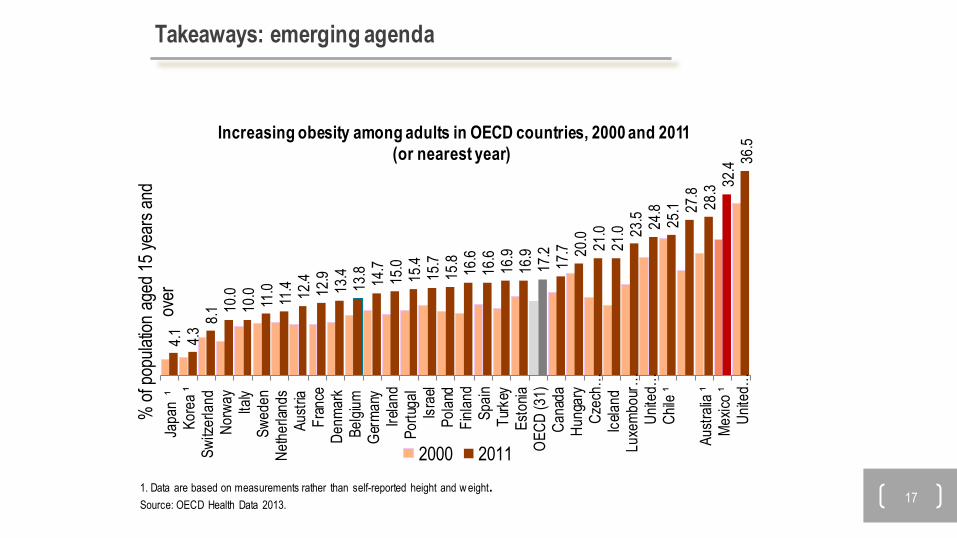
Demographic change
and transition to non-
communicable diseases
and injuries
Emerging agenda
Impoverishing health
expenditures and
increased costs
Unfinished agenda
Source: Jamison D. et al. (2013). Global Health 2035: a w orld conv erging w ithin a generation. The Lancet Commission on Inv esting in
Health. Lancet, v ol. 382, No 9908, p1898-1955.
Takeaways
15
Under-five children mortality convergence, 1970-2013
21
4.6
108.4
15.7
0
20
40
60
80
100
120
1970
1972
1974
1976
1978
1980
1982
1984
1986
1988
1990
1992
1994
1996
1998
2000
2002
2004
2006
2008
2010
2012
Rat
e pe
r 1,
000
live
brith
s
United Kingdom Mexico
Source: World Bank, 2015 . Differs from official Mex ico statistics
Takeaways: unfinished agenda
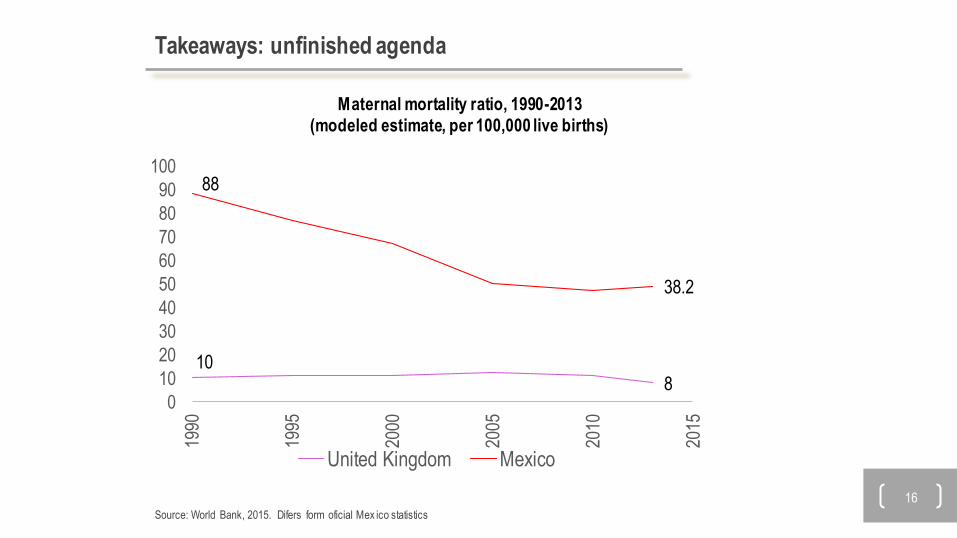
16
10 8
88
38.2
0
10
20
30
40
50
60
70
80
90
100
1990
1995
2000
2005
2010
2015
United Kingdom Mexico
Maternal mortality ratio, 1990-2013
(modeled estimate, per 100,000 live births)
Source: World Bank, 2015. Difers form oficial Mex ico statistics
Takeaways: unfinished agenda
17
4.1
4.3
8.1 10
.0
10.0
11
.0
11.4
12
.4
12.9
13
.4
13.8
14
.7
15.0
15
.4
15.7
15
.8
16.6
16
.6
16.9
16
.9
17.2
17
.7
20.0
21
.0
21.0
23
.5
24.8
25
.1
27.8
28
.3 32
.4 36
.5
Japa
n ¹
Kor
ea ¹
Sw
itzer
land
Nor
way
Italy
Sw
eden
Net
herl
ands
Aus
tria
Fra
nce
Den
mar
kB
elgi
umG
erm
any
Irel
and
Por
tuga
lIs
rael
Pol
and
Fin
land
Spa
inT
urke
yE
ston
iaO
EC
D (3
1)C
anad
aH
unga
ryC
zech
…Ic
elan
dLu
xem
bour
…U
nite
d…C
hile
¹
Aus
tral
ia ¹
Mex
ico
¹U
nite
d…
% o
f pop
ulat
ion
aged
15
year
s an
d ov
er
2000 2011
Increasing obesity among adults in OECD countries, 2000 and 2011
(or nearest year)
1. Data are based on measurements rather than self-reported height and w eight.
Source: OECD Health Data 2013.
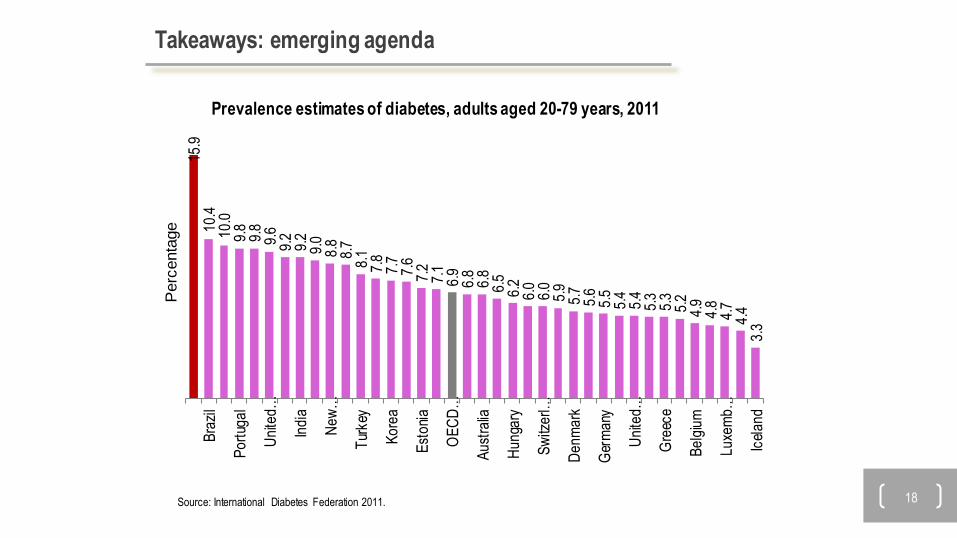
Takeaways: emerging agenda
18
3.3 4.
4 4.7
4.8
4.9
5.
2
5.3
5.
3 5.
4 5.
4 5.
5
5.6
5.7
5.9
6.0
6.0
6.2 6.5 6.8
6.8
6.9
7.1
7.
2 7.6
7.7
7.8 8.1 8.
7 8.
8 9.
0 9.
2
9.2
9.
6 9.
8 9.
8 10.0
10
.4
15.9
Icel
and
Luxe
mb…
Bel
gium
Gre
ece
Uni
ted…
Ger
man
y
Den
mar
k
Sw
itzer
l…
Hun
gary
Aus
tral
ia
OE
CD
…
Est
onia
Kor
ea
Tur
key
New
…
Indi
a
Uni
ted…
Por
tuga
l
Bra
zil
Perc
enta
ge
Prevalence estimates of diabetes, adults aged 20-79 years, 2011
Source: International Diabetes Federation 2011.
Takeaways: emerging agenda
19 Sources: 1. World health Report 2010. Health Sy stems Financing. The Path to Univ ersal Cov erage.
2. OECD Health Data 2013.
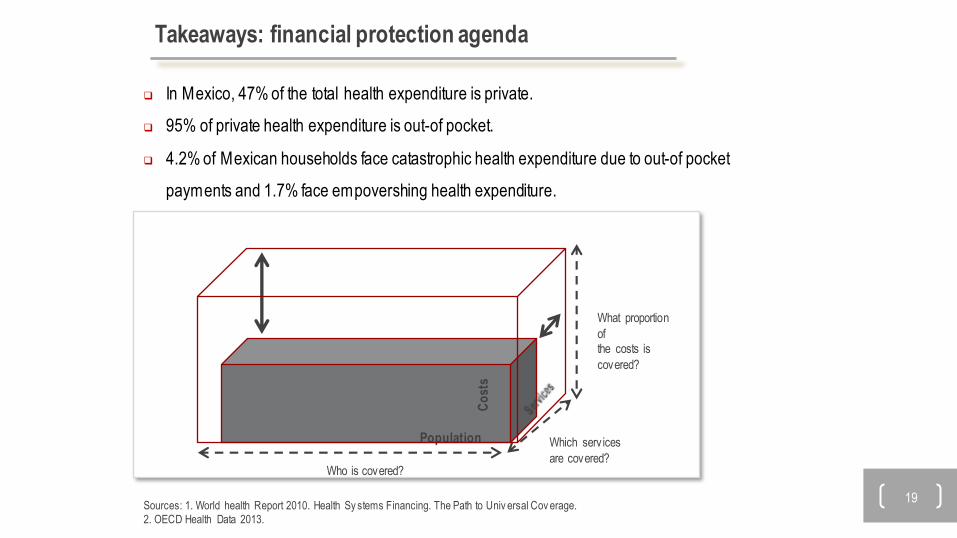
Who is covered?
Which serv ices
are covered?
What proportion
of the costs is
covered?
Population
Co
sts
In Mexico, 47% of the total health expenditure is private.
95% of private health expenditure is out-of pocket.
4.2% of Mexican households face catastrophic health expenditure due to out-of pocket
payments and 1.7% face empovershing health expenditure.
Takeaways: financial protection agenda

Ministry of Health
http://portal.salud.gob.mx/
Inder Secretariat of Integration and
Development of the Health Sector
http://www.sidss.salud.gob.mx/
@SSalud_mx
https://www.facebook.com/SecretariadeSaludMX
Contact details
Recommended