Aurélie Glerum
Michel Bierlaire
AN ENHANCED MEASUREMENT MODEL OF
PERCEPTION OF COMFORT IN PUBLIC
TRANSPORTATION
LATSIS 2012
1st European Symposium on Quantitative Methods in Transportation Systems
6th September 2012

Introduction & motivation
The data • RP survey
• Adjective quantification survey
The integrated model framework • Discrete choice model
• Latent variable model
• Quantification model
Application example • Quantification model
• Integrated model
• Validation of the integrated model
Conclusion
OUTLINE 2

Recent developments in discrete choice modeling (DCM)
• Choice cannot only be explained by economic indicators
(travel duration, price of a trip, etc.)
• Psychological constructs (attitudes, perceptions, etc.) play
important role in choice behavior: need to be integrated in an
appropriate way into DCMs.
• Framework handling this issue:
hybrid choice model (HCM) framework
(Walker, 2001; Ben-Akiva et al., 2002)
3 INTRODUCTION & MOTIVATION
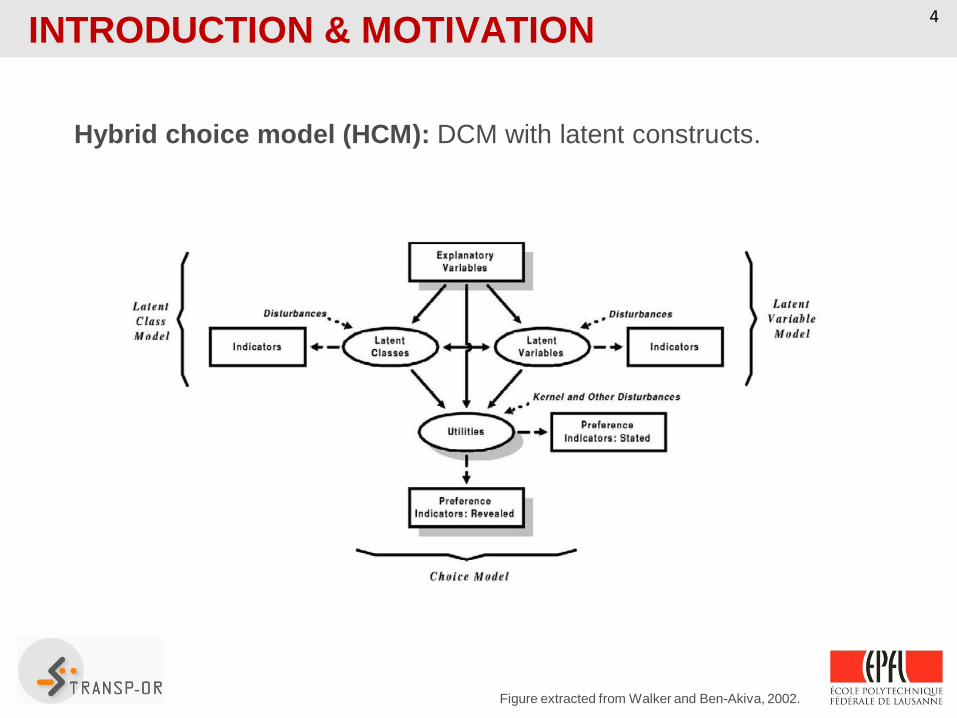
Figure extracted from Walker and Ben-Akiva, 2002.
INTRODUCTION & MOTIVATION 4
Hybrid choice model (HCM): DCM with latent constructs.
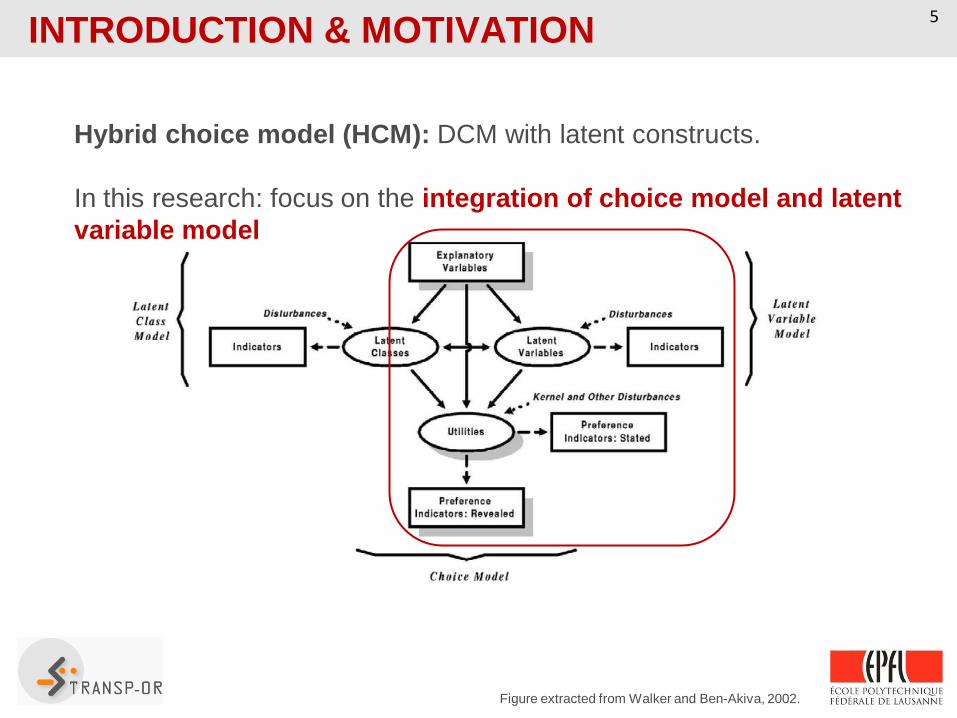
Figure extracted from Walker and Ben-Akiva, 2002.
INTRODUCTION & MOTIVATION 5
Hybrid choice model (HCM): DCM with latent constructs.
In this research: focus on the integration of choice model and latent
variable model
INTRODUCTION & MOTIVATION 6
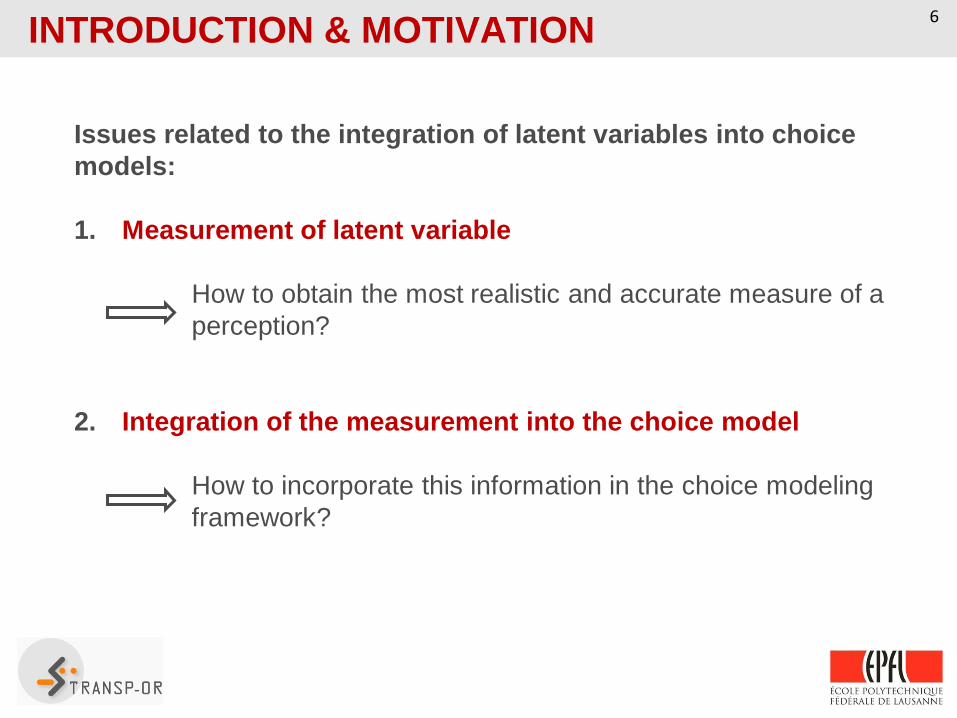
Issues related to the integration of latent variables into choice
models:
1. Measurement of latent variable
How to obtain the most realistic and accurate measure of a
perception?
2. Integration of the measurement into the choice model
How to incorporate this information in the choice modeling
framework?
INTRODUCTION & MOTIVATION 7
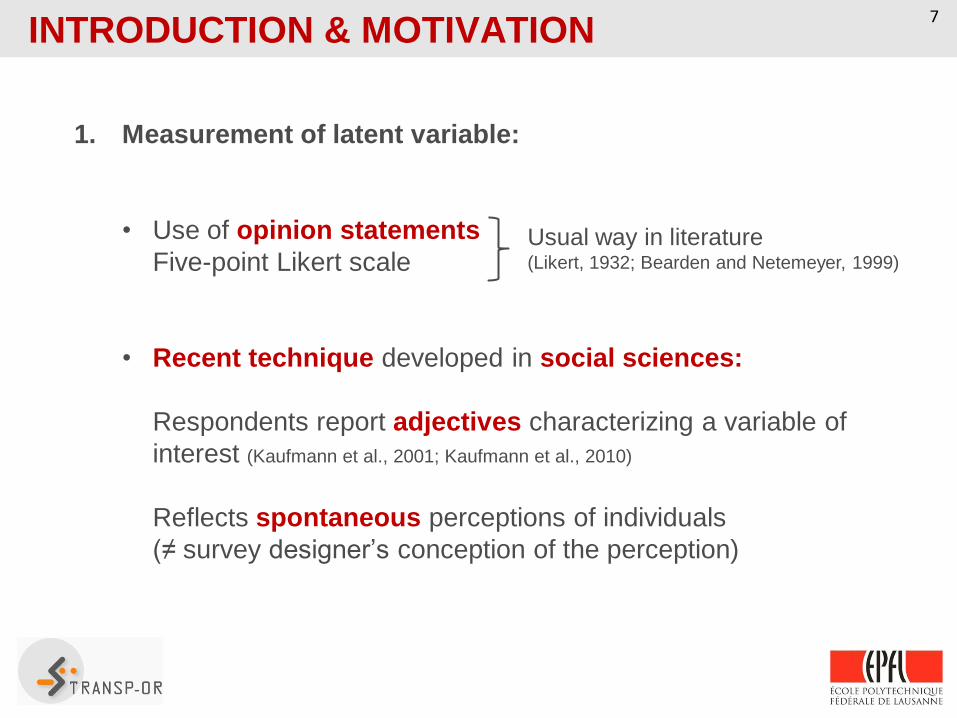
1. Measurement of latent variable:
• Use of opinion statements
Five-point Likert scale
• Recent technique developed in social sciences:
Respondents report adjectives characterizing a variable of
interest (Kaufmann et al., 2001; Kaufmann et al., 2010)
Reflects spontaneous perceptions of individuals
(≠ survey designer’s conception of the perception)
Usual way in literature (Likert, 1932; Bearden and Netemeyer, 1999)
INTRODUCTION & MOTIVATION 8
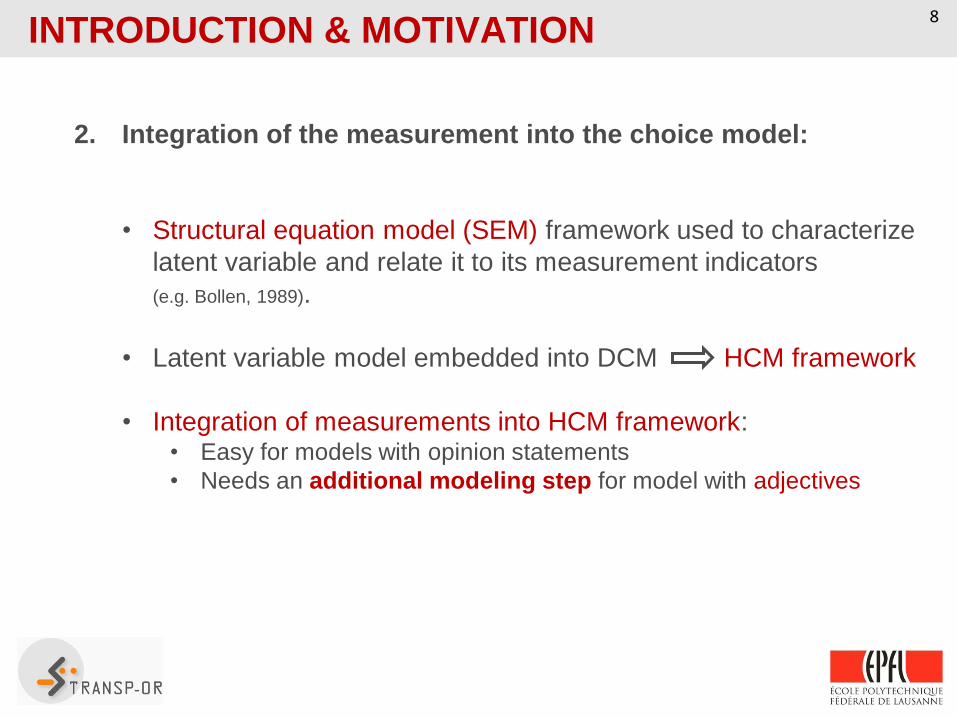
2. Integration of the measurement into the choice model:
• Structural equation model (SEM) framework used to characterize
latent variable and relate it to its measurement indicators
(e.g. Bollen, 1989).
• Latent variable model embedded into DCM HCM framework
• Integration of measurements into HCM framework: • Easy for models with opinion statements
• Needs an additional modeling step for model with adjectives

INTRODUCTION & MOTIVATION 9
Purpose of the research:
Develop an HCM that uses adjectives as measurements of latent
construct
Steps:
1. Collection of choice data & psychometric data in the form of
adjectives
2. Quantification of adjectives:
1. Survey to obtain ratings of adjectives
2. Quantification model
3. Integration of the quantification model into the HCM framework
THE DATA 10
Two surveys:
• Revealed preferences (RP) survey
• Survey with evaluators (adjective quantification survey)

THE DATA 11
RP survey
• Mode choice study
• Conducted between 2009-2010 in low-density
areas of Switzerland
• Conducted with PostBus (major bus company
in Switzerland, operates in low-density areas)
• Info on all trips performed by inhabitants in
one day: • Transport mode
• Trip duration
• Cost of trip
• Activity at destination
• Etc.
• 1763 valid questionnaires collected
Choice
RP SURVEY
THE DATA 12
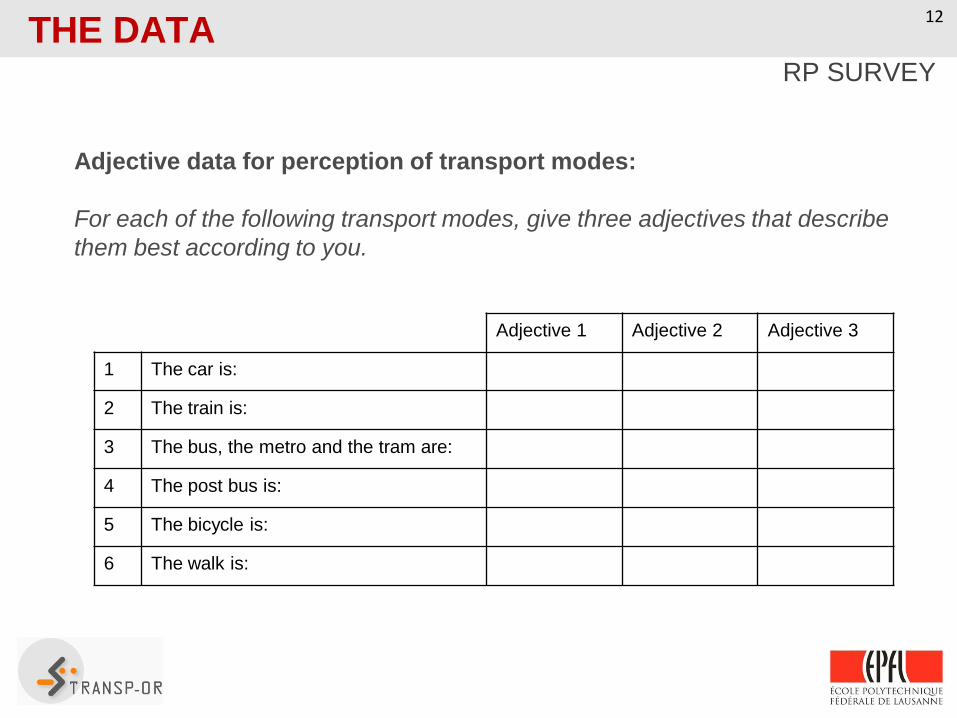
Adjective data for perception of transport modes:
For each of the following transport modes, give three adjectives that describe
them best according to you.
Adjective 1 Adjective 2 Adjective 3
1 The car is:
2 The train is:
3 The bus, the metro and the tram are:
4 The post bus is:
5 The bicycle is:
6 The walk is:
RP SURVEY

THE DATA 13
Adjective data for perception of transport modes:
For each of the following transport modes, give three adjectives that describe
them best according to you.
Adjective 1 Adjective 2 Adjective 3
1 The car is: convenient comfortable expensive
2 The train is: relaxing punctual restful
3 The bus, the metro and the tram are: fast frequent cheap
4 The post bus is: punctual comfortable cheap
5 The bicycle is: stimulating convenient cheap
6 The walk is: healthy relaxing independent
RP SURVEY

THE DATA 14
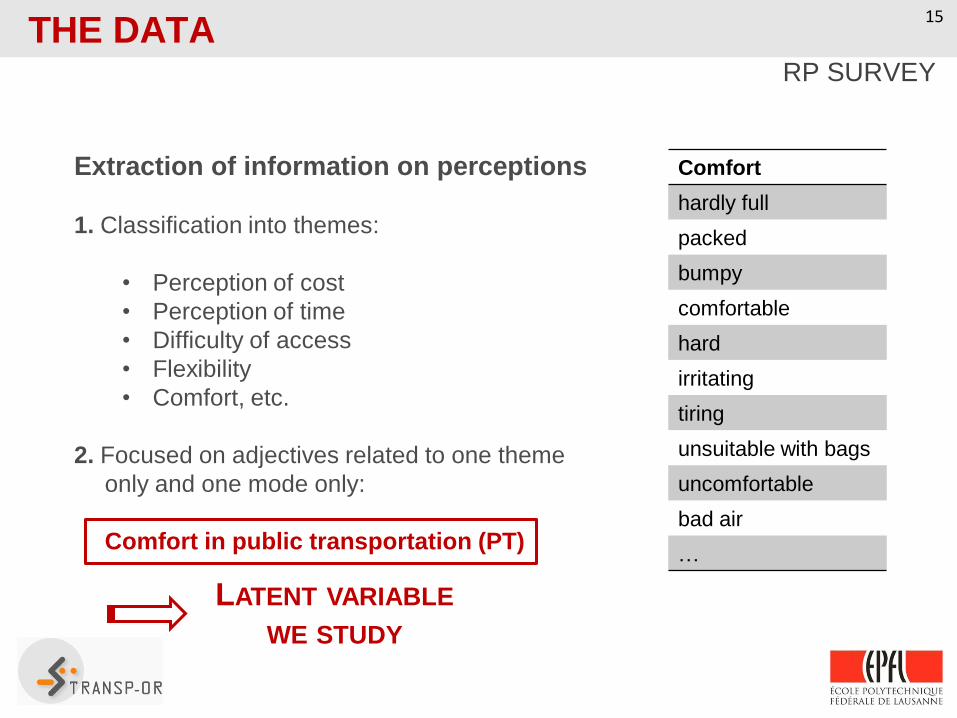
Extraction of information on perceptions
1. Classification into themes:
• Perception of cost
• Perception of time
• Difficulty of access
• Flexibility
• Comfort, etc.
2. Focused on adjectives related to one theme
only and one mode only:
Comfort in public transportation (PT)
Comfort
hardly full
packed
bumpy
comfortable
hard
irritating
tiring
unsuitable with bags
uncomfortable
bad air
…
RP SURVEY
THE DATA 15
Extraction of information on perceptions
1. Classification into themes:
• Perception of cost
• Perception of time
• Difficulty of access
• Flexibility
• Comfort, etc.
2. Focused on adjectives related to one theme
only and one mode only:
Comfort in public transportation (PT)
Comfort
hardly full
packed
bumpy
comfortable
hard
irritating
tiring
unsuitable with bags
uncomfortable
bad air
…
RP SURVEY
LATENT VARIABLE
WE STUDY

THE DATA 16
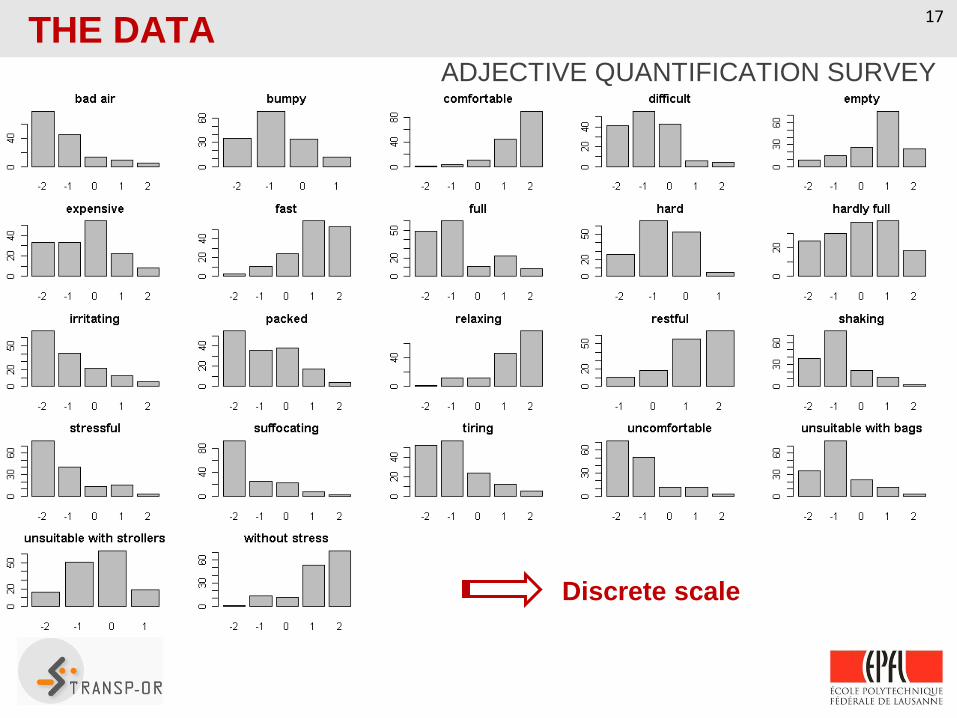
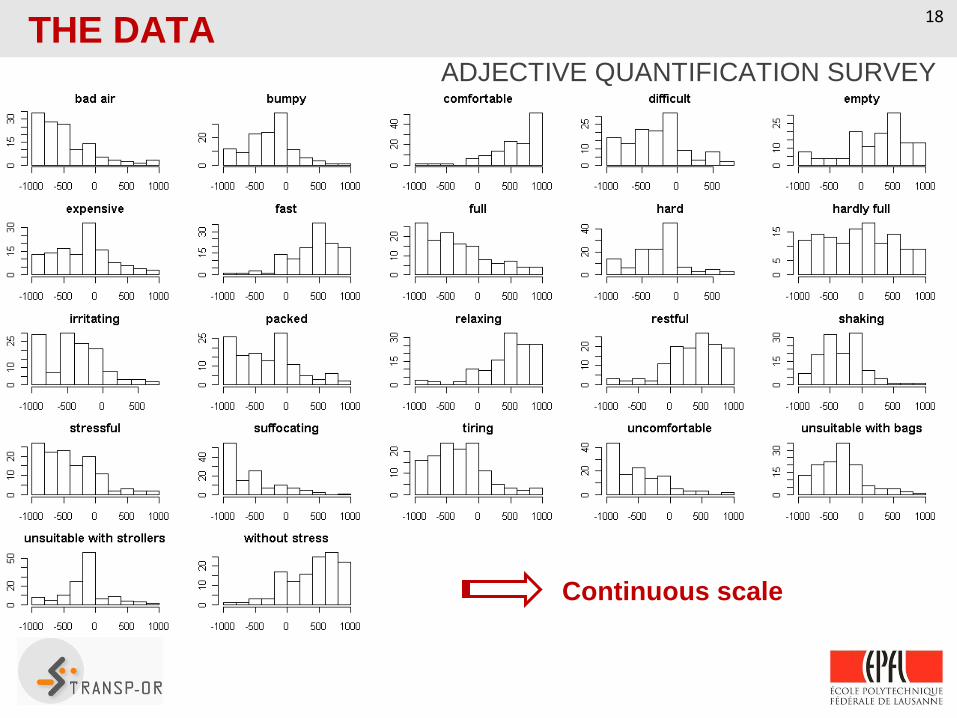
Adjective quantification survey
• Asked external evaluators to rate the adjectives on scale of comfort.
• Two scales:
• Discrete scale: ratings from -2 to 2.
• Continuous scale: ratings from -1000 to 1000.
• Number of evaluators: 277
ADJECTIVE QUANTIFICATION SURVEY
THE DATA 17
The adjective quantification survey
ADJECTIVE QUANTIFICATION SURVEY
Discrete scale
THE DATA 18
The adjective quantification survey
ADJECTIVE QUANTIFICATION SURVEY
Continuous scale

Purpose of the developed HCM:
Assess impact of perception on choice.
Using adjective data need following integrated framework.
Framework involves three components:
• Discrete choice model
• Latent variable model for the perception
• Quantification model for the indicators of the latent variable
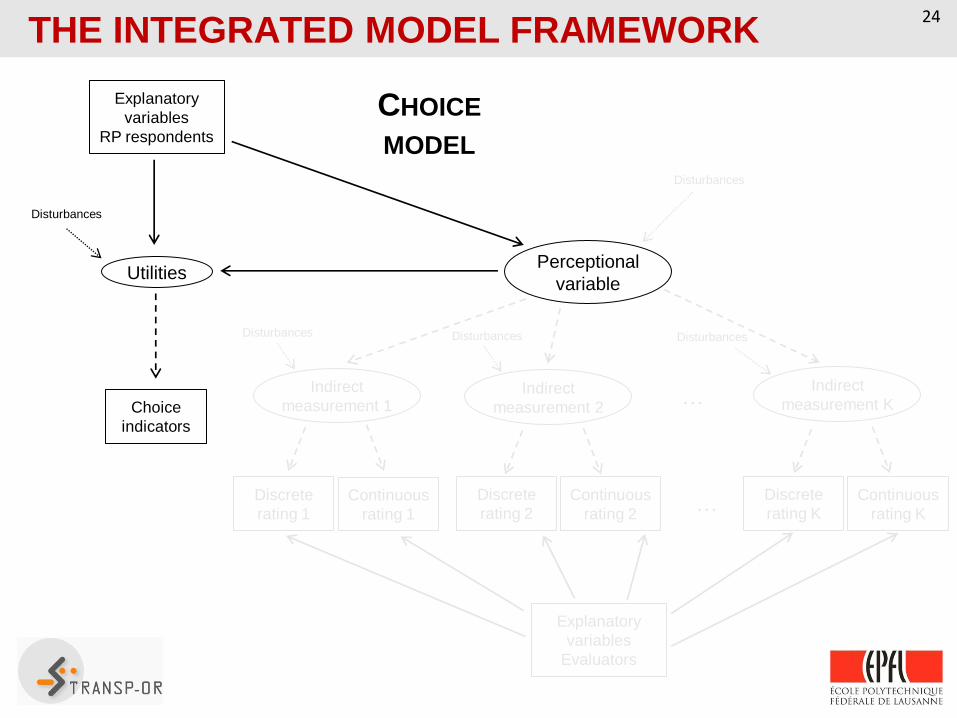
19 THE INTEGRATED MODEL FRAMEWORK

20 THE INTEGRATED MODEL FRAMEWORK
Perceptional
variable
Continuous
rating 1
Discrete
rating 1
Continuous
rating 2
Discrete
rating 2
Continuous
rating K
Discrete
rating K
Utilities
Choice
indicators
Explanatory
variables
RP respondents
Explanatory
variables
Evaluators
Disturbances
Indirect
measurement 1 Indirect
measurement 2
Indirect
measurement K …
…
Disturbances Disturbances
Disturbances
Disturbances

21 THE INTEGRATED MODEL FRAMEWORK
Perceptional
variable
Continuous
rating 1
Discrete
rating 1
Continuous
rating 2
Discrete
rating 2
Continuous
rating K
Discrete
rating K
Utilities
Choice
indicators
Explanatory
variables
RP respondents
Explanatory
variables
Evaluators
Disturbances
Indirect
measurement 1 Indirect
measurement 2
Indirect
measurement K …
…
Disturbances Disturbances
Disturbances
Disturbances
CHOICE
MODEL

22 THE INTEGRATED MODEL FRAMEWORK
Perceptional
variable
Continuous
rating 1
Discrete
rating 1
Continuous
rating 2
Discrete
rating 2
Continuous
rating K
Discrete
rating K
Utilities
Choice
indicators
Explanatory
variables
RP respondents
Explanatory
variables
Evaluators
Disturbances
Indirect
measurement 1 Indirect
measurement 2
Indirect
measurement K …
…
Disturbances Disturbances
Disturbances
Disturbances
LATENT VARIABLE
MODEL

23 THE INTEGRATED MODEL FRAMEWORK
Perceptional
variable
Continuous
rating 1
Discrete
rating 1
Continuous
rating 2
Discrete
rating 2
Continuous
rating K
Discrete
rating K
Utilities
Choice
indicators
Explanatory
variables
RP respondents
Explanatory
variables
Evaluators
Disturbances
Indirect
measurement 1 Indirect
measurement 2
Indirect
measurement K …
…
Disturbances Disturbances
Disturbances
Disturbances
QUANTIFICATION
MODEL
24 THE INTEGRATED MODEL FRAMEWORK
Perceptional
variable
Continuous
rating 1
Discrete
rating 1
Continuous
rating 2
Discrete
rating 2
Continuous
rating K
Discrete
rating K
Utilities
Choice
indicators
Explanatory
variables
RP respondents
Explanatory
variables
Evaluators
Disturbances
Indirect
measurement 1 Indirect
measurement 2
Indirect
measurement K …
…
Disturbances Disturbances
Disturbances
Disturbances
CHOICE
MODEL
25 THE INTEGRATED MODEL FRAMEWORK
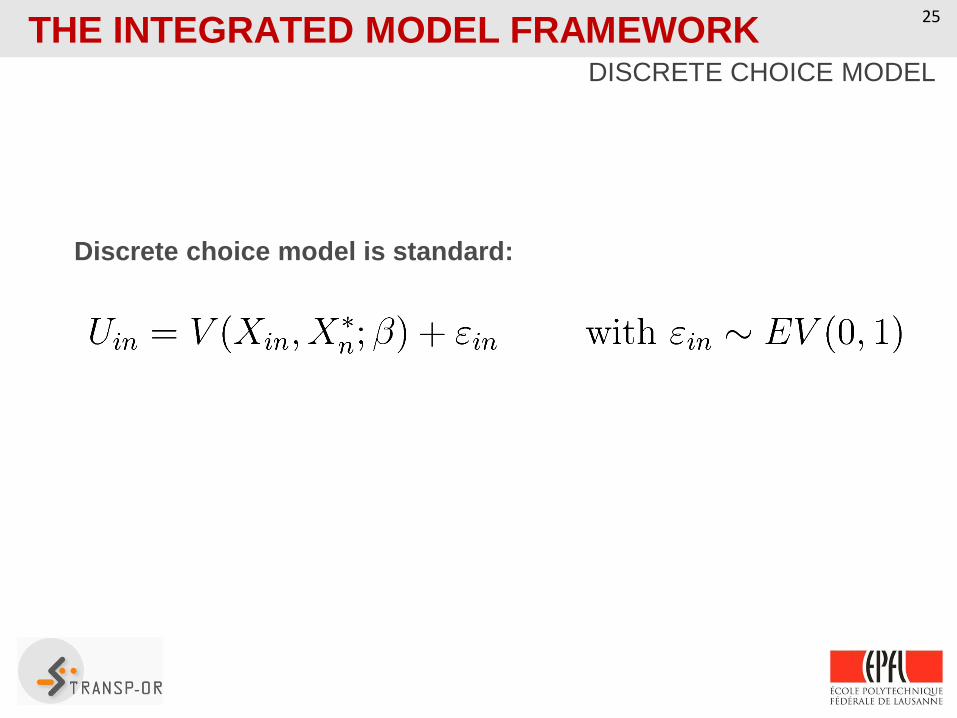
DISCRETE CHOICE MODEL
Discrete choice model is standard:

26 THE INTEGRATED MODEL FRAMEWORK
Perceptional
variable
Continuous
rating 1
Discrete
rating 1
Continuous
rating 2
Discrete
rating 2
Continuous
rating K
Discrete
rating K
Utilities
Choice
indicators
Explanatory
variables
RP respondents
Explanatory
variables
Evaluators
Disturbances
Indirect
measurement 1 Indirect
measurement 2
Indirect
measurement K …
…
Disturbances Disturbances
Disturbances
Disturbances
LATENT VARIABLE
MODEL

27 THE INTEGRATED MODEL FRAMEWORK
LATENT VARIABLE MODEL
Latent variable model of perception (SEM):
Structural equation:
Measurement equation:

28 THE INTEGRATED MODEL FRAMEWORK
LATENT VARIABLE MODEL
Latent variable model of perception (SEM):
Structural equation:
Measurement equation:
Indirect measurement of perception Xn*,
which is treated as a latent variable
Unobservable score of
indicator k for individual n

29 THE INTEGRATED MODEL FRAMEWORK
Perceptional
variable
Continuous
rating 1
Discrete
rating 1
Continuous
rating 2
Discrete
rating 2
Continuous
rating K
Discrete
rating K
Utilities
Choice
indicators
Explanatory
variables
RP respondents
Explanatory
variables
Evaluators
Disturbances
Indirect
measurement 1 Indirect
measurement 2
Indirect
measurement K …
…
Disturbances Disturbances
Disturbances
Disturbances
QUANTIFICATION
MODEL

30 THE INTEGRATED MODEL FRAMEWORK
QUANTIFICATION MODEL
Quantification model (SEM):
Structural equation:
Measurement equation:
Discrete:
Continuous:
Score of adjective l by
individual m

31 THE INTEGRATED MODEL FRAMEWORK
QUANTIFICATION MODEL
Quantification model (SEM):
Structural equation:
Measurement equation:
Discrete:
Continuous:
Adjective-specific
constant to be estimated
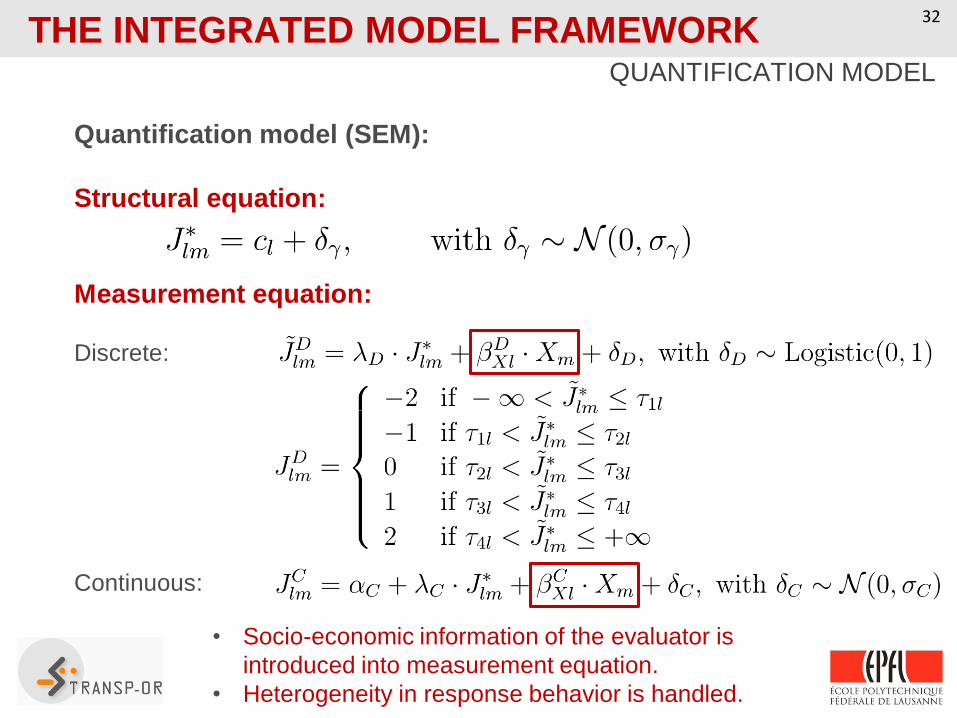
32 THE INTEGRATED MODEL FRAMEWORK
QUANTIFICATION MODEL
Quantification model (SEM):
Structural equation:
Measurement equation:
Discrete:
Continuous:
• Socio-economic information of the evaluator is
introduced into measurement equation.
• Heterogeneity in response behavior is handled.

33 THE INTEGRATED MODEL FRAMEWORK
QUANTIFICATION MODEL
Estimation of the quantification model alone:
• Likelihood for an adjective l:
• Score of adjective l by individual m is inferred.
• The obtained scores are then introduced as measurements of the
perceptional variable.
34 THE INTEGRATED MODEL FRAMEWORK
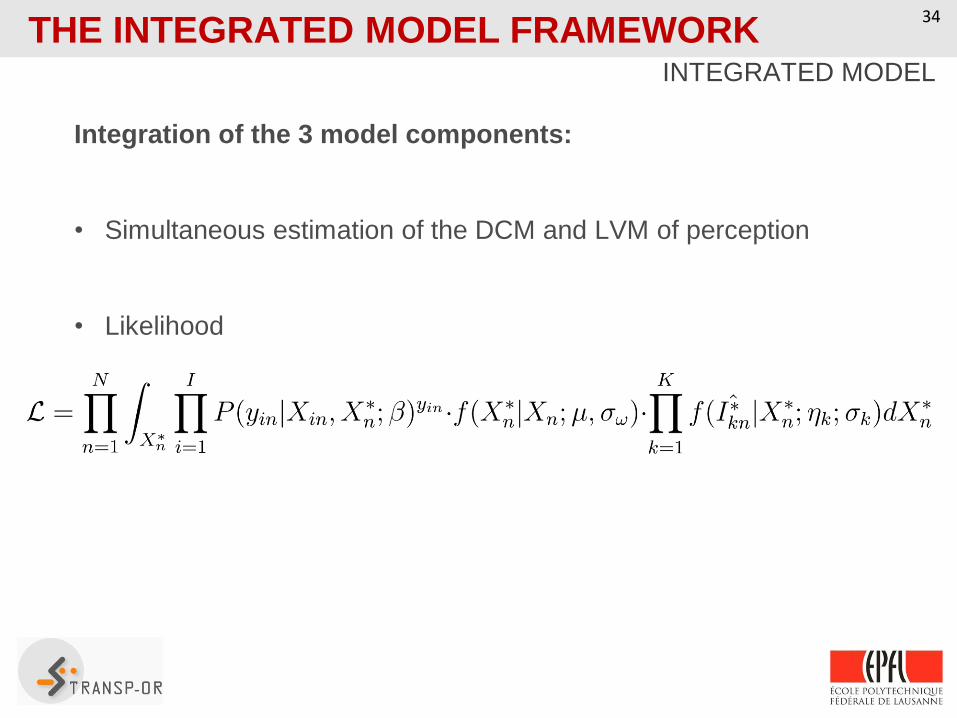
INTEGRATED MODEL
Integration of the 3 model components:
• Simultaneous estimation of the DCM and LVM of perception
• Likelihood
35 APPLICATION EXAMPLE
QUANTIFICATION MODEL
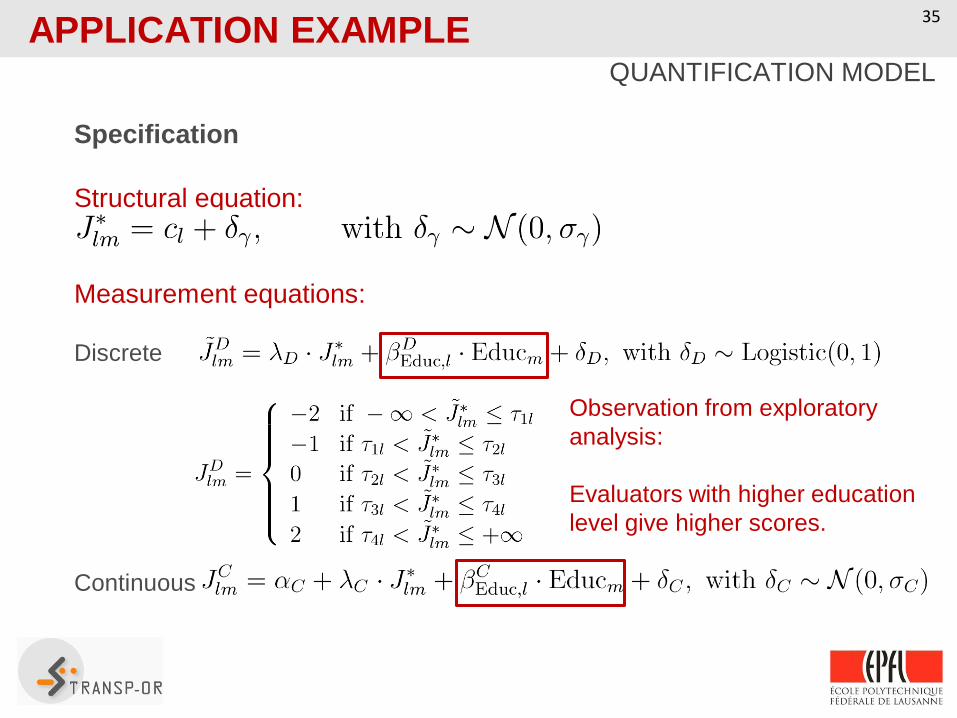
Specification
Structural equation:
Measurement equations:
Discrete
Continuous
Observation from exploratory
analysis:
Evaluators with higher education
level give higher scores.

36 APPLICATION EXAMPLE
QUANTIFICATION MODEL Model estimated for all 22 adjectives:
• Separate estimation for each adjective
• Results consistent with expectations
Example: empty
• Constants have expected signs: adjectives related to comfort have + signs.
• Results from exploratory analysis confirmed:
the higher the level of education, the higher the scores in absolute value.
Name Value t-test
cempty 0.348 29.52
βCEduc, empty 0.245 24.29
βDEduc, empty 0.372 2.08
𝜎Cempty -2.74 -29.32
1, empty -2.72 -7.3
1, empty 1.23 3.99
2, empty 1.16 5.49
3, empty 2.85 10.21
Loglikelihood: - 373

37 APPLICATION EXAMPLE
QUANTIFICATION MODEL Model estimated for all 22 adjectives:
• Separate estimation for each adjective
• Results consistent with expectations
Example: packed
• Constants have expected signs: adjectives related to discomfort have - signs.
• Results from exploratory analysis confirmed:
the higher the level of education, the higher the scores in absolute value.
Name Value t-test
cpacked -0.547 -25.46
βCEduc, packed -0.237 -18.34
βDEduc, packed -0.447 -2.54
𝜎Cpacked -2.62 -24.2
1, packed -1.43 -6.36
1, packed 1.23 6.64
2, packed 1.68 6.77
3, packed 1.93 3.99
Loglikelihood: - 380

38 APPLICATION EXAMPLE
INTEGRATED MODEL Estimation results for the DCM and LVM of perception
Discrete choice model
Name Value t-test
ASCPT -0.161 -0.8
ASCPMM 0.42 2.28
βCost -0.0653 -8.1
βTimePT -0.0208 -7.15
βTimeCar -0.0323 -9.45
βDistance -0.235 -11.44
βWork, PT -0.0441 -0.19
βWork, PMM -0.575 -2.6
βLanguage, PT -0.0507 -0.17
βLanguage, PMM 0.964 3.55
βPerceptionComfortPT 1.32 4.4
Loglikelihood of the HCM: - 4355
Latent variable model of
perception (structural equation)
Name Value t-test
bmeanImageConfortTP 7.59 10.41
bregionLanguage -0.726 -2.51
bage<50 -1.15 -5.06
bactif -1.15 -4.72
bvoiture -0.727 -3.2
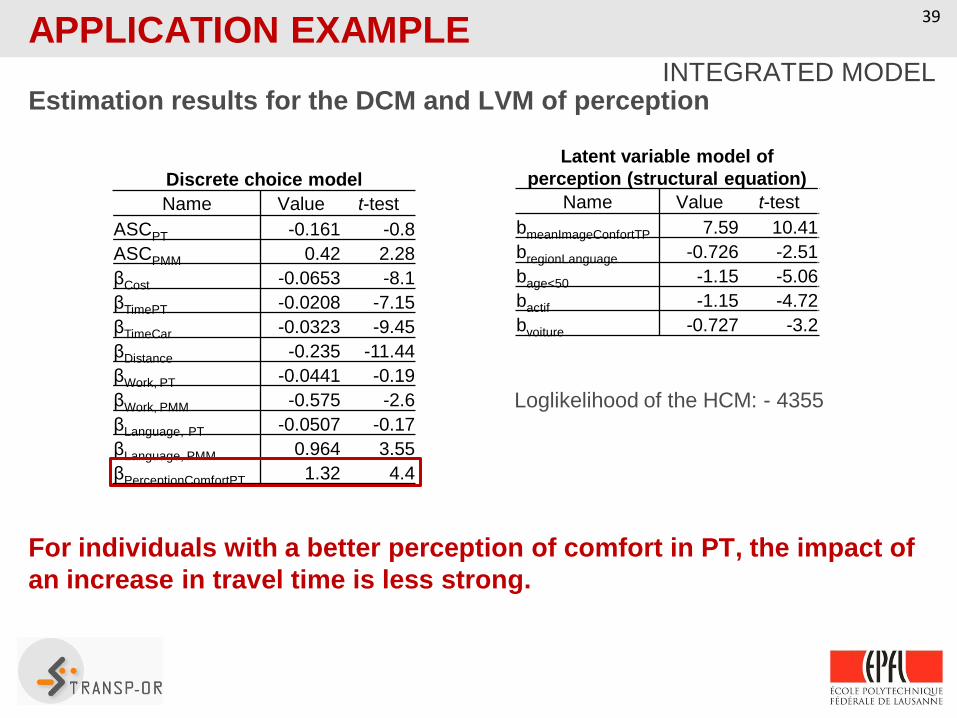
39 APPLICATION EXAMPLE
INTEGRATED MODEL Estimation results for the DCM and LVM of perception
For individuals with a better perception of comfort in PT, the impact of
an increase in travel time is less strong.
Discrete choice model
Name Value t-test
ASCPT -0.161 -0.8
ASCPMM 0.42 2.28
βCost -0.0653 -8.1
βTimePT -0.0208 -7.15
βTimeCar -0.0323 -9.45
βDistance -0.235 -11.44
βWork, PT -0.0441 -0.19
βWork, PMM -0.575 -2.6
βLanguage, PT -0.0507 -0.17
βLanguage, PMM 0.964 3.55
βPerceptionComfortPT 1.32 4.4
Loglikelihood of the HCM: - 4355
Latent variable model of
perception (structural equation)
Name Value t-test
bmeanImageConfortTP 7.59 10.41
bregionLanguage -0.726 -2.51
bage<50 -1.15 -5.06
bactif -1.15 -4.72
bvoiture -0.727 -3.2

40 APPLICATION EXAMPLE
VALIDATION OF THE INTEGRATED MODEL
Model estimation on 80% data and application on 20% data.
Choice probabilities generally well predicted.
CONCLUSION
Main findings:
• Alternative approach to measure perceptions
• Main advantage over classical opinion statements: spontaneity of
respondents captured.
• Difficulty: code and integrate these measurements in choice model.
The proposed model:
1. Quantifies adjectives
2. Accounts for subjectivity inherent to quantification method:
• Uses a fairly large sample of evaluators
• Account for bias linked to different education levels
• Importance of including individual-level information in measurement
component of an LVM in HCM.
41
CONCLUSION
Next steps:
• Further validation: comparison of the prediction power of the presented
HCM with HCMs including ratings of individual evaluators.
• Estimate the quantification model parts relative to each adjective
simultaneously.
42

Thanks!
43
Recommended