AN ASSISTIVE NAVIGATION PARADIGM FOR
SEMI-AUTONOMOUS WHEELCHAIRS
USING FORCE FEEDBACK AND
GOAL PREDICTION
by
JOHN H.C. STATON
Presented to the Faculty of the Graduate School of
The University of Texas at Arlington in Partial Fulfillment
of the Requirements
for the Degree of
MASTER OF SCIENCE IN COMPUTER SCIENCE
THE UNIVERSITY OF TEXAS AT ARLINGTON
May 2008

Copyright © by John H.C. Staton 2008
All Rights Reserved

iii
ACKNOWLEDGEMENTS
First and foremost I have to acknowledge and thank my loving parents and my
sister. Without their support – not only financial but emotional and spiritual – this
whole adventure that is graduate school would have been impossible.
Secondly, I must express my most sincere gratitude towards my advisor Dr.
Manfred Huber and The University of Texas at Arlington’s Computer Science
Department for believing in me and giving me the opportunity to succeed. I could not
have asked for a better advisor than Dr. Huber, whose patience, wit and support have
been paramount. It has been an honor and a privilege to collaborate and learn with him.
I must thank both members of my committee, Drs. David Levine and Gergely
Zaruba for devoting their time and energy to me in this process.
I would like to thank all of my friends, both at UTA and at other universities, for
the gift of intelligent conversation, discussion and discourse. I was able to bounce ideas
off of them and commiserate with them over our shared trials and tribulations.
Specifically I owe a debt of gratitude to Giles D’Silva, not only for pointing me towards
Microsoft Robotics Studio, which ended up being an invaluable tool in the application
portion of this project, but also for the many games of FIFA soccer and Wii Tennis,
which kept me sane throughout the final semester.

iv
I would be remiss if I didn’t thank various professors from my alma mater
Augsburg College, including Drs. Karen Sutherland, Noel Petit, Larry Ragland, Larry
Crockett, Charles Sheaffer, James Moen, Phil Adamo and Phil Quanbeck. I thank you
all from the bottom of my heart.
Finally, the love and support of one Aleyna Stevens has proven to be the
proverbial light in the darkness during the final semester of my Master’s program. I am
unable to sum up in words how much she means to me, but including her in these
acknowledgements can, I hope, act as but a small portion of my appreciation for her.
April 17, 2008

v
(This page must have a 2 inch top margin.)
ABSTRACT
AN ASSISTIVE NAVIGATION PARADIGM FOR
SEMI-AUTONOMOUS WHEELCHAIRS
USING FORCE FEEDBACK AND
GOAL PREDICTION
John H.C. Staton, M.S.
The University of Texas at Arlington, 2008
Supervising Professor: Manfred Huber
As computer technology advances and facilitates an increased amount of
autonomous sensing and control, the interface between the human and autonomous
computer systems becomes increasingly important. This applies in particular in the
realm of service robotics where robots with increasing levels of autonomy are
constantly interacting with human users and where it is paramount to have an efficient
way to convey user intentions and commands to the robot system, integrate them into
the robot’s action and control, and to indicate robot control choices to the user in a
“natural”, intuitive way. One particular example where semi-autonomous operation of a
system has been shown to be of major benefit is in the case of advanced wheelchairs
which benefit from local autonomy and fine control capabilities of sensor-driven
vi
computer control systems but have to be under the higher-level control of the disabled
user. This thesis investigates technologies aimed at facilitating the integration of such
autonomous path planning capabilities with intuitive human control using a force-
feedback interface. While force-feedback has been applied to artificially intelligent
wheelchairs, only the surface of the capabilities of this interface mechanism has been
scratched. This thesis seeks to expand upon the earlier work in this field by developing
the idea of force-feedback not just as a tool for obstacle avoidance, but also as a tool for
guiding the wheelchair user to their goal. To this point, harmonic function path
planning has been integrated to create a new, more robust force-feedback paradigm. A
force-feedback joystick has been used to communicate information from the user to the
robot control system which uses this to infer and interpret the user’s navigation
intentions as well as from the harmonic function-based autonomous control system to
the user to indicate the system’s suggestions. To demonstrate and evaluate its
capabilities his new paradigm has been implemented within the Microsoft Robotics
Studio framework and tested in a simulated mobile system, with positive results.

vii
(This page must have a 2 inch top margin.)
TABLE OF CONTENTS
ACKNOWLEDGEMENTS....................................................................................... iii
ABSTRACT .............................................................................................................. v
LIST OF ILLUSTRATIONS..................................................................................... x
LIST OF TABLES..................................................................................................... xi
Chapter
1. INTRODUCTION ........................................................................................ 1
2. BACKGROUND ......................................................................................... 5
2.1 Wheelchair History .................................................................................. 5
2.2 Intelligent Wheelchairs............................................................................ 5
2.3 Force-Feedback Enabled Wheelchairs .................................................... 8
2.4 Force-Feedback........................................................................................ 10
2.4.1 Mechanics ................................................................................. 11
2.4.2 Force-Feedback Effects ............................................................ 12
2.5 Harmonic Function Path Planning........................................................... 13
2.5.1 Harmonic Functions.................................................................. 13
2.5.2 Harmonic Functions for Robotic Path Planning....................... 14
3. METHODOLOGY ........................................................................................ 17
3.1 Goal Prediction Loop............................................................................... 17
3.1.1 Goal Selection........................................................................... 18

viii
3.1.2 Harmonic Function ................................................................... 19
3.2 Run-Time Loop ....................................................................................... 20
3.2.1 Force Vector Creation............................................................... 21
3.2.1.1 Direction....................................................................... 21
3.2.1.2 Risk Assumption .......................................................... 22
3.2.2 Playing Force-Feedback Effect................................................. 23
3.2.3 Motor Commands ..................................................................... 24
4. IMPLEMENTATION ................................................................................... 25
4.1 Implementation Setup.............................................................................. 25
4.2 Microsoft Robotics Studio....................................................................... 26
4.2.1 Three Major Modifications....................................................... 26
4.3 Design Implementation............................................................................ 27
4.3.1 Goal Prediction ......................................................................... 28
4.3.2 Run-Time Loop ........................................................................ 31
4.3.2.1 Risk Assumption .......................................................... 32
4.3.2.2 Force Vector Direction................................................. 34
4.3.2.3 Force-Feedback Effect Playback.................................. 35
5. EXPERIMENTS ........................................................................................... 36
5.1 Testing Methodology............................................................................... 36
5.1.1 Goal Selection........................................................................... 36
5.1.2 Virtual Environment Test Course............................................. 38
5.1.3 Post Test Survey ....................................................................... 39

ix
5.2 Test Results.............................................................................................. 39
5.2.1 Goal Selection Test Results ...................................................... 39
5.2.2 Virtual Environment Test Course Results ................................ 46
5.2.3 Post Test Survey Results .......................................................... 48
6. ANALYSIS ................................................................................................... 50
6.1 Goal Selection Analysis........................................................................... 50
6.2 User Testing/Survey Analysis ................................................................. 52
7. CONCLUSION ............................................................................................. 54
7.1 Final Thoughts ......................................................................................... 54
7.2 Future Work............................................................................................. 55
REFERENCES .......................................................................................................... 56
BIOGRAPHICAL INFORMATION......................................................................... 68

x
LIST OF ILLUSTRATIONS
Figure Page
2.1 Double Slotted Bale [45]................................................................................. 11
2.3 The harmonic function
[47]............................................ 14
3.1 Outer Goal Prediction Loop Diagram ............................................................. 17
3.2 Run-Time Force Feedback Loop Diagram...................................................... 20
4.1 Implementation Setup ..................................................................................... 25
4.2 Dashboard Window Screenshot ...................................................................... 28
4.3 Path Planning Window Screenshot ................................................................. 29
4.4 Simulation Environment Window Screenshot ................................................ 31
5.1 Three Goal Selection Environments
(Similar, Semi-Similar, and Not Similar)........................................................ 37
5.2 Test Course...................................................................................................... 38
5.3 Average Time Taken to Complete Course (seconds)...................................... 47
5.4 Average Number of Collisions........................................................................ 48

xi
LIST OF TABLES
Table Page
2.1 Current and Recent Smart Wheelchair Research Projects [32]....................... 6
5.1 Scenario Modifiers .......................................................................................... 37
5.2 Results for Movement Towards the Goal & Multiple Similar Goals ............. 40
5.3 Results for Neutral Movement Eastward & Multiple Similar Goals .............. 41
5.4 Results for Neutral Movement Westward & Multiple Similar Goals............. 41
5.5 Results for Movement Away From the Goal & Multiple
Similar Goals................................................................................................... 42
5.6 Results for Movement Towards the Goal & Two Semi-
Similar Goals................................................................................................... 42
5.7 Results for Neutral Movement Northeastward & Two
Semi-Similar Goals ......................................................................................... 43
5.8 Results for Neutral Movement Southwestward & Two
Semi-Similar Goals ......................................................................................... 43
5.9 Results for Movement Away From the Goal & Two
Semi-Similar Goals ......................................................................................... 44
5.10 Results for Movement Towards the Goal with One
Distinct Goal ................................................................................................... 44
5.11 Results for Neutral Movement Eastward with One
Distinct Goal ................................................................................................... 45
5.12 Results for Neutral Movement Westward with One
Distinct Goal ................................................................................................... 45
5.13 Results for Movement Away From the Goal with One
Distinct Goal ................................................................................................... 46

1
(This page must have a 2 inch top margin. The first page of each chapter must have a 2 inch top margin.)
CHAPTER 1
INTRODUCTION
“The majority of research and development activity in the field of control
and automation applied to powered mobility for people with disabilities has
concerned sophisticated technology and techniques. … A more effective approach is
to make use of the most flexible and adaptable intelligence on the chair – the user. To
accomplish this, researchers must design, build and test their systems with real users
and contexts in mind.”
Paul D. Nisbet, “Who’s Intelligent? Wheelchair, Driver or Both?” 2002 [1]
Researchers within the field of computer science drive themselves to push the
limit of technology and create wholly new techniques to incrementally thrust the field
forward. The goal is, no doubt, honorable, but somewhere in the quest for knowledge
the external factors become the focus, replacing the issue at heart. The preceding quote
by Paul Nisbet is an indication that even when the goal is to assist the handicapped and
wheelchair-bound, the focus can be lost amongst a concern for “sophisticated
technology and techniques”.
Early work in the field of “intelligent wheelchairs” has involved incremental
improvements to the function of a wheelchair as an autonomous unit. Ultrasonic
sensors, laser systems and even cameras and video systems have been put to use in the
goal of allowing the wheelchair to detect obstacles, avoid them, sense doorways and
pass safely through them, and even map the environment so that the wheelchair can

2
plan and navigate safe routes [2, 3, 4]. These sensor systems have even been integrated
to form novel control systems, allowing the user to direct the wheelchair through
movements of the head, or gestures [5].
All of this seems directed to target the wheelchair users with the strongest
physical disabilities. However, not all wheelchair users have disabilities that require
their wheelchair to do the majority of the work for them. For these users, a semi-
autonomous system would be more appropriate, or even a system that provides no
explicit autonomy. When the intelligence of the wheelchair decides that a certain action
is pertinent to take, then the wheelchair should communicate this idea to the user, rather
than performing the action itself, thus assisting the user, not replacing them. Possible
methods of communication include sight and sound (Toyota’s I-Real Personal Mobility
Concept, debuted in 2007, uses sound to indicate that the user is too close to an
obstacle), but the purpose of this project is to communicate through force-feedback.
The reason why force-feedback has been chosen as the communication
methodology for this semi-autonomous intelligent wheelchair framework is because it is
an intuitive feedback system that does not distract the user (when applied correctly) as
much as graphical or auditory interfaces, and can therefore lead to a more organic
integration of the semi-autonomous control system.
Force-feedback has been shown to be an extremely useful concept for various
tasks, such as biomanipulation in virtual reality, minimally invasive endoscopic surgery,
maze-solving, mobility aids for blind children, steering tasks and combined steering-
targeting tasks [6, 7, 8, 12] and has, in fact, been applied to a wheelchair with some
3
success [9, 10, 11]. However, the desire in all of these previous works has been focused
solely on obstacle avoidance at all costs. The question is: why not design a system such
that the user rarely, if ever approaches an obstacle? Why not design a system whose
purpose is to infer what the user’s target destination is and guide the wheelchair user to
his or her goal, not just direct the user away from obstacles?
Answering those questions is the motivation behind this thesis, as well as is
designing and implementing an intelligent wheelchair system that uses force-feedback
not just to help the user avoid obstacles, but to also subtly encourage the user to keep
distance between the wheelchair and any obstacles. The framework designed here is
semi-autonomous; it keeps control in the hands of the user but allows the wheelchair’s
sensors and intelligence to communicate in tandem with the user.
This framework has three major components. The first one infers the intention
of the user by trying to determine which goal, of all the possible target destinations, is
the goal the user is trying to navigate to. The second component uses a harmonic
function path planner to determine what it considers the best way to navigate to that
destination and computes the discrepancy between its autonomous interpretation of the
navigation task and the user’s driving and translates that into a corrective suggestion
consisting of a directional change suggestion and a confidence/urgency measure for this
change. The third component finally takes these suggestions and translates them into
force-feedback to communication them to the user.
The remainder of this thesis is structured in the following way: Chapter 2
examines background work, the history of wheelchairs, including recent work on

4
intelligent and force-feedback-capable wheelchairs, and provides a review of important
concepts (including force-feedback and harmonic functions) for the design and
implementation of this project. Chapters 3 and 4 present the design philosophy and
how the design was implemented, respectively, before Chapters 5 and 6 detail
experiments performed with the implementation, and present and analyze the results.
Chapter 7 concludes the thesis and discusses possible future work.

5
CHAPTER 2
BACKGROUND
2.1 Wheelchair History
The idea of a wheeled chair being used to assist the elderly or people with
disabilities has been around since the sixth century A.D. and wheelchairs were well-
developed in Europe and commonly found as early as the sixteenth century. But the last
fifty years have seen some of the most and the fastest development in wheelchair
technology [13]. The first electric wheelchairs were used during World War I for the
handicapped, and consisted of an electric motor with a simple single-speed on/off
switch applied to the existing manual-style wheelchair. The first patent was issued for
an electric wheelchair in 1940 [14]. In the 1970’s wheelchair frames made of aircraft
quality aluminum were introduced into the market, and starting in the 1990’s the idea of
a “smart” wheelchair started to gain support.
2.2 Intelligent Wheelchairs
The history of artificially intelligent or “smart” wheelchair research and design
is one of several prototype development projects but few commercial products. Table
2.1 lists a representative (yet not exhaustive) sample of fifteen current and recent
research projects, and yet only two North American Companies, Applied AI Systems
Incorporated [15] and Activ-Media sell smart wheelchairs for use by researchers and
only one smart wheelchair, the Communication Aids for Language and Learning

6
(CALL) Center “Smart Wheelchair” [16] is commercially available, and even then only
in Europe [17].
Table 2.1 Current and Recent Smart Wheelchair Research Projects [32]
System Name Sensors
CPWNS [18] Vision, Dead Reckoning
The Intelligent Wheelchair [19] Vision, Infrared, Sonar
Intelligent Wheelchair System
[20]
Vision, Sonar, Gesture Recognition
INRO [21] GPS, Sonar, Drop-Off Detector
MAid [22] Sonar, Infrared, Laser Range Finder, Dead
Reckoning
OMNI [23] Sonar, Infrared, Bump, Dead Reckoning
RobChair [24] Sonar, Infrared, Bump
Rolland [25] Vision, Sonar, Dead Reckoning, Infrared, Bump
Sensors
SENARIO [26] Dead Reckoning, Sonar
SIRIUS [27] Sonar, Dead Reckoning
Smart Wheelchair [16] Line Trackers, Bump Sensors
Smart Wheelchair [28] Ultrasonic Beacons
TetraNauta [29] Vision, Infrared, Sonar, Bump Sensors
VAHM [30] Sonar, Infrared, Dead Reckoning
Wheelesely [31] Vision, Infrared, Sonar
The various research projects can be distinguished from each other along a
number of dimensions. The first way to classify intelligent wheelchairs is referred to as
“form factor”. Within this framework, the smart wheelchair projects fall into one of
three categories: modified robots, modified commercially available power wheelchairs,
and “add-on units”. The earliest research attempts into intelligent wheelchair work
were modified mobile robots onto which seats were attached [30, 33]. Once the field of
smart wheelchair research was established, however, the majority of prototype
development projects have been based on heavily modified, commercially available

7
power wheelchairs [2, 22, 23, 24]. The third category, “add-on units”, rely on creating
a system that can be attached to and removed from a commercially available power
wheelchair without heavily modifying the wheelchair itself with the idea that this
method would be more economical and therefore more likely to assist users in the real
world [32, 34, 35, 36, 37].
To further distinguish the various research projects, the onboard sensors used by
each smart wheelchair can be discussed; Table 2.1 lists for each project the sensor
systems used. The most popular sensor systems, based on frequency of use, are
ultrasonic acoustic range finders (Sonar) and infrared range finders (IR). Sonar sensors
are accurate when the emitted sound wave strikes an obstacle head on, but are
susceptible to errors when the angle of incidence of the obstacle increases. Also, “cross
talk” is possible, when a signal is received by a sensor other than the one that initially
generated it. Infrared systems have their own difficulties with overly refractive
surfaces. However, both sonar and infrared sensors are well understood, lightweight,
and inexpensive.
Beyond sonar and IR systems, smart wheelchairs have been developed that
utilize laser range finders (which give a 180-degree sweep of the environment), camera
vision systems, GPS, ultrasonic beacons, and sensors placed in such a way as to detect a
“drop off”, i.e. a sudden change in level that would occur with a staircase or a curb.
Many systems also include bump sensors, but these end up as little more than a collision
detection system.

8
Besides work in chair design, sensing and control, a significant amount of
research has been applied to explore alternatives in the realm of interface methods for
intelligent wheelchairs. Joysticks and switches are considered the “traditional” input
methods, but they certainly are not the only type. Voice recognition has been used for
smart wheelchairs, with varying degrees of success [2, 26, 29], but continues to be
sought after because of the availability of commercial voice recognition software.
Other methods include using a camera vision system to detect gestures [5] or the
position of the user’s head [38], detecting the user’s “sight path” using electro-
oculographic activity [31], or, introduced very recently, intercepting commands sent
from the brain to the voice box [39]. The purpose of this thesis project is an expansion
on a subset of the field of interface methods: force-feedback.
2.3 Force-Feedback Enabled Wheelchairs
Research in applying force-feedback technology to artificially intelligent
wheelchairs has been limited, but can still serve as an example of the potential for force-
feedback as applied to artificially intelligent wheelchairs. The following presents a
review of this work.
The Luoson III, out of the National Chung Cheng University in Taiwan, was
designed by Ren Luo, Chi-Yang Hu, Tse Min Chen and Meng-Hisien Lin to aid a blind
user in his or her everyday activities [10]. The Luoson III uses an ultrasonic sensor
arrangement on the wheelchair to gather environmental data, and uses a Microsoft
Force Feedback Pro joystick to play force-feedback effects. The system is set up to use
Grey theory [40] for motion prediction to predict the trajectory of the wheelchair and if

9
the wheelchair is going to strike an obstacle, then a force effect is played in an attempt
to repel the user away from the obstacle [41].
Another wheelchair system out of the University of Pittsburgh, based on the
work by James Protho, Edmund LoPresti and David Brienza, provided a description of
two differing philosophies for force-feedback effect design [11, 42]. The two
philosophies presented incorporate the ideas of “passive assistance” versus “active
assistance”, where passive assistance results in a joystick that resists movement towards
an obstacle, while active assistance causes the joystick to actively push away from the
obstacle. Their pilot work indicated that “active assistance” gave the users the
maximum efficiency [11]. The designers tested their algorithms by using a virtual
reality system, and their results showed fewer collisions when using the system versus
driving without it.
Finally, A. Fattouh, M. Sahnoun and G. Bourhis at Metz University in France
created their own intelligent powered wheelchair reminiscent of the Luoson III [9, 43].
A series of distance sensors is utilized to create a feedback force vector that reflects
away from the obstacle(s) perceived by the sensors. The force vector is created as an
average of the feedback forces generated by all of the sensors, and each feedback force
is given by:
fi = 1/di e j(π+
θi)
where di and θi are the magnitude and the angle of the vector between the ith
sensor and the nearest detected obstacle [5].

10
This system was implemented in a virtual reality simulation system using a
Microsoft Sidewinder Force Feedback 2 joystick and resulted in fewer collisions, while
no significant influence was found on drive time or drive distance.
2.4 Force-Feedback
“Force-feedback” is the general name given to any haptic interface device,
“haptic” meaning anything related to or based on the sense of touch. Like other
computer interface devices, a “force-feedback” device’s purpose is to provide input
and/or output capabilities for the user. Audio interfaces, like speakers and
microphones, use sound to interact with the user; visual interfaces use images to
interact. Likewise, a haptic interface uses touch sensations, which range from simple
vibration to much more complicated, robust effects that can emulate the feeling of
weight, density, liquid, motion, and more, to interact with the user.
Haptics have been applied to various touch-based interface devices, including
mice, trackballs, racing wheels, pointing devices like the Novint Falcon, and gamepads,
but one of the earliest uses and most popular implementations is the force-feedback
joystick. A joystick, in its simplest sense, is a vertical grip that pivots around a fixed
end, and either the angle of the joystick about that pivot, or the displacement from the
neutral position (given in two-dimensional Cartesian coordinates) is then transmitted to
the computer [44]. Joysticks have been used in many applications, from flight control
to gaming to electric powered wheelchairs because they present a simple, intuitive, and
effective method for control.

11
2.4.1 Mechanics
There are three primary components to any force-feedback joystick: the gimbal,
the transmission, and the actuators (or motors). Beyond this, joysticks may differ in
their shape and size, the number of push-buttons available or the availability of other
inputs such as a throttle or a “hat-switch”. The “gimbal” connects the stick of the
joystick to the transmission. The most popular style of gimbal is known as a “double-
slotted bale”. As seen in Figure 2.1, a double-slotted bale consists of two slotted arcs
which are mounted perpendicular to each other through which the joystick slides. The
displacement of each slotted arc is used to determine the angle of the joystick [45].
Figure 2.1 Double Slotted Bale [45]
The transmission connects the gimbal to the actuators. Using a cable or belt
drive, the system transmits the power from the actuators to the gimbal, allowing the user

12
to feel the force that the motors provide. Cable or belt drive transmissions are used in
lieu of geared transmissions because of the need for back-drivability and tight force
response while reducing noise, something that a geared transmission does not provide.
The actuators provide the force behind force-feedback. Force-feedback
joysticks use two motors that exert about one pound of force per motor on average,
peaking at around one and a half pounds. Motor quality is a concern; the higher the
quality of the motors within the joystick, the more subtle the force that can be affected
onto the user. Cheaper motors, on the other hand, exhibit higher friction, dampening
out those subtle forces [45].
2.4.2 Force-Feedback Effects
The encapsulated description of force-response data sent to the force-feedback
device is commonly referred to as an “effect”. Effects can be categorized in three
distinct dimensions: static vs. dynamic, one-shot vs. open-ended, and interactive vs.
time-based [45].
Static effects are pre-rendered force-feedback effects, designed and uploaded to
the joystick in advance of being played. They can be described within the code of the
application or externally designed in a sensation editor. Static effects can remain on the
device as long as there is free RAM for them. Dynamic effects are modified as they are
played; these are more complicated to design because they depend on the position of the
joystick, amongst other factors, and are much more complicated to test for the same
reason. However, they can give a more robust tactile response to the user.

13
One-shot effects are effects with a finite duration; they are simply executed
when necessary and stop on their own. Open-ended effects require the system to
monitor state information so that the system stops the effect when necessary. There is
no duration for an open-ended effect; it will play as long as the system deems it to be
appropriate.
Finally, effects are often divided between interactive and time-based.
Interactive effects are based on the state of the joystick, whereas time-based effects are
played identically regardless of the joysticks position, velocity or acceleration.
Interactive effects include spring effects (the feeling of pushing against a spring) and
damper effects (the feeling of pushing through water), whereas time-based effects
include constant force (a push in a given direction), and vibration. With these
distinctions, force-feedback effects can be categorized and implemented. The kick of a
pistol when fired, for example, would be static, one-shot, and time-based, while the
feeling of driving a car through a pool of mud would be dynamic, open-ended and
interactive. This method of categorization provides a robust metric for any and all
force-feedback implementations
2.5 Harmonic Function Path Planning
2.5.1 Harmonic Functions
The term “harmonic function” refers to any real function (i.e. function whose
range is in the real numbers) with continuous second partial derivatives which satisfy
Laplace’s Equation (Figure 2.2) [46].

14
Figure 2.2 Laplace’s Equation
is known as the Laplacian and is defined, in the most general form, as the sum
of second derivatives:
∑= ∂
∂=∇
N
i ix12
22 φφ
Solutions to Laplace’s Equation have no local maxima or minima, and are
smooth and differentiable. An example of a harmonic function is seen in Figure 2.3.
Figure 2.3 The harmonic function [47]
2.5.2 Harmonic Functions for Robotic Path Planning
Harmonic functions have been used repeatedly in robotics research as a method
for path planning in a known environment [48, 49, 50, 51]. The operation of harmonic
functions for path planning can be illustrated using the example function given in
Figure 2.3. Considering the points where the potential value, φ, is equal to one as
obstacles and the points where φ is equal to zero as goals, the potential at all other

15
points has two useful properties; i) the potential value at these points act as a description
of where that point is relative to obstacles and goals (in terms of collision probability),
and ii) the slope of the function at each point serves as a direction away from obstacles
and towards goals.
As stated, the potential value at any given point gives a relative idea of where
that point is in relation to obstacles and goals. In particular the potential value of the
harmonic functions used for robotic path planning is equal to the probability that the
agent will collide with an obstacle prior to reaching a goal given a random series of
movements (i.e. assuming that the robot performs a random walk). This probability is
0.0 at a goal because the assumption is made that the agent won’t execute any more
moves once it has reached its goal [52].
Considering the harmonic function as a description of a robot’s environment and
placing the robot at any location within the domain of the harmonic function the
potential function provides the robot with information on how to get to a goal, how to
maneuver away from obstacles, and with the probability that it will collide with an
obstacle while moving towards the goal, all useful for allowing an agent to operate
autonomously.
In nature potential surfaces frequently define the movement paths of objects.
For example, a ball placed on an uneven surface will result in the ball rolling from
high points towards low points, finally resting in locations of local minima where the
ball is “trapped”; beads of water will act in the same fashion. This is commonly known
as taking “the path of least resistance”. Robots using potential field based path planning

16
use the same principle by performing gradient descent on a potential function where
goals are defined as minima and obstacles as maxima. The benefit of using harmonic
functions to encapsulate this, as noted in Section 2.5.2, is that there are no local minima,
meaning that if a path from the current location to a goal exists, following the slope of a
harmonic function, will lead the robot to a goal and without it being trapped along the
way. Given the locations of obstacles and goals in the environment, the harmonic
function can be calculated in a pre-processing step and then only has to be modified
slightly at run-time when new obstacles are encountered, which is cost-efficient in
computing terms.

17
CHAPTER 3
METHODOLOGY
The objectives for the assistive, semi-autonomous force-feedback paradigm
introduced in this thesis for an intelligent wheelchair is naturally driven by two
functionalities: the ability to infer the user’s intention in terms of their navigation goals,
and the ability to help direct the user towards their intended goal and away from
potential hazards. This natural distinction is reflected in this methodology through a
design consisting of on two interconnected loops: an outer loop that attempts to infer the
intended goal location of the user, and an inner loop that directs the user towards the
inferred goal.
3.1 Goal Prediction Loop
Figure 3.1 Outer Goal Prediction Loop Diagram
External
User
Preference
System
Harmonic
Function
Path
Planner
Goal
Selection
Run-
Time
System
Location,
Orientation,
Past
Behavior
Goals
Predicted
Goal
Grid

18
The objective of the outer procedural loop is to estimate the desired navigation
goal of the user based on the information available to the system and to provide this
estimate to the run-time loop, enabling it to direct the user towards that goal. As shown
in Figure 3.1, the outer loop utilizes run-time data of the user’s position and behavior
together with information about the set of potential goals in the environment provided
by an external user preference system to predict the intended goal location. Using this
information it calculates the harmonic function for that goal, which it passes in a
discretized grid format to the Run-Time System. This process is repeated when the
user’s intended goal needs to be recalculated based on the new location, orientation and
behavioral data from the user; this repetition can occur periodically according to a
specific rate, or can potentially be event-driven, repeating when the user actions no
longer match with the path to the selected goal.
3.1.1. Goal Selection
In this approach, an external system that uses known user preferences and
features extracted from the wheelchair’s percepts to identify potential goal location for
user navigation tasks (the exact operation of this user preference system is outside the
scope of this thesis work and is assumed to exist as an external component), provides a
set of potential goals. This goal set, together with data about the orientation of the
wheelchair and a sequence of previous actions occurring while the Goal Selection step
is conducted serves as input to the goal selection component. If only one goal is known,
then no calculations need to be made, and this goal is used as the goal location in the
harmonic function path planner.

19
However, in the majority of situations multiple potential goals will be present in
a real world environment, for each of which the user preference system also provides a
“confidence” factor that acts as a weight for the corresponding goal. The system then
selects one goal by weighing the confidence for each goal against the amount of “work”
that the system would have to incur to move to that goal. This “work” is the angular
difference between a set of recent user actions θu and the action that would be in
accordance with the path from the harmonic function path planner θh.
W = Σ (θu – θh)
The idea behind this is that the user’s intentions can be inferred from their
already known tendencies and an observation of actions that the user has already made
towards their goal compared to each of the goals.
The goal that is then selected by the harmonic function is the one with the best
combination of “confidence”:
C = Iw - W
That is, the highest likelihood that the user would pursue that goal independent
of the user’s recent actions (i.e. the initial weight Iw), and the least amount of “work” W
necessary to direct the wheelchair towards the goal.
3.1.2. Harmonic Function
Given the goal prediction from the goal selection component, the system then
calculates the harmonic function for the environment to set a potential field value for
every location in the environment. Within the system, the environment is represented
as a two dimensional array containing potential values where 1.0 indicates a wall or

20
obstacle, 0.0 indicates a goal, and all values in between indicate the potential for that
location. These potential values are calculated by iterating through the values, grid[i,j],
for all locations, (x=i, y=j), in the environment and calculating a residual error, Re, for
each grid value using Successive Over-Relaxation (SOR) [53] as:
Re = 0.25 x (nb1+nb2+nb3+nb4) –grid[i,j]
grid[i,j] = grid[i,j] + w(Re)
nb1 = grid[i-1,j]
nb2 = grid[i+1,j]
nb3 = grid[i,j-1] nb4 = grid[i,j+1]
Where w is an over-relaxation constant to minimize the number of iterations
necessary before convergence.
The maximum residual error is saved for each iteration over the grid, and as
long as the maximum Re is greater than 10-14
another iteration of SOR is performed and
the process is repeated. The threshold is determined here based on numerical resolution
and required precision considerations and could be varied depending on the computer
used and the size and complexity of the grid and the environment. When the maximum
residual error is less than 10-14
, then the iteration is terminated and the process is
assumed to have converged to the final harmonic function. The resulting grid is the
internal representation of the environment and of the autonomous path predictions, and
is used by the run-time loop for all of its force-feedback calculations.
21
3.2 Run-Time Loop
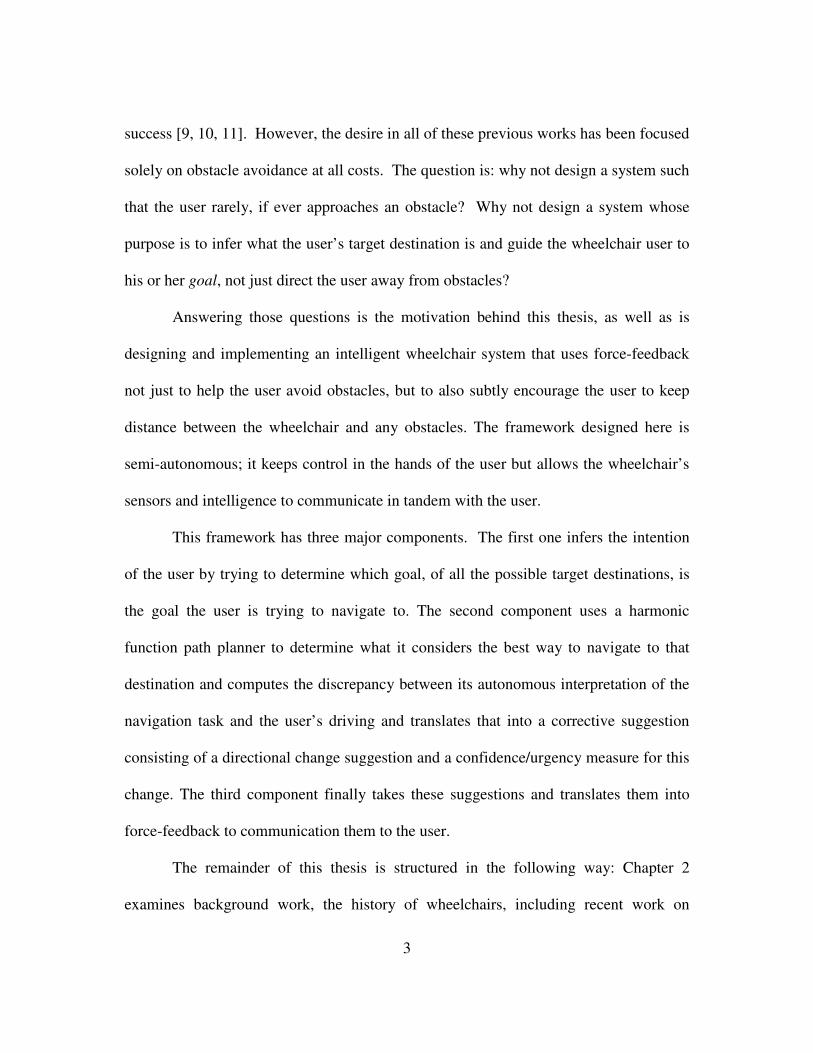
Figure 3.2 Run-Time Force Feedback Loop Diagram
The Run-Time Loop (Figure 3.2) runs as the user is directing the wheelchair
around the environment. In this loop location and orientation data are first acquired
from the wheelchair and then used to produce a force vector (derived in terms of a
direction and a “risk” factor, which will be discussed in the next sections). This vector
is then translated into a force-feedback effect which is played on the user’s joystick.
The joystick’s position is finally used to drive the wheelchair’s motors and the loop
repeats. In this process the path prediction of the autonomous system only indirectly
influences the wheelchair’s behavior by providing guidance to the user. The actual drive
commands are always provided by the user (although the user could opt to simply
follow the force vector, and thus follow the harmonic function path).
Wheelchair
Location,
Orientation
Force
Effect
Playback
(Joystick)
Force
Effect
Generation
Motors
Movement
Risk,
Direction
Force Vector Motor
Command

22
3.2.1. Force Vector Creation
The best way to encapsulate a force-feedback effect for wheelchair control is to
consider it as a force vector. The reason that a force vector (i.e. a constant force) was
chosen here as the effect is two-fold: i) it is a relatively intuitive way to suggest a
command because the suggestion and the way the user implements the suggestion are
identical, and ii) previous work of Protho et.al. found that active assistance gives the
user the maximum efficiency (as stated in Section 2.4). Allowing feedback and control
commands to use the same device and corresponding formats also allows the user to let
the wheelchair drive itself by not counteracting any of the force-feedback but simply
following the suggested directions. The two components that make up and describe a
force vector are the direction of the vector, and the length or amount of force behind it.
The following sections will describe how the force vector is created by describing how
the direction and force are calculated, and how the force-feedback effect is played.
3.2.1.1 Direction
The direction for the force vector can not simply be the direction of the slope of
the harmonic function for the user’s current location in the environment because the
wheelchair is non-holonomic, i.e. it cannot move in arbitrary directions at any point in
time but is limited to forward, backward, forward turning, backward turning, and
turning in place. Because of this consideration, the direction of the force vector must be
relative to the orientation of the wheelchair (or the joystick).
To avoid discontinuities between grid locations, the harmonic function path
planner uses interpolation to make the (approximate) harmonic function continuous, and

23
thus provides a real-valued gradient as the preferred path direction of the autonomous
path planning component. Using this, the system then computes the angular difference
between the gradient direction θg and the orientation of the wheelchair θo for use as the
direction for the force-vector Θf:
Θf = θo - θg
3.2.1.2 Risk Assumption
The amount of force for the force vector is calculated to reflect how “risky” the
indicated command of the user is when compared to the optimal drive direction as given
by the harmonic function. The rationale here is that if the user is not giving the
wheelchair a “risky” command, then the semi-autonomous system would not need to
emphasize as much what it considers the “proper action”. However, if the action is
risky then the joystick should indicate this to the user by producing a more forceful
effect and thus by providing a stronger “incentive” for the user to reconsider the action.
Risk, in this sense, can be divided into two categories: short-term, current risk
and assumed future risk. The quantifiable properties of current or “local” risk are:
• The velocity of the wheelchair
• The potential value at the wheelchair’s current location
• The potential value at the location that the chair will occupy next.
• The difference between the two potential values
Risk at the “future” level is relatively simpler:
• The potential value at the wheelchair’s current location

24
• The potential value at a location some distance ahead of the wheelchair
(scaled based on the current velocity)
• The difference between the two potential values
Formally these concepts can be encapsulated in the equations:
Rt = Rc – Rf
Rc = V + P[x,y] – (P[x,y] – P[xn,yn])
Rf = P[x,y] – P[xf,yf]
The velocity V of the wheelchair adds to the local risk of the user’s command Rc
in a straightforward way; the faster the wheelchair is moving, the more likely that
random behavior at that position will result in a collision with an obstacle. The
potential value P[x,y] at that location is the probability that collision will occur, given
random movements [52]. The potential value at the next location P[xn,yn] is important,
because if its value is less than the value at the current location, then the user is moving
to a location that is “safer” since the probability of a collision decreased. This can be
seen as going “down the slope” of the harmonic function towards the goal and away
from obstacles. This is also true for future, long-term risk Rf. When the potential value
at a location some distance ahead of the robot in the direction that the user has indicated
P[xf,yf] is used, if it is less than the current potential value, the user is directing the to a
safer location given that no short term risks during the short distance move is incurred.
What the tradeoff between the two risk components allows the system to do is,
depending on the capabilities of the user, to not discourage the user to perform a locally
more risky action, such as moving through a narrow doorway, if this leads to a gain in

25
terms of the risk in the foreseeable future. The end result of describing risk in this
manner is that the riskiest behavior would be one where the user is moving quickly,
near an obstacle, and away from the goal or towards an obstacle.
3.2.2. Playing The Force-Feedback Effect
With the direction and force of the effect calculated, they are then applied to the
joystick in the form of a force-feedback effect. In this way the system communicates to
the user both the severity of the situation (through the amount of force applied) and
what action the system thinks the user should perform next in order to safely reach the
goal (indicated by the direction of the effect).
3.2.3. Motor Commands
Finally, the position of the joystick is sent to the robot control system to
interpret and turn into wheelchair movements. In the traditional way, forward and
backward position of the joystick is here interpreted as a desired velocity while lateral
angular position is translated into steering commands for the wheelchair. The resulting
movement, in turn, effects the user’s position in the harmonic function grid, the sensor
data and the velocity of the wheelchair, providing new data for the next iteration of the
run-time loop.

26
CHAPTER 4
IMPLEMENTATION
4.1 Implementation Setup
The implementation of the design methodology has been created on a Dell
Dimension 8250, with a 2.66 GHz Pentium 4 CPU running Windows XP, using
Microsoft Visual Studio 2005 and the C# programming language (chosen because of its
connection with DirectX and DirectInput). The force-feedback joystick used for the
implementation was a Microsoft Sidewinder Force Feedback 2. This joystick was
chosen because of its use in previous academic explorations in force-feedback research
[9, 10]. The entire implementation has been implemented on top of Microsoft Robotics
Studio.
Figure 4.1 Implementation Setup

27
4.2 Microsoft Robotics Studio
Implementing the design outlined in Chapter 3 has been completed as a
component in the context of Microsoft’s Robotics Studio (MSRS). MSRS is a
Windows-based environment created to assist academic, hobbyist and commercial
developers of robotic applications. MSRS includes a physics-based simulation engine
[54], which was desirable for this project, and is modifiable through C#, Visual Basic,
or VPL [55], the graphic dataflow-based programming language designed for MSRS.
4.2.1 Three Major Modifications
The implementation for this project has been incorporated into MSRS through
modifications to three primary files: SimulatedDifferentialDrive.cs,
SimulationTutorial2.cs, and DriveControl.cs. The first two here are mainly concerned
with the details of the robot and the environment and the ways in which sensory
information is processed and passed to the actual force feedback and goal prediction
components, while the third contains the main implementation of the proposed
framework.
The simplest modification of the three is the modification to
SimulatedDifferentialDrive.cs.
For the purposes of the implementation, the position and orientation of the
wheelchair within the environment are needed to be made available to other parts of the
simulation (specifically to DriveControl.cs, as will be seen). The only location where
the position and orientation are known is within SimulatedDifferentialDrive, and so the
function UpdateStateFromSimulation( ) was modified to encapsulate the position and
28
orientation and pass them to the functions that DriveControl.cs uses within the
UpdateMotorData( ) function. The main reason for this was to avoid the additional
overhead of having to implement a sensor processing and robot localization component
which would be used in the context of the real wheelchair to correct errors in the
odometric position estimate of the robot.
The modifications to SimulationTutorial2.cs are also rather simple. Within
PopulateWorld( ), a function was added in to load data from the text file “map1.txt”
using C#’s StreamReader and extract the date into an internal two-dimensional array
that represents the environment. This data contains information that the simulation uses
to create the environment and where to place the robot upon initialization. The
environment is created within the simulation in a function called AddWalls( ); within
this function the implementation iterates through grid[i,j], placing 1x1x1 walls at every
location at which the discretized representation in grid has a value of 1.
PopulateWorld( ) has also been modified to add a Pioneer 3DX Robot at the location
given in the grid[i,j] with the value of 2, this is the starting location for the simulated
robot.
4.3 Design Implementation
The majority of the implementation and, in fact, all of the design is incorporated
as a modification to MSRS’s DriveControl.cs. DriveControl.cs runs what is referred to
within MSRS as the “Dashboard”, the graphical user interface that allows the user to
connect to the robotic entity (which, in the implementation, is the wheelchair), connect
to a joystick to send motor commands, connect to the laser range finder on the robot and

29
see what values the sensors are returning, and, in its modified state, gives the user
access to the path planner and the force-feedback effects.
For the implementation, certain initializations need to occur. An environment
needs to be loaded from an external map file. For ease of use during testing, this
environment needs to be loaded into the internal environmental representation of MSRS
and into the path-planning graphics. In addition the joystick needs to be initialized so
that force-feedback effects can be played.
Figure 4.2 Dashboard Window Screenshot
To achieve these modifications, the function initPPGraphics( ) was
implemented, which, like the function within SimulationTutorial2.cs, loads data from
the text file “map1.txt” using C#’s StreamReader capabilities for file input/output
interaction, and extracts it into an internal two-dimensional array known as grid[i,j] to
represent the environment. InitPPGraphics( ) also initializes the graphics for path-

30
planning using C#’s simple Bitmap graphics techniques. Following this graphics and
environment initialization, initFFDevices( ) acquires the joystick device as a
DirectInput device and enables the ability to play force-feedback effects [56].
4.3.1 Goal Prediction
With the graphics, environment and force-feedback joystick initialized, the core
of the design implementation can now access all the necessary components of the
system and its details are discussed in the following sections. To simulate the
functionality of the external user preference component, the user here first selects
potential goals in the environment by clicking on the path planning graphic in the
Dashboard (Figure 4.3), which calls the function picPPlan_Click( ). Based on the
location of the mouse cursor within the GUI, the goal location is set within grid, the
internal two-dimensional array, and goalCount is incremented by one for each goal. The
goal information is also stored within a separate array, goalArray, with each goal
receiving a weight that decrements as more goals are added so that each new goal has a
smaller initial weight than any previous goal, thus simulating the idea of user
preferences which indicate different likelihoods with which a particular user might
pursue each of the goals. This GUI-based goal set definition process used for the
experiments presented in this thesis serves as a stand-in for the automatic user
preference component which would in practice identify potential goal locations based
on user tendencies and preferences. The latter goal array is used for the goal selection
component in the outer loop.

31
Below the path planning display in the GUI (shown in Figure 4.3) are two
buttons, one of which clears the display and the other, when clicked, initiates path
planning by predicting the user’s goal if more than one goal has been selected by the
user, and then initiating path planning for the selected goal. When this is finished,
updatePPGraphics( ) is called, which paints the new grid values to the path planning
window.
Figure 4.3 Path Planning Window Screenshot
There are two major constructs that make up path-planning: goal selection and
harmonic function generation. Goal Selection is only initiated if the user selects more

32
than one goal; and proceeds by first determining the weight for each goal. This, in
theory, would be given to the path-planning system by an external system for measuring
and tracking user tendencies and preferences.
Goal Selection is implemented within the function runPPbutton_Click( ), the
function initiated when the “Run Path Planning” button is clicked by the user. If
goalCount is greater than one, then Goal Selection’s implementation is initiated. As the
robot moves through the environment, a queue of five actions is kept. As a new action
is committed, the oldest action in the queue is removed. When the goal selection is
initiated, the confidence value for each goal is modified based on if the last five actions
indicate an intention towards that goal (the action’s similarity to the path created by the
harmonic function). The idea of remembering the last five actions of the user was
decided as a result of early pilot work indicating that fewer actions kept reduced the
accuracy of the goal selection system, whereas more actions kept had a negligible effect
on the system.
Once all goals have had their confidence values computed, the goal with the
highest likelihood of being the one targeted by the user is selected as the goal for path-
planning, and the rest of the goal locations are set to the initial value for empty space
within grid.
The harmonic function is generated in the same way as described in Chapter 3.
A function called sor_once_2D( ), based on the concept of Successive Over-Relaxation,
is ran until the residual error that it returns is less than 10-14
. Sor_once_2D( ) iterates
through the grid, calculating the residual error at each grid location and keeping track of

33
it. For each grid location, its value is updated by adding its residual error multiplied by
the SOR constant for a regular two dimensional grid to its previous value, and in doing
so the potential function is relaxed until it converges to a harmonic function over the
entire grid (note that the harmonic constraint is by design violated at the goal and
obstacle locations by holds at every location in free space).
4.3.2 Run-Time Loop
With the pre-processing step accomplished, the run-time loop is initiated when
the user connects to the wheelchair entity and turns on the motors. As the Run-Time
Loop runs, the user will see the results of their actions (i.e. joystick commands) in the
Simulation Environment window (Figure 4.4).
Figure 4.4 Simulation Environment Window Screenshot
Within DriveControl.cs there is a class called UpdateMotorData( ) that is called
continuously and whose input is the variable data that gives DriveControl access to the
functions and parameters of the simulated differential drive mechanism of the

34
wheelchair. This is important because this gives the program access to the robot
entity’s position, orientation and velocity.
The modifications to UpdateMotorData( ) are extensive, and begin by first
checking to see if the robot is in the same location as the goal, and if it is, then all force-
feedback effects are halted. If the wheelchair is not at the goal, then the function
continues by checking to see if the position of the chair has changed sufficiently to
cause it to enter a different grid cell, the internal discretized environment representation.
The wheelchair’s position is maintained and updated constantly within this function,
and no further action is taken if the wheelchair is still within the same grid cell. The
reason for this check and the limitation of the force feedback update rate to grid cell
changes is here strictly for program optimization reasons. If the force-feedback effects
are played regardless of whether the robot has changed position, than the system slows
down drastically due to the high rate of I/O actions to the joystick which in pilot work
overwhelmed the C# interface. If the chair has indeed changed positions, then in
accordance with the design methodology the force vector direction and the force vector
magnitude, or risk, is calculated and translated into a force effect for the joystick.
4.3.2.1 Risk Assumption
To be able to determine the relative amount of risk of the action indicated by the
user through the joystick for the wheelchair at its current location, four variables are
used: the velocity of the wheelchair, the orientation of the wheelchair, the wheelchair’s
Cartesian coordinates within the environment, and the direction of the joystick.

35
The direction of the joystick and the current location and orientation of the
wheelchair allow the system to determine the potential value of the next location in the
environmental grid, enabling it to evaluate the difference between the current and the
next value of the harmonic potential, and thus its slope in the user-desired direction.
To incorporate the risk calculation and force feedback generation within
Microsoft Robotics Studio, the riskAssessment( ) function has been added to
DriveControl.cs and is called from UpdateMotorData( ). RiskAssessment( ) receives as
inputs the velocity (as a double precision real), and direction, curX, and curY (in
discretized format as integers). Direction is, as it is in other parts of the
implementation, discretized into eight quadrants and encoded as an integer ranging from
one to eight, where one represents northwest, two represents north, etc. increasing in the
clockwise direction, indicating the cardinal directions.
This allows for the pre-calculation of a manageable set of potential force effects
and simplifies the implementation of the risk assessment and force feedback
components by using a simple switch statement for every directional possibility. The
implementation discretizes the concept of risk for this very purpose; this was decided
upon based on the early testing, where it was found that loading in a static force effect
and playing it did not slow the simulation down, whereas attempting to modify a
dynamic force effect did.
For every directional possibility, nextPotential is determined and using this the
system adds a level of local risk if velocity is below -8, because velocity is negative
within MSRS if the robot is moving forward, if potential is above 0.9, and if the

36
difference between potential and nextPotential is less than zero, meaning that the robot
is moving conversely to the slope of the harmonic function. This number of prevalent
local risk factors is considered equivalent to the local risk equation given in Chapter 3
with the difference that this number is not continuous, whereas the equation would be.
Future risk is implemented similar to the way in which the risk attributed to the
next potential value is determined within local risk. Again, a switch statement based on
the direction is used, where for the direction the user chooses the next potential value is
calculated. However because this is “future” risk, the calculation isn’t as simple; the
amount of distance in the future that the system examines is scaled based on the current
velocity of the wheelchair.
These two calculations of risk are purposefully discrete for this implementation;
as previously stated, the system uses a pre-calculation of a manageable set of potential
force effects; for every combination of direction, current risk and future risk there exists
a correlating force effect.
4.3.2.2 Force Vector Direction
With the risk level known, the modified UpdateMotorData( ) then calculates the
direction for the force vector based on the difference between the slope of the potential
field around the robot’s current location and the orientation of the robot.
4.3.2.3 Force-Feedback Effect Playback
Within loadFFEffect( ) another switch/case statement loads the appropriate
force-feedback effect for every direction/risk pair into the joystick. These effects are
static and were created using Microsoft’s Force Feedback Editor within Microsoft’s

37
DirectX SDK [57]. Once loaded, the program returns to UpdateMotorData( ), the effect
is played, the robot’s position is updated within the grid, motor commands are sent to
the simulated robot, and the process repeats.

38
CHAPTER 5
EXPERIMENTS
In an attempt to better understand the ramifications of the choices made in the
design and implementation of this thesis project, experiments have been undertaken.
The two most crucial portions of the project have been tested: goal selection in the outer
loop and the effectiveness of the force feedback effects in the run-time loop. The
following sections describe of the experiments carried out, followed by the results of the
experiments, and their analysis.
5.1 Testing Methodology
5.1.1 Goal Selection
The goal selection system is a vital component of both the design and
implementation of this project and therefore an evaluation of its sensitivity to user
deviations from the optimal path to the intended goal and an analysis in terms of
potential weaknesses in the system is paramount. The problem with testing the goal
selection system is that it is, in part, based on a classification that exists in theory but
not yet in practice: the system of user preferences and tendencies that gives the potential
goals their initial weights. To alleviate this factor, the system was evaluated by testing
the different scenarios that may occur.
The factors that influence the scenario that the goal selection is based on can be
classified into three categories: the weight given to the goal that the user intends, the

39
actions the user has already taken towards the intended goal, and how well aligned the
wheelchair is with respect to the goals as seen in Table 5.1.
Table 5.1 Scenario Modifiers
Goal Weight Previous Actions Similarity
High Towards the intended goal Very similar
Medium Neutral movement Slightly similar
Low Away from the intended goal Very dissimilar
To experiment with the goal selection system then, all combinations of the
different categories of factors were observed and the results of the Goal Selection
system were recorded. Each experiment consisted of a simple environment where five
distinct goals were created within the simulation by selecting them within the GUI.
Figure 5.1 shows the different scenarios.
Figure 5.1 Three Goal Selection Environments (Similar, Semi-Similar, and Not
Similar)
For the experiments where the goals were “very similar”, three goals were
placed in a way that made them appear similar to the system (i.e. optimal paths to these
goals followed very similar trajectories) while the other two were kept distinct. For the
1 2 3
4 5
1
2
3 4
5
1 2
3
4
5

40
experiments with “slightly similar” goals, two goals were placed in a way to appear
somewhat similar (i.e. such that optimal paths to them diverged only slowly) and the
other three were kept distinct. In the tests for “very dissimilar” goals, finally, the
intended goal was entirely distinct from the other goals from the perspective of the
wheelchair. To evaluate the accuracy of the goal prediction under these different
conditions, the user performed actions toward each of the intended goals, neutral actions
that are neither towards nor away from the goal, and actions that were away from the
goal. The resulting likelihood of the prediction for each goal were recorded and
analyzed.
5.1.2 Virtual Environment Test Course
To quantify the effect of using a harmonic function path planning system as a
basis for force-feedback corrective suggestions on wheelchair performance, a set of
tests has been performed using the computer simulation system described in Chapter 4.
Test subjects used the force-feedback joystick to guide the wheelchair through a virtual
environment (shown in Figure 5.2) and test runs were made both with and without
force-feedback to serve as a comparison.

41
Figure 5.2 Test Course
The test subjects were all persons without major disabilities. The time taken to
complete the course, and the number of collisions were evaluated as performance
measures. The test subjects were given five minutes before the tests were initiated to
allow them to familiarize themselves with the simulation, both with and without force-
feedback. Six test runs were then performed for each subject, three with force-feedback
and three without.
5.1.3 Post Test Survey
As a final measurement to evaluation the performance and effectiveness of the
implementation of this design, all subjects were asked for their opinions after using the
system. They were queried on the following topics:
• Were the force-feedback suggestions helpful in avoiding obstacles?
• Were the force-feedback suggestions helpful in approaching the goal?
42
• Between too forceful and not forceful enough, where would you rank the
force-feedback effects?
The test subjects’ responses were tallied and the results are analyzed in Section
5.2.3.
5.2 Test Results
5.2.1 Goal Selection Test Results
Nine scenarios were tested for the nine combinations of the scenario modifiers
for similarity and user movements: towards, neutral and away from the goal combined
with similar, semi-similar and non-similar goals in the goal set. The goal here was to
evaluate the sensitivity of the goal prediction approach with respect to different
environment conditions and user behavior in terms of deviations from the best path to
the intended goal. To obtain the results, each scenario was run five times, with the
weight of the intended goal decreasing in rank for each run to test the third scenario
modifier, goal weight. The system’s predicted goal together with the corresponding
predicted likelihood for each goal were recorded. The results are listed and analyzed
below.
The results for the experiment with three similar goals and user movement
towards the intended goal (Goal 1 in Figure 5.1, first environment) are shown in Table
5.2. Here, goals 1 through 3 received very similar predicted likelihoods, with goal 1
(the intended goal whose initial weight decreased with each run) averaging a predicted
likelihood of 32.95%, goal 2 a likelihood of 33.70%, and goal 3 a likelihood of 33.35%.
Goals 4 and 5 were predicted by the system to have zero chance of being the user’s goal

43
in every run. Goal 1 was predicted as the intended goal in the first run, when it had the
highest initial weight, but goal 2 was predicted in runs 2 through 5, when it started with
the highest initial weight. This shows that in situations where paths toward multiple
goals are very similar the initial preference weight can dominate the goal selection, thus
underscoring the importance of an appropriate user preference system.
Table 5.2 Results for Movement Towards the Goal & Multiple Similar Goals
Goal 1 Goal 2 Goal 3 Goal 4 Goal 5
Run 1 33.63% 33.39% 32.98% 0% 0%
Run 2 33.39% 33.63% 32.98% 0% 0%
Run 3 32.98% 33.63% 33.39% 0% 0%
Run 4 32.59% 33.82% 33.59% 0% 0%
Run 5 32.15% 34.05% 33.81% 0% 0%
Average Prediction Likelihood 32.95% 33.70% 33.35% 0.00% 0.00%
Neutral movement with a cluster of similar goals resulted in some interesting
behavior. When the neutral movement was eastward, shown in Table 5.3, goals 1 and 2
both always received a likelihood prediction of 0%, whereas goal 3 received 0% twice
and 96.71% once, goal 4 received 98.57% twice and 3% once, and goal 5% received
1.34% twice and 0% in the third run. Goal 4 was the predicted goal in the first two
runs, and goal 3 was predicted in the third.
Table 5.3 Results for Neutral Movement Eastward & Multiple Similar Goals
Goal 1 Goal 2 Goal 3 Goal 4 Goal 5
Run 1 0% 0% 0% 98.57% 1.34%
Run 2 0% 0% 0% 98.57% 1.34%
Run 3 0% 0% 96.71% 3% 0%

44
Neutral movement westward with a cluster of similar goals (Table 5.4) resulted
in goals 1 and 3 receiving a predicted likelihood of 0% twice, goal 2 receiving 0% once
and 8.12% the second time, goal 4 receiving 48.30% once and 0% the second time, and
goal 5 receiving 51.70% likelihood and 91.88% likelihood of being the user’s intended
goal. In both runs, goal 5 was the goal selected by the system. This behavior can be
understood by realizing that in all cases the neutral movement performed conformed
more closely to either the intention of reaching a goal to the right (goals 3 and 4) or to
the left (goals 2 and 5) of the current location.
Table 5.4 Results for Neutral Movement Westward & Multiple Similar Goals
Goal 1 Goal 2 Goal 3 Goal 4 Goal 5
Run 1 0% 0% 0% 48.30% 51.70%
Run 2 0% 8.12% 0% 0% 91.88%
User actions that were away from the cluster of similar goals resulted in each of
those three goals being predicted to be equally unlikely to be the user’s intended goal,
resulting in likelihoods of 0% for every run (Table 5.5). Goals 4 and 5 were then, for
four of the five runs, considered roughly equally likely, with goal 4 having a slightly
higher predicted likelihood percentage because of its higher initial weight. This caused
goal 4 to be the systems predicted goal in every run.
Table 5.5 Results for Movement Away From the Goal & Multiple Similar Goals
Goal 1 Goal 2 Goal 3 Goal 4 Goal 5
Run 1 0% 0% 0% 50.51% 49.49%
Run 2 0% 0% 0% 50.51% 49.49%
Run 3 0% 0% 0% 54.98% 45.02%
Run 4 0% 0% 0% 50.09% 49.05%
Run 5 0% 0% 0% 50.43% 49.56%

45
Table 5.5 - continued
Average Prediction Likelihood 0.00% 0.00% 0.00% 51.30% 48.52%
In regards to the environment experiments with two semi-similar goals and user
movement towards the intended goal (goal 1 in Figure 5.1, second environment), goal 1
was selected by the system as the user’s intended goal regardless of its initial weight,
which decreased with every run, resulting in an average predicted likelihood of 79.48%
as shown in Table 5.6. Goal 2, the semi-similar goal, came in second in every run with
an average of 20.52% likelihood. Goals 3 through 5 received a predicted likelihood of
0% for every run.
Table 5.6 Results for Movement Towards the Goal & Two Semi-Similar Goals
Goal 1 Goal 2 Goal 3 Goal 4 Goal 5
Run 1 82.11% 17.89% 0% 0% 0%
Run 2 81.54% 18.46% 0% 0% 0%
Run 3 81.35% 18.65% 0% 0% 0%
Run 4 81.08% 18.92% 0% 0% 0%
Run 5 71.31% 28.69% 0% 0% 0%
Average Prediction Likelihood 79.48% 20.52% 0.00% 0.00% 0.00%
Neutral movement was again split between northeastward actions, and
southwestward movement. In response to the first type of neutral movement (shown in
Table 5.7) the system predicted goal 2 as the user’s intended goal for each of the three
runs with predicted likelihoods of 59.65%, 59.42%, and 94.09% respectively. Each
time, goal 3 was the next likely goal, with predicted likelihoods of 40.30%, 40.58%, and
5.90%. Goals 1, 4 and 5 were seen by the system as unlikely to be the user’s

46
anticipated goal, never receiving a prediction of more than 0%. Again, the predicted
goal was the one that was most closely aligned with the movement direction.
Table 5.7 Results for Neutral Movement Northeastward & Two Semi-Similar Goals
Goal 1 Goal 2 Goal 3 Goal 4 Goal 5
Run 1 0% 59.69% 40.30% 0% 0%
Run 2 0% 59.42% 40.58% 0% 0%
Run 3 0% 94.09% 5.90% 0% 0%
When the neutral movement was to the southwest (Table 5.8), goals 3, 4 and 5
were predicted by the system as the user’s most likely projected goals, with goal 5 being
the goal selected most likely for each of the two runs. Goal 3 received predicted
likelihoods of 31.73% and 24.14%, goal 4 received 30.92% and 22.77%, and goal 5
resulted in 37.34% and 52.09%. Goals 1 and 2 always received predictions of 0%.
Table 5.8 Results for Neutral Movement Southwestward & Two Semi-Similar Goals
Goal 1 Goal 2 Goal 3 Goal 4 Goal 5
Run 1 0% 0% 31.73% 30.92% 37.34%
Run 2 0% 0% 24.14% 22.77% 52.09%
Movement away from goal 1 (Table 5.9) eliminated its likelihood in each of the
five test runs. Goal 2 was also mostly eliminated as an option except for the fifth and
final experiment where it had a predicted likelihood of 18.79%. Goals 4 and 5 averaged
31.22% and 21.04% predicted likelihood respectively, with goal 4 receiving values as
low as 13.17% in run 5 and as high as 45.05% in run 4. Goal 5 received prediction
likelihoods as low as 0.76% in run 4 and as high as 32.69% in run 1. Goal 3 was
selected by the system in every run as the intended goal with an average likelihood
percentage at 43.90%.

47
Table 5.9 Results for Movement Away From the Goal & Two Semi-Similar Goals
Goal 1 Goal 2 Goal 3 Goal 4 Goal 5
Run 1 0% 0% 33.95% 33.36% 32.69%
Run 2 0% 0% 38.03% 31.36% 30.61%
Run 3 0% 0% 34.66% 33.16% 32.18%
Run 4 0% 0% 54.19% 45.05% 0.76%
Run 5 0% 18.79% 58.66% 13.17% 8.98%
Average Prediction Likelihood 0.00% 3.76% 43.90% 31.22% 21.04%
The results of the experiments with one distinct goal and user movement
towards that goal (goal 1 in Figure 5.1, third environment) are presented in Table 5.10
and are much simpler to describe than the results for any of the other goal selection
experiments since they represent the ideal case where goals are distinct and the user
follows the best path. Goal 1 averaged 100% predicted likelihood regardless of initial
weight, and was selected by the system for each run as the inferred goal. Goals 2
through 5 always received 0% predicted likelihood.
Table 5.10 Results for Movement Towards the Goal with One Distinct Goal
Goal 1 Goal 2 Goal 3 Goal 4 Goal 5
Run 1 100% 0% 0% 0% 0%
Run 2 100% 0% 0% 0% 0%
Run 3 100% 0% 0% 0% 0%
Run 4 100% 0% 0% 0% 0%
Run 5 100% 0% 0% 0% 0%
Average Prediction Likelihood 100.00% 0.00% 0.00% 0.00% 0.00%
Neutral movement, as in the first series of goal selection experiments, was split
between eastward movement and westward movement. Eastward movement favored
goal 2, as it was selected for each run as the intended goal, receiving predicted
likelihood percentages of 91.19%, 50.21% and 50.21%. Goal 3 was commonly the

48
second most likely goal, receiving 4.50%, 49.79% and 49.79% respectively. Goals 1, 4
and 5 were not predicted to be the likely goal, often receiving 0% as a predicted
likelihood.
Table 5.11 Results for Neutral Movement Eastward with One Distinct Goal
Goal 1 Goal 2 Goal 3 Goal 4 Goal 5
Run 1 0% 91.10% 4.50% 3% 1.27%
Run 2 0% 50.21% 49.79% 0% 0%
Run 3 0% 50.21% 49.79% 0% 0%
When the neutral movement was westward, the system favored goal 5 as its
prediction for most likely to be the user’s intended goal as it was selected in both runs
and received likelihood percentages of 75.37% and 100%. Goal 4 received 26.67%
once, but 0% in the second run, and goals 1 through 3 received 0% in both neutral
movement experiments.
Table 5.12 Results for Neutral Movement Westward with One Distinct Goal
Neutral (W)/Not Similar Goal 1 Goal 2 Goal 3 Goal 4 Goal 5
Run 1 0% 0% 0% 26.67% 75.37%
Run 2 0% 0% 0% 0% 100%
The constant result for the experiment on movement away from one distinct goal
(Table 5.13) was that goal 1, the goal being moved away from, was constantly predicted
by the goal selection system as having zero possibility of being the user’s intended goal,
and that for every run goals 2 through 4 had some predicted potential for being the
projected user goal. Goal 2 was selected by the system in three of the five runs, and
goal 4 was selected in the other two runs, yet goal 4 resulted in the highest average
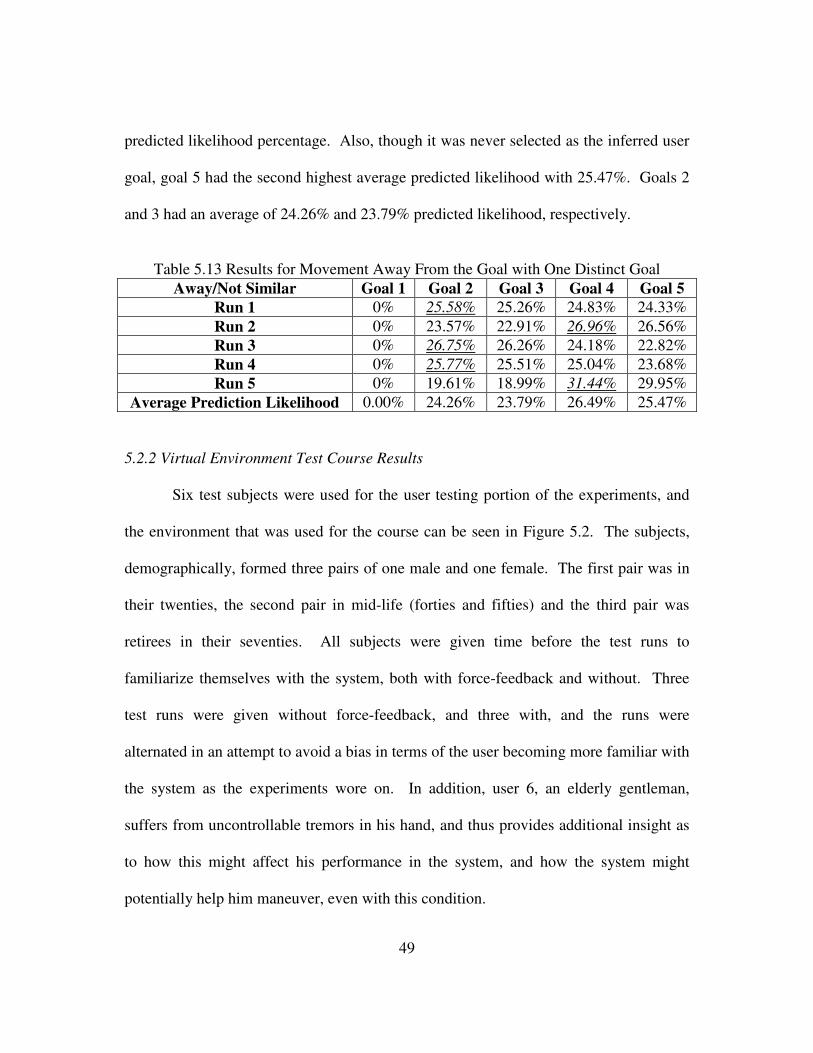
49
predicted likelihood percentage. Also, though it was never selected as the inferred user
goal, goal 5 had the second highest average predicted likelihood with 25.47%. Goals 2
and 3 had an average of 24.26% and 23.79% predicted likelihood, respectively.
Table 5.13 Results for Movement Away From the Goal with One Distinct Goal
Away/Not Similar Goal 1 Goal 2 Goal 3 Goal 4 Goal 5
Run 1 0% 25.58% 25.26% 24.83% 24.33%
Run 2 0% 23.57% 22.91% 26.96% 26.56%
Run 3 0% 26.75% 26.26% 24.18% 22.82%
Run 4 0% 25.77% 25.51% 25.04% 23.68%
Run 5 0% 19.61% 18.99% 31.44% 29.95%
Average Prediction Likelihood 0.00% 24.26% 23.79% 26.49% 25.47%
5.2.2 Virtual Environment Test Course Results
Six test subjects were used for the user testing portion of the experiments, and
the environment that was used for the course can be seen in Figure 5.2. The subjects,
demographically, formed three pairs of one male and one female. The first pair was in
their twenties, the second pair in mid-life (forties and fifties) and the third pair was
retirees in their seventies. All subjects were given time before the test runs to
familiarize themselves with the system, both with force-feedback and without. Three
test runs were given without force-feedback, and three with, and the runs were
alternated in an attempt to avoid a bias in terms of the user becoming more familiar with
the system as the experiments wore on. In addition, user 6, an elderly gentleman,
suffers from uncontrollable tremors in his hand, and thus provides additional insight as
to how this might affect his performance in the system, and how the system might
potentially help him maneuver, even with this condition.

50
Figure 5.3 Average Time Taken to Complete Course (seconds)
As seen in Figure 5.3, all subjects showed improvements in the length of time it
took them to complete the test course, with an average improvement of 14.5%. The
largest improvement from tests without force-feedback to tests with force-feedback
came from user 6, the elderly gentleman with hand tremors, whose average time
improvement was 40.14%.
All users also showed improvement in the number of collisions incurred while
completing the course (Figure 5.4). Subjects 5 and 6 incurred the most number of
collisions in both sets of tests (with force-feedback and without), and both incurred
fewer collisions in all test runs with force feedback.

51
Figure 5.4 Average Number of Collisions
5.2.3 Post Test Survey Results
In response to the first question, “Were the force-feedback suggestions helpful
in avoiding obstacles?” all users responded with a “Yes.” User 6 also wrote that he did
not “get” the concept of what the suggestions were attempting to do at first, but once he
did, he found it quite helpful. Responses were similar for the second question, “Were
the force-feedback suggestions helpful in approaching the goal?” Five out of the six
users answered unequivocally “Yes”, but user 5 answered “Somewhat.” In explanation
to the answer, she indicated that the factor keeping her answer from being a full “Yes”
was reliant on the amount of force behind the force-feedback effects, and that she felt
they were too strong for her. If they had been less forceful, she said, than they would
have been more helpful to her.
That was her answer to the third question, “Between too forceful and not
forceful enough, where would you rank the force-feedback effects?” It was to this

52
question that the users’ answers varied. As stated, user 5 found the effects to be too
forceful, and users 1 and 3 agreed. Users 2, 4, and 6, however, stated that the effects
were not forceful enough, and would have been potentially more helpful had they been
more forceful. Despite this, however, all users showed excitement for the potential of
the concept after testing the system.

53
CHAPTER 6
ANALYSIS
In this chapter, in an effort to better understand the experimental results given in
Chapter 5, an analysis of the results is provided. The results of the goal selection
experiments are analyzed first, followed by a combined analysis of the user test
experiments and the survey results.
6.1 Goal Selection Analysis
The most important results from the goal selection experiments are those in
which the simulated user moved towards the intended goal. In the experiments where
the goal was distinct and no other goal was similar to it, the system performed as it
should, predicting a likelihood of 100% in every run for that goal, regardless of weight.
When the goal had a second, somewhat similar goal, the system was still accurate,
picking the proper goal in every run with an average predicted likelihood of about 80%.
Both of these results are positive, and what would be expected from a goal selection
system.
The only potential issue came with the experiments on a cluster of similar goals.
In the first run, the intended goal was predicted properly because it had the highest
initial weight, but when this initial weight was decreased and another goal outranked it,
that second goal was selected by the system as the inferred user goal.

54
Upon review, however, this is the best that can be expected of this system, or
any system. The goal in question had two other goals not only in similar proximity to
it, but also with similar methods of approach. The only way to truly differentiate
between these goals is to either wait for more user actions to obtain more data
identifying the user’s intended goal, or to rely more heavily on the external system of
user preferences to give the goal selection system a proper differentiation between the
similar goals. Since this design operates on the assumption that such a system of user
preferences will be part of the application when applied to a real-world scenario, this is
an acceptable outcome for the experiments.
Experiments on neutral movements also had acceptable results, with the system
selecting the goals that were most likely to be the user’s goal based on the user’s
actions. The effect of neutral movements on the goal in question, however, is
noteworthy. Neutral movement was equivalent to movement away from the goal in
terms of the predicted likelihood of the intended target. Though ultimately the system
made acceptable predictions, it is possible that neutral movement should not lower the
system’s confidence in a goal as much as it currently does.
In all cases where the user moved away from the goal, it and any similar goals
were effectively eliminated, having been given a predicted likelihood of 0%. The only
exception was the fifth run of the semi-similar goals, but even in this case, when the
similar goal received a prediction likelihood of 18.79%, it was still outweighed by a
more likely goal, goal 3, which received a predicted likelihood of 58.66% and was
selected as the user’s predicted goal. This represents the expected result in that moving

55
away from the path towards a goal can only be interpreted as indicating that the goal in
question is not the user’s intended destination.
6.2 User Testing/Survey Analysis
The results of the User Testing and Survey are very positive, especially the
opinions of the oldest set of users. In regards to the quantitative experiments, the results
are encouraging, but expected. Previous research in the field of force-feedback as
applied to assistive technologies yielded positive results in the area of time to complete
a given maneuvering task, and in number of collisions [9, 11, 42]. It was expected
when this thesis project was started that similar results should follow from the
implemented design.
What are noteworthy are the responses to the survey questions, specifically the
responses from the elderly pair, users 5 and 6. Their acceptance of the technology and
positive, even excited response to their testing of it is encouraging and a testament to the
potential that force-feedback and artificial intelligence have in furthering the field of
assistive technologies. Their side comments were even helpful in generating ideas for
how to modify the system to make it more efficient in assisting the user; user 6 felt that
he did not understand the concept at first (but once he did, he found it very helpful), and
encouraged the idea of a “training system” to help the user get more of a feel for what
the system is trying to accomplish.
Finally, the third question regarding the force of the effects, whether the effects
were too forceful or not forceful enough indicated a divide between the two genders.
Users 2, 4 and 6, all males, indicated that the effects could have been more forceful for

56
their tastes, and might have been more helpful to them if they were, and yet users 1, 3,
and 5, all female, felt the forces to be too much, and indicated that the system would
better suit their needs if the forces were lessened.
This indicates that a system where the forces are tailored to the user would
potentially be more effective, and this tailoring can be as simple as adding a slider to the
graphical user interface that allows the user to change the forces themselves, or as
complex as developing a system that tests the user’s strength and adjusts the power of
the force-feedback effects appropriately. Independent of the choice of solution,
however, it is apparent at this stage that having the same level of force (dependant on
risk) for every user is reduces the benefit of the system, and that a solution to this
problem could further improve the system’s effectiveness.

57
CHAPTER 7
CONCLUSION
This thesis developed and implemented a novel concept for goal prediction and
force-feedback in a semi-autonomous wheelchair, and evaluated its effectiveness on a
simulated system. This chapter provides final thoughts and conclusions for this work,
along with a discussion of future directions.
7.1 Final Thoughts
The ultimate motivation behind this thesis was to develop technologies that
could help people who have disabilities that require them to use a wheelchair. The idea
was, as inspired by the quote from Paul Nisbet, to create a system that assisted the user,
rather than replace the user. We believed that force-feedback would be the most
appropriate and efficient method of assisting the user in maneuvering in the
environment because of its intuitive nature and its potential to avoid the distractive
effects of other means of feedback, such as GUIs, auditory interfaces, etc. In addition,
this belief is supported by previous research, both in and outside the field of assistive
technology that indicated, unequivocally, that force-feedback is simple, intuitive, and
efficient in assisting users with steering tasks.
Previous research in the field of assistive technology had already explored the
idea of force-feedback in an intelligent wheelchair, but these attempts had solely been to
help the user avoid obstacles. This work takes a broader approach noting that obstacle

58
avoidance is not the only task that wheelchair users engage in, and that inferring and
approaching environmental goals was potentially more important and could, when
coupled with an autonomous path planning component, address both obstacle avoidance
and navigational guidance in a more efficient and safe manner. Due to its previous use
in robotic path planning and its relation to collision probabilities in the context of
uncertain movement commands, harmonic functions were seen as an ideal way of
encompassing both ideas.
Following these considerations, a design was developed and implemented that
addresses all of the objectives: the ability to infer a user’s goal based on what the
system can know about the user’s intentions, the ability to guide the user towards that
goal using a combination of force-feedback effects and harmonic function path
planning, and the ability to assist the user in avoiding collisions with obstacles. The
framework was implemented in Microsoft’s robotic simulation environment (Microsoft
Robotic Studio) and the experiments performed with the system indicate a positive
response from all users, whose ages and abilities ranged from young and healthy to
elderly and with some hand coordination issues.
7.2 Future Work
To address comments from all of the elderly users, modifications are necessary
for the adjustment of the joystick forces. The thought has been raised that this
modification could incorporate artificial intelligence concepts to create a self-adjusting
force metric, but there is the possibility that allowing the user to tailor the forces to his

59
or her needs may be sufficient. Also, a more thorough training system to help users
familiarize themselves with the system may be another line of future work to explore.
Beyond that, a set of challenges will appear when moving this system beyond a
simulation and onto a real motorized wheelchair, including how to gather environmental
data and user position/orientation data in the real world. This relates to the need for
tying the proposed approach into the sensor system of the wheelchair and into a
practical user preference system. To address the former, a number of simultaneous
localization and mapping (SLAM) techniques have been developed over the last decade
which allow robot systems to determine their location while simultaneously establishing
a map of their surroundings using data gathered from either sonar, laser, and/or vision
sensors. These approaches could form a basis for the perceptual capabilities needed for
a physical wheelchair in real world environments. For the latter, machine learning
techniques could be used to analyze previous goal choices of the user to extract means
of classifying and subsequently predicting target locations from the perceptual
information of the wheelchair.

60
(This page must have a 2 inch top margin.)
REFERENCES
[1] Nisbet, P. D. (2002). Who’s intelligent? Wheelchair, driver or both? Control
Applications, 2002. Proceedings of the 2002 International Conference on, 2. 760-765.
[2] Levine, S. P., Bell, D. A., Jaros, L. A., Simpson, R. C., Koren, Y.,
Borenstein, J. (1999). The NavChair Assistive Wheelchair Navigation System.
Rehabilitation Engineering, IEEE Transactions on, 7(4). 443-451.
[3] Lu, T., Yuan, K., Zou, W., Hu, H. (2006). Study on Navigation Strategy of
Intelligent Wheelchair in Narrow Spaces. Intelligent Control and Automation, 206.
WCICA 2006. The Sixth World Congress on, 2. 9252-9256.
[4] Luo, R. C., Chen, T. M., Lin, M. H. (1999). Automatic guided intelligent
wheelchair system using hierarchical grey-fuzzy motion decision-making algorithms.
Intelligent Robots and Systems, 1999. IROS’99. Proceedings, 1999 IEEE/RSJ
International Conference on, 2. 900-905.
[5] Matsumotot, Y., Ino, T., Ogsawara, T. (2001). Development of intelligent
wheelchair system with face and gaze based interface. Robot and Human Interactive
Communication, 2001. Proceedings. 10th
IEEE International Workshop on. 262-267.
[6] Pillarisetti, A., Pekarev, M., Brooks, A. D., Desai, J. P. (2006). Evaluating
the Role of Force Feedback for Biomanipulation Tasks. Proceedings of the IEEE
Conference on Virtual Reality. Washington, DC.

61
[7] Wagner, C. R., Perrin, D. P., Howe, R. D., Vasilyev, N., Del Nido, P. J.
(2006). Force Feedback in a Three-Dimensional Ultrasound-Guided Surgical Task.
Proceedings of the IEEE Conference on Virtual Reality. Washington, DC.
[8] Feintuch, U., Rand, D., Kizony, R., Weiss, P. L. (2004). Promoting Research
and Clinical Use of Haptic Feedback in Virtual Environments. Proceedings of Fifth
International Conference on Disability, Virtual Reality and Associated Technologies
(ICDVRAT’04). 141-147.
[9] Fattouh, A., Sahnoun, M., Bourhis, G. (2004). Force feedback joystick
control of a powered wheelchair: preliminary study. Systems, Man and Cybernetics,
2004 IEEE International Conference on, 3. 2640-2645.
[10] Luo, R. C., Hu, C. Y., Chen, T. M., Lin, M. H. (1999). Force reflective
feedback control for intelligent wheelchairs. Intelligent Robots and Systems, 1999.
IROS’99 Proceedings. 1999 IEEE/RSJ International Conference on, 2. 918-923.
[11] Protho, J. L., LoPresti, E. F., Brienza, D. M. (2000). An Evaluation of An
Obstacle Avoidance Force Feedback Joystick. Research Slide Lecture for Wheelchair
University. University of Pittsburgh, PA.
[12] Dennerlein, J. T., Martin, D. B., Hasser, C. (2000). Force-feedback
improves performance for steering and combined steering-targeting tasks. Proceedings
of the SIGCHI Conference on Human Factors in Computing Systems. 423-429.
[13] Kamenetz, H. L. (1969). A Brief History of the Wheelchair. Journal of the
History of Medicine and Allied Sciences, 24(2). 205-210.

62
[14] Clark, L. L. (1997). Design and Testing of a Quick-Connect Wheelchair
Power Add-On Unit. Dissertation. Virginia Polytechnic Institute.
[15] Gomi, T., Ide, K. (1996). The development of an intelligent wheelchair.
Conference on Intelligent Vehicles. 70-75
[16] Nisbet, P. D., Craig, J., Odor, J. P, Aitken, S. (1995). “Smart” wheelchairs
for mobility training. Technology and Disability, 5. 49-62.
[17] Simpson, R. C. (2005). Smart wheelchairs: A literature review. Journal of
Rehabilitation Research & Development, 42(4). 423-436.
[18] Yoder, J. D., Baumgartner, E. T., Skaar, S. B. (1996). Initial results in the
development of a guidance system for a powered wheelchair. IEEE Transactions on
Rehabilitation Engineering, 4(3). 143-151
[19] Gribble, W. S., Browning, R. L., Hewett, M., Remolina, E., Kuipers, B. J.
(1998). Integrating vision and spatial reasoning for assistive navigation. Assistive
Technology and artificial intelligence. 179-193.
[20] Murakami, Y., Kuno, Y., Shimada, N., Shirai, Y. (2001). Collision
avoidance by observing pedestrians’ faces for intelligent wheelchairs. IEEE/RSJ
International Conference on Intelligent Robots and Systems. 2018-2013.
[21] Schilling, K., Roth, H., Lieb, R., Stutzle, H. (2001). Sensors to improve the
safety for wheelchair users. 3rd
Annual TIDE Congress. Helsinki, Finland.
[22] Prassler, E., Scholz, J., Fiorini, P. (2001). A robotic wheelchair for crowded
public environments. IEEE Robotics & Automation Magazine, 8(1). 38-45.

63
[23] Borgolte, U., Hoyer, H., Buehler, C., Heck, H., Hoelper, R. (1998).
Architectural concepts of a semi-autonomous wheelchair. Journal of Intelligent and
Robotic Systems, 22(3-4). 233-253.
[24] Pires, G., Nunes, U. (2002). A wheelchair steered through voice commands
and assisted by a reactive fuzzy-logic controller. Journal of Intelligent and Robotic
Systems, 34(3). 301-314.
[25] Roefer, T., Lankenau, A. (2000). Architecture and applications of the
Bremen autonomous wheelchair. Information Sciences – Informatics and Computer
Science: An International Journal, 126(1). 1-20.
[26] Kateyas, N. L, Sgouros, N. M., Tzafestas, S. G., Papakonstantinou, G.,
Beattie, P., Bishop, J. M., Tsanakas, P., Koutsouris, D. (1997). The autonomous mobile
robot SENARIO: A sensor-aided intelligent navigation system for powered
wheelchairs. IEEE Robotics & Automation Magazine, 4(4). 60-70.
[27] Balcells, A. C., del Rio, F. D., Jimenez, G., Sevillano, J. L., Amaya, C.,
Vicente, S. (2002). SIRIUS: Improving the maneuverability of powered wheelchairs.
International Conference on Control Applications. 790-795.
[28] Seki, H., Kobayashi, S., Kamiya, Y., Hikizu, M., Nomura, H. (2000).
Autonomous/semi-autonomous navigation system of a wheelchair by active ultrasonic
beacons. International Conference on Robotics and Automation. 1366-1371.
[29] Balcells, A. C., Gonzalez, J. A. (1998). TetraNauta: A wheelchair controller
for users with very severe mobility restrictions. 3rd
Annual TIDE Congress. Helsinki,
Finland.

64
[30] Bourhis, G., Horn, O., Habert, O., Pruski, A. (2001). An autonomous
vehicle for people with motor disabilities. IEEE Robotics & Automation Magazine,
8(1). 20-28.
[31] Yanco, H. A. (1998). Wheelesley: a robotic wheelchair system: Indoor
navigation and user interface. Assistive technology and artificial intelligence. 256-268.
[32] Simpson, R., LoPresti, E., Hayashi, S., Nourbakhsh, I., Miller, D. (2004).
The Smart Wheelchair Component System. Journal of Rehabilitation Research &
Development, 41(3B). 429-442.
[33] Connell, J., Viola, P. (1990). Cooperative control of a semi-autonomous
mobile robot. Robotics and Automation: Proceedings of the IEEE International
Conference on Robotics and Automation (ICRA). 1118-1121.
[34] Simpson, R. C., LoPresti, E. F., Hayashi, S., Guo, S., Ding, D., Cooper, R.
A. (2003). SmartPower Assistance Module for manual wheelchairs. Technology and
Disability: Research, Design, Practice and Policy: 26th
International Annual Conference
on Assistive Technology for People with Disabilities. Arlanta, GA.
[35] Simpson, R. C., Poirot, D., Baxter, M. F. (2002). The Hephaestus smart
wheelchair system. Neural Systems and Rehabilitation Engineering, IEEE Transactions
on, 10(2). 118-122.
[36] Miller, D. P., Slack, M. G. (1995). Design and testing of a low-cost robotic
wheelchair prototype. Autonomous Robots, 2(1). 77-88.
[37] Mazo, M. (2001). An integral system for assisted mobility. IEEE Robotics
& Automation Magazine, 8(1). 46-56.

65
[38] Kuno, Y., Shimada, N., Shirai, Y. (2003). Look where you’re going
[robotic wheelchair]. IEEE Robotics & Automation Magazine, 10(1). 26-34.
[39] Simonite, T. (2007). Thinking of words can guide your wheelchair. New
Scientist Tech. 12:02 06 September 2007.
[40] Deng, J. L. (1989). Introduction to Grey system theory. The Journal of Grey
System, 1(1). 1-24.
[41] Ren, C., Luo, T. M., Chen, C. Y., Hu, Z., Hsaio, H. (1999). Adaptive
Intelligent Assistant Control of Electrical Wheelchair by Grey-Fuzzy Decision Making
Algorithm. Proceedings of 1999 IEEE International Conference on Robotics and
Automation, 3. 2014-2019.
[42] Protho, J. L., LoPresti, E. F., Brienza, D. M. An Evaluation of an Obstacle
Avoidance Force Feedback Joystick. Rehabilitation Engineering & Assistive
Technology Society of North America. Pittsburgh, PA.
[43] Bourhis, G., Sahnoun, M. (2007). Assisted Control Mode for a Smart
Wheelchair. Proceedings of the 2007 IEEE 10th
International Conference on
Rehabilitation Robotics. Noordwijk, The Netherlands.
[44] Quinlon, M. (2004) Questions & Answers: Joystick. World Wide Words.
July 17th
2005.
[45] Walters, C. (1997). Cop a Feel….with Haptic Peripherals. Game
Developer. November 1997.
[46] Weisstein, E. W. (2008). Harmonic Function. MathWorld – A Wolfram
Web Resource.

66
[47] Mathews, J. H., Howell, R. W. (2006). Module for Harmonic Functions.
Website. California State University Fullerton.
[48] Rosell, J., Iniguez, P. (2005). Path planning using Harmonic Functions and
Probabilistic Cell Decomposition. Proceedings of the 2005 IEEE International
Conference on Robotics and Automation. Barcelona, Spain.
[49] Kazemi, M., Mehrandezh, M., Gupta, K. (2005). Sensor-based Robot Path
Planning Using Harmonic Function-based Probabilistic Roadmaps. Advanced Robotics,
2005, ICAR ’05, Proceedings., 12th
International Conference on. 84-89.
[50] Connolly, C. I., Grupen, R. A. (1994). Nonholonomic Path Planning Using
Harmonic Functions. 1995 IEEE International Conference on Robotics & Automation.
[51] Rosell, J., Iniguez, P. (2002). Efficient Path Planning Using Harmonic
Functions Computed on a Non-regular Grid. Lecture Notres in Computer Science, 2504.
345-354.
[52] Connolly, C. I. (1994). Harmonic Functions and Collision Probabilities.
IEEE Conerence on Robotics and Automation. 3015-3019.
[53] Hadjidimos, A. (2000). Successive over-relaxation (SOR) and related
methods. Journal of Computational and Applied Mathematics, 123(1-2). 177-199.
[54] Microsoft Corporation. (2008). Simulation Overview. Microsoft Robotics
Studio. MSDN Online Library.
[55] Microsoft Corporation. (2008). VPL Introduction. Microsoft Robotics
Studio. MSDN Online Library.

67
[56] Miller, T. (2003). Using Force Feedback. Managed DirectX 9 Kick Start:
Graphics and Game Programming.
[57] Microsoft Corporation. (2008). DirectX. DirectX Developer Center. MSDN
Online Library.

68
BIOGRAPHICAL INFORMATION
John Staton received his Bachelor of Science in Computer Science from
Augsburg College in Minneapolis, Minnesota in 2005, and his Master of Science in
Computer Science from The University of Texas at Arlington in Arlington, Texas in
2008. He has committed to attend the Doctoral program in Computer Science at The
University of Texas at Arlington starting Fall 2008 and continuing to work with Dr.
Manfred Huber in the field of Robotics and Artificial Intelligence.
Recommended