November 1, 2010
Teachers College Columbia University
Alumni Survey 2008: Professional Preparation Programs
AUTHORED BY: OFFICE OF ACCREDITATION AND ASSESSMENT

Teachers College Alumni Survey 2008 Report
Page 1 of 25
TABLE OF CONTENTS
TABLE OF CONTENTS.........................................................................................................................1 INTRODUCTION ....................................................................................................................................2
Instrument ...........................................................................................................................................2 Target Population and Administration.................................................................................................2 Response Rate ...................................................................................................................................3 Respondent Characteristics................................................................................................................4
EMPLOYMENT ......................................................................................................................................6 PK-12 SCHOOL EMPLOYMENT...........................................................................................................8
Teacher Education Programs .............................................................................................................8 Education Leadership Program ........................................................................................................10 Psychological Counseling Program ..................................................................................................12 School Psychology Program.............................................................................................................14 Speech and Language Pathology Program......................................................................................16
LEARNING GOALS .............................................................................................................................18 Research, Scholarship, Inquiry .........................................................................................................19 Professionalism, Lifelong Learning, Professional Development.......................................................19 Communication, Collaboration, Leadership......................................................................................20 Diversity, Multiculturalism, Advocacy, Social Justice........................................................................20 Professional Practice ........................................................................................................................21
Teacher Preparation Programs.....................................................................................................21 Education Leadership Program.....................................................................................................21 Psychological Counseling Program ..............................................................................................22 School Psychology Program .........................................................................................................22 Speech and Language Pathology Program ..................................................................................23
OVERALL SATISFACTION.................................................................................................................24 APPENDIX ...........................................................................................................................................25

Teachers College Alumni Survey 2008 Report
Page 2 of 25
INTRODUCTION
First administered in the fall of 2008, the Alumni Survey was designed to gather preliminary job-related information about Teachers College graduates, graduates’ perception of how prepared they felt in meeting the demands of their jobs and how applicable their training had been to their work.
Instrument
The alumni questionnaire was developed by the Office of Accreditation and Assessment in collaboration with representative program faculty. The majority of the questions in the questionnaire are common across all programs. Programs were also invited to add program-specific questions to the questionnaire. The number of questions was limited by the space available on both sides of a standard sheet of paper to keep the survey brief and to increase the likeliness of the response.
The questionnaire included three parts. Part I was composed of questions about alumni’s employment, level of preparedness for current jobs, general satisfaction with TC education, and post-graduate professional activities, such as publishing, presenting at professional forums, or participating in professional organizations. These questions were followed by a set of seven questions targeted only at those who worked in preK-12 schools during 2008-2009.
Part II was composed of 26 areas of competence corresponding to the College’s five broadly-defined learning goals:
• Inquiry, Scholarship, Research (5 items) • Professionalism, Lifelong Learning, Professional Development (5 items) • Communication, Collaboration, Leadership (3 items) • Diversity, Advocacy, Social Justice (6 items) • Professional Practice (7 items)
Respondents were asked to rate the 26 areas indicating (a) how important each area was to their current jobs, (b) how competent they felt in the area, and (c) how much of their competence they would attribute to their program of study at TC. A four-point response scale from 1 (barely important, barely competent, very little) to 4 (very important, very competent, very much) was used for each area; and a ‘not applicable’ option was also offered. The first 19 competencies were common across all programs. The last seven competencies were program-specific.
Part III asked alumni to identify other areas of competence that were important to their jobs, but might not have been captured by the questionnaire. Please see Appendix for a copy of the base (common items) questionnaire.
Target Population and Administration
The target population comprised of school professional preparation programs alumni who were admitted in or after January 2004 and graduated by May 2007. The Teaching of English program was an exception in that its eligible alumni base was expanded to include those who graduated by May 2008; this was done to coordinate with the program-run focus group research project. A total of 1838 alumni from 24 programs preparing teachers, principals, psychologists, and counselors were surveyed. The survey was administered in phases, beginning with the Teaching of English program in October 2008, and closing for all of the 24 participating programs in December 2009.
Every program had a cover letter printed on the program’s letterhead and signed by the program coordinator and/or other program faculty members. A program-customized questionnaire, accompanied by a cover letter and a stamped, self-addressed envelope to the Office of Accreditation and Assessment were then mailed out.

Teachers College Alumni Survey 2008 Report
Page 3 of 25
Initially, surveys were sent, by post, only to the alumni with U.S. mailing addresses (n=1764). Non-respondents were followed-up in three subsequent postal mailings. The fourth and last follow-up was also conducted through e-mail to include the alumni with foreign addresses, thus bringing the total number surveyed to 1838.
Response Rate
The Office of Accreditation and Assessment received 735 completed surveys from alumni with U.S. mailing addresses, and 14 from those with overseas mailing addresses, giving an overall response rate of 41% for the Teachers College Alumni Survey 2008. The response rates by program are shown in the table below.
All alumni Alumni with US mailing addresses Undeliverable
Program n Number of responses
Response rate
n
Number of responses
Response rate
Applied Behavior Analysis 22 9 41% 21 9 43% 2
Art and Art Education 46 23 50% 46 23 50% 3
Bilingual/ Bicultural Education 42 17 40% 38 16 42% 2
Blindness and Visual Impairment 2 1 50% 2 1 50% 0
Curriculum and Teaching 61 24 39% 48 22 46% 1
Deaf and Hard of Hearing 23 9 39% 23 9 39% 0
Early Childhood/Special Ed 52 23 44% 46 21 46% 3
Education Leadership 293 137 47% 291 136 47% 3
Elementary Inclusive Education 120 40 33% 118 40 34% 10
Gifted Education 27 11 41% 22 10 45% 3
Intellectual Disabilities/Autism 24 9 38% 24 9 38% 3
Literacy Specialist 45 24 53% 43 24 56% 3
Mathematics Education 101 38 38% 101 38 38% 3
Music and Music Education 87 41 47% 78 40 51% 8
Physical Education 13 4 31% 11 4 36% 1
Reading Specialist 55 18 33% 55 18 33% 2
Science Education 52 22 42% 51 22 43% 2
School Counseling 149 69 46% 143 67 47% 13
School Psychology 22 12 55% 22 12 55% 0
Speech and Language Pathology 60 28 47% 59 28 47% 2
Teaching of ASL 9 6 67% 9 6 67% 1
Teaching of English 304 110 36% 299 108 36% 21
TESOL 77 25 32% 65 23 35% 5
Teaching of Social Studies 152 49 32% 149 49 33% 10
Total 1838 749 41% 1764 735 42% 101

Teachers College Alumni Survey 2008 Report
Page 4 of 25
Respondent Characteristics
About half of the respondents graduated in 2006-2007, another quarter in 2005-06, and about 20% in 2007-2008. The distribution of respondents by graduation year closely mirrors the distribution of the total population surveyed as the graph below shows.
Percentage of Total Surveyed and Respondents by Graduation Year
26% 24%
50% 51%
20%18%
Total Surveyed Respondents
2008-09
2007-08
2006-07
2005-06
2004-05
The majority of respondents were White (65%), female (82%), and between 30 and 40 years of age
(80%). There was a slightly higher proportion of White (65% vs. 57%) and female (82% vs. 77%) among respondents than the total population surveyed. Less than 20% of respondents were Asian, Black or Hispanic compared to 23% in the total population surveyed. Ethnic composition and age groups of the total surveyed and respondents are shown in the graphs below.

Teachers College Alumni Survey 2008 Report
Page 5 of 25
Percentage of Total Surveyed and Respondents by Ethnicity
57%
12%
6% 5% 6%3%
11%
65%
11%5% 3% 3% 3%
10%
White Asian Black Hispanic International Other Missing
Total Surveyed Respondents
Percentage of Total Surveyed and Respondents by Age Group
4%2%
55%
24%
8%4%
1% 2%5%
2%
58%
22%
6%4%
1% 1%
< 25 26-30 31-35 36-40 41-45 46-50 >50 Missing
Total Surveyed Respondents

Teachers College Alumni Survey 2008 Report
Page 6 of 25
EMPLOYMENT
The majority of alumni who responded to employment-related questions were employed—either full time (89%) or part-time (5%); and about 2% were seeking employment. Over 90% of respondents reported that their current jobs were related to their programs of study at Teachers College. Most respondents (88%) held at least one current and valid teaching, administrative, or professional license or certificate. Of those employed, 80% worked in preK-12 settings. The distribution of respondents by employer type is shown in the graph below.
Employer Type
health agency 2%
self-employed 2%
non-profit 4%
university7%
parochial1%
other5%
preK-12 schools
80%private22%
public57%
Most respondents were employed in the tri-state area: 55% in New York, 7% in New Jersey, and 4%
in Connecticut. California and Massachusetts were the states of employment for 9% and 4% of respondents respectively. Overall, our respondents worked in 39 states and 18 foreign countries.
Of those who were employed in New York State (n=368), the majority (75%) worked in New York City’s five boroughs. Another 18% worked in Westchester, Nassau and Suffolk counties. The graph below shows respondents employment by county.

Teachers College Alumni Survey 2008 Report
Page 7 of 25
Employment in New York State by County
161
50
41
29
27
20
10
9
5
4
4
2
6
New York
Brooklyn
Bronx
Westchester
Nassau
Queens
Suffolk
Albany
Dutchess
Erie
Rockland
Staten Island
Other
Other big cities that employed more than three of our respondents included Atlanta (4), Boston (4),
Chicago (8), Houston (5), Los Angeles (4), Oakland (4), San Francisco (4), Seattle (5), and Washington, DC (10).
Since graduation from their programs, 62% of alumni reported having been a member of a professional association/society; 19% of alumni have presented at a professional conference; 8% have published an article, a book chapter, or a book; and 8% have held a leadership position in a professional association/society.

Teachers College Alumni Survey 2008 Report
Page 8 of 25
PK-12 SCHOOL EMPLOYMENT
Teacher Education Programs
Eighty-five percent of respondents (n=429) who graduated from teacher preparation programs taught in preK-12 schools within the academic year of 2007-08 or 2008-09. Collectively, they taught grade levels from pre-kindergarten through 12 as shown in the graph below.
Number of Respondents by Grade Level Taught
22
130
113
89
138
116
pre-K
Grades K - 3
Grades 4 - 6
Grades 7 - 8
Grades 9 - 10
Grades 11 - 12
Based on their own estimates, about half (49%) of the respondents taught in classrooms with over
60% ethnic, racial, or cultural minority student population. Over a third of respondents (39%) taught students 60% or more of whom were from low socio economic background. Between 15 and 20 percent of respondents taught students 40% or more of whom were English Language Learners or had special needs.
Given the diversity of their students, three quarters of respondents reported feeling well prepared to address the needs of their students (33%-very well and 42%-well). Another quarter did not feel adequately prepared to deal with diverse student needs in their classrooms. There is a statistically significant correlation between the estimated ethnic, racial or cultural diversity and economic status of students and respondents’ satisfaction with the preparation they received from their programs. Respondents who taught less diverse and more affluent students tended to evaluate their preparation more positively than those who did not (Spearman’s Rho coefficients of -0.160 for ethnic minority and satisfaction correlation, and -0.180 for low SES and satisfaction correlation).

Teachers College Alumni Survey 2008 Report
Page 9 of 25
Percent of Respondents by Proportion of Diverse Students
26%
57%15%
13%10%
9%
7%7%
11%
9%
5%38%
30%
9% 6%
39%
65%
28%15%
Students of Ethnic orCultural Minority
Background
Students of Low Socio-Economic Background
English Language Learners Students w ith SpecialNeeds
Perc
ent o
f Res
pond
ents
1/5 or few er 1/5 to 2/5 2/5 to 3/5 3/5 to 4/5 4/5 or more
How well did the program prepare you to teach your students?
poorly6%
very w ell33%
w ell 42%
not so w ell20%

Teachers College Alumni Survey 2008 Report
Page 10 of 25
Education Leadership Program
Eighty percent of respondents (n=109) who graduated from the education leadership program reported working in preK-12 schools. Some respondents worked in more than one school type. They served students in elementary, middle and high schools as shown in the graph below.
Number of Respondents by Type of Schools
28
31
73
52
12
Elementary School
Middle School
Junior High School
High School
Other
Based on their own estimates, about two-thirds (64%) of the respondents worked in schools with over
60% of students of ethnic, racial, or cultural minority background. Over half of the respondents (57%) worked in schools with students 60% or more of whom were from low socio economic background. About a quarter of respondents (27%) worked in schools with more than 40% of students who were English Language Learners.

Teachers College Alumni Survey 2008 Report
Page 11 of 25
Percent of Respondents by Proportion of Diverse Students
11%
68%
18%
7%7%
8%
7%
15%
57%
36%
4%
36%
58%
32%
15%
21%
Students of Ethnic orCultural Minority
Background
Students of Low Socio-Economic Background
English LanguageLearners
Students w ith SpecialNeeds
Perc
ent o
f Res
pond
ents
1/5 or few er 1/5 to 2/5 2/5 to 3/5 3/5 to 4/5 4/5 or more
Given the diversity of their students, three-quarters of the respondents (76%) reported feeling well
prepared to address the needs of their students (24%-very well and 52%-well). About a quarter of respondents did not feel adequately prepared to address the needs of the diverse students in their schools. Respondents who worked in schools with less diverse and more affluent students tended to evaluate their preparation more positively than those who did not (Spearman’s Rho coefficients of -0.092 for ethnic minority and satisfaction correlation, and -0.106 for low SES and satisfaction correlation).
How well did all the Education Leadership programprepare you to promote success of all students?
poorly17%
not so w ell7%
w ell 52%
very w ell24%

Teachers College Alumni Survey 2008 Report
Page 12 of 25
Psychological Counseling Program
Twenty-nine percent of respondents (n=20) who graduated from the psychological counseling program worked in preK-12 schools. Some respondents worked in more than one school type. They served students in elementary, middle, and high schools as shown in the graph below.
Number of Respondents by School Type
14
5
7
High School
Middle School
Elementary School
About half (48%) of the respondents estimated having worked with students 60% or more of whom
were of ethnic, racial, or cultural minority background. Over a third (40%) of respondents worked with students 60% or more of whom were from low socio economic background. Less than a quarter of respondents (15% and 24% respectively) worked with students 40% or more of whom were English Language Learners or had special needs.
Based on the diversity of their students, ninety-five percent of the respondents reported feeling well prepared to address the needs of their students (68%-very well and 27%-well). Respondents who worked with less diverse and more affluent students tended to evaluate their preparation more positively than those who did not (Spearman’s Rho coefficients of -0.362 for ethnic minority and satisfaction correlation, and -0.263 for low SES and satisfaction correlation).

Teachers College Alumni Survey 2008 Report
Page 13 of 25
Percent of Respondents by Student Diversity
24% 30%
70%57%
19%
30%
15%
19%
10%
15%14%
10%5%
38% 35%
10%
Students of Ethnic orCultural Minority
Background
Students of Low Socio-Economic Background
English LanguageLearners
Students w ith SpecialNeeds
Per
cent
of R
espo
nden
ts
1/5 or few er 1/5 to 2/5 2/5 to 3/5 3/5 to 4/5 4/5 or more
How well did the Psychological Counseling program prepare you to work with diverse students?
very well68%
well 27%
not so well5%

Teachers College Alumni Survey 2008 Report
Page 14 of 25
School Psychology Program
All 12 respondents who graduated from the school psychology program worked in preK-12 schools. They served students in elementary, middle and high schools as shown in the graph below.
Number of Respondents by School Type
2
3
7
High School
Middle School
Elementary School
Based on their estimates, 40% of respondents worked with students 60% or more of whom were of
ethnic, racial, or cultural minority background. Only 20% of respondents worked with students 60% or more of whom were from low socio economic background. Only 10% of respondents worked with students 40% or more of whom were English Language Learners, and 22% worked with students 40% or more of whom had special needs.
Given the diversity of their students, half of the respondents reported feeling well prepared to address the needs of their students (30%-very well and 20%-well). Another half did not feel adequately prepared to address the needs of diverse students. Respondents who worked with less diverse and more affluent students tended to evaluate their preparation more positively than those who did not (Spearman’s Rho coefficients of -0.033 for ethnic minority and satisfaction correlation, and -0.065 for low SES and satisfaction correlation).

Teachers College Alumni Survey 2008 Report
Page 15 of 25
Percent of Respondents by Proportion of Diverse Students
40%
67%
10%20%
10%
20%
10%
11%40%
11%
80%
40%
10%
11%
20%
Students of Ethnic orCultural Minority
Background
Students of Low Socio-Economic Background
English LanguageLearners
Students w ith SpecialNeeds
Perc
ent o
f Res
pond
ents
1/5 or few er 1/5 to 2/5 2/5 to 3/5 3/5 to 4/5 4/5 or more
How well did the School Psychology program prepare you to work with your students ?
not so w ell30%
poorly20%
w ell 20%
very w ell30%

Teachers College Alumni Survey 2008 Report
Page 16 of 25
Speech and Language Pathology Program
Sixty-four percent of respondents (n=18) who graduated from the speech and language pathology program worked in preK-12 schools. Many respondents worked with students in multiple grade-level categories. They served students from birth to tenth grade as show in the graph below.
Number of Respondents by Student Grade Level
8
16
19
10
5
Birth-preK
Grades K - 3
Grades 4 - 6
Grades 7 - 8
Grades 9 - 10
Seventy-six percent of respondents estimated having worked with more than 60% of students who
were of ethnic, racial, or cultural minority background. Sixty-two percent of respondents worked with students 60% or more of whom were from low socio economic background. Half of the respondents worked with students 40% or more of whom were English Language Learners. Sixty-seven percent of respondents worked with students 40% or more of whom had special needs.
Ninety-six percent of respondents reported feeling well prepared to address the needs of their students as diverse as they were (55%-very well and 41%-well). Respondents who worked with less diverse and more affluent students tended to evaluate their preparation more positively than those who did not (Spearman’s Rho coefficients of -0.188 for ethnic minority and satisfaction correlation, and -0.177 for low SES and satisfaction correlation).

Teachers College Alumni Survey 2008 Report
Page 17 of 25
Percent of Respondents by Proportion of Diverse Students
19%14%
10%10%
14%
10%
10%19%
20%
24%
52%
20%33%
14% 20%
14%
30%10%
57%
Clients of Ethnic or CulturalMinority Background
Clients of Low Socio-Economic Background
English Language Learners Clients w ith Special Needs
Perc
ent o
f Res
pond
ents
1/5 or few er 1/5 to 2/5 2/5 to 3/5 3/5 to 4/5 4/5 or more
How well did the Speech and Language Pathology program prepare you to work with your students?
very w ell41%
not so w ell5%
w ell 55%

Teachers College Alumni Survey 2008 Report
Page 18 of 25
LEARNING GOALS
Respondents were asked to rate 26 areas of competence (i.e., learning outcomes) to indicate how important each area was to their current jobs, how competent they felt in the area, and how much their programs contributed to their competence in each area. Each area of competence was rated using a four-point scale from 1 (low) to 4 (high). The first 19 competencies are common across all. The last seven competencies are specific to individual programs. The following graphs show the results of the respondents’ ratings for the first 19 competencies which are common across all programs. The table below displays the mean ratings.
Knowledge, Skills, and Dispositions Importance to job
Self-perceived
competence
Program contribution
1. Understanding current theories or research in your field 3.2 3.2 3.3
2. Understanding methods of research or scholarly inquiry 2.7 3.0 3.1
3. Applying theoretical knowledge to practice 3.4 3.3 3.2
4. Thinking critically 3.8 3.7 3.3
5. Formulating creative ideas or solutions 3.8 3.5 3.1
6. Keeping abreast with what is happening in your profession 3.3 3.1 3.1
7. Acquiring new knowledge or skills on your own 3.6 3.4 2.9
8. Participating in professional development activities 3.4 3.4 2.9
9. Publishing or presenting at professional conferences 1.9 2.2 2.2
10. Adhering to professional and/or ethical standards 3.8 3.8 3.3
11. Communicating your ideas 3.8 3.6 3.2
12. Being an effective team member 3.8 3.7 3.2
13. Motivating other people in your job 3.4 3.4 2.7
14. Appreciating cultural diversity 3.6 3.7 3.4
15. Getting along with people of different backgrounds 3.7 3.8 3.3
16. Valuing perspectives different from your own. 3.7 3.7 3.3
17. Working with diverse people/populations 3.6 3.7 3.3
18. Recognizing social problems/inequalities 3.4 3.5 3.3
19. Advocating for students and/or their families 3.5 3.4 2.9

Teachers College Alumni Survey 2008 Report
Page 19 of 25
Research, Scholarship, Inquiry
Research, Scholarship, Inquiry
2.02.22.42.62.83.03.23.43.63.84.0
Understandingcurrent theories orresearch in your
field
Understandingmethods ofresearch or
scholarly inquiry
Applying theoreticalknow ledge to
practice
Thinking critically Formulatingcreative ideas or
solutions
importance to job self-perceived competence program contribution
Professionalism, Lifelong Learning, Professional Development
Professionalism, Lifelong Learning, Professional Development
1.61.82.02.22.42.62.83.03.23.43.63.84.0
Keeping abreastw ith w hat is
happening in your profession
Acquiring newknow ledge or skills
on your ow n
Participating inprofessionaldevelopment
activities
Publishing orpresenting atprofessionalconferences
Adhering toprofessional and/orethical standards
importance to job self-perceived competence program contribution

Teachers College Alumni Survey 2008 Report
Page 20 of 25
Communication, Collaboration, Leadership
Communication, Collaboration, Leadership
2.0
2.2
2.4
2.6
2.8
3.0
3.2
3.4
3.6
3.8
4.0
Communicating your ideas Being an effective teammember
Motivating other people in yourjob
importance to job self-perceived competence program contribution
Diversity, Multiculturalism, Advocacy, Social Justice
Diversity, Multiculturalism, Advocacy, Social Justice
2.0
2.2
2.4
2.6
2.8
3.0
3.2
3.4
3.6
3.8
4.0
Appreciatingcultural diversity
Getting along withpeople of different
backgrounds
Valuing differentperspectives
Working withdiverse people
Recognizing socialinequlities
Advocating forstudents/families
importance to job self-perceived competence program contribution
Teachers College Alumni Survey 2008 Report
Page 21 of 25
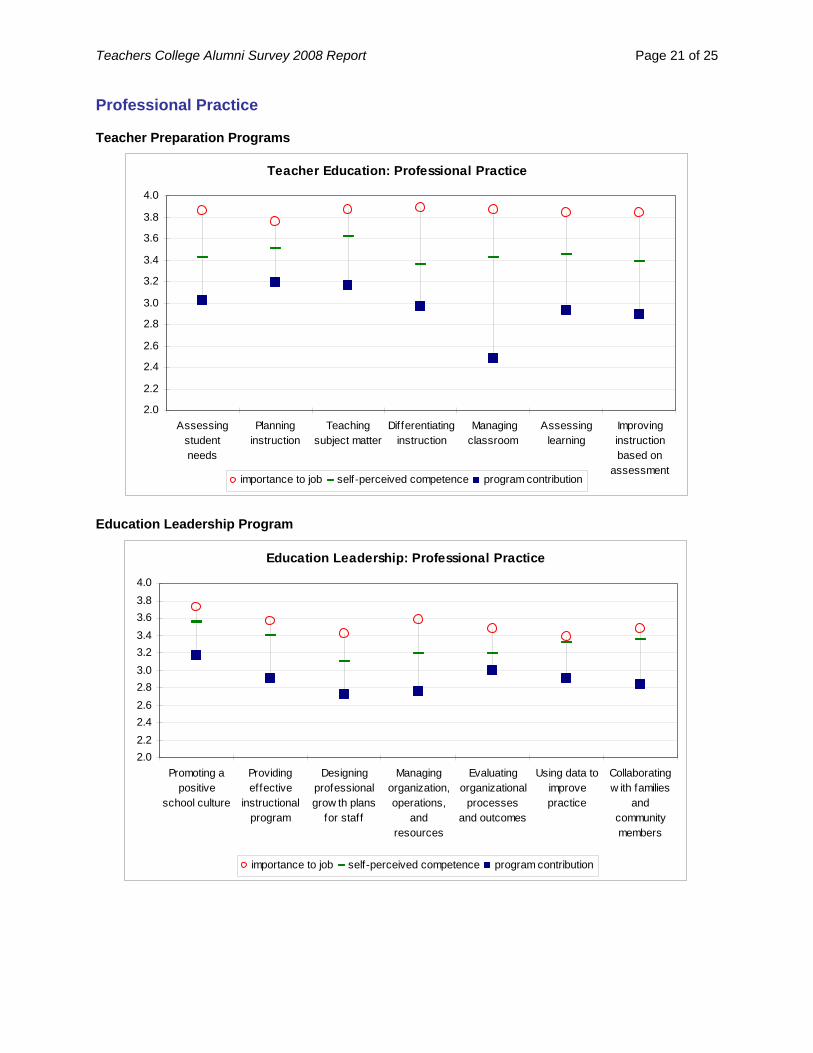
Professional Practice
Teacher Preparation Programs
Teacher Education: Professional Practice
2.0
2.2
2.4
2.6
2.8
3.0
3.2
3.4
3.6
3.8
4.0
Assessingstudentneeds
Planninginstruction
Teachingsubject matter
Differentiatinginstruction
Managingclassroom
Assessinglearning
Improvinginstructionbased on
assessmentimportance to job self-perceived competence program contribution
Education Leadership Program
Education Leadership: Professional Practice
2.02.22.42.62.83.03.23.43.63.84.0
Promoting apositive
school culture
Providingeffective
instructionalprogram
Designingprofessionalgrow th plans
for staff
Managingorganization,operations,
andresources
Evaluatingorganizational
processesand outcomes
Using data toimprovepractice
Collaboratingw ith families
andcommunitymembers
importance to job self-perceived competence program contribution

Teachers College Alumni Survey 2008 Report
Page 22 of 25
Psychological Counseling Program
Psychological Counseling: Professional Practice
2.02.22.42.62.83.0
3.23.43.63.84.0
Assessingstudents'needs
Designinginterventionsand services
Implementinginterventionsand services
Usingindividual and
groupcounselingstrategies
Consultingw ith students,
schoolpersonnel and
families
Analyzing andusing data
from multiplesources
Using resultsof needs
assessmentand programevaluation
importance to job self-perceived competence program contribution
School Psychology Program
School Psychology: Professional Practice
1.41.61.82.02.22.42.62.83.03.23.43.63.84.0
Assessing learning,behavior, or social-
emotionalproblems and
strengths
Implementingeducational andmental healthintervention
program
Implementingconsultationsabout learning,
mental health, orbehavior
Evaluatingeffectiveness ofeducational ormental healthinterventions
Teaching otherprofessionals in
psycho-educationalassessments
Conductingpsycho-educational
research
importance to job self-perceived competence program contribution

Teachers College Alumni Survey 2008 Report
Page 23 of 25
Speech and Language Pathology Program
Speech and Langauge Pathology: Professional Practice
2.0
2.2
2.4
2.6
2.8
3.0
3.2
3.4
3.6
3.8
4.0
Conductingscreening and
evaluationactivities
Developingintervention
plans
Using variety oftechniques,
instrumentation
Adaptingintervention
plans,instrumentation
Counselingclients,
caregivers
Evaluatingclients' progress
Identifying,referring clients
for services
importance to job self-perceived competence program contribution

Teachers College Alumni Survey 2008 Report
Page 24 of 25
OVERALL SATISFACTION
The majority (90%) of respondents felt well or very well prepared by their program. Almost all (95%) felt their Teachers College degree made them competitive or very competitive in the workforce. If they could start over, 87% of respondents would probably or definitely attend Teachers College, and 86% would probably or definitely choose the same program of study at Teachers College.
Overall Satisfaction
8% 10% 11%
40%
25%29% 27%
50%70%
58% 59%
A. In general, how w ell didyour program prepare you
for your current job?
B. How competitive do youfeel your Teachers Collegedegree makes you in the
w orkforce?
C. If you could start over,w ould you attend TC?
D. If you could start over,w ould you choose your
program at TC?
1 2 3 4
A. 1-poorly, 4-very w ellB. 1-not competitive at all, 4-very competitiveC. 1-definitely no, 4-definitely yesD. 1-definitely no, 4-definitely yes

Teachers College Alumni Survey 2008 Report
Page 25 of 25
APPENDIX

1. What current and valid teaching/administrative certificates do you have?
1. ………………………………………………………………. 2. …………………………………………………………………. 3. .………………………………………………………………… 4. list all others:………………………………………………….. 2. Are you currently employed?
1. Yes, working full-time
2. Yes, working part-time 3. No, but am seeking employment (skip to # 8) 4. No, and am not seeking employment (skip to # 8)
3. How would you classify your primary employer?
1. PreK-12 school: public 2. PreK-12 school: private
3. PreK-12 school: parochial 4. Self-employed or private practice 5. Health agency (e.g., hospital, clinic) 6. Non-profit (non-government) 7. College or university 8. Other ……………………………
4a. Zip code of your place of employment: ……………………. 4b. If outside USA, which country are you working in?
…………………………………………………………………… 5. What is your job title?
………………………………………………………………… 6. How related is your current job to your program of study
at TC? 1. 2. 3. 4.
Unrelated Directly related 7. In general, how well did the {program name} program pre-
pare you for your current job? 1. 2. 3. 4. Don’t Know
Poorly Very Well 8. How competitive do you feel your Teachers College degree
makes you in the workforce? 1. 2. 3. 4. Don’t Know
Not at all Very Competitive
9. If you could start over, would you attend TC? 1. 2. 3. 4.
Definitely not Definitely yes 10. If you could start over, would you choose the {program
name} program at TC? 1. 2. 3. 4.
Definitely not Definitely yes
Since graduation from the {program name} program, have you: 11. been a member of a professional association/society, e.g.?
1. Yes 2. No
12. presented at a professional conference? 1. Yes 2. No 13. published an article, a book chapter, or a book?
1. Yes 2. No
14. held a leadership position in a professional association/society? 1. Yes 2. No If you taught in a preK-12 school within the last academic year, please answer #15-21. If not, please skip to #22. 15. What grade(s) did you teach? ………………………………….... 16. What subject area(s) did you teach? ……………………….……………………………………………………………………. Approximately what percent of your students were: 17. ethnic/racial/cultural minority? ……………………………… 18. from low socio-economic backgrounds?……….……………. 19. English Language Learners? ……………………….………. 20. with special needs (other than )? ……………………………………………………………………. 21. How well did the {program name} program prepare you
to teach your students, as described in your responses to #17-20?
1. 2. 3. 4.
Poorly Very well
Please continue to Section II . If you are currently NOT employed, please skip
part A of Section II.
Survey of Teachers College Alumni 2009: {program name} SECTION I
SECTION III (If you are currently not employed, please answer question 3 only) 1. What other skills/competencies are important to your current job? …………………………………………………………. ………………………………………………………………………………………………………………………………………… 2. How much did the {program name} contribute to your development in the areas you listed above in question 1? very little 1. 2. 3. 4. very much 3. If you could make any suggestions to the {program name}, what would they be? ……………………………………………………………………………………………………………………………………….. ……………………………………………………………….……………………………………………………………………….. ……………………………………………………………………………………………………………………………………….. ……………………………………………………………………………………………………………………………………….
THANK YOU FOR YOUR PARTICIPATION!
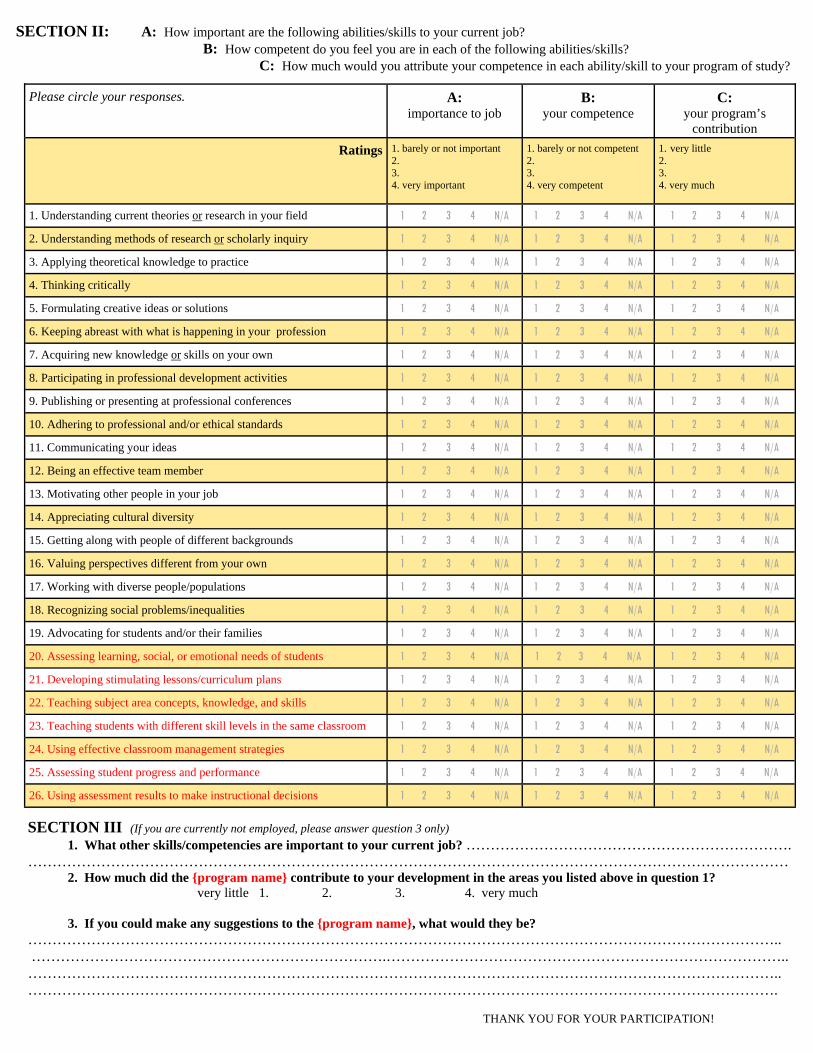
SECTION II: A: How important are the following abilities/skills to your current job? B: How competent do you feel you are in each of the following abilities/skills?
C: How much would you attribute your competence in each ability/skill to your program of study?
Please circle your responses. A: importance to job
B: your competence
C: your program’s
contribution Ratings 1. barely or not important
2. 3. 4. very important
1. barely or not competent 2. 3. 4. very competent
1. very little 2. 3. 4. very much
1. Understanding current theories or research in your field 1 2 3 4 N/A 1 2 3 4 N/A 1 2 3 4 N/A
2. Understanding methods of research or scholarly inquiry 1 2 3 4 N/A 1 2 3 4 N/A 1 2 3 4 N/A
3. Applying theoretical knowledge to practice 1 2 3 4 N/A 1 2 3 4 N/A 1 2 3 4 N/A
4. Thinking critically 1 2 3 4 N/A 1 2 3 4 N/A 1 2 3 4 N/A
5. Formulating creative ideas or solutions 1 2 3 4 N/A 1 2 3 4 N/A 1 2 3 4 N/A
6. Keeping abreast with what is happening in your profession 1 2 3 4 N/A 1 2 3 4 N/A 1 2 3 4 N/A
7. Acquiring new knowledge or skills on your own 1 2 3 4 N/A 1 2 3 4 N/A 1 2 3 4 N/A
8. Participating in professional development activities 1 2 3 4 N/A 1 2 3 4 N/A 1 2 3 4 N/A
9. Publishing or presenting at professional conferences 1 2 3 4 N/A 1 2 3 4 N/A 1 2 3 4 N/A
10. Adhering to professional and/or ethical standards 1 2 3 4 N/A 1 2 3 4 N/A 1 2 3 4 N/A
11. Communicating your ideas 1 2 3 4 N/A 1 2 3 4 N/A 1 2 3 4 N/A
12. Being an effective team member 1 2 3 4 N/A 1 2 3 4 N/A 1 2 3 4 N/A
13. Motivating other people in your job 1 2 3 4 N/A 1 2 3 4 N/A 1 2 3 4 N/A
14. Appreciating cultural diversity 1 2 3 4 N/A 1 2 3 4 N/A 1 2 3 4 N/A
15. Getting along with people of different backgrounds 1 2 3 4 N/A 1 2 3 4 N/A 1 2 3 4 N/A
16. Valuing perspectives different from your own 1 2 3 4 N/A 1 2 3 4 N/A 1 2 3 4 N/A
17. Working with diverse people/populations 1 2 3 4 N/A 1 2 3 4 N/A 1 2 3 4 N/A
18. Recognizing social problems/inequalities 1 2 3 4 N/A 1 2 3 4 N/A 1 2 3 4 N/A
19. Advocating for students and/or their families 1 2 3 4 N/A 1 2 3 4 N/A 1 2 3 4 N/A
20. Assessing learning, social, or emotional needs of students 1 2 3 4 N/A 1 2 3 4 N/A 1 2 3 4 N/A
21. Developing stimulating lessons/curriculum plans 1 2 3 4 N/A 1 2 3 4 N/A 1 2 3 4 N/A
22. Teaching subject area concepts, knowledge, and skills 1 2 3 4 N/A 1 2 3 4 N/A 1 2 3 4 N/A
24. Using effective classroom management strategies 1 2 3 4 N/A 1 2 3 4 N/A 1 2 3 4 N/A
25. Assessing student progress and performance 1 2 3 4 N/A 1 2 3 4 N/A 1 2 3 4 N/A
26. Using assessment results to make instructional decisions 1 2 3 4 N/A 1 2 3 4 N/A 1 2 3 4 N/A
23. Teaching students with different skill levels in the same classroom 1 2 3 4 N/A 1 2 3 4 N/A 1 2 3 4 N/A
Recommended