All-Island Transmission System Performance Report
2015

TTTTrrrraaaannnnssssmmmmiiiissssssssiiiioooonnnn SSSSyyyysssstttteeeemmmm PPPPeeeerrrrffffoooorrrrmmmmaaaannnncccceeee RRRReeeeppppoooorrrrtttt • 2015 Page 2
Table of ContentsTable of ContentsTable of ContentsTable of Contents 1. Introduction .................................................................................................................................... 6
2. Executive Summary ........................................................................................................................ 7
3. All-Island System Data ................................................................................................................... 8
3.1 Overview of the All-Island Electricity System ........................................................................ 8
3.2 Total System Production ........................................................................................................ 9
3.3 System Records ...................................................................................................................... 9
3.4 Generation Capacity .............................................................................................................. 10
3.5 Generation Availability ......................................................................................................... 10
3.6 Generation Forced Outage Rate ............................................................................................ 11
3.7 Generation Scheduled Outage Rate ..................................................................................... 12
4. EirGrid Transmission System Performance .................................................................................. 14
4.1 Summary ............................................................................................................................... 14
4.2 Transmission Infrastructure .................................................................................................. 14
4.3 Grid Development and Maintenance .................................................................................... 15
4.3.1 Completed Capital Projects .......................................................................................... 15
4.3.2 New Connection Offers Issued ..................................................................................... 16
4.3.3 New Connection Offers Accepted ................................................................................. 16
4.3.4 Connections Energised.................................................................................................. 17
4.3.5 Customers Certified Operational ................................................................................... 17
4.3.6 Maintenance Works Completed .................................................................................... 18
4.4 General System Performance ............................................................................................... 19
4.4.1 Under Frequency Load Shedding ................................................................................. 19
4.4.2 Under Voltage Load Shedding ...................................................................................... 20
4.4.3 System Minutes Lost..................................................................................................... 20
4.4.4 Zone Clearance Ratio .................................................................................................... 21
4.4.5 Frequency Control ......................................................................................................... 22
4.5 Summary of Important Disturbances ................................................................................... 22
4.5.1 Loss of Load.................................................................................................................. 22
4.5.2 Under Frequency Load Shedding ................................................................................. 23
4.6 Transmission System Availability & Outages ...................................................................... 24
4.6.1 Transmission System Availability ................................................................................. 24
4.6.2 Transmission Plant Availability ..................................................................................... 24
4.6.3 Cause of Transmission Plant Unavailability ................................................................. 25
4.6.4 110 kV Plant Unavailability ........................................................................................... 26
4.6.5 220 kV Plant Unavailability .......................................................................................... 27
4.6.6 275 kV Plant Unavailability .......................................................................................... 27
TTTTrrrraaaannnnssssmmmmiiiissssssssiiiioooonnnn SSSSyyyysssstttteeeemmmm PPPPeeeerrrrffffoooorrrrmmmmaaaannnncccceeee RRRReeeeppppoooorrrrtttt • 2015 Page 3
4.6.7 400 kV Plant Unavailability .......................................................................................... 27
4.6.8 East West Interconnector Unavailability ....................................................................... 29
4.6.9 Transmission Outage Duration ..................................................................................... 29
4.6.10 Timing of Transmission Outages .................................................................................. 30
4.6.11 Forced Outages ............................................................................................................. 32
4.6.12 Forced Outages per km ................................................................................................ 32
4.6.13 Forced Outages per MVA .............................................................................................. 33
5. SONI Transmission System Performance ..................................................................................... 34
5.1 Summary ............................................................................................................................... 34
5.2 Transmission System Availability ......................................................................................... 35
5.2.1 System Unavailability .................................................................................................... 37
5.2.2 System Historic Availability Performance ..................................................................... 37
5.2.3 System Historic Unavailability Performance ................................................................. 38
5.3 Interconnector and Tie-Line Availability .............................................................................. 38
5.3.1 Moyle Interconnector .................................................................................................... 38
5.3.2 Moyle Interconnector Historic Availability .................................................................... 39
5.3.3 Moyle Interconnector Historic Unavailability ................................................................ 39
5.3.4 Moyle Interconnector Monthly Unavailability ............................................................... 40
5.3.5 275 kV Tie Line ............................................................................................................. 40
5.3.6 110 kV Tie Lines ............................................................................................................ 42
5.4 Transmission System Security .............................................................................................. 43
5.4.1 Incidents for 2015 ......................................................................................................... 43
5.4.2 Number of Incidents and Estimated Unsupplied Energy ............................................. 43
5.4.3 Incident Analysis ........................................................................................................... 44
5.4.4 Unsupplied Energy ........................................................................................................ 44
5.5 Quality of Service ................................................................................................................. 45
5.5.1 Voltage .......................................................................................................................... 45
5.5.2 Voltage Excursions ........................................................................................................ 45
5.5.3 Frequency ...................................................................................................................... 45
5.5.4 Frequency Excursions .................................................................................................... 46
5.5.5 Historical Frequency Excursions ................................................................................... 47
Appendix 1 Glossary ............................................................................................................................ 48
Disturbance ...................................................................................................................................... 48
Fault 48
Major incident .................................................................................................................................. 48
Main System ..................................................................................................................................... 48
MVA Minute Lost .............................................................................................................................. 48
TTTTrrrraaaannnnssssmmmmiiiissssssssiiiioooonnnn SSSSyyyysssstttteeeemmmm PPPPeeeerrrrffffoooorrrrmmmmaaaannnncccceeee RRRReeeeppppoooorrrrtttt • 2015 Page 4
Non Main System/Outside the Main System ................................................................................... 48
Non System Fault ............................................................................................................................. 49
Permanent Fault ............................................................................................................................... 49
Protection - Correct Operation ......................................................................................................... 49
Protection - Incorrect Operation ...................................................................................................... 49
STAR Scheme ................................................................................................................................... 49
Sustained Interruption ..................................................................................................................... 49
System Fault ..................................................................................................................................... 49
System Minute ................................................................................................................................. 50
Transient Fault ................................................................................................................................. 50
Zone Clearance Ratio ....................................................................................................................... 50
Zones of Protection .......................................................................................................................... 51
Appendix 2 All Island Frequency Excursion Graphs............................................................................ 52
EWIC & B21 -22/06/2015 .................................................................................................................. 53
Great Island 4 – 07/07/2015 ............................................................................................................ 54
Great Island 4 – 14/03/2015 ............................................................................................................. 55
Great Island 4 – 06/01/2015 ............................................................................................................. 56
Great Island 4 – 31/08/2015 ............................................................................................................. 57
Great Island 4 – 10/02/2015 ............................................................................................................. 58
Huntstown Unit 2 – 27/07/2015 ....................................................................................................... 59
Great Island 4 – 31/03/2015 ............................................................................................................. 60
Great Island 4 – 04/03/2015 ............................................................................................................ 61
Great Island 4 – 18/03/2015 ............................................................................................................. 62
Dublin Bay – 22/01/2016 .................................................................................................................. 63
EWIC – 20/06/2015 ........................................................................................................................... 64
Great Island – 13/03/2015 ................................................................................................................ 65
Moyle – 07/08/2016 .......................................................................................................................... 66
Appendix 3 All Island Fully Dispatchable Generation Plant ............................................................... 67
Appendix 4 – EirGrid Maintenance Policy Terms ................................................................................ 70
Stations ............................................................................................................................................ 70
Overhead Lines ................................................................................................................................ 71
Cables 71
Appendix 5 Formulae (EirGrid Transmission System) ......................................................................... 72
Availability & Unavailability Formula .............................................................................................. 72
System Minute Formula ................................................................................................................... 72

TTTTrrrraaaannnnssssmmmmiiiissssssssiiiioooonnnn SSSSyyyysssstttteeeemmmm PPPPeeeerrrrffffoooorrrrmmmmaaaannnncccceeee RRRReeeeppppoooorrrrtttt • 2015 Page 5
Table of FigurTable of FigurTable of FigurTable of Figureseseses Table 1: Total Exported Energy 2014 & 2015 ....................................................................... 9 Table 2: System Records 2014 & 2015 ............................................................................... 10 Table 3: Transmission System Infrastructure 2014 & 2015 ................................................. 15 Table 4: New Demand & Generation Connection Offers Issued 2015 ................................. 16 Table 5: Executed Demand & Generation Connection Agreements in 2015 ........................ 16 Table 6: Demand & Generation Connections Energised in 2015 ......................................... 17 Table 7: Customers Certified Operational in 2015 ............................................................... 17 Table 8: Maintenance Summary for 2015 ............................................................................ 19 Table 9: Summary of UFLS disturbances in 2015 ................................................................ 19 Table 10: Number of Zone 1, non-Zone 1 and Zone 2 clearances 2004 - 2015 .................. 22 Table 11: Transmission System Plant Availability 2014 & 2015 .......................................... 25 Table 12: Transmission System Plant Unavailability Categories ......................................... 25 Table 13: Transmission System Plant Outage 2015 ............................................................ 28 Table 14: Voltage step change limits in operational timescales ........................................ 45 Table 15: Frequency Excursions in NI in 2015 .................................................................... 46
Figure 1: Generation System Availability 2015 .................................................................... 11 Figure 2: Generation System Forced Outage Rate 2015 ...................................................... 12 Figure 3: Generation System Scheduled Outage Rate 2015 ................................................ 13 Figure 4: Number of STAR events 2004 - 2015 .................................................................. 20 Figure 5: System Minutes attributable to EirGrid 2006 - 2015 ............................................ 21 Figure 6: Zone Clearance Ratio 2004 - 2015 ....................................................................... 21 Figure 7: Monthly Variations of System Unavailability 2014 & 2015 .................................. 24 Figure 8: Causes of Unavailability on the 110kV System in 2015 ....................................... 26 Figure 9: Causes of Unavailability on the 220kV System in 2015 ...................................... 27 Figure 10: Causes of Unavailability on the 400kV System in 2015 .................................... 28 Figure 11: Causes of East West Interconnector Unavailability in 2015 ............................... 29 Figure 12: Duration of Outages in 2014 & 2015 ................................................................. 30 Figure 13: Percentage unavailability in each month of 2014 & 2015 .................................. 31 Figure 14: Average duration of outages 2014 & 2015 ......................................................... 31 Figure 15: Nature of Feeder Forced Outages 2014 & 2015 ................................................. 33 Figure 16: Nature of Transformer Forced Outages 2014 & 2015 ........................................ 33 Figure 17: Transmission System Availability 2015 .............................................................. 36 Figure 18: Transmission System Unavailability 2015 .......................................................... 37 Figure 19: Historic System Availability 1998-2015 .............................................................. 37 Figure 20: Historic System Unavailability 2005-2015 ......................................................... 38 Figure 21: Historic Moyle Interconnector Availability 2002/03 - 2015 ................................ 39 Figure 22: Historic Moyle Interconnector Unavailability 2005-2015 ................................... 39 Figure 23: Moyle Interconnector Unavailability 2015 ......................................................... 40 Figure 24: Historic North-South Tie Line Availability 1995-2015 ......................................... 41 Figure 25: North-South Tie Line Monthly Unavailability 2015 ............................................. 41 Figure 26: North-South Tie Line Unavailability 1995-2015 ................................................. 42 Figure 27: Historic 110kV Tie Line Availability 1999-2015 .................................................. 43 Figure 28: Historic System Security 1995-2015 .................................................................. 44 Figure 29: Historic Unsupplied Energy 2005-2015 ............................................................. 44 Figure 30: Historic Frequency Excursions 2012-2015 .......................................................... 47

TTTTrrrraaaannnnssssmmmmiiiissssssssiiiioooonnnn SSSSyyyysssstttteeeemmmm PPPPeeeerrrrffffoooorrrrmmmmaaaannnncccceeee RRRReeeeppppoooorrrrtttt • 2015 Page 6
1. Introduction EirGrid and SONI, as Transmission System Operators (TSOs) for Ireland and Northern Ireland
respectively, are pleased to present the annual Transmission System Performance Report for 2015.
This report contains transmission system data and performance statistics for the transmission
system in Ireland and Northern Ireland for the year 2015 (1st January 2015 – 31st December 2015).
The report includes both transmission system performance statistics and a number of high level
transmission system characteristics.
EirGrid is required to publish an annual report on the performance of the TSO business in
accordance with Condition 18 of the Transmission System Operator Licence granted to EirGrid by
the Commission for Energy Regulation (CER).
Similarly, SONI is required to produce an annual report on the performance of the TSO business in
accordance with Condition 20 of the Licence to participate in the Transmission of Electricity
granted to SONI Ltd by the Department of Enterprise Trade and Investment.
This report contains high level transmission system characteristics and a detailed breakdown of
key figures along with an explanation of what these figures mean for the all-island transmission
system in the coming year and into the future. Through comparison with previous reports, this
report provides a useful resource through which possible trends can be identified.
This report is structured as follows:
• Section 3 outlines all-island system data, generation availability and outages,
• Section 4 details the performance of the EirGrid TSO business during 2015 against the
criteria approved by the CER,
• Section 5 details the performance of the SONI TSO business during 2015 against the
criteria approved by the Utility Regulator in Northern Ireland (URegNI).
Appendices which provide further detail on the data, results and methodology of relevance are
included at the end of this report.

TTTTrrrraaaannnnssssmmmmiiiissssssssiiiioooonnnn SSSSyyyysssstttteeeemmmm PPPPeeeerrrrffffoooorrrrmmmmaaaannnncccceeee RRRReeeeppppoooorrrrtttt • 2015 Page 7
2. Executive Summary The annual Transmission System Performance Report for 2015 is a comprehensive review of the
transmission system through which EirGrid and SONI make available key all-island system
operating data from the previous year.
Key statistics detailed in this report include:
• All Island Generation Statistics
• Transmission System Availability statistics for IE and NI
• Details on System Events leading to System Minutes Lost
• Details of All Island System Frequency Events
KEY DATAKEY DATAKEY DATAKEY DATA
AllAllAllAll----islandislandislandisland
• All-island peak demand reached 6392 MW on Monday the 19th January 2015. The minimum
all-island demand was 2295 MW was occurred on Sunday 19th July 2015.
• The all-island installed capacity of conventional, dispatchable generation in December 2015
was 9357 MW.
• In 2015 a maximum all-island wind generation level of 2607 MW occurred on Saturday the
19th of December 2015.
• In 2015 the system frequency was operated within 49.9 Hz and 50.1 Hz for 99.4% of the
time
• In 2015 the system was operated at all times within acceptable international standards for
safety, security and reliability of customer supplies.
IrelandIrelandIrelandIreland
• In 2015 the availability of the East West Interconnector was 97.55%.
• The average plant availability in Ireland in 2015 was 94.42%.
• The System Minutes lost for 2015, attributable to EirGrid, was 0.049.
Northern IrelandNorthern IrelandNorthern IrelandNorthern Ireland
• The availability of the Moyle Interconnector for 2015 was 49.62%.
• The average availability of the Northern Ireland transmission system was in 2015 was
96.83%.
• The System Minutes lost for 2015, in Northern Ireland was 2.606, 2.519 of which can be
attributed to an incident at Castlereagh 110 kV substation in April.

TTTTrrrraaaannnnssssmmmmiiiissssssssiiiioooonnnn SSSSyyyysssstttteeeemmmm PPPPeeeerrrrffffoooorrrrmmmmaaaannnncccceeee RRRReeeeppppoooorrrrtttt • 2015 Page 8
3. All-Island System Data
3.1 Overview of the All-Island Electricity System
The transmission system in Ireland and Northern Ireland provides the means to transport energy
from generators to demand centres across the island. The transmission system is comprised of
high voltage overhead lines and cables that connect power stations, interconnectors and
substations. Transformers link different voltage levels and provide a path for power to flow from
higher to lower voltage networks. The transmission system in Northern Ireland is operated at 275
kV and 110 kV. The transmission system in Ireland is operated at 400 kV, 220 kV and 110 kV.
The 400 kV, 275 kV and 220 kV networks form the backbone of the transmission system. They
have higher power carrying capacity and lower losses than the 110 kV network.
The Northern Ireland and Ireland transmission systems are electrically connected by means of one
275 kV double circuit. This connection is from Louth station in Co. Louth (IE) to Tandragee station
in Co. Armagh (NI).
There are also two 110 kV connections:
• Letterkenny station in Co. Donegal (IE) to Strabane station in Co. Tyrone (NI)
• Corraclassy station in Co. Cavan (IE) to Enniskillen station in Co. Fermanagh (NI)
This section contains basic all-island transmission system data. Further information can be found
on the EirGrid Group website: www.eirgridgroup.com.
TTTTrrrraaaannnnssssmmmmiiiissssssssiiiioooonnnn SSSSyyyysssstttteeeemmmm PPPPeeeerrrrffffoooorrrrmmmmaaaannnncccceeee RRRReeeeppppoooorrrrtttt • 2015 Page 9
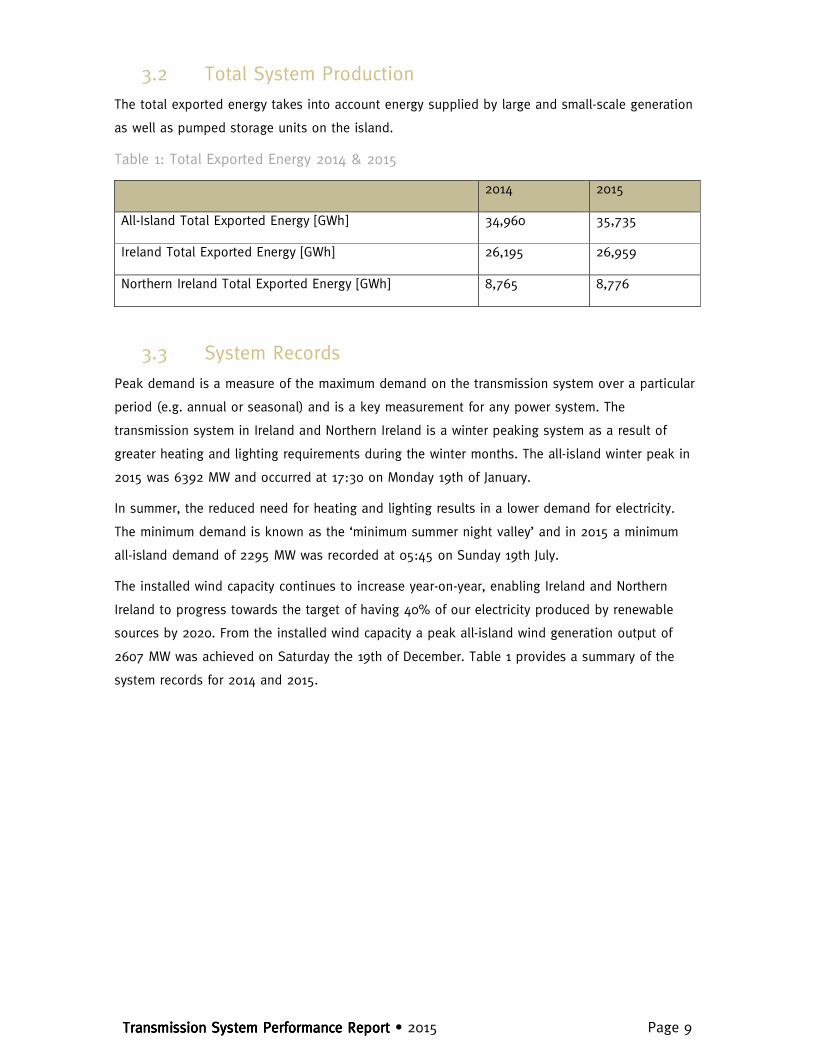
3.2 Total System Production
The total exported energy takes into account energy supplied by large and small-scale generation
as well as pumped storage units on the island.
Table 1: Total Exported Energy 2014 & 2015
2014 2015
All-Island Total Exported Energy [GWh] 34,960 35,735
Ireland Total Exported Energy [GWh] 26,195 26,959
Northern Ireland Total Exported Energy [GWh] 8,765 8,776
3.3 System Records
Peak demand is a measure of the maximum demand on the transmission system over a particular
period (e.g. annual or seasonal) and is a key measurement for any power system. The
transmission system in Ireland and Northern Ireland is a winter peaking system as a result of
greater heating and lighting requirements during the winter months. The all-island winter peak in
2015 was 6392 MW and occurred at 17:30 on Monday 19th of January.
In summer, the reduced need for heating and lighting results in a lower demand for electricity.
The minimum demand is known as the ‘minimum summer night valley’ and in 2015 a minimum
all-island demand of 2295 MW was recorded at 05:45 on Sunday 19th July.
The installed wind capacity continues to increase year-on-year, enabling Ireland and Northern
Ireland to progress towards the target of having 40% of our electricity produced by renewable
sources by 2020. From the installed wind capacity a peak all-island wind generation output of
2607 MW was achieved on Saturday the 19th of December. Table 1 provides a summary of the
system records for 2014 and 2015.

TTTTrrrraaaannnnssssmmmmiiiissssssssiiiioooonnnn SSSSyyyysssstttteeeemmmm PPPPeeeerrrrffffoooorrrrmmmmaaaannnncccceeee RRRReeeeppppoooorrrrtttt • 2015 Page 10
Table 2: System Records 2014 & 2015
2014 2015
Winter Peak Demand [MW] 6310 6392
Minimum Summer Night Valley [MW] 2191 2295
Maximum Wind Generation [MW] 2314 2607
3.4 Generation Capacity
Generating plant is connected to both the transmission and distribution systems. All generation
contributes to meeting system demand. The total generation capacity is calculated as the sum of
all fully operational generator capacities connected to both systems1.
The all-Island installed capacity of conventional, dispatchable generation in December 2015 was
9357 MW (7,166 MW in Ireland and 2215 MW in Northern Ireland). This does not include any
import capacity from the Moyle Interconnector or the East West Interconnector.
The all-island installed capacity of wind generation in December 2015 was 3,041 MW (2,400 MW in
Ireland and 641 MW in Northern Ireland).
Appendix 1 provides a list of the fully dispatchable generating units connected to the transmission
system.
3.5 Generation Availability
Generation Availability is a measure of the capability of a generator to deliver power in a given
period to the transmission system. In order for EirGrid and SONI to operate a secure and reliable
transmission system in an economic and efficient manner, it is necessary for generators to
maintain a high rate of availability.
Generation system availability is calculated on a daily and 365-day rolling average basis2. Figure 1
shows the daily and 365-day rolling average availability for 2014.
1 Fully operational generator capacity is given by the Maximum Export Capacity (MEC) of the generator 2 365-day rolling average is a capacity weighted average availability over the previous 365 days

TTTTrrrraaaannnnssssmmmmiiiissssssssiiiioooonnnn SSSSyyyysssstttteeeemmmm PPPPeeeerrrrffffoooorrrrmmmmaaaannnncccceeee RRRReeeeppppoooorrrrtttt • 2015 Page 11
Figure 1: Generation System Availability 2015
• The average daily generation system availability in 2015 was 87.58%
• The maximum daily generation system availability in 2015 was 96.56%, occurring on the
7th of February.
• The minimum daily generation system availability in 2015 was 74.63%, occurring on the
19th of August.
3.6 Generation Forced Outage Rate
The generation forced outage rate (FOR) is calculated on a daily and rolling 365-day average basis.
The daily FOR is a capacity weighted percentage of the time during the day that generation units
are unavailable due to unforeseen/unplanned outages. The 365-day rolling FOR is the average of
the daily FOR over the previous 365 days. The daily FOR and 365-day rolling FOR are shown in
Figure 2.
60
65
70
75
80
85
90
95
100
Jan Feb Mar Apr May Jun Jul Aug Sep Oct Nov Dec
% A
va
ila
bil
ity
Month
2015 All-Island Generator Availability
365 Rolling Availability % Daily Availability %

TTTTrrrraaaannnnssssmmmmiiiissssssssiiiioooonnnn SSSSyyyysssstttteeeemmmm PPPPeeeerrrrffffoooorrrrmmmmaaaannnncccceeee RRRReeeeppppoooorrrrtttt • 2015 Page 12
Figure 2: Generation System Forced Outage Rate 2015
• The average daily generation system forced outage rate in 2015 was 10.07%.
• The highest forced outage rate in 2015 was 20.06%, occurring on the 9th of November. On
this date the following units were on a forced outage: Great Island GI4, Moneypoint MP3,
Ballylumford B31 and Coolkeeragh GT8.
• The minimum daily generation system forced outage rate in 2015 was 2.23%.
3.7 Generation Scheduled Outage Rate
The generation scheduled outage rate (SOR) can be calculated on a daily and rolling 365-day
average basis. The daily SOR is a capacity weighted percentage of the time during the day that
generation units are unavailable due to planned outages. The 365-day rolling SOR is the average
of the weekly SOR over the previous 365 days.
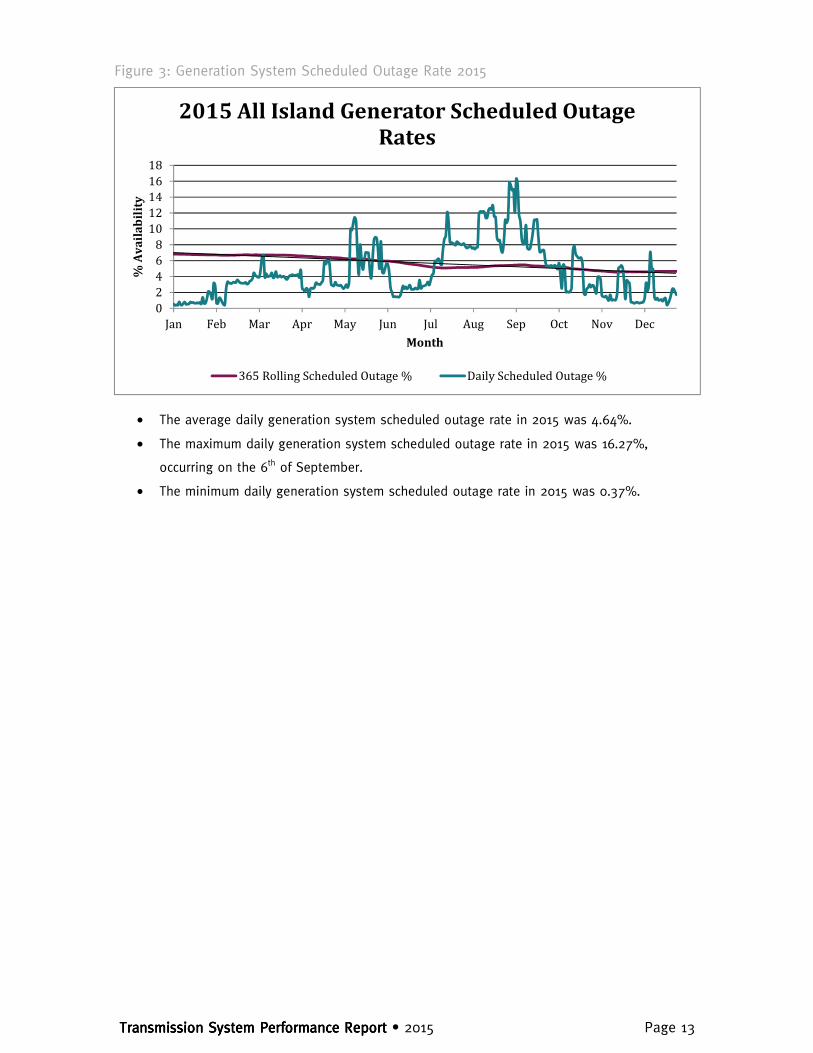
The daily SOR and 365-day rolling SOR are shown in Figure 3.
0
10
20
30
Jan Feb Mar Apr May Jun Jul Aug Sep Oct Nov Dec
% A
va
ila
bil
ity
Month
2015 All Island Generator FOR
365 Rolling FOR % Daily FOR %
TTTTrrrraaaannnnssssmmmmiiiissssssssiiiioooonnnn SSSSyyyysssstttteeeemmmm PPPPeeeerrrrffffoooorrrrmmmmaaaannnncccceeee RRRReeeeppppoooorrrrtttt • 2015 Page 13
Figure 3: Generation System Scheduled Outage Rate 2015
• The average daily generation system scheduled outage rate in 2015 was 4.64%.
• The maximum daily generation system scheduled outage rate in 2015 was 16.27%,
occurring on the 6th of September.
• The minimum daily generation system scheduled outage rate in 2015 was 0.37%.
0
2
4
6
8
10
12
14
16
18
Jan Feb Mar Apr May Jun Jul Aug Sep Oct Nov Dec
% A
va
ila
bil
ity
Month
2015 All Island Generator Scheduled Outage
Rates
365 Rolling Scheduled Outage % Daily Scheduled Outage %

TTTTrrrraaaannnnssssmmmmiiiissssssssiiiioooonnnn SSSSyyyysssstttteeeemmmm PPPPeeeerrrrffffoooorrrrmmmmaaaannnncccceeee RRRReeeeppppoooorrrrtttt • 2015 Page 14
4. EirGrid Transmission System
Performance This section relates to the performance of EirGrid TSO and the transmission system in Ireland only,
unless explicitly stated otherwise. This data has been prepared by EirGrid in accordance with the
requirements of Part 5 of Condition 18 of its Transmission System Operator Licence.
4.1 Summary
The system was operated at all times within acceptable international standards for safety, security
and reliability of customer supplies. All security of supply Key Performance Indicators (KPIs) were
achieved throughout the year.
The System Minutes lost as a result of faults on the Main System was 0.049 in 2015. No System
Minutes were lost due to the disconnection of Normal Tariff load customers during UFLS
disturbances.
EirGrid have a target to operate the system frequency within the range 49.9 Hz to 50.1 Hz for 94%
of the time. In 2015 the system frequency was within the agreed limits for 99.4% of the time.
Extensive maintenance of the transmission system was carried out throughout the year, including
7,791 km of overhead line patrols.
4.2 Transmission Infrastructure
The transmission system is a meshed network of high voltage lines and cables (110 kV, 220 kV,
275 kV and 400 kV) for the transmission of bulk electricity supplies around Ireland. This excludes
the Dublin 110 kV network and some other specific 110 kV circuits which are treated as part of the
distribution system. Table 3 provides a summary of transmission system infrastructure for 2015
and 2014.

TTTTrrrraaaannnnssssmmmmiiiissssssssiiiioooonnnn SSSSyyyysssstttteeeemmmm PPPPeeeerrrrffffoooorrrrmmmmaaaannnncccceeee RRRReeeeppppoooorrrrtttt • 2015 Page 15
Table 3: Transmission System Infrastructure 2014 & 2015
2014201420142014 2015201520152015
Plant TypePlant TypePlant TypePlant Type No. of No. of No. of No. of ItemsItemsItemsItems
Circuit LengCircuit LengCircuit LengCircuit Length th th th [km][km][km][km]
No. of No. of No. of No. of ItemsItemsItemsItems
Circuit Length Circuit Length Circuit Length Circuit Length [km][km][km][km]
110 kV Circuits 199 4268 203 4342
220 kV Circuits 55 1917 56 1927
275 kV Circuits 2 97 2 97
400 kV Circuits 4 439 4 439
Circuit Total 260 6721 265 6799
Plant TypePlant TypePlant TypePlant Type No. of No. of No. of No. of ItemsItemsItemsItems
Transformer Transformer Transformer Transformer Capacity [MVA]Capacity [MVA]Capacity [MVA]Capacity [MVA]
No. of No. of No. of No. of ItemsItemsItemsItems
Transformer Transformer Transformer Transformer Capacity [MVA]Capacity [MVA]Capacity [MVA]Capacity [MVA]
220 / 110 kV Transformers
46 8739 46 8739
275 / 220 kV Transformers
3 1200 3 1200
400 / 220 kV Transformers
7 3550 7 3550
Transformer Total 56 13489 56 13489
Total No. of Substations 153 154
4.3 Grid Development and Maintenance
This section provides an overview of grid development activities in 2015.
4.3.1 Completed Capital Projects
Over the course of 2015 the following capital projects were completed:
• Ikerrin - Thurles 110kV line uprate incl. Thurles BB uprate
• Carrick-on-Shannon 110kV Station BB uprate
• Woodhouse 110kV connection shallow works
• Carrigadrohid - Macroom 110kV line uprate- Line Works
• Cunghill - Sligo 110kV line uprate
• Cahir - Tipperary 110kV Line Uprate ( Including Tipperary Busbar)
• Maynooth - Ryebrook 110kV line uprate - Line Works Internal (EM1 - AM26)
• Cloghboola Wind Farm (Shallow Works) - linked to CP0500
• Dunfirth - Kinnegad - Rinawade 110kV refurbishment
• Dunstown - Turlough Hill 220kV line refurbishment
• Boggeragh 2WF Extension (new bay in Boggeragh)
• Kilbarry 110kV Station Replacement of three 110kV CBs

TTTTrrrraaaannnnssssmmmmiiiissssssssiiiioooonnnn SSSSyyyysssstttteeeemmmm PPPPeeeerrrrffffoooorrrrmmmmaaaannnncccceeee RRRReeeeppppoooorrrrtttt • 2015 Page 16
• Finglas 220kV station (T2101 ) transformer replacement project
• Cullenagh Knockraha Polymeric Insulator Replacement
4.3.2 New Connection Offers Issued
Parties seeking a new connection to the transmission system or to amend an existing Connection
Agreement must apply to EirGrid for a connection offer. EirGrid operates a standard regulatory
approved process for providing Connection Offers to generators and demand customers seeking
direct connection to the transmission system. Table 4 details the number of new connection offers
made by EirGrid in 2015.
Table 4: New Demand & Generation Connection Offers Issued 2015
DemandDemandDemandDemand GenerationGenerationGenerationGeneration
New Connection Offers Issued in 2015 [No.]3 1 0
New Connection Offers Issued in 2015 [MW Capacity] 53.33 MVA 0 MW
4.3.3 New Connection Offers Accepted
In order to connect to the transmission system, all demand and generation customers must
execute a Connection Agreement with EirGrid. Table 5 summarises the total number of executed
Connection Agreements in 2015 and their associated load or generation capacities. A connection
offer which is accepted in one year is unlikely to impact on connected generation capacity in the
same year given the lead times associated with construction.
Table 5: Executed Demand & Generation Connection Agreements in 2015
DemandDemandDemandDemand GenerationGenerationGenerationGeneration
Executed Connection Offer Agreements in 2015 [No.] 0 1 Executed Connection Offer Agreements in 2015 [Capacity] 0 MVA 330 MW
As well as the connection offers issued and accepted there has been a significant increase in the
work done to modify connection agreements held by existing customers in 2015.
3 These figure do not include non-capacity connection offers, decreases in MEC and termination of offers

TTTTrrrraaaannnnssssmmmmiiiissssssssiiiioooonnnn SSSSyyyysssstttteeeemmmm PPPPeeeerrrrffffoooorrrrmmmmaaaannnncccceeee RRRReeeeppppoooorrrrtttt • 2015 Page 17
4.3.4 Connections Energised
When a Connection Agreement is executed for a new connection, it typically takes a number of
years before the demand or generation is connected to the transmission system. This period
includes project development, time taken to obtain consents and to construct the connection.
When the transmission connection is energised, it then takes a number of months for the
generator to reach commercial operation. This period is generally much shorter for demand
customers.
Table 6 provides an overview of the number of new connections to the transmission system
commissioned in 2015.
Table 6: Demand & Generation Connections Energised in 2015
DemandDemandDemandDemand GenerationGenerationGenerationGeneration
Connections Energised in 2015 [No.] 0 4 Connections Energised in 2015 [Capacity] 0 MVA 132 MW
4.3.5 Customers Certified Operational
Table 7 provides an overview of customers connected to the transmission system who have been
deemed fully operational. It shows customer connections which have completed the testing phase
and have received an operational certificate from EirGrid. This includes generators connected to
the distribution network. Note that demand customers are not currently certified by EirGrid and
are therefore not included in the table.
Table 7: Customers Certified Operational in 2015
Total No. of sites Certified Operational Total No. of sites Certified Operational Total No. of sites Certified Operational Total No. of sites Certified Operational
2015201520152015 Customers Certified Operational
13 [Total No. of sites]
Customers Certified Operational [MW Capacity]
198
As of the end of 2015, there were a total of 12 Demand Side Units (DSU) certified as operational
with a total capacity of 251 MW.

TTTTrrrraaaannnnssssmmmmiiiissssssssiiiioooonnnn SSSSyyyysssstttteeeemmmm PPPPeeeerrrrffffoooorrrrmmmmaaaannnncccceeee RRRReeeeppppoooorrrrtttt • 2015 Page 18
4.3.6 Maintenance Works Completed
Transmission maintenance is undertaken in accordance with EirGrid’s maintenance policy to
ensure that the transmission system can operate in a safe, secure and reliable manner. The policy
comprises continuous and cyclical condition monitoring (on-line and off-line), preventative
maintenance on critical items of plant and the implementation of corrective maintenance tasks.
The maintenance policy is kept under review to ensure that it continues to meet the requirements
of the system and best international practice. On an annual basis, transmission maintenance
activities dictated by the asset maintenance policy and protection maintenance policy, along with
work identified from analysis of plant condition and work carried over from the previous year
combine to form the planned maintenance requirements for the year. This is then included in the
Transmission Outage Plan.
During the relevant year, due to a variety of reasons (including resource limitations, outage
restrictions, material availability, system conditions, CAPEX projects etc.), it may be necessary to
defer programmed maintenance activities. The TSO will consider the appropriateness or otherwise
of deferring preventive and/or corrective maintenance activities. This is subject to prioritisation
and deferral assessments in accordance with established EirGrid procedures. These assessments
will consider system/safety/environmental impact, duration of outage, controls and mitigation
measures. Deferrals are kept under review, as any increase in backlog could have a negative
impact on the reliability and performance of the transmission system.
Table 8 provides, in volume terms, a summary of transmission maintenance requirements,
maintenance programmed and maintenance completed in 2015 for overhead lines, underground
cables and transmission stations. In order to facilitate more maintenance work and CAPEX projects,
EirGrid took the decision in 2015 to extend the transmission outage season by two months; work
now takes place from the beginning of March and continues until the end of November.

TTTTrrrraaaannnnssssmmmmiiiissssssssiiiioooonnnn SSSSyyyysssstttteeeemmmm PPPPeeeerrrrffffoooorrrrmmmmaaaannnncccceeee RRRReeeeppppoooorrrrtttt • 2015 Page 19
Table 8: Maintenance Summary for 2015
Volume of Transmission Maintenance by ActivityVolume of Transmission Maintenance by ActivityVolume of Transmission Maintenance by ActivityVolume of Transmission Maintenance by Activity MaintenanceMaintenanceMaintenanceMaintenance RequirementsRequirementsRequirementsRequirements
Maintenance Maintenance Maintenance Maintenance Programme Programme Programme Programme Year EndYear EndYear EndYear End
Maintenance Maintenance Maintenance Maintenance CompletedCompletedCompletedCompleted
Overhead Line MaintenanceOverhead Line MaintenanceOverhead Line MaintenanceOverhead Line Maintenance
Patrols ( incl. Helicopter, climbing, infrared & Bolt) 9,221 9,221 7,791
Timber Cutting [km] 44 44 23
Structure & Hardware Replacement [Number] 74 80 57
Insulator & Hardware Replacement [Number] 234 233 29
Underground Cable MaintenanceUnderground Cable MaintenanceUnderground Cable MaintenanceUnderground Cable Maintenance
Alarm Checks / Inspection [Number] 620 750 597
Station MaintenanceStation MaintenanceStation MaintenanceStation Maintenance
Ordinary Service [Number] 509 332 240
Operational Tests [Number] 1037 1028 807
Condition Assessment of Switchgear [Number] 275 147 106
Tap Changer Inspection [Number] 13 12 8
Corrective Maintenance Tasks [No. of Tasks] 530 596 349
4.4 General System Performance
4.4.1 Under Frequency Load Shedding
There were no Under Frequency Load Shedding (UFLS) disturbances in 2015 which resulted in
shedding of Normal Tariff (NT) load customers. Short Term Active Response (STAR) interruptible
load customers were disconnected on three occasions. Two UFLS disturbances were due to large
generator trips. One UFLS disturbance was due to a tripping of the East West Interconnector.
Table 9 provides a summary of each UFLS event. The relays to disconnect Normal Tariff customer
load are only activated once the system frequency drops to 48.85 Hz. The time to recover to
49.9 Hz starts from 49.3 Hz, the point at which the STAR under frequency relays are activated.
The lowest system frequency in 2015 was 49.09 Hz; during the second UFLS disturbance.
Table 9: Summary of UFLS disturbances in 2015
SDR No.SDR No.SDR No.SDR No. DateDateDateDate UnitUnitUnitUnit MWMWMWMW Freq, HzFreq, HzFreq, HzFreq, Hz 49.9 Hz, 49.9 Hz, 49.9 Hz, 49.9 Hz, minminminmin
MVA MVA MVA MVA MinutesMinutesMinutesMinutes
STAR SMSTAR SMSTAR SMSTAR SM NT NT NT NT SMSMSMSM
T022/2015 14/03/15 Gen 470 49.31 0.11 24.28 0.004140 0
T035/2015 22/06/15 EWIC 524 49.09 7.07 341.57 0.058233 0
T038/2015 07/07/15 Gen 344 49.28 1.45 101.45 0.017297 0
The target for activation of STAR schemes is 16 events or lower for the year. The number of STAR
events each year since 2004 is presented in Figure 4. The average over this period was 2.8 ± 1.6

TTTTrrrraaaannnnssssmmmmiiiissssssssiiiioooonnnn SSSSyyyysssstttteeeemmmm PPPPeeeerrrrffffoooorrrrmmmmaaaannnncccceeee RRRReeeeppppoooorrrrtttt • 2015 Page 20
events per year. System Minutes lost due to activation of the STAR scheme are not attributable to
EirGrid due to STAR being a pre-existing contractual arrangement with the customers.
Figure 4: Number of STAR events 2004 - 2015
4.4.2 Under Voltage Load Shedding
There was no incident of Under Voltage Load Shedding in 2015.
4.4.3 System Minutes Lost
The total System Minutes lost for 2015, attributable to EirGrid, was 0.049.
The System Minutes lost as a result of faults on the Main System was 0.049 in 2015. No System
Minutes were lost due to the disconnection of Normal Tariff load customers during UFLS
disturbances.
The trend of System Minutes lost since 2006 is shown in Figure 5, with incentive target areas and
deadband, as provided by the CER. The average number of System Minutes lost since 2006,
attributable to EirGrid, was 1.22 ± 1.29.
The central target provided up to 20104 was replaced with a deadband in 20115. The deadband is
between 1.5 SM and 3.0 SM, where there is neither penalty nor incentive. EirGrid is rewarded one
fifth of the incentive amount for every 0.1 SM below 1.5 SM, down to 1.0 SM. EirGrid is penalised
one fifth of the incentive amount for every 0.1 SM above 3.0 SM, up to a maximum penalty at
3.5 SM.
4 CER09004: TSO System Performance Incentives (SPIs) for 2009 & 2010 5 CER11128: Decision on 2011/2012 Transmission Incentives
0
1
2
3
4
5
6
7
2004 2005 2006 2007 2008 2009 2010 2011 2012 2013 2014 2015
ST
AR
Ev
en
ts
STAR Events

TTTTrrrraaaannnnssssmmmmiiiissssssssiiiioooonnnn SSSSyyyysssstttteeeemmmm PPPPeeeerrrrffffoooorrrrmmmmaaaannnncccceeee RRRReeeeppppoooorrrrtttt • 2015 Page 21
Figure 5: System Minutes attributable to EirGrid 2006 - 2015
4.4.4 Zone Clearance Ratio
The Zone Clearance Ratio (ZCR) is defined as the ratio of the number of short circuit, system faults,
not cleared in Zone 1 to the total number of short circuit faults per year cleared by Main System
protection. See Appendix A for further definition of Zones and ZCR.
In 2015, the ZCR was 0.023. The ZCR trend since 2004 is shown in Figure 6.
Figure 6: Zone Clearance Ratio 2004 - 2015
0
1
2
3
4
5
6
7
2006 2007 2008 2009 2010 2011 2012 2013 2014 2015
Sy
ste
mM
inu
tes
Bound Area System Minutes Central TargetDeadband
0.00
0.02
0.04
0.06
0.08
0.10
0.12
2004 2005 2006 2007 2008 2009 2010 2011 2012 2013 2014 2015
ZC
R
ZCR - Non Z1 : Total Clearances
(not applicable after 2010)

TTTTrrrraaaannnnssssmmmmiiiissssssssiiiioooonnnn SSSSyyyysssstttteeeemmmm PPPPeeeerrrrffffoooorrrrmmmmaaaannnncccceeee RRRReeeeppppoooorrrrtttt • 2015 Page 22
The number of Zone 1, non-Zone 1 and Zone 2 clearances for each year are presented in Table 10.
There were 45 short circuit faults cleared by protection on the Main System. This figure is made
up of 38 Main System short circuits faults and six Non Main System faults.
Of the 44 short circuit faults cleared by Main System protection, 43 were cleared in Zone 1 and
one was cleared in Zone 2.
Table 10: Number of Zone 1, non-Zone 1 and Zone 2 clearances 2004 - 2015
Clearance 2004 2005 2006 2007 2008 2009 2010 2011 2012 2013 2014 2015
Zone 1 64 45 73 49 57 32 20 28 28 63 109 43
Non Zone 1 7 4 9 5 5 1 2 2 2 5 14 1
Zone 2 7 2 6 5 2 1 2 2 2 4 14 1
The Zone 2 clearance occurred on the Cullenagh - Dungarvan 110 kV line on Tuesday 17 November
2015. The slow clearance was due to failure of permissive teleprotection signals to reach the
protection relays at the Dungarvan end to allow accelerated tripping.
4.4.5 Frequency Control
In 2015 the system frequency was operated between 49.9 Hz to 50.1 Hz for 99.4% of the time.
This figure of 99.4% exceeds the 2015 target of 94%.
4.5 Summary of Important Disturbances
4.5.1 Loss of Load
T57/2015: Carrick on Shannon T57/2015: Carrick on Shannon T57/2015: Carrick on Shannon T57/2015: Carrick on Shannon
At 03:17 hours on Sunday 11 October 2015, the Flagford - Lanesboro 110 kV line tripped, reclosed
and tripped for a fault involving S phase. High resistance developed on S phase as a mid-span
joint began to fail. This developed into an open circuit and subsequently into a single phase to
ground fault (SE) when the conductor came down across an MV line. When the 110 kV conductor
came down across an MV line, this caused the shorting of a pole mounted transformer and the
operation of a fuse which disconnected customers on a 20 kV spur supplied from Carrick on
Shannon. Approximately 0.08 MW of load was disconnected for up to 14 hours 15 minutes.
0.009011 System Minutes were lost to Normal Tariff customers.
T60/2015:T60/2015:T60/2015:T60/2015: Arigna Arigna Arigna Arigna
At 08:14 hours on Friday 16 October 2015, T121 110 kV CB in Arigna was tripped by its under
frequency protection. The cause of the fault was an incorrect protection setting. 3.5 MW of load

TTTTrrrraaaannnnssssmmmmiiiissssssssiiiioooonnnn SSSSyyyysssstttteeeemmmm PPPPeeeerrrrffffoooorrrrmmmmaaaannnncccceeee RRRReeeeppppoooorrrrtttt • 2015 Page 23
fed from Arigna, which is Tee connected between Carrick on Shannon and Corderry, was
disconnected for up to 1 hour 52 minutes. 0.027799 System Minutes were lost to Normal Tariff
customers.
T68/2015: Tullabrack T68/2015: Tullabrack T68/2015: Tullabrack T68/2015: Tullabrack
At 06:10 hours on Friday 13 November 2015, the Moneypoint/Tullabrack 110 kV CB in Booltiagh
tripped for a three phase fault on the Booltiagh - Moneypoint - Tullabrack 110 kV line. The cause
of the fault was lightning. 6.6 MW of load fed from Tullabrack, which is Tee connected between
Booltiagh and Moneypoint, was disconnected for up to 15 minutes. 0.012621 System Minutes were
lost to Normal Tariff customers.
4.5.2 Under Frequency Load Shedding
T22/2015: CCGT TripT22/2015: CCGT TripT22/2015: CCGT TripT22/2015: CCGT Trip
At 16:51 hours on Saturday 14 March 2015, a CCGT tripped from 470 MW. System frequency
dropped from 50.01 Hz to 49.31 Hz at nadir. The frequency recovered to 49.9 Hz within seven
seconds. The STAR scheme was activated during this incident, which resulted in the disconnection
of 12.3 MW of interruptible Industrial Customer load for 1 minute 46 seconds. 0.004140 STAR
System Minutes were lost. The System Minutes lost during this incident relate entirely to
contracted STAR customers.
T35/2015: Interconnector TripT35/2015: Interconnector TripT35/2015: Interconnector TripT35/2015: Interconnector Trip
At 09:56 hours on Monday 22 June 2015, the East West Interconnector tripped from 524 MW
import. A CCGT subsequently tripped from 115 MW. System frequency dropped from 50.02 Hz to
49.09 Hz at its nadir. The frequency recovered to 49.9 Hz in approximately seven minutes. The
STAR scheme was activated during this incident, which resulted in the disconnection of 35.2 MW
of interruptible Industrial Customer load for 8 minutes 44 seconds. 0.058233 STAR System
Minutes were lost. The System Minutes lost during this incident relate entirely to contracted STAR
customers.
T38/2015: CCGT TripT38/2015: CCGT TripT38/2015: CCGT TripT38/2015: CCGT Trip
At 14:52 hours on Tuesday 07 July 2015, a CCGT tripped from 344 MW. System frequency dropped
from 49.98 Hz to 49.28 Hz at nadir. The frequency recovered to 49.9 Hz within two minutes. The
STAR scheme was activated during this incident, which resulted in the disconnection of 29.3 MW
of interruptible Industrial Customer load for 3 minutes 7 seconds. 0.017297 STAR System Minutes
were lost. The System Minutes lost during this incident relate entirely to contracted STAR
customers.

TTTTrrrraaaannnnssssmmmmiiiissssssssiiiioooonnnn SSSSyyyysssstttteeeemmmm PPPPeeeerrrrffffoooorrrrmmmmaaaannnncccceeee RRRReeeeppppoooorrrrtttt • 2015 Page 24
4.6 Transmission System Availability & Outages
4.6.1 Transmission System Availability
When considering transmission system availability, it is the convention to analyse it in terms of
transmission system unavailability. The formula for calculating transmission system unavailability
is given in Appendix 1. Figure 7 shows the percentage Transmission System Unavailability in each
month for 2014 and 2015.
Figure 7: Monthly Variations of System Unavailability 2014 & 2015
4.6.2 Transmission Plant Availability
The measure of plant availability is the kilometre-day for feeders and the MVA-day for
transformers. The availability figures vary between the different categories of plant. The formulae
for calculating transmission plant availability are provided in Appendix 1.
0.0
2.0
4.0
6.0
8.0
10.0
12.0
Jan Feb Mar Apr May Jun Jul Aug Sep Oct Nov Dec
Pe
rce
nta
ge
Un
av
ail
ab
ilit
y
Month
Transmission System Unavailability
2015 2014

TTTTrrrraaaannnnssssmmmmiiiissssssssiiiioooonnnn SSSSyyyysssstttteeeemmmm PPPPeeeerrrrffffoooorrrrmmmmaaaannnncccceeee RRRReeeeppppoooorrrrtttt • 2015 Page 25
Table 11 provides a detailed breakdown of all plant availability figures for 2014 and 2015.
Table 11: Transmission System Plant Availability 2014 & 2015
Plant TypePlant TypePlant TypePlant Type Circuit Length Circuit Length Circuit Length Circuit Length [km][km][km][km]
Number of Number of Number of Number of OutagesOutagesOutagesOutages
Availability (%) Availability (%) Availability (%) Availability (%) 2014201420142014
Availability (%) Availability (%) Availability (%) Availability (%) 2015201520152015
110 kV Circuits 4342 378 92.63 95.17
220 kV Circuits 1927.1 88 95.8 95.01
275 kV Circuits 97 3 95.89 98.18
400 kV Circuits 439 7 97.17 93.58
Plant TypePlant TypePlant TypePlant Type Transformer Transformer Transformer Transformer Capacity [MVA]Capacity [MVA]Capacity [MVA]Capacity [MVA]
Number of Number of Number of Number of OutagesOutagesOutagesOutages
Availability (%) Availability (%) Availability (%) Availability (%) 2014201420142014
Availability (%) Availability (%) Availability (%) Availability (%) 2015201520152015
220 / 110 kV Transformers 8739 130 95.26 92.02
275 / 220 kV Transformers 1200 7 98.7 97.52
400 / 220 kV Transformers 3550 26 92.98 93.73
TotalTotalTotalTotal 6737.3 km 639 95.49
95.03 13489 MVA
In 2015:
• The average plant availability was 94.42%;
• The maximum availability by plant type was 98.18%, which occurred on the 275kV tie lines; and
• The minimum availability by plant type was 92.02%, which occurred on the 220/110kV
transformers.
4.6.3 Cause of Transmission Plant Unavailability
Transmission plant unavailability is classified into the categories outlined in Table 12.
Table 12: Transmission System Plant Unavailability Categories
CategoryCategoryCategoryCategory DescriptionDescriptionDescriptionDescription Forced & Forced & Forced & Forced & FaultFaultFaultFault
Refers to unplanned outages. An item of plant trips or is urgently removed from service. Usually caused by imminent plant failure. There are three types of forced outage: A) Fault & Reclose B) Fault & Forced C) Forced (No Tripping) The above forced outages are explained in detail in Section 6.6.
Safety & Safety & Safety & Safety & SystemSystemSystemSystem SecuritySecuritySecuritySecurity
Safety: Safety: Safety: Safety: Refers to transmission plant outages which are necessary to allow for the safe operation of work to be carried out. System Security: System Security: System Security: System Security: Refers to outages which are necessary to avoid the possibility of cascade tripping or voltage collapse as a result of a single contingency. When a line is out for maintenance it may be necessary to take out additional lines for this reason.
New WorksNew WorksNew WorksNew Works An outage to install new equipment or uprate existing circuits.

TTTTrrrraaaannnnssssmmmmiiiissssssssiiiioooonnnn SSSSyyyysssstttteeeemmmm PPPPeeeerrrrffffoooorrrrmmmmaaaannnncccceeee RRRReeeeppppoooorrrrtttt • 2015 Page 26
CategoryCategoryCategoryCategory DescriptionDescriptionDescriptionDescription Corrective &Corrective &Corrective &Corrective & PreventativePreventativePreventativePreventative MaintenanceMaintenanceMaintenanceMaintenance
Corrective Maintenance: Corrective Maintenance: Corrective Maintenance: Corrective Maintenance: Is carried out to repair damaged plant. Repairs are not as urgent as in the case of a forced outage. Preventative Maintenance: Preventative Maintenance: Preventative Maintenance: Preventative Maintenance: Is carried out in order to prevent equipment degradation which could lead to plant being forced out over time. Includes line inspections, tests and routine replacements.
OthOthOthOther er er er ReasonsReasonsReasonsReasons
A number of other reasons may be attributed to plant unavailability, such as testing, protection testing and third party work.
4.6.4 110 kV Plant Unavailability
Figure 8 provides a breakdown of the causes of unavailability on the 110 kV network in 2015.
The largest contributor to unavailability (63%) on the 110 kV network in 2015 were outages for the
purpose of Corrective and Preventative Maintenance. This type of maintenance includes, amongst
others, Ordinary Services, Condition Assessments, wood-pole replacement/straightening and
general line maintenance. The most significant of these, was the outage of the Tarbert-Tralee 2
110kV Circuit, which lasted 225 days. This was to facilitate maintenance on the associated cubicles
and also to facilitiate the looping in of Kilpaddoge station.
A further 24% of unavailability on the 110 kV network was attributable to the "New Works"
category. This category is for outages to install new equipment or uprate existing circuits. The
most significant of these was the outage of the Arigna tee Carrick on Shannon 110 kV line. The
purpose of this outage was protection upgrades and insulator changes and it lasted for 191 days.
Figure 8: Causes of Unavailability on the 110kV System in 2015
63%
24%
1%
3%
9%
Causes of 110KV Feeder Unavailability
Corrective and Preventive New Works Safety and Security Forced and Fault Others

TTTTrrrraaaannnnssssmmmmiiiissssssssiiiioooonnnn SSSSyyyysssstttteeeemmmm PPPPeeeerrrrffffoooorrrrmmmmaaaannnncccceeee RRRReeeeppppoooorrrrtttt • 2015 Page 27
4.6.5 220 kV Plant Unavailability
Figure 9 provides a breakdown of the causes of unavailability on the 220 kV network in 2015.
The largest contributor to unavailability (47.94%) on the 220 kV network in 2015 were also
outages for the purpose of New Works. The most significant of these was the outage of the
Clashvoon-Tarbert 220kV Line to accommodate the looping in of Ballyvouskill station which lasted
for 148 days.
Approximately 43% of unavailability on the 220 kV network was attributable to Corrective and
Preventative Maintenance. The most significant of these outages was on the Cullenagh-Knockraha
220 kV line which lasted 55 days. The purpose of this was to install new insulators.
Figure 9: Causes of Unavailability on the 220kV System in 2015
4.6.6 275 kV Plant Unavailability
The 275 kV tie-line consists of 48.5 km of 275 kV double circuit between Louth station and
Tandragee station which is situated in County Armagh. In 2015 there were only 3 outages of 275
kV tie-lines, all of which were for corrective and preventative maintenance. The longest of these
was a 10 day outage of Louth - Tandragee 2 (TWO) 275 kV Line to facilitate maintenance.
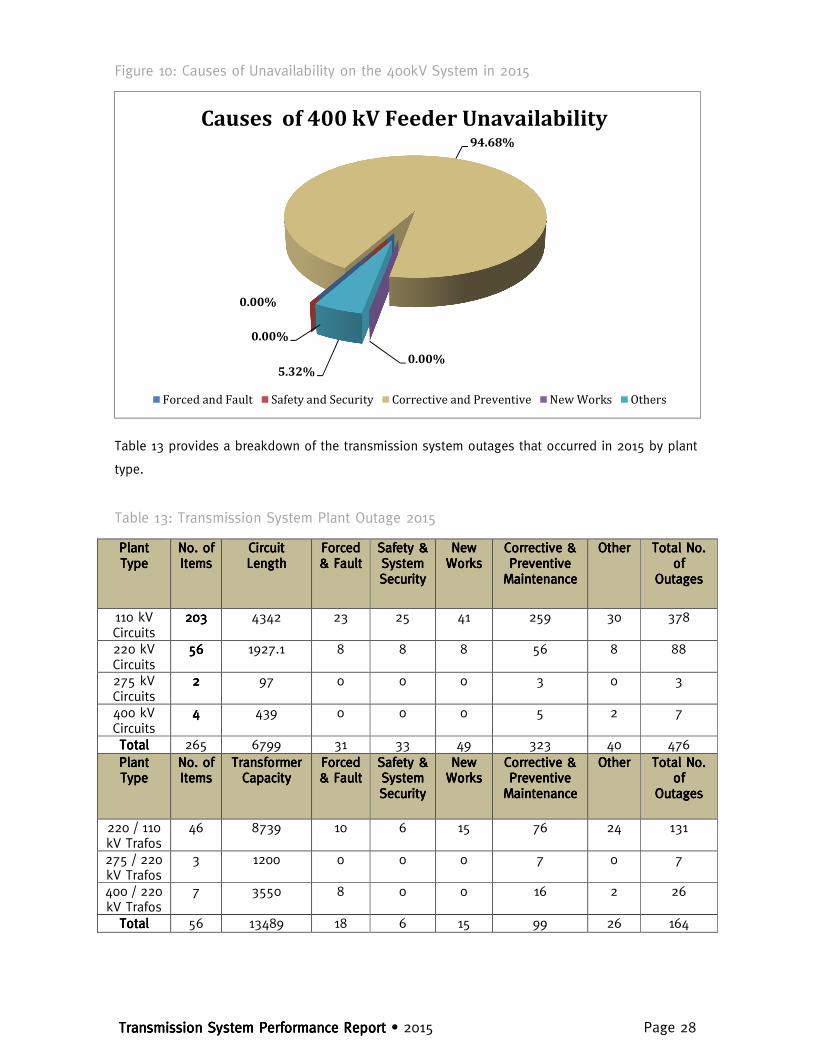
4.6.7 400 kV Plant Unavailability
Figure 10 provides a breakdown of the causes of unavailability on the 400 kV network in 2015.
The largest contributor to unavailability (94.68%) on the 400 kV network in 2015 were corrective
and preventative outages. The most significant of these was a maintenance outage of the
Oldstreet - Woodland 400kV line which as a result remained on forced outage for 20 days.
1.80%
42.80%
7.38%
47.94%
0.08%
Forced and Fault Corrective and Preventive Safety and Security New Works Others
Causes of 220 kV Feeder Unavailability
TTTTrrrraaaannnnssssmmmmiiiissssssssiiiioooonnnn SSSSyyyysssstttteeeemmmm PPPPeeeerrrrffffoooorrrrmmmmaaaannnncccceeee RRRReeeeppppoooorrrrtttt • 2015 Page 28
Figure 10: Causes of Unavailability on the 400kV System in 2015
Table 13 provides a breakdown of the transmission system outages that occurred in 2015 by plant
type.
Table 13: Transmission System Plant Outage 2015
Plant Plant Plant Plant TypeTypeTypeType
No. of No. of No. of No. of ItemsItemsItemsItems
Circuit Circuit Circuit Circuit LengthLengthLengthLength
Forced Forced Forced Forced & Fault& Fault& Fault& Fault
Safety & Safety & Safety & Safety & System System System System SecuritySecuritySecuritySecurity
New New New New WorksWorksWorksWorks
Corrective & Corrective & Corrective & Corrective & Preventive Preventive Preventive Preventive MaintenanceMaintenanceMaintenanceMaintenance
OtherOtherOtherOther Total No. Total No. Total No. Total No. of of of of
OutagesOutagesOutagesOutages
110 kV Circuits
202020203333 4342 23 25 41 259 30 378
220 kV Circuits
56565656 1927.1 8 8 8 56 8 88
275 kV Circuits
2222 97 0 0 0 3 0 3
400 kV Circuits
4444 439 0 0 0 5 2 7
TotalTotalTotalTotal 265 6799 31 33 49 323 40 476
Plant Plant Plant Plant TypeTypeTypeType
No. of No. of No. of No. of ItemsItemsItemsItems
Transformer Transformer Transformer Transformer CapacityCapacityCapacityCapacity
Forced Forced Forced Forced & Fault& Fault& Fault& Fault
Safety & Safety & Safety & Safety & System System System System SecuritySecuritySecuritySecurity
New New New New WorksWorksWorksWorks
Corrective & Corrective & Corrective & Corrective & Preventive Preventive Preventive Preventive MaintenanceMaintenanceMaintenanceMaintenance
OtherOtherOtherOther Total No. Total No. Total No. Total No. of of of of
OutagesOutagesOutagesOutages
220 / 110 kV Trafos
46 8739 10 6 15 76 24 131
275 / 220 kV Trafos
3 1200 0 0 0 7 0 7
400 / 220 kV Trafos
7 3550 8 0 0 16 2 26
TotalTotalTotalTotal 56 13489 18 6 15 99 26 164
0.00%
0.00%
94.68%
0.00%5.32%
Forced and Fault Safety and Security Corrective and Preventive New Works Others
Causes of 400 kV Feeder Unavailability

TTTTrrrraaaannnnssssmmmmiiiissssssssiiiioooonnnn SSSSyyyysssstttteeeemmmm PPPPeeeerrrrffffoooorrrrmmmmaaaannnncccceeee RRRReeeeppppoooorrrrtttt • 2015 Page 29
4.6.8 East West Interconnector Unavailability
Figure 11: Causes of East West Interconnector Unavailability in 2015
In 2015 the availability of the East West Interconnector was 97.55%. Of the outages contributing
to EWIC unavailability, Corrective & Preventative maintenance represented the largest portion
(97%), the longest of which was a four day outage to perform annual maintenance.
4.6.9 Transmission Outage Duration
The duration of transmission outages is useful for assessing transmission system performance.
Transmission outages are broken into eight time classifications ranging from less than 10 minutes
to greater than four weeks. The total number of outages in each time classification is shown in
Figure 12.
3.0%
97.0%
0.0%
Forced and Fault Corrective and Preventive Others
Causes of EWIC Unavailability

TTTTrrrraaaannnnssssmmmmiiiissssssssiiiioooonnnn SSSSyyyysssstttteeeemmmm PPPPeeeerrrrffffoooorrrrmmmmaaaannnncccceeee RRRReeeeppppoooorrrrtttt • 2015 Page 30
Figure 12: Duration of Outages in 2014 & 2015
The two most frequent transmission system outage periods occur between one hour and one day
and between one day and one week. In the category of one hour to one day, outages can be
arranged to avoid peak load times and thereby reduce the impact on the system, while one week
outages for annual maintenance are commonplace during the Outage Season.
4.6.10 Timing of Transmission Outages
Transmission outages are scheduled, where possible, during periods of low load in the
summertime (however, this can be limited by a number of factors such as personnel availability
and shortage of hydro-power support in some areas). The seasonal nature of transmission
outages is apparent in Figure 13 which shows the percentage unavailability of the transmission
system in each month. The March-October period (known as the Outage Season) sees the highest
rates of unavailability during the year, when decreased system load is taken advantage of to carry
out extensive maintenance outages such as the 124 day outage to refurbish the Raffeen-Trabeg 1
(One) 110KV Line and the 150 day outage of the Maynooth-Ryebrook 110KV line.
0
50
100
150
200
250
300
350
400
<= 10 Mins <= 1 Hr <= 1 day <= 1 week <= 2 weeks <= 3 weeks <= 4 weeks > 4 weeks
Nu
mb
er
of
Ou
tag
es
Outage Duration
2015 2014

TTTTrrrraaaannnnssssmmmmiiiissssssssiiiioooonnnn SSSSyyyysssstttteeeemmmm PPPPeeeerrrrffffoooorrrrmmmmaaaannnncccceeee RRRReeeeppppoooorrrrtttt • 2015 Page 31
Figure 13: Percentage unavailability in each month of 2014 & 2015
Figure 14: Average duration of outages 2014 & 2015
0.0
2.0
4.0
6.0
8.0
10.0
12.0
Jan Feb Mar Apr May Jun Jul Aug Sep Oct Nov Dec
Pe
rce
nta
ge
Un
av
ail
ab
ilit
y
Month
Transmission System Unavailability
2015 2014
0
2
4
6
8
10
12
Jan Feb Mar Apr May Jun Jul Aug Sep Oct Nov Dec
Av
era
ge
Du
rati
on
(D
ay
s)
Month
Transmission System Unavailability
2015 2014

TTTTrrrraaaannnnssssmmmmiiiissssssssiiiioooonnnn SSSSyyyysssstttteeeemmmm PPPPeeeerrrrffffoooorrrrmmmmaaaannnncccceeee RRRReeeeppppoooorrrrtttt • 2015 Page 32
4.6.11 Forced Outages
There are two main outage classifications, voluntary outages and forced outages. The majority of
outages are voluntary outages that are scheduled by EirGrid. Forced outages are not scheduled
and cause the most disruption to the transmission system. Due to their disruptive nature, forced
outages merit further analysis. There are three types of forced outages:
Fault & RecloseFault & RecloseFault & RecloseFault & Reclose This type of outage occurs when a fault is detected by the protection equipment; the transmission
plant is disconnected and successfully reconnected immediately, thus re-energising the circuit.
These represent temporary faults, which, in general, do not cause major disruption to the system
or customer. Lightning is a typical cause of this type of outage.
FFFFaultaultaultault & Forced& Forced& Forced& Forced This occurs when an item of plant is tripped by protection and does not return to service within
ten minutes. This typically signifies plant damage, which requires maintenance.
Forced (No Tripping)Forced (No Tripping)Forced (No Tripping)Forced (No Tripping) This type of outage occurs when an item of plant is not tripped by protection, but is removed
from the system urgently (i.e. there is no opportunity for scheduling). This may be necessary to
avoid imminent failure or danger to plant and/or personnel. A typical cause of this outage would
be the discovery of a fault during a maintenance inspection which is deemed to be sufficiently
severe as to warrant the removal of the plant from service until the plant can be repaired or
replaced.
4.6.12 Forced Outages per km
The measure used for analysing the forced outages of lines and cables is the number of forced
outages per kilometre of feeder. This is shown in Figure 15; fault & reclose forced outages are
excluded due to their relatively low level of disruption.

TTTTrrrraaaannnnssssmmmmiiiissssssssiiiioooonnnn SSSSyyyysssstttteeeemmmm PPPPeeeerrrrffffoooorrrrmmmmaaaannnncccceeee RRRReeeeppppoooorrrrtttt • 2015 Page 33
Figure 15: Nature of Feeder Forced Outages 2014 & 2015
4.6.13 Forced Outages per MVA
The measure used for analysing the forced outages of transformers is the number of forced
outages per MVA capacity, which can be seen in Figure 16.
There was an overall increase in forced outages per MVA for 2015. There were no major forced
outage incidents in 2015. The increase is down to an increase in alarms, mainly low SF6 and low
CB pressure.
Figure 16: Nature of Transformer Forced Outages 2014 & 2015
0
0.001
0.002
0.003
0.004
0.005
0.006
0.007
2015
2014
110kV Feeders 220kV Feeders 400kV Feeders
Fault &
Forced
Forced (no
tripping)
Fault &
ForcedForced (no
tripping)
Fault &
Forced
Forced (no
tripping)
Fo
rc
ed
Ou
tag
es
pe
r
0
0.0005
0.001
0.0015
0.002
0.0025
0.003
0.0035
0.004
2015
2014
220/110 kV Transformers 275/220 kV Transformers 400/220 kV Transformers
Fault &
ForcedFault &
Forced
Fault &
Forced
Forced (no
tripping)
Forced (no
tripping)Forced (no
tripping)
Fo
rc
ed
Ou
tag
e p
er
MV
A
TTTTrrrraaaannnnssssmmmmiiiissssssssiiiioooonnnn SSSSyyyysssstttteeeemmmm PPPPeeeerrrrffffoooorrrrmmmmaaaannnncccceeee RRRReeeeppppoooorrrrtttt • 2015 Page 34
5. SONI Transmission System
Performance This section details the performance of the transmission system in Northern Ireland, unless
explicitly stated otherwise. This data has been prepared by SONI in accordance with Condition 20
of the ‘Licence to participate in the Transmission of Electricity’.
5.1 Summary
SONI is responsible for the safe, secure, efficient and reliable operation of the Northern Ireland
transmission network. The transmission network is operated at 275 kV and 110 kV and is made
up of approximately 150 circuits covering a total length of approximately 2130 km. The primary
purpose of the transmission system is to transport power from generators and interconnectors to
bulk supply points which connect the transmission system to the distribution system.
Availability is a key measure of power system performance. In this report availability refers to the
proportion of time a transmission circuit or interconnector was available.
The annual system availability for 2015 was 96.83 %. In 2015 the transmission system was
significantly reconfigured at Tamnamore. The planned outages for the works at Tamnamore as
well as the busbar refurbishment work at a number of substations led to a reduced system
availability.
The annual availability of the Moyle Interconnector for 2015 was 49.62 %; although the
interconnector has an installed capacity of 500 MW, its capacity has been limited to 250 MW since
2012 due to a cable fault. As of the 26 January 2016, Mutual Energy completed a project that
restored the interconnector to its full availability, with an import limit of 450 MW and an export
limit of 280 MW. An increase in availability of the Moyle Interconnector can be expected in 2016.
In terms of the connections between Northern Ireland and Ireland the North-South 275 kV tie line
had an availability of 98% in 2015. The two 110 kV tie lines had an annual availability of 100 %.
The Electricity Safety, Quality and Continuity Regulations (Northern Ireland) 2012 set out the
statutory obligations in relation to managing both frequency and voltage for Northern Ireland.
Under the regulation SONI are required to report incidents which have caused interruptions to
supplies to customers to the transmission asset owner, NIE Networks. Part 8, paragraph 33 of the
regulation contains details of the requirements for the reporting of incidents.
In 2015, there were two transmission incidents leading to customers being off supply. These were;

TTTTrrrraaaannnnssssmmmmiiiissssssssiiiioooonnnn SSSSyyyysssstttteeeemmmm PPPPeeeerrrrffffoooorrrrmmmmaaaannnncccceeee RRRReeeeppppoooorrrrtttt • 2015 Page 35
• On the 30 April 2015 at 13:55, an incident at Castlereagh 275 kV substation resulted in the
loss of supply to 204,680 customers. The system minutes lost for this event was 2.519.
• On the 23 June 2015, an incident at Ballymena 110 kV substation resulted in the loss of
supply to 26,172 customers. The system minutes lost for this event was 0.087.
Quality of service is measured by the number of voltage and frequency excursions which fall
outside statutory limits. There were no voltage excursions in 2015 outside the statutory limits.
The nominal frequency of the all-island transmission system is 50 Hz, and is normally controlled
within the range of 49.95 Hz and 50.05 Hz. SONI are required to report on system faults where
the frequency drops below 49.8 Hz or above 50.2 Hz. In 2015, there were 54 system events
where the frequency exceeded these limits.
The reporting of frequency excursions is carried out in accordance with the definitions and
principles of the National Fault and Interruption Reporting Scheme (NAFIRS), (Engineering
Recommendation G43/2). The effects of national / regional emergencies and disputes are
excluded.
5.2 Transmission System Availability
Transmission system availability is the proportion of time a transmission circuit was available
during the calendar year. A circuit is defined as the overhead line, cable, transformer or any
combination of these that connects two busbars together or connects the transmission system to
another system. Transmission system availability is reduced when a circuit is taken out of service,
either for planned or unplanned purposes.
Planned outages are necessary to facilitate new user connections, network development and
maintenance of network assets necessary to deliver acceptable levels of system security and
reliability. These are outages planned with at least seven days’ notice.
Unplanned outages can be a result of equipment failure or a fault caused by adverse weather etc.
These are outages required immediately or planned with at less than seven days’ notice.
System Availability is calculated using the formula:
Equation 1: System Availability Formula
SytemAvailability(%) =∑Hourseachcircuitisavailable
(No. ofCircuits) ∗ (TotalNo. HoursinPeriod)
In 2015, the analysis of the transmission system availability data has produced the following
results:

TTTTrrrraaaannnnssssmmmmiiiissssssssiiiioooonnnn SSSSyyyysssstttteeeemmmm PPPPeeeerrrrffffoooorrrrmmmmaaaannnncccceeee RRRReeeeppppoooorrrrtttt • 2015 Page 36
• The average availability of the Northern Ireland transmission system was in 2015 was
96.83%,
• The average winter system availability (for the winter months January, February, November
and December 2015) was 98.49%.
Figure 17 below shows the month by month variation in system availability of the transmission
network in Northern Ireland.
Figure 17: Transmission System Availability 2015
Overall, the availability of the system is high, particularly over the winter months where
maintenance is avoided due to the higher electrical demand and potential adverse weather
conditions. The preference is for maintenance to take place over the summer months when
network loading is generally lower to mitigate the risk of affecting the supply to customers.
92%
93%
94%
95%
96%
97%
98%
99%
100%
Jan Feb Mar Apr May Jun Jul Aug Sep Oct Nov Dec
% A
va
ila
bil
ity
Month
System Availability 2015

TTTTrrrraaaannnnssssmmmmiiiissssssssiiiioooonnnn SSSSyyyysssstttteeeemmmm PPPPeeeerrrrffffoooorrrrmmmmaaaannnncccceeee RRRReeeeppppoooorrrrtttt • 2015 Page 37
5.2.1 System Unavailability
Figure 18 below shows the month by month variation in planned and unplanned system
unavailability.
Figure 18: Transmission System Unavailability 2015
The majority of outages occurred during the spring/summer months. This reflects the policy of
planning outages during periods of lower electrical demand.
5.2.2 System Historic Availability Performance
Figure 19 shows the historic variation in system availability from 1999 to 2015 for the transmission
network in Northern Ireland.
Figure 19: Historic System Availability 1998-2015
Prior to 2012, SONI calculated system availability in line with the company’s financial year. This
practice ended in 2012, in line with the practice in Eirgrid.
0%
1%
2%
3%
4%
5%
6%
Jan Feb Mar Apr May Jun Jul Aug Sep Oct Nov Dec
Sy
ste
m U
na
va
ila
bil
ity
%
Month
System Unavailability 2015
% Planned
% Unplanned
95%
96%
96%
97%
97%
98%
98%
99%
20
05
/2
00
6
20
06
/2
00
7
20
07
/2
00
8
20
08
/2
00
9
20
09
/2
01
0
20
10
/2
01
1
20
12
20
13
20
14
20
15
Sy
ste
m
Av
ail
ab
ilit
y %
Year
Historic System Availability

TTTTrrrraaaannnnssssmmmmiiiissssssssiiiioooonnnn SSSSyyyysssstttteeeemmmm PPPPeeeerrrrffffoooorrrrmmmmaaaannnncccceeee RRRReeeeppppoooorrrrtttt • 2015 Page 38
5.2.3 System Historic Unavailability Performance
Figure 20 below shows the breakdown of the system unavailability from 1999/2000 to 2015.
Figure 20: Historic System Unavailability 2005-2015
The 2015 average figure for system unavailability is higher compared to other years. 2015 saw an
increase in the amount of work the NIE Networks carried out in new projects and maintenance
work on the transmission network. Examples of this include;
• Tamnamore 110 kV Project
• 110 kV Substation Refurbishment works (Castlereagh, Kells, Tandragee 110 kV Substations)
5.3 Interconnector and Tie-Line Availability
5.3.1 Moyle Interconnector
The Moyle interconnector, owned by Mutual Energy, connects the power systems of Northern
Ireland and Scotland. The interconnector is a High Voltage Direct Current (HVDC) system;
consisting of two submarine power cables and two HVDC-AC converter stations; one located at
Islandmagee in Northern Ireland and the other at Auchencrosh in Scotland. The system has an
import capacity of 450 MW and an export capacity of 280 MW. The interconnector is operated by
SONI, and the performance of this link falls under the scope of this report.
In 2012, a cable fault occurred limiting the capacity of the interconnector to 250 MW. The asset
owner, Mutual Energy, have been exploring the options available to them for restoring the
interconnector to full capacity. A project is in place in the early part of 2016 to restore the
interconnector to full capacity.
0.00%
0.50%
1.00%
1.50%
2.00%
2.50%
3.00%
3.50%
20
05
/2
00
6
20
06
/2
00
7
20
07
/2
00
8
20
08
/2
00
9
20
09
/2
01
0
20
10
/2
01
1
20
12
20
13
20
14
20
15
% S
ys
tem
Un
av
ail
ab
ilit
y
Year
Historical System Unavailability
% Planned
% Unplanned

TTTTrrrraaaannnnssssmmmmiiiissssssssiiiioooonnnn SSSSyyyysssstttteeeemmmm PPPPeeeerrrrffffoooorrrrmmmmaaaannnncccceeee RRRReeeeppppoooorrrrtttt • 2015 Page 39
5.3.2 Moyle Interconnector Historic Availability
The Annual Availability of the Moyle Interconnector for 2015 was 49.62%.
Figure 21: Historic Moyle Interconnector Availability 2002/03 - 2015
5.3.3 Moyle Interconnector Historic Unavailability
The 2015 Annual Unavailability of the Moyle Interconnector was 50.38%.
Figure 22: Historic Moyle Interconnector Unavailability 2005-2015
0%
20%
40%
60%
80%
100%
20
05
/2
00
6
20
06
/2
00
7
20
07
/2
00
8
20
08
/2
00
9
20
09
/2
01
0
20
10
/2
01
1
20
12
20
13
20
14
20
15
% A
va
ila
bil
ity
Year
Historic Moyle Availability
0%
10%
20%
30%
40%
50%
60%2
00
5/
20
06
20
06
/2
00
7
20
07
/2
00
8
20
08
/2
00
9
20
09
/2
01
0
20
10
/2
01
1
20
12
20
13
20
14
20
15
% U
na
va
ila
bil
ity
Year
Historic Moyle Unavailability
% Planned
% Unplanned

TTTTrrrraaaannnnssssmmmmiiiissssssssiiiioooonnnn SSSSyyyysssstttteeeemmmm PPPPeeeerrrrffffoooorrrrmmmmaaaannnncccceeee RRRReeeeppppoooorrrrtttt • 2015 Page 40
5.3.4 Moyle Interconnector Monthly Unavailability
Figure 23 below shows the month by month variation of unavailability of the interconnector.
Figure 23: Moyle Interconnector Unavailability 2015
Outages were required by the asset owner in the latter months of the year as part of a project to
return the interconnector to full capacity. The asset owner, Mutual Energy, completed a project to
install new low voltage submarine cables in parallel with the existing cables. These LV cables form
key components in the make-up of the HVDC system.
5.3.5 275 kV Tie Line
The Northern Ireland transmission system is connected to the transmission system in Ireland by
means of one 275 kV double circuit connection from Tandragee 275 kV substation in Co. Armagh
to Louth 220 kV substation in Co. Louth.
These connections between Ireland and Northern Ireland are referred to as ‘Tie Lines’.
The 275 kV double circuit tie line is used as the method for synchronising the Northern Ireland
and Ireland power systems together. Energy can flow freely between both jurisdictions, depending
on the operating requirements and generating plant being utilised on the all island power system.
The annual availability of the 275kV North-South Tie Line in 2015 was 98.09%.
0%
10%
20%
30%
40%
50%
60%
Jan Feb Mar Apr May Jun Jul Aug Sep Oct Nov Dec
% U
na
va
ila
bil
ity
Month
Moyle Unavailability 2015
% Planned % Unplanned
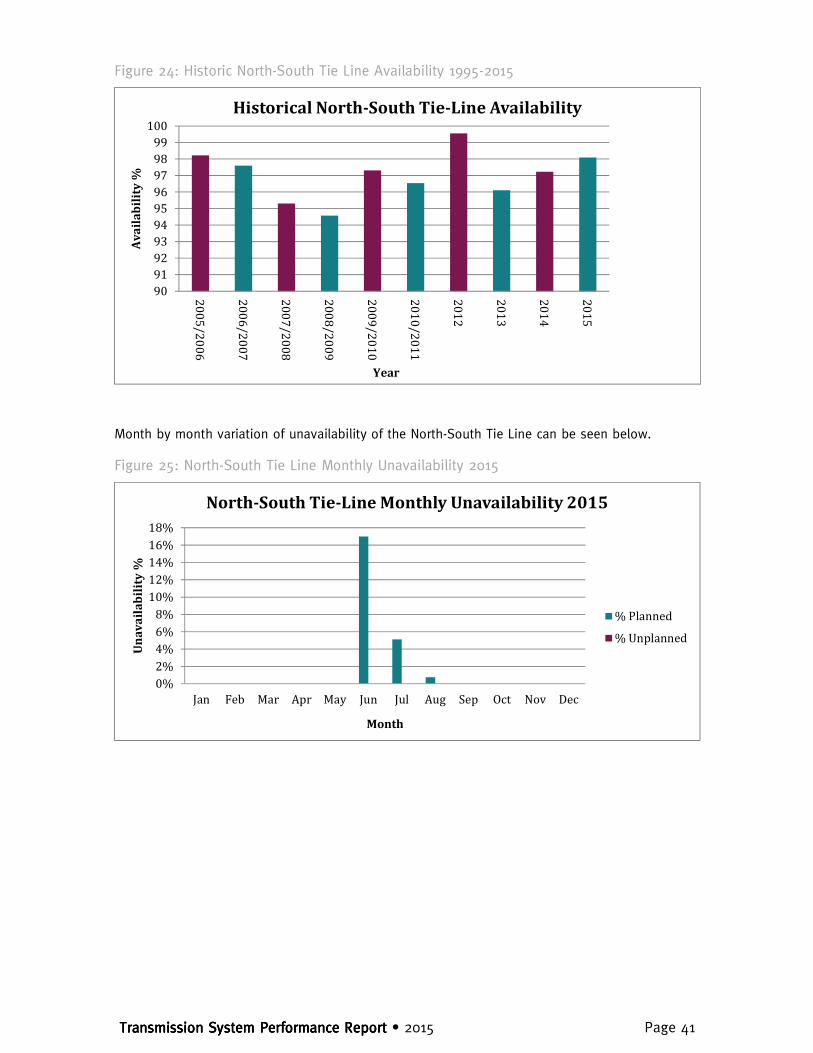
TTTTrrrraaaannnnssssmmmmiiiissssssssiiiioooonnnn SSSSyyyysssstttteeeemmmm PPPPeeeerrrrffffoooorrrrmmmmaaaannnncccceeee RRRReeeeppppoooorrrrtttt • 2015 Page 41
Figure 24: Historic North-South Tie Line Availability 1995-2015
Month by month variation of unavailability of the North-South Tie Line can be seen below.
Figure 25: North-South Tie Line Monthly Unavailability 2015
90
91
92
93
94
95
96
97
98
99
100
20
05
/2
00
6
20
06
/2
00
7
20
07
/2
00
8
20
08
/2
00
9
20
09
/2
01
0
20
10
/2
01
1
20
12
20
13
20
14
20
15
Av
ail
ab
ilit
y %
Year
Historical North-South Tie-Line Availability
0%
2%
4%
6%
8%
10%
12%
14%
16%
18%
Jan Feb Mar Apr May Jun Jul Aug Sep Oct Nov Dec
Un
av
ail
ab
ilit
y %
Month
North-South Tie-Line Monthly Unavailability 2015
% Planned
% Unplanned

TTTTrrrraaaannnnssssmmmmiiiissssssssiiiioooonnnn SSSSyyyysssstttteeeemmmm PPPPeeeerrrrffffoooorrrrmmmmaaaannnncccceeee RRRReeeeppppoooorrrrtttt • 2015 Page 42
5.3.6 110 kV Tie Lines
There are two 110 kV connections between Ireland and Northern Ireland;
• Strabane – Letterkenny 110 kV circuit
• Enniskillen – Corraclassy 110 kV circuit
These 110 kV tie lines provide an AC connection between the two transmission systems, which
allows emergency flows of active and reactive power for frequency and voltage support, increasing
system stability.
Phase Shifting Transformers (PST), designed for energy to flow in two directions, are installed at
Strabane and Enniskillen and control the flow of energy between Ireland and Northern Ireland.
These PST’s are rated at 125 MW each and are, in normal operation, operated to maintain a 0 MW
flow between both jurisdictions. To negate any potential system abnormalities as a result of
transmission outages, either scheduled or unplanned, a flow can be manually allowed that can
support system operation in both jurisdictions.
Also, in times of high wind, the Strabane-Letterkenny tie line is used to import excess wind energy
being produced.
The availability of the 110 kV Tie Lines was 100 % for 2015. Maintenance carried out in 2014
contributed to this level of availability.
Figure 26: North-South Tie Line Unavailability 1995-2015
88
90
92
94
96
98
100
05/06 06/07 07/08 08/09 09/10 10/11 2012 2013 2014 2015
Av
ail
ab
ilit
y %
Year
110kV Tie-Line Total Availability 1999 - 2015

TTTTrrrraaaannnnssssmmmmiiiissssssssiiiioooonnnn SSSSyyyysssstttteeeemmmm PPPPeeeerrrrffffoooorrrrmmmmaaaannnncccceeee RRRReeeeppppoooorrrrtttt • 2015 Page 43
A breakdown of 110 kV tie line unavailability is shown in Figure 27 below.
Figure 27: Historic 110kV Tie Line Availability 1999-2015
5.4 Transmission System Security
An incident is a system event that results in loss of supply. This section incidents resulting from
issues on the Northern Ireland Transmission system are described individually. The following
sections detail the nature, location and duration of the incidents with an estimate of energy
unsupplied.
5.4.1 Incidents for 2015
The criterion for the reporting of incidents is specified in Part 8, paragraph 33, of ’The Electricity
Safety, Quality and Continuity Regulations (Northern Ireland) 2012’. An incident shall be reported
if there has been:
• any single interruption of supply, to any demand of 20 megawatts or more at the time of
the interruption, for a period of three minutes or longer; or
• any single interruption of supply, to any demand of 5 megawatts or more at the time of
the interruption, for a period of one hour or longer; or
• any single interruption of supply to 5,000 or more consumer’s installations for a period of
one hour or longer.
5.4.2 Number of Incidents and Estimated Unsupplied Energy
There were two system events in Northern Ireland that resulted in the loss of supply to customers.
0
1
2
3
4
5
6
7
8
20
05
/20
06
20
06
/20
07
20
07
/20
08
20
08
/20
09
20
09
/20
1
20
10
/20
11
20
12
20
13
20
14
20
15
Un
av
ail
ab
ilit
y %
Year
110 kV Tie-Lines Unavailability 2005 - 2015
% Planned
% Unplanned

TTTTrrrraaaannnnssssmmmmiiiissssssssiiiioooonnnn SSSSyyyysssstttteeeemmmm PPPPeeeerrrrffffoooorrrrmmmmaaaannnncccceeee RRRReeeeppppoooorrrrtttt • 2015 Page 44
On the 30th of April 2015, an event occurred at Castlereagh 110 kV substation that resulted in the
loss of 204,860 customers, equating to a total loss of 217 MW. All customers were fully restored
within 28 minutes of the event happening,
On the 23rd of June 2015, a system event occurred at Ballymena Main substation that resulted in
the loss of 26,172 customers, equating to a total loss of 26 MW. All customers were fully restored
within 6 minutes of the event happening.
5.4.3 Incident Analysis
Figure 28 details the incidents that have occurred historically in Northern Ireland.
Figure 28: Historic System Security 1995-2015
5.4.4 Unsupplied Energy
Figure 29 below shows the historic amount of unsupplied energy to Northern Ireland customers.
Figure 29: Historic Unsupplied Energy 2005-2015
0
40
80
120
160
200
0
1
2
3
4
5
20
05
/0
6
20
06
/0
7
20
07
/0
8
20
08
/0
9
20
09
/1
0
20
10
/1
1
20
12
20
13
20
14
20
15
Av
era
ge i
ncid
en
t d
ura
tio
n (
min
s)
Nu
mb
er
of
Inc
ide
nts
System Security - Incident Analysis 2005 - 2015
Incidents Average Incident Duration (mins)
0
200
400
600
800
1000
1200
20
05
/0
6
20
06
/0
7
20
07
/0
8
20
08
/0
9
20
09
/1
0
20
10
/1
1
20
12
20
13
20
14
20
15
Un
su
pp
lie
d E
ne
rg
y (
MW
h)
Year
Unsupplied Energy 2005 - 2015
Unsupplied Energy (MWh)

TTTTrrrraaaannnnssssmmmmiiiissssssssiiiioooonnnn SSSSyyyysssstttteeeemmmm PPPPeeeerrrrffffoooorrrrmmmmaaaannnncccceeee RRRReeeeppppoooorrrrtttt • 2015 Page 45
5.5 Quality of Service
Quality of service is measured with reference to system voltage and frequency.
5.5.1 Voltage
The Electricity Safety, Quality and Continuity Regulations (Northern Ireland) 2012 details the
requirements for the management of voltage in Northern Ireland.
Part 7, paragraph 28 permit variations not exceeding 10 % for operating voltages of 110 kV or
higher. As well as adhering to legislation, SONI also operate the transmission system in such a
way as to comply with the Operating Security Standards6, acceptable step changes in voltages are
detailed in Table 14.
Table 14: Voltage step change limits in operational timescales
Transmission System secured events or Transmission System secured events or Transmission System secured events or Transmission System secured events or
switching eventswitching eventswitching eventswitching event
Voltage fallVoltage fallVoltage fallVoltage fall Voltage riseVoltage riseVoltage riseVoltage rise
Following loss of single circuit -6% +6%
Following loss of double circuit overhead line -10% +6%
5.5.2 Voltage Excursions
There were no voltage excursions exceeding these limits in 2015.
5.5.3 Frequency
SONI are required to manage the frequency of the power system. Power system frequency is a
measure of balance between the electrical demand on the network and the amount of energy
being generated. The Electricity Safety, Quality and Continuity Regulations (Northern Ireland) 2012
details the requirements for the management of Frequency in Northern Ireland.
Part 7, paragraph 28 of the regulations permits a frequency variation of up to 0.5 HZ above or
below 50 Hz. In line with previous publications this report contains details of frequency events
where the frequency has dropped below 49.6 Hz or greater than 50.5 Hz. There were 14
reportable frequency excursions in Northern Ireland in 2015. Graphs in Appendix 2 contain traces
of system frequency as well as raw and averaged rate of change of frequency data.
6 SONI Operating Security Standards

TransmissTransmissTransmissTransmission System Performance Reportion System Performance Reportion System Performance Reportion System Performance Report • 2015 Page 46
5.5.4 Frequency Excursions
Table 15: Frequency Excursions in NI in 2015
Cause of Cause of Cause of Cause of IncidentIncidentIncidentIncident
DateDateDateDate Time (UTC)Time (UTC)Time (UTC)Time (UTC) MW LostMW LostMW LostMW Lost PrePrePrePre----incincincincident ident ident ident
FreqFreqFreqFrequency (Hz)uency (Hz)uency (Hz)uency (Hz) Nadir (Hz)Nadir (Hz)Nadir (Hz)Nadir (Hz)
Min Min Min Min Frequency Frequency Frequency Frequency POR (Hz)POR (Hz)POR (Hz)POR (Hz)
Rate of Change of FrequencyRate of Change of FrequencyRate of Change of FrequencyRate of Change of Frequency tttt<49.<49.<49.<49.6 Hz 6 Hz 6 Hz 6 Hz secondssecondssecondsseconds
tttt<49.5<49.5<49.5<49.5 Hz Hz Hz Hz
secondssecondssecondsseconds
NNNN----S Tie S Tie S Tie S Tie Line FlowLine FlowLine FlowLine Flow
MWMWMWMW Max df/dt Max df/dt Max df/dt Max df/dt Hz/SecHz/SecHz/SecHz/Sec
Average Average Average Average df/dt Hz/Secdf/dt Hz/Secdf/dt Hz/Secdf/dt Hz/Sec
EWIC & B21EWIC & B21EWIC & B21EWIC & B21 22/06/2015 08:56:26 524+113 50.010 49.086 49.086 -0.65 -0.31 111.9 52.7 -151
Great Island 4Great Island 4Great Island 4Great Island 4 07/07/2015 13:52:43 344 49.963 49.276 49.305 -0.46 -0.3 9.1 7.2 -42
Great Island 4Great Island 4Great Island 4Great Island 4 14/03/2015 16:51:30 470 49.997 49.306 49.391 -0.41 -0.35 6.4 5.1 -230
Great Island 4Great Island 4Great Island 4Great Island 4 06/01/2015 17:21:49 472 49.990 49.378 49.410 -0.42 -0.32 6.9 5.1 -142
Great Island 4Great Island 4Great Island 4Great Island 4 31/08/2015 17:17:51 420 50.033 49.419 49.480 -0.38 -0.31 5.5 3.8 16
Great Island 4Great Island 4Great Island 4Great Island 4 10/02/2015 15:44:10 404 50.008 49.477 49.504 -0.34 -0.24 5.2 2.2 -77
Huntstown 2Huntstown 2Huntstown 2Huntstown 2 27/07/2015 08:31:18 320 49.950 49.482 49.582 -0.34 -0.22 4.2 1.7 -165
Great Island 4Great Island 4Great Island 4Great Island 4 31/03/2015 15:10:29 420 50.092 49.493 49.791 -0.39 -0.32 2.8 0.5 0
Great Island 4Great Island 4Great Island 4Great Island 4 04/03/2015 10:19:42 328 50.004 49.55 49.624 -0.28 -0.21 3.2 0 164
Great Island 4Great Island 4Great Island 4Great Island 4 18/03/2015 12:47:56 470 50.086 49.558 49.717 -0.38 -0.26 2.4 0 -3
Dublin BayDublin BayDublin BayDublin Bay 22/01/2015 15:41:57 380 50.018 49.563 49.648 -0.3 -0.21 2.6 0 2
EWICEWICEWICEWIC 20/06/2015 12:55:47 290 49.985 49.563 49.605 -0.29 -0.18 2.9 0 -63
Great Island 4Great Island 4Great Island 4Great Island 4 13/03/2015 20:30:53 477 50.117 49.581 49.780 -0.39 -0.27 1.5 0 -82
MoyleMoyleMoyleMoyle 07/08/2015 10:41:39 220 49.976 49.598 49.661 -0.38 -0.2 0.3 0 11
Note NS and Interconnection flows, +VE represents an import to Northern Ireland
DefinitionsDefinitionsDefinitionsDefinitions
Time 0 seconds Considered to be when the frequency falls through 49.8 Hz
Pre Incident frequency Average system frequency between t – 60 seconds and t -30 seconds
Nadir (Hz) Minimum system frequency from t 0 to t + 6 minutes
Minimum Frequency POR (Hz) Minimum frequency during POR period from t + 5 seconds to t + 15 seconds
Max df/dt Hz/Sec Maximum negative rate of change of frequency during the period t – 5 seconds to t + 30 seconds. (This is calculated from a five point moving average with a sample rate of 100 milliseconds) Measured at Kilroot Power Station
Average df/dt Hz/Sec This is the rate of change of frequency observed between two points in time. The first point being when the frequency passes through 49.8 Hz and the second when the frequency nadir is observed between t + 5 seconds and t + 15 seconds Measured at Kilroot Power Station

TTTTrrrraaaannnnssssmmmmiiiissssssssiiiioooonnnn SSSSyyyysssstttteeeemmmm PPPPeeeerrrrffffoooorrrrmmmmaaaannnncccceeee RRRReeeeppppoooorrrrtttt • 2015 Page 47
5.5.5 Historical Frequency Excursions
Figure 30: Historic Frequency Excursions 2012-2015
0
2
4
6
8
10
12
14
16
18
2012 2013 2014 2015
Nu
mb
er
of
Ev
en
ts
Year
Frequency Excursions 2012 - 2015
Frequency Event > 49.5 and ≤ 49.6 Hz Frequency Event < 49.5 Hz

TTTTrrrraaaannnnssssmmmmiiiissssssssiiiioooonnnn SSSSyyyysssstttteeeemmmm PPPPeeeerrrrffffoooorrrrmmmmaaaannnncccceeee RRRReeeeppppoooorrrrtttt • 2015 Page 48
Appendix 1 Glossary
Disturbance
A system disturbance is defined as one or more related faults and their consequences which occur
either simultaneously or over a period of time. These incidents are grouped in a single system
disturbance report under the highest voltage involved.
Fault
Any abnormal event causing or requiring the tripping of a Main System circuit breaker
automatically within the Main System. Any abnormal event causing or requiring the closing of a
Main System circuit breaker automatically within the Main System. Any abnormal event causing or
requiring the tripping of an MV circuit breaker automatically by under frequency relay operation.
Major incident
A major incident is one which results in the loss of greater than or equal to one System Minute
for the entire incident.
Main System
The Main Transmission System includes: the 400 kV, 220 kV and 110 kV overhead line (OHL) and
underground cable (UGC) network; the 400 kV, 220 kV and 110 kV busbars and couplers, the
400/220 kV and 220/110 kV coupling transformers (with the exception of those feeding the Dublin
City 110 kV network). It also includes the 275 kV ESB/NIE interconnector and associated
275/220 kV transformers. The Main Transmission System does not include the Dublin City 110 kV
network or the 220/110 kV coupling transformers at Carrickmines, Inchicore and Poolbeg. The HV
circuit breakers of tail connected lines and directly connected transformers (ESB DSO load
transformers, directly connected industrial customer load transformers and generator transformers)
are part of the Main Transmission System thus faults on these lines and transformers, which cause
Transmission System circuit breakers to be tripped, are reported.
MVA Minute Lost
Amount of Power (Mega Volt-Amp) not supplied during an interruption of one minute.
Non Main System/Outside the Main System
All HV plant on the Irish electricity network that does not form part of the Main System: The
Dublin 110 kV network which is controlled by the DCC (the MV system in Ireland is controlled by
the ESB SDCC in Wilton and the NDCC in Leopardstown), all DSO and Industrial Customer load
transformers, all IPP generator transformers, and all plant on the NIE owned, SONI controlled, HV
system in Northern Ireland.

TTTTrrrraaaannnnssssmmmmiiiissssssssiiiioooonnnn SSSSyyyysssstttteeeemmmm PPPPeeeerrrrffffoooorrrrmmmmaaaannnncccceeee RRRReeeeppppoooorrrrtttt • 2015 Page 49
Non System Fault
Any unplanned circuit breaker operation resulting from a cause other than a system fault or
incorrect manual operation from a control point.
Permanent Fault
A fault is permanent if the component or unit is damaged and cannot be restored to service until
repair or replacement is completed. An overhead line trips and stays out of service due to the
absence or outage of reclosing facilities; the fault is permanent if maintenance staff have to carry
out equipment repairs or replacement before the line is returned to service. A protection setting
change is required on the piece of plant before or after it is switched in following a fault.
Protection - Correct Operation
The operation is correct if a fault is cleared by the protection (in any time step) such that the
correct circuit breakers open and no other circuit breaker opens.
Protection - Incorrect Operation
The operation is incorrect if, while a fault is being cleared, a circuit breaker is opened which
should not have opened or a circuit breaker remains closed which should have opened.
STAR Scheme
Short Term Active Response is a scheme operated by EirGrid whereby large electricity consumers
voluntarily contract to make their load available for short term interruptions. This service provides
EirGrid with approximately 45 MW of static reserve that is utilised in the event of system
frequency falling below 49.3 Hz.
Sustained Interruption
A sustained interruption is one which lasts for more than one minute. For example, if a fault
causes a supply interruption to demand customers and supply is not restored by reclosing the
affected circuit breaker or by MV back feeding within one minute then this is classified as a
sustained interruption. If supply is restored in less than one minute this is a non sustained
interruption.
System Fault
Any fault or system abnormality which involves, or is the result of failure of primary electrical
apparatus and which requires the disconnection of the affected equipment from the system by the
automatic tripping of the associated circuit breaker.

TTTTrrrraaaannnnssssmmmmiiiissssssssiiiioooonnnn SSSSyyyysssstttteeeemmmm PPPPeeeerrrrffffoooorrrrmmmmaaaannnncccceeee RRRReeeeppppoooorrrrtttt • 2015 Page 50
System Minute
A measure of the energy not supplied for a disturbance. The metric takes account of the load lost
(MW), duration of disconnection (Minutes) and peak system demand (MW), to allow for historical
comparison. For example, if 300 MW were lost for 10 minutes and the system peak was 3000 MW,
this would represent one System Minute.
System Minutes = (Load MW x Duration mins) / (System Peak MW) = (300 x 10) / 3000 = 1
Transient Fault
A fault is transient if the unit or component is undamaged and is restored to service through
manual switching operations, or rapid automatic reclosure on overhead lines, without repair being
performed, but possibly with on-site inspection.
Zone Clearance Ratio
The Zone Clearance Ratio is defined as the ratio of the number of short circuit faults not cleared
in Zone 1 to the total number of short circuit faults per year. The more faults cleared in Zone 1,
the quicker they are taken off the power system which reduces the risk of system instability, plant
damage and injury to personnel.

TTTTrrrraaaannnnssssmmmmiiiissssssssiiiioooonnnn SSSSyyyysssstttteeeemmmm PPPPeeeerrrrffffoooorrrrmmmmaaaannnncccceeee RRRReeeeppppoooorrrrtttt • 2015 Page 51
Zones of Protection
Zone 1 on an impedance (distance) relay is the primary protection zone and in the case of an
overhead line is set to 70 - 85 % of the circuit length depending on the location of the circuit in
the transmission network. There is no time delay for the relay to pick up when a fault occurs
within the Zone 1 reach, as shown in Figure 4. Typical Zone 1 clearance times are 50 to 150 ms.
Zone 2 on an impedance relay is used as a backup protection zone and is set to 100 % of the
circuit length plus 20 - 50 % of the length of the shortest feeder at the remote end of the
protected circuit. A delay of approximately 400 ms is applied in Zone 2 settings and so typical
Zone 2 fault clearance times are 450 to 550 ms.
Zone 3 on an impedance relay is used as a backup protection zone and is set to 20 - 50 % of the
length of the shortest feeder in the reverse direction. A delay of approximately 500 ms is applied
in Zone 3 settings and so typical Zone 3 fault clearance times are 550 to 650 ms.
Zone 4 is the third forward step of a distance scheme with a time delay of approximately 900 ms.
Zone 5 is the second reverse step of a distance protection scheme with a time delay of
approximately 1 second.
Zone 4 and 5 trips are very rarely initiated due to the in-built time delays.

TTTTrrrraaaannnnssssmmmmiiiissssssssiiiioooonnnn SSSSyyyysssstttteeeemmmm PPPPeeeerrrrffffoooorrrrmmmmaaaannnncccceeee RRRReeeeppppoooorrrrtttt • 2015 Page 52
Appendix 2 All Island Frequency
Excursion Graphs
Cause of IncidentCause of IncidentCause of IncidentCause of Incident DateDateDateDate
EWIC & B21 22/06/2015
Great Island 4 07/07/2015
Great Island 4 14/03/2015
Great Island 4 06/01/2015
Great Island 4 31/08/2015
Great Island 4 10/02/2015
Huntstown Unit 2 27/07/2015
Great Island 4 31/03/2015
Great Island 4 04/03/2015
Great Island 4 18/03/2015
Dublin Bay 22/01/2015
EWIC 20/06/2015
Great Island 4 13/03/2015
Moyle 07/08/2015

TTTTrrrraaaannnnssssmmmmiiiissssssssiiiioooonnnn SSSSyyyysssstttteeeemmmm PPPPeeeerrrrffffoooorrrrmmmmaaaannnncccceeee RRRReeeeppppoooorrrrtttt • 2015 Page 53
EWIC & B21 -22/06/2015
49
49.2
49.4
49.6
49.8
50
50.2
-0.35
-0.3
-0.25
-0.2
-0.15
-0.1
-0.05
0
0.05
0.1
-4 -2 0 2 4 6 8 10 12 14 16 18 20
Hz
Hz/
sec
Seconds
EWIC/B31 - Frequency Event
MAX ROCOF 5 pt moving average system frequency Hz
-0.7
-0.6
-0.5
-0.4
-0.3
-0.2
-0.1
0
0.1
0.2
-4 -2 0 2 4 6 8 10 12 14 16 18 20
Hz/
sec
Seconds
EWIC/B31 - Frequency Event
Max ROCOF raw data

TTTTrrrraaaannnnssssmmmmiiiissssssssiiiioooonnnn SSSSyyyysssstttteeeemmmm PPPPeeeerrrrffffoooorrrrmmmmaaaannnncccceeee RRRReeeeppppoooorrrrtttt • 2015 Page 54
Great Island 4 – 07/07/2015
-0.5
-0.4
-0.3
-0.2
-0.1
0
0.1
0.2
-4 -2 0 2 4 6 8 10 12 14 16 18 20
Hz/
sec
Seconds
GI4 - Frequency Event
Max ROCOF raw data
49.2
49.3
49.4
49.5
49.6
49.7
49.8
49.9
50
50.1
-0.35
-0.3
-0.25
-0.2
-0.15
-0.1
-0.05
0
0.05
0.1
0.15
-4 -2 0 2 4 6 8 10 12 14 16 18 20
Hz
Hz/
sec
Seconds
GI4 - Frequency Event
MAX ROCOF 5 pt moving System Frequency Hz

TTTTrrrraaaannnnssssmmmmiiiissssssssiiiioooonnnn SSSSyyyysssstttteeeemmmm PPPPeeeerrrrffffoooorrrrmmmmaaaannnncccceeee RRRReeeeppppoooorrrrtttt • 2015 Page 55
Great Island 4 – 14/03/2015
-0.5
-0.4
-0.3
-0.2
-0.1
0
0.1
0.2
0.3
-4 -2 0 2 4 6 8 10 12 14 16 18 20
Hz/
sec
Seconds
GI4 - Frequency Event
Max ROCOF raw data
49.2
49.3
49.4
49.5
49.6
49.7
49.8
49.9
50
50.1
50.2
50.3
-0.35
-0.3
-0.25
-0.2
-0.15
-0.1
-0.05
0
0.05
0.1
0.15
0.2
-4 -2 0 2 4 6 8 10 12 14 16 18 20
Hz
Hz/
sec
Seconds
GI4 - Frequency Event
MAX ROCOF 5 pt moving System Frequency Hz

TTTTrrrraaaannnnssssmmmmiiiissssssssiiiioooonnnn SSSSyyyysssstttteeeemmmm PPPPeeeerrrrffffoooorrrrmmmmaaaannnncccceeee RRRReeeeppppoooorrrrtttt • 2015 Page 56
Great Island 4 – 06/01/2015
-0.4
-0.3
-0.2
-0.1
0
0.1
0.2
-4 -2 0 2 4 6 8 10 12 14 16 18 20
Hz/
sec
Seconds
GI4 - Frequency Event
Max ROCOF raw data
49.3
49.4
49.5
49.6
49.7
49.8
49.9
50
50.1
-0.35
-0.3
-0.25
-0.2
-0.15
-0.1
-0.05
0
0.05
0.1
0.15
-4 -2 0 2 4 6 8 10 12 14 16 18 20
Hz
Hz/
sec
Seconds
GI4 - Frequency Event
MAX ROCOF 5 pt moving System Frequency Hz

TTTTrrrraaaannnnssssmmmmiiiissssssssiiiioooonnnn SSSSyyyysssstttteeeemmmm PPPPeeeerrrrffffoooorrrrmmmmaaaannnncccceeee RRRReeeeppppoooorrrrtttt • 2015 Page 57
Great Island 4 – 31/08/2015
-0.5
-0.4
-0.3
-0.2
-0.1
0
0.1
0.2
0.3
-4 -2 0 2 4 6 8 10 12 14 16 18 20
Hz/
sec
Seconds
GI4 - Frequency Event
Max ROCOF raw data
49.3
49.4
49.5
49.6
49.7
49.8
49.9
50
50.1
-0.35
-0.3
-0.25
-0.2
-0.15
-0.1
-0.05
0
0.05
0.1
0.15
-4 -2 0 2 4 6 8 10 12 14 16 18 20
Hz
Hz/
sec
Seconds
GI4 - Frequency Event
MAX ROCOF 5 pt moving System Frequency Hz

TTTTrrrraaaannnnssssmmmmiiiissssssssiiiioooonnnn SSSSyyyysssstttteeeemmmm PPPPeeeerrrrffffoooorrrrmmmmaaaannnncccceeee RRRReeeeppppoooorrrrtttt • 2015 Page 58
Great Island 4 – 10/02/2015
-0.35
-0.3
-0.25
-0.2
-0.15
-0.1
-0.05
0
0.05
0.1
0.15
-4 -2 0 2 4 6 8 10 12 14 16 18 20
Hz/
sec
Seconds
GI4 - Frequency Event
Max ROCOF raw data
49.4
49.5
49.6
49.7
49.8
49.9
50
50.1
-0.3
-0.25
-0.2
-0.15
-0.1
-0.05
0
0.05
0.1
0.15
-4 -2 0 2 4 6 8 10 12 14 16 18 20
Hz
Hz/
sec
Seconds
GI4 - Frequency Event
MAX ROCOF 5 pt moving System Frequency Hz

TTTTrrrraaaannnnssssmmmmiiiissssssssiiiioooonnnn SSSSyyyysssstttteeeemmmm PPPPeeeerrrrffffoooorrrrmmmmaaaannnncccceeee RRRReeeeppppoooorrrrtttt • 2015 Page 59
Huntstown Unit 2 – 27/07/2015
-0.35
-0.3
-0.25
-0.2
-0.15
-0.1
-0.05
0
0.05
0.1
0.15
-4 -2 0 2 4 6 8 10 12 14 16 18 20
Hz/
sec
Seconds
GI4 - Frequency Event
Max ROCOF raw data
49.4
49.5
49.6
49.7
49.8
49.9
50
50.1
-0.3
-0.25
-0.2
-0.15
-0.1
-0.05
0
0.05
0.1
0.15
-4 -2 0 2 4 6 8 10 12 14 16 18 20
Hz
Hz/
sec
Seconds
GI4 - Frequency Event
MAX ROCOF 5 pt moving System Frequency Hz

TTTTrrrraaaannnnssssmmmmiiiissssssssiiiioooonnnn SSSSyyyysssstttteeeemmmm PPPPeeeerrrrffffoooorrrrmmmmaaaannnncccceeee RRRReeeeppppoooorrrrtttt • 2015 Page 60
Great Island 4 – 31/03/2015
-0.35
-0.3
-0.25
-0.2
-0.15
-0.1
-0.05
0
0.05
0.1
0.15
-4 -2 0 2 4 6 8 10 12 14 16 18 20
Hz/
sec
Seconds
GI4 - Frequency Event
Max ROCOF raw data
49.4
49.5
49.6
49.7
49.8
49.9
50
50.1
-0.3
-0.25
-0.2
-0.15
-0.1
-0.05
0
0.05
0.1
0.15
-4 -2 0 2 4 6 8 10 12 14 16 18 20
Hz
Hz/
sec
Seconds
GI4 - Frequency Event
MAX ROCOF 5 pt moving System Frequency Hz

TTTTrrrraaaannnnssssmmmmiiiissssssssiiiioooonnnn SSSSyyyysssstttteeeemmmm PPPPeeeerrrrffffoooorrrrmmmmaaaannnncccceeee RRRReeeeppppoooorrrrtttt • 2015 Page 61
Great Island 4 – 04/03/2015
-0.35
-0.3
-0.25
-0.2
-0.15
-0.1
-0.05
0
0.05
0.1
0.15
-4 -2 0 2 4 6 8 10 12 14 16 18 20
Hz/
sec
Seconds
GI4 - Frequency Event
Max ROCOF raw data
49.4
49.5
49.6
49.7
49.8
49.9
50
50.1
-0.3
-0.25
-0.2
-0.15
-0.1
-0.05
0
0.05
0.1
0.15
-4 -2 0 2 4 6 8 10 12 14 16 18 20
Hz
Hz/
sec
Seconds
GI4 - Frequency Event
MAX ROCOF 5 pt moving System Frequency Hz

TTTTrrrraaaannnnssssmmmmiiiissssssssiiiioooonnnn SSSSyyyysssstttteeeemmmm PPPPeeeerrrrffffoooorrrrmmmmaaaannnncccceeee RRRReeeeppppoooorrrrtttt • 2015 Page 62
Great Island 4 – 18/03/2015
-0.35
-0.3
-0.25
-0.2
-0.15
-0.1
-0.05
0
0.05
0.1
0.15
-4 -2 0 2 4 6 8 10 12 14 16 18 20
Hz/
sec
Seconds
GI4 - Frequency Event
Max ROCOF raw data
49.4
49.5
49.6
49.7
49.8
49.9
50
50.1
-0.3
-0.25
-0.2
-0.15
-0.1
-0.05
0
0.05
0.1
0.15
-4 -2 0 2 4 6 8 10 12 14 16 18 20
Hz
Hz/
sec
Seconds
GI4 - Frequency Event
MAX ROCOF 5 pt moving System Frequency Hz
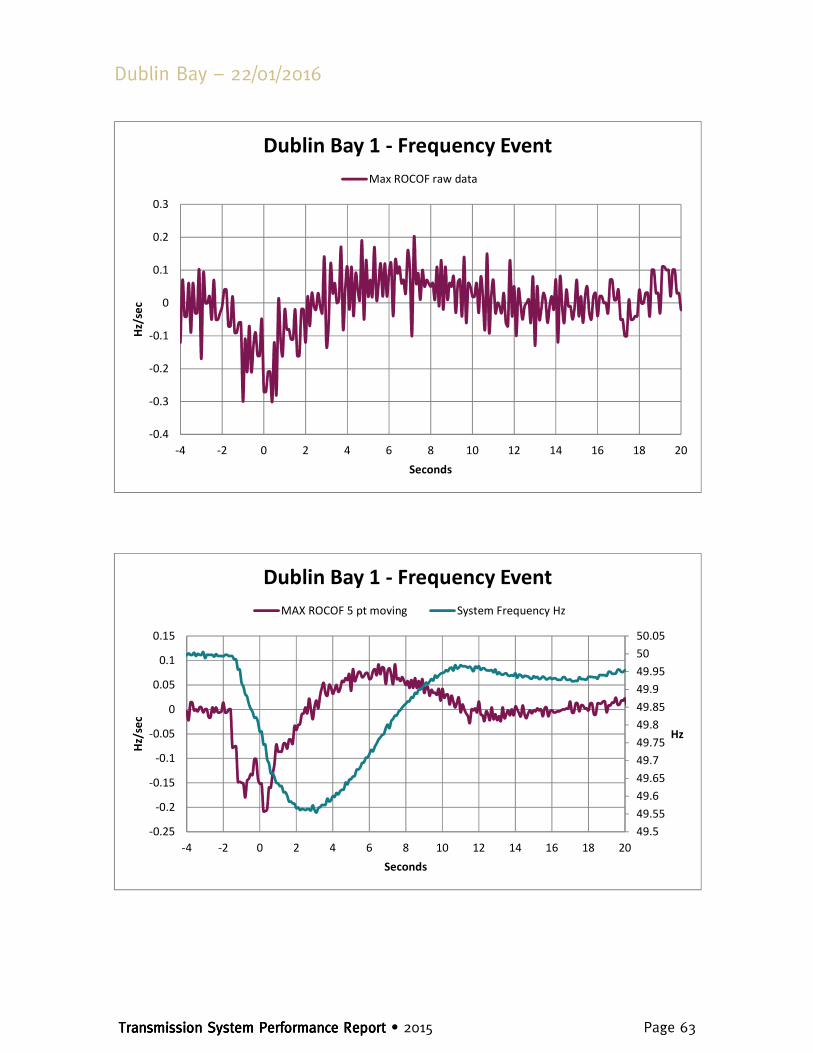
TTTTrrrraaaannnnssssmmmmiiiissssssssiiiioooonnnn SSSSyyyysssstttteeeemmmm PPPPeeeerrrrffffoooorrrrmmmmaaaannnncccceeee RRRReeeeppppoooorrrrtttt • 2015 Page 63
Dublin Bay – 22/01/2016
-0.4
-0.3
-0.2
-0.1
0
0.1
0.2
0.3
-4 -2 0 2 4 6 8 10 12 14 16 18 20
Hz/
sec
Seconds
Dublin Bay 1 - Frequency Event
Max ROCOF raw data
49.5
49.55
49.6
49.65
49.7
49.75
49.8
49.85
49.9
49.95
50
50.05
-0.25
-0.2
-0.15
-0.1
-0.05
0
0.05
0.1
0.15
-4 -2 0 2 4 6 8 10 12 14 16 18 20
Hz
Hz/
sec
Seconds
Dublin Bay 1 - Frequency Event
MAX ROCOF 5 pt moving System Frequency Hz

TTTTrrrraaaannnnssssmmmmiiiissssssssiiiioooonnnn SSSSyyyysssstttteeeemmmm PPPPeeeerrrrffffoooorrrrmmmmaaaannnncccceeee RRRReeeeppppoooorrrrtttt • 2015 Page 64
EWIC – 20/06/2015
-0.4
-0.3
-0.2
-0.1
0
0.1
0.2
0.3
-4 -2 0 2 4 6 8 10 12 14 16 18 20
Hz/
sec
Seconds
Dublin Bay 1 - Frequency Event
Max ROCOF raw data
49.5
49.55
49.6
49.65
49.7
49.75
49.8
49.85
49.9
49.95
50
50.05
-0.25
-0.2
-0.15
-0.1
-0.05
0
0.05
0.1
0.15
-4 -2 0 2 4 6 8 10 12 14 16 18 20
Hz
Hz/
sec
Seconds
Dublin Bay 1 - Frequency Event
MAX ROCOF 5 pt moving System Frequency Hz
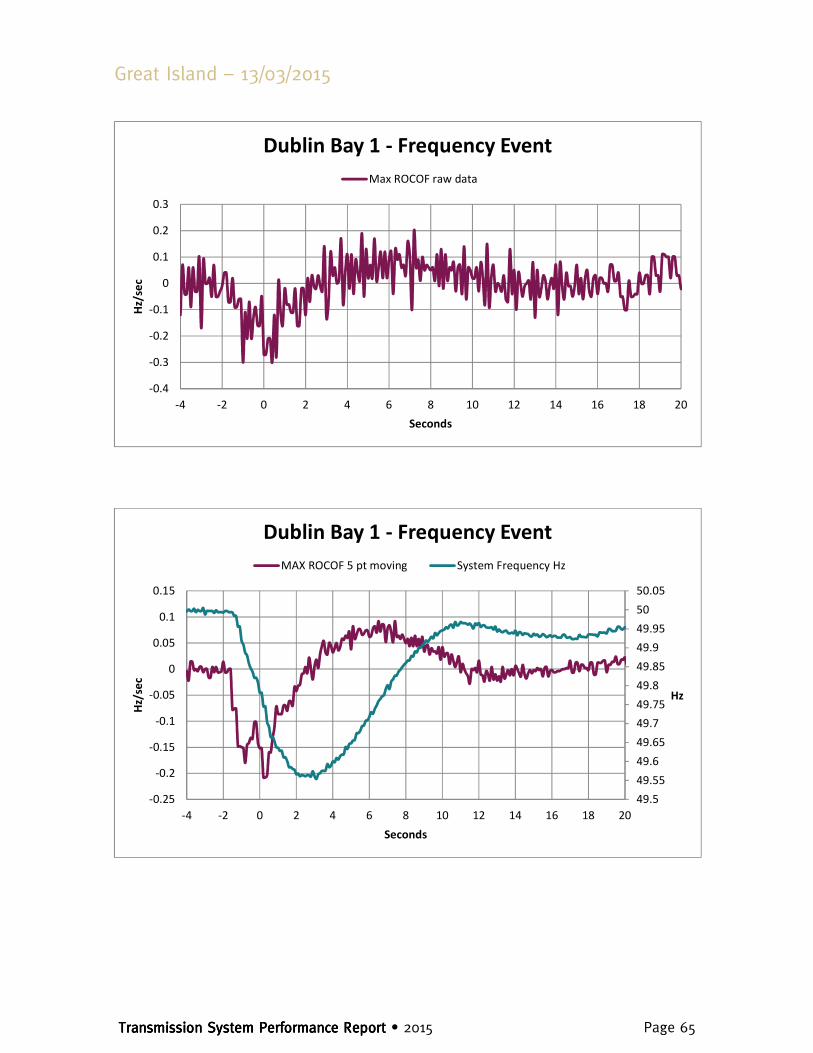
TTTTrrrraaaannnnssssmmmmiiiissssssssiiiioooonnnn SSSSyyyysssstttteeeemmmm PPPPeeeerrrrffffoooorrrrmmmmaaaannnncccceeee RRRReeeeppppoooorrrrtttt • 2015 Page 65
Great Island – 13/03/2015
-0.4
-0.3
-0.2
-0.1
0
0.1
0.2
0.3
-4 -2 0 2 4 6 8 10 12 14 16 18 20
Hz/
sec
Seconds
Dublin Bay 1 - Frequency Event
Max ROCOF raw data
49.5
49.55
49.6
49.65
49.7
49.75
49.8
49.85
49.9
49.95
50
50.05
-0.25
-0.2
-0.15
-0.1
-0.05
0
0.05
0.1
0.15
-4 -2 0 2 4 6 8 10 12 14 16 18 20
Hz
Hz/
sec
Seconds
Dublin Bay 1 - Frequency Event
MAX ROCOF 5 pt moving System Frequency Hz

TTTTrrrraaaannnnssssmmmmiiiissssssssiiiioooonnnn SSSSyyyysssstttteeeemmmm PPPPeeeerrrrffffoooorrrrmmmmaaaannnncccceeee RRRReeeeppppoooorrrrtttt • 2015 Page 66
Moyle – 07/08/2016
-0.4
-0.3
-0.2
-0.1
0
0.1
0.2
0.3
-4 -2 0 2 4 6 8 10 12 14 16 18 20
Hz/
sec
Seconds
Dublin Bay 1 - Frequency Event
Max ROCOF raw data
49.5
49.55
49.6
49.65
49.7
49.75
49.8
49.85
49.9
49.95
50
50.05
-0.25
-0.2
-0.15
-0.1
-0.05
0
0.05
0.1
0.15
-4 -2 0 2 4 6 8 10 12 14 16 18 20
Hz
Hz/
sec
Seconds
Dublin Bay 1 - Frequency Event
MAX ROCOF 5 pt moving System Frequency Hz

TTTTrrrraaaannnnssssmmmmiiiissssssssiiiioooonnnn SSSSyyyysssstttteeeemmmm PPPPeeeerrrrffffoooorrrrmmmmaaaannnncccceeee RRRReeeeppppoooorrrrtttt • 2015 Page 67
Appendix 3 All Island Fully
Dispatchable Generation Plant Company Unit Capacity
(MW) Fuel 365-day Rolling
Availability %
Activation Energy AEDSU - AE1 101 DSU 52.42
AEDSU - AE2 9 DSU 67.74
AEDSU - AE3 14 DSU 94.09
AEDSU - AE4 12 DSU 100.00
AES Ballylumford - B10 94 Gas / Distillate Oil 87.05
Ballylumford - B21 249 Gas / Distillate Oil 87.44
Ballylumford - B22 249 Gas / Distillate Oil 79.83
Ballylumford - BGT1
58 Distillate 95.03
Ballylumford - BGT2
58 Distillate 94.65
Ballylumford - BPS4
147 Gas / Distillate Oil 69.29
Ballylumford - BPS5
144 Gas / Distillate Oil 85.84
Kilroot - KGT1 29 Distillate 83.96
Kilroot - KGT2 29 Distillate 95.10
Kilroot - KGT3 42 Distillate 89.93
Kilroot - KGT4 42 Distillate 96.14
Kilroot - KPS1 238 Coal / Heavy Fuel Oil 63.13
Kilroot - KPS2 238 Coal / Heavy Fuel Oil 86.96
Aughinish Alumina Ltd
Seal Rock - SK3 85 Gas / Distillate Oil 89.93
Seal Rock - SK4 85 Gas / Distillate Oil 90.39
Bord Gáis Whitegate - WG1 444 Gas / Distillate Oil 96.16
Contour Global ContourGAGU - CGA
12 Gas 99.05
Coolkeeragh ESB Coolkeeragh - C30 408 Gas / Distillate Oil 92.06
Coolkeeragh - CG8 53 Distillate 64.79
Dalkia Alternative Energy
DAE VPP - DP1 39 DSU 33.99
Endeco Technologies EC1 - EC1 31 DSU 65.31
Edenderry Power Ltd Edenderry - ED1 118 Peat 82.72
Edenderry - ED3 58 Gas / Distillate Oil 99.36
Edenderry - ED5 58 Gas / Distillate Oil 99.01
Electricity Exchange Elect Exchng - EE1 20 DSU 65.45
Electric Irl - EI1 20 DSU 81.43
Empower EmpowerAGU - EMP
3 Distillate 100.00

TTTTrrrraaaannnnssssmmmmiiiissssssssiiiioooonnnn SSSSyyyysssstttteeeemmmm PPPPeeeerrrrffffoooorrrrmmmmaaaannnncccceeee RRRReeeeppppoooorrrrtttt • 2015 Page 68
Company Unit Capacity (MW)
Fuel 365-day Rolling Availability %
SSE Generation Ireland
Great Island - GI4 461 Gas / Distillate Oil 83.18
Rhode - RP1 52 Distillate 93.74
Rhode - RP2 52 Distillate 95.91
Tarbert - TB1 54 Heavy Fuel Oil 59.40
Tarbert - TB2 54 Heavy Fuel Oil 64.85
Tarbert - TB3 241 Heavy Fuel Oil 94.15
Tarbert - TB4 243 Heavy Fuel Oil 98.42
Tawnaghmore - TP1
52 Distillate 97.70
Tawnaghmore - TP3
52 Distillate 99.41
Energy Trading Ireland
Ener Trd Irl - ET1 11 DSU 79.01
ESBPG Ardnacrusha - AA1 21 Hydro 70.59
Ardnacrusha - AA2 22 Hydro 69.74
Ardnacrusha - AA3 19 Hydro 69.23
Ardnacrusha - AA4 24 Hydro 71.38
Aghada - AD1 258 Gas / Distillate Oil 94.60
Aghada - AD2 431 Gas / Distillate Oil 97.89
Aghada - AT11 90 Gas / Distillate Oil 93.97
Aghada - AT12 90 Gas / Distillate Oil 96.32
Aghada - AT14 90 Gas / Distillate Oil 95.49
Erne - ER1 10 Hydro 0.68
Erne - ER2 10 Hydro 92.23
Erne - ER3 22.5 Hydro 97.96
Erne - ER4 22.5 Hydro 96.57
Lee - LE1 15 Hydro 84.90
Lee - LE2 4 Hydro 92.39
Lee - LE3 8 Hydro 91.90
Liffey - LI1 15 Hydro 35.93
Liffey - LI2 15 Hydro 39.01
Liffey - LI4 4 Hydro 39.27
Liffey - LI5 4 Hydro 98.76
Lough Ree - LR4 91 Peat 95.74
Moneypoint - MP1 285 Coal / Heavy Fuel Oil 89.07
Moneypoint - MP2 285 Coal / Heavy Fuel Oil 71.98
Moneypoint - MP3 285 Coal / Heavy Fuel Oil 87.28
Marina - MRC 95 Gas / Distillate Oil 86.89
North Wall - NW5 104 Gas / Distillate Oil 92.75
Poolbeg - PB14 150 Gas / Distillate Oil 97.53
Poolbeg - PB15 150 Gas / Distillate Oil 98.58
Poolbeg - PB16 163 Gas / Distillate Oil 93.93
Turlough H - TH1 73 Hydro - Pumped Storage
96.20
Turlough H - TH2 73 Hydro - Pumped Storage
96.42
Turlough H - TH3 73 Hydro - Pumped Storage
96.99
Turlough H - TH4 73 Hydro - Pumped Storage
97.33
West Offaly - WO4 137 Peat 87.08

TTTTrrrraaaannnnssssmmmmiiiissssssssiiiioooonnnn SSSSyyyysssstttteeeemmmm PPPPeeeerrrrffffoooorrrrmmmmaaaannnncccceeee RRRReeeeppppoooorrrrtttt • 2015 Page 69
Company Unit Capacity (MW)
Fuel 365-day Rolling Availability %
ETI Ltd (NI) ETR - ETR 12 DSU 37.95
Evermore Lisahally - LPS 17.6 Biomass 74.39
Indaver Indaver - IW1 17 Waste to Energy 90.26
iPower iPower AGU - AGU 74 Distillate 97.49
PHG LTD PHG - PH1 18 DSU 36.73
Powerhouse Generation
Powerhouse G - PG1
7 DSU 79.11
Synergen Dublin Bay - DB1 405 Gas / Distillate Oil 96.21
Tynagh Energy Ltd Tynagh - TYC 384 Gas / Distillate Oil 95.88
Viridian Energy Limited
Huntstown - HN2 400 Gas / Distillate Oil 94.38
Huntstown - HNC 342 Gas / Distillate Oil 92.92
Viridian DSU - VE1 6.9 DSU 38.83
TTTTrrrraaaannnnssssmmmmiiiissssssssiiiioooonnnn SSSSyyyysssstttteeeemmmm PPPPeeeerrrrffffoooorrrrmmmmaaaannnncccceeee RRRReeeeppppoooorrrrtttt • 2015 Page 70
Appendix 4 – EirGrid Maintenance
Policy Terms The following summarises the main terms and activities in the asset maintenance policy as
operated by EirGrid7. The need to ensure that equipment continues to operate in a safe, secure,
economic and reliable manner, while minimising life cycle costs, underlies the principles behind
this asset maintenance policy. Effective maintenance management balances the costs of repair,
replacement and refurbishment against the consequences of asset failure.
There are four primary maintenance categories:
1. Preventative: This includes condition monitoring, both on and offline, inspections and routine
servicing. It is usually cyclical and can be planned in advance.
2. Corrective: Corrective maintenance may consist of repair, restoration or replacement of
equipment before functional failure. Corrective maintenance requirements are identified through
regular inspections. 3. Fault: Fault maintenance includes activities arising from unexpected
equipment failure in service.
Stations
Preventive maintenance is carried out at routine intervals on all station assets regardless of age.
The following summarises the primary routine preventative maintenance tasks on station
equipment:
1. Operational tests: These involve, among other activities, opening and closing the breakers and
disconnects locally and remotely, carrying out tripping checks on the breakers and checking of
interlocking. These tests are designed to ensure that equipment will operate correctly when called
upon to do so.
2. Ordinary services:
Every four years, or five years (depending on the voltage and location of the circuit in the system),
more detailed inspection and measurements are taken. All measurements and test values are
checked for conformity with standards or other norms established by best industry practice or
experience. They are compared to those of previous measurements and tests. Any significant
changes or trends are noted and satisfactory explanations sought.
3. Condition assessment
7 In Northern Ireland maintenance policy for the transmission system is the responsibility of NIE as
licenced Transmission Owner.

TTTTrrrraaaannnnssssmmmmiiiissssssssiiiioooonnnn SSSSyyyysssstttteeeemmmm PPPPeeeerrrrffffoooorrrrmmmmaaaannnncccceeee RRRReeeeppppoooorrrrtttt • 2015 Page 71
This non-invasive procedure combines an evaluation of the asset’s operational, maintenance and
fault histories with a detailed site inspection and site and laboratory tests. The condition
assessment evaluates the asset’s present condition and residual life and provides data for life
management decisions i.e. required corrective maintenance, further monitoring, future operation
(i.e. loading/ over-loading restriction, refurbishment, replacement, etc.). The EirGrid policy is to
carry out condition assessments at eight-year or ten-year intervals depending on the asset type.
Overhead Lines
Outage related overhead lines maintenance works are condition/age based. To the greatest
practical extent, inspections and condition assessments are carried out with the lines energised,
and live working techniques are employed for some elements of remedial work. Planned
maintenance of overhead lines implements requirements for preventative maintenance, corrective
maintenance, and repairs, which are identified by inspections and condition assessments.
Cables
Inspections are carried out at monthly, quarterly and annual intervals for oil filled cables and at
annual intervals for cross linked polyethylene (XLPE) cables. The principal cause of cable faults is
third party damage or sheath faults.

TTTTrrrraaaannnnssssmmmmiiiissssssssiiiioooonnnn SSSSyyyysssstttteeeemmmm PPPPeeeerrrrffffoooorrrrmmmmaaaannnncccceeee RRRReeeeppppoooorrrrtttt • 2015 Page 72
Appendix 5 Formulae (EirGrid
Transmission System)
Availability & Unavailability Formula
Equation 2: Availability of 110kV, 220 kV, 275 kV and 400 kV lines
SystemAvailability = 1 −∑ Duration of Outage(i) * Length of Line (i)i=ni=1
∑ LengthofLine(j) ∗ DaysinaYear)*+
)*,
Where n = The total number of lines (at that voltage level) for which outages occurred
m = The total number of lines at that voltage level
Equation 3: Availability of 220 kV/110 kV, 275 kV/220 kV and 400 kV/220 kV transformers
SystemAvailability = 1 −∑ Duration of Outage(i) * MVA of Transformer (i)i=ni=1
∑ MVAofTransformer(j) ∗ DaysinaYear)*+
)*,
Where: n = The total number of transformers (at that voltage level) for which outages occurred
m = The total number of transformers at that voltage level
Equation 4: System Unavailability
SystemUnavailability = 1 −∑HourseachCircuitisAvailable
NumberofCircuits ∗ HoursinPeriod
Equation 4 is the same as that used by OFGEM (The Office Of Gas And Electricity Markets) in the
UK.
System Minute Formula
Equation 5: System Minute Formula
SystemMinutes = EnergynotsuppliedMWMinutes
PoweratSystemPeak
Equation 6: System Minute Formula
SystemMinutes = (MVAMinutes) ∗ (PowerFactor)
SystemPeaktoDate
Where: Power factor = 0.9
Recommended