Background
Economists promote excise tax increases as an appropriate and effective tobacco and alcohol control strategy
Higher taxes increase the retail price and reduce the demand for products
Supported by a vast literature – significantly more for tobacco than alcohol
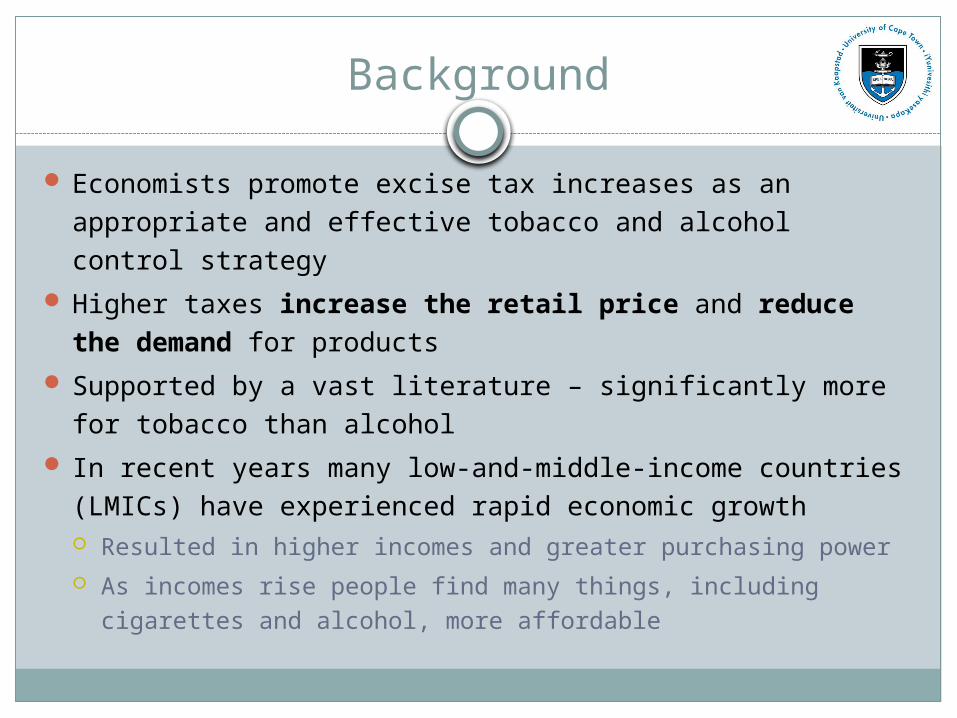
In recent years many low-and-middle-income countries (LMICs) have experienced rapid economic growth Resulted in higher incomes and greater purchasing power As incomes rise people find many things, including cigarettes and
alcohol, more affordable
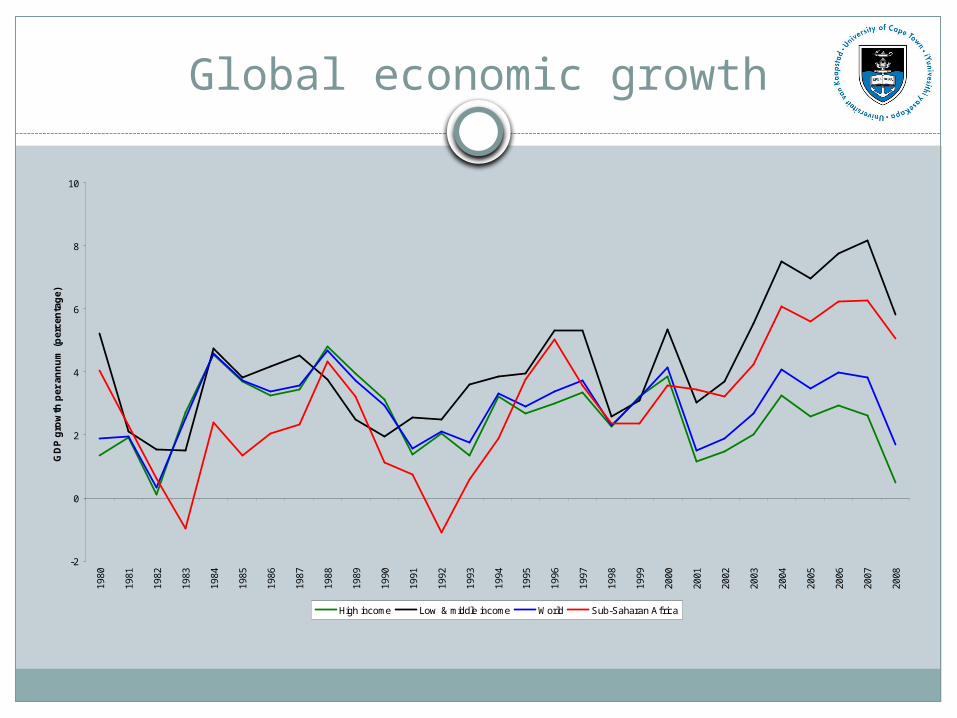
Global economic growth
-2
0
2
4
6
8
10
1980
1981
1982
1983
1984
1985
1986
1987
1988
1989
1990
1991
1992
1993
1994
1995
1996
1997
1998
1999
2000
2001
2002
2003
2004
2005
2006
2007
2008
GD
P g
row
th p
er a
nn
um
(p
erce
nta
ge)
High income Low & middle income World Sub-Saharan Africa

Why affordability? Economics 101
Demand (quantity demanded) is a function of: Price (negative) Income (positive) Other factors like advertising, demographics, tastes, preferences, etc
Historically we consider how determinants influence demand, ceterus parisbus (all else held constant)
Affordability considers price and income simultaneously → this is easier said than done! Can we explicitly measure affordability? It is only a relative concept and has no absolute meaning Consider it at a point in time or how it changes over time Some might argue that we cannot model affordability in the context
of demand

Alcohol affordability literature
Kan and Lau (2013) Follow the Kan cigarette method Scotch, cheap beer, table wine, vermouth, cognac and
liqueur 65 cities in 2009 Highly affordable in many cities (88%) Study lacks any time series analysis and makes
absolute conclusionsSeveral country studies on alcohol
affordability – particularly in Europe
Income
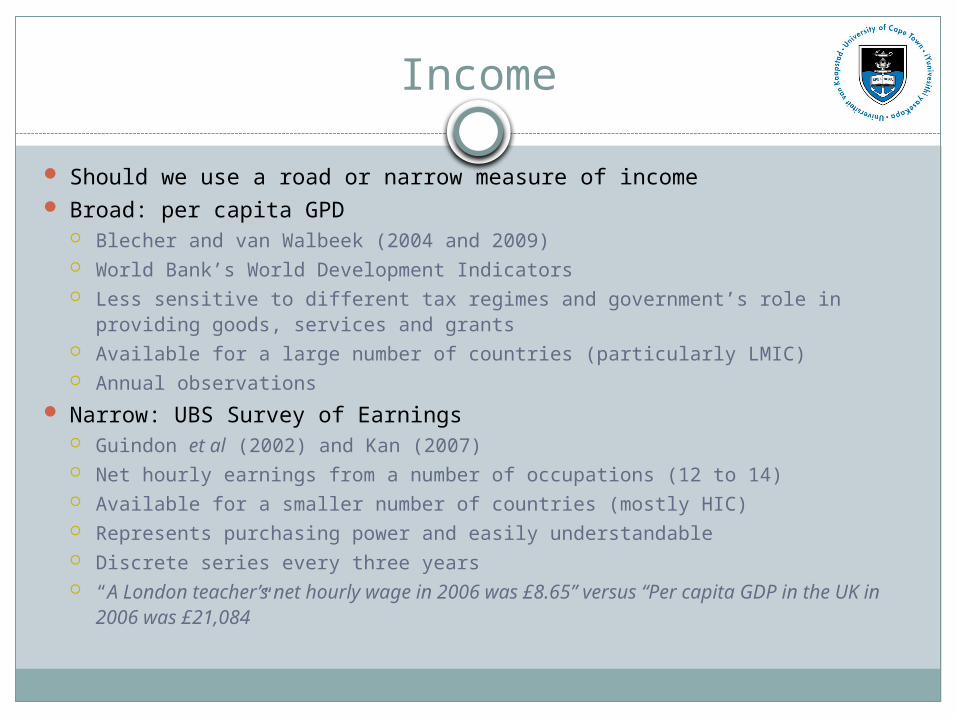
Should we use a road or narrow measure of income Broad: per capita GPD
Blecher and van Walbeek (2004 and 2009) World Bank’s World Development Indicators Less sensitive to different tax regimes and government’s role in providing
goods, services and grants Available for a large number of countries (particularly LMIC) Annual observations
Narrow: UBS Survey of Earnings Guindon et al (2002) and Kan (2007) Net hourly earnings from a number of occupations (12 to 14) Available for a smaller number of countries (mostly HIC) Represents purchasing power and easily understandable Discrete series every three years “A London teacher’s net hourly wage in 2006 was £8.65” versus “Per capita
GDP in the UK in 2006 was £21,084”
So, where do we start with alcohol
Price data – Economist Intelligence Unit Data collected in 140 cities in 92 countries from
1990 to present However, some Islamic countries do not collect
alcohol prices (e.g. Brunei, Iran, Kuwait, Libya and Saudi Arabia), meaning 87 countries effectively
High representation of LMICs
Products
Each product line is measures in two retail environments: mid-priced store and supermarket
Beer Local brand (1L, standardize to 330ml) Top brand (330ml)
Wine (750ml) Common table – consistent Fine quality – no idea what they are measuring Superior quality – no idea what they are measuring
Spirits (700ml) Congac (French VSOP), Gin (Gilbey’s), Liqueur (Cointreau), Scotch
Whisky (6 year old), Vermouth (Martini) Focus on Gin and Whisky
Use the lowest price in each category
Chalenges
Noisy dataChallenges for higher priced brands – lack of
consistency of product selection over time (safe to assume this is a more significant problem across countries) – mitigate this through use of lowest price
City consistency within and across products – more challenging than cigarettes
No USD data which we had for cigarettes which helps in economies in transition of high inflation environments
Outline
Nominal prices in most recent year (2012)Trends in real prices (1990-2012)Affordability in most recent year (2012)
Relative Income Price Minutes of Labour
Trends in affordability (1990-2012) Minutes of Labour

Beer prices in USD in 2012
Slova
kia
Oman
Germ
any
Korea
Nethe
rland
s
Bahra
in
Franc
e
Hong
Kong
New Z
eala
nd
Icel
and
Canad
a
Japa
n
Qatar
Roman
ia
Panam
a
Serbi
a
Argen
tina
Philip
pine
s
Cambo
dia
Azerb
aija
nIn
dia
Colom
bia
Mor
occo
Guate
mal
a
Venez
uela
0.00
0.50
1.00
1.50
2.00
2.50
3.00
HIC LMIC
Pri
ce p
er
can o
f beer
(330m
l) i
n U
S D
oll
ars

Wine price in USD in 2012
Slova
kia
Portuga
lIta
ly
Bahrai
n
Urugu
aySp
ain
Puerto Rico
Luxe
mbourg
United St
ates
Chile
Finlan
d
Belgium
Irelan
d
Hong Kong
Australi
a
Norway
Korea
United Arab
Emira
tes
Sinag
pore
Romania
Argentina
Morocc
o
Hungary
Panam
a
South
Africa
Philippines
Ukraine
Serb
ia
Guatemala
Cambodia
Cote d'Iv
oire
Algeria
Pakist
anIndia
Papua N
ew Guinea
China PR
Venezu
ela
Indonesia
0
5
10
15
20
25
30
HIC LMIC
Price
per
bott
le o
f win
e in
US
Dolla
rs
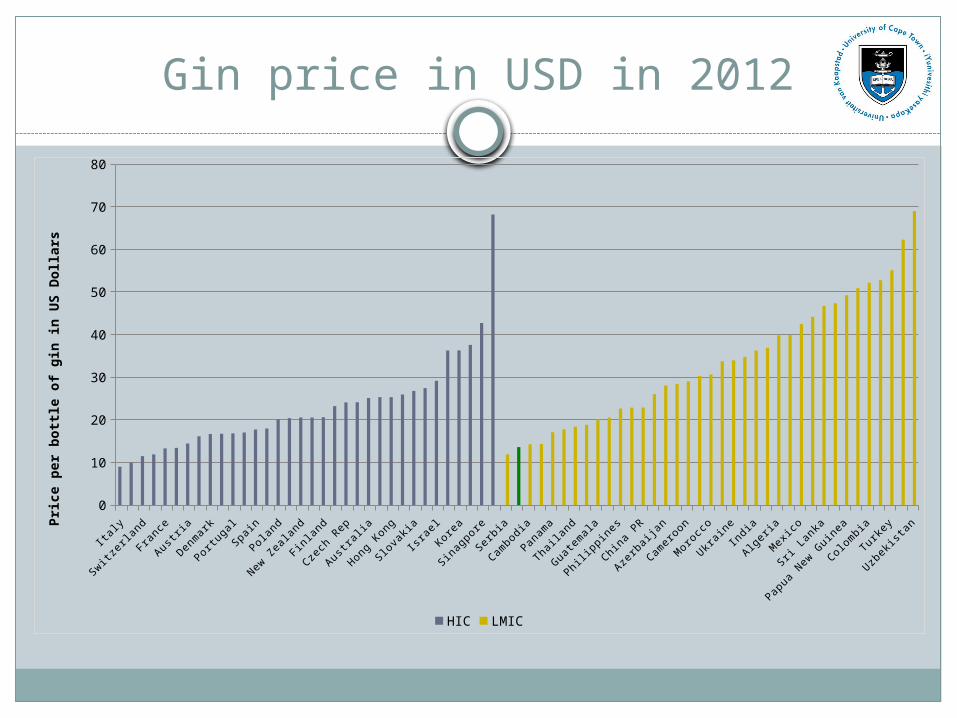
Gin price in USD in 2012
Italy
Switz
erlan
d
France
Austria
Denmark
Portuga
lSp
ain
Poland
New Ze
aland
Finlan
d
Czech Rep
Australi
a
Hong Kong
Slova
kiaIsr
ael
Korea
Sinag
poreSe
rbia
Cambodia
Panam
a
Thail
and
Guatemala
Philippines
China PR
Azerbaij
an
Camero
on
Morocc
o
Ukraine
India
Algeria
Mexico
Sri La
nka
Papua N
ew Guinea
Colombia
Turke
y
Uzbek
istan
0
10
20
30
40
50
60
70
80
HIC LMIC
Price
per
bott
le o
f gin
in U
S Do
llars
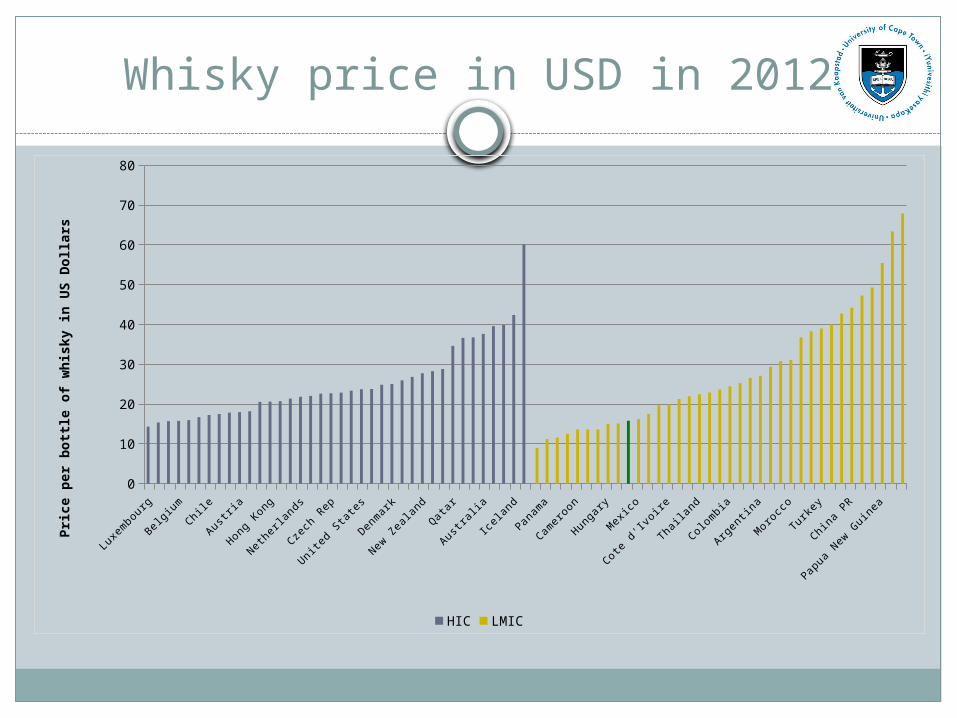
Whisky price in USD in 2012
Luxe
mbourgSp
ain
Poland
ChileJap
anOman
Hong Kong
Bahrai
nIsr
ael
Czech Rep
Puerto Rico
Urugu
ay
Denmark
Canad
a
Irelan
dQata
r
Swed
enRussi
a
Icelan
dEg
ypt
Romania
Camero
on
Philippines
Bulgaria
Mexico
Paragu
ay
Zimbab
we
Thail
and
Kenya
Algeria
Argentina
Sri La
nkaSe
rbia
Turke
y
Indonesia
Peru
Papua N
ew Guinea
Venezu
ela0
10
20
30
40
50
60
70
80
HIC LMIC
Price
per
bott
le o
f whi
sky
in U
S Do
llars
Summary
Nominal prices in most recent year (2012) Prices of beer lower in LMIC versus HIC Prices of wine, gin and whisky similar in LMIC and
HIC Significant within group variation
South Africa Beer prices in the “middle of the pack” Wine cheaper than in many other countries Gin and whiskey amongst the cheapest in the world
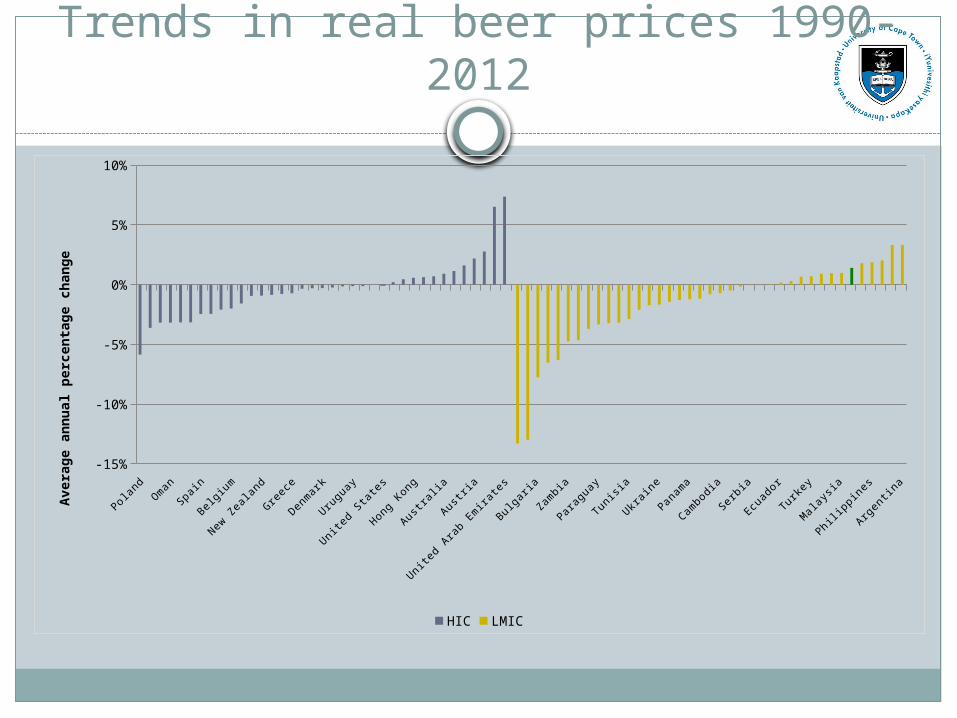
Trends in real beer prices 1990-2012
Poland
United Kingd
omChile
Spain
Swed
en
Sinag
pore
New Ze
aland
Luxe
mbourg
Norway
Denmark
German
y
Puerto Rico
United St
ates
Canad
a
Czech Rep
Australi
a
Switz
erlan
d
France
United Arab
Emira
tes
Azerbaij
anSy
ria
Zambia
Sri La
nkaKen
ya
Tunisi
a
Thail
and
Vietnam
Panam
aBraz
il
Camero
onSe
rbia
Hungary
Guatemala
Turke
y
Costa Rica
South
Africa
Philippines
Seneg
al-15%
-10%
-5%
0%
5%
10%
HIC LMIC
Aver
age
annu
al p
erce
ntag
e ch
ange

Trends in real wine prices 1990-2012
Greece
Finlan
d
Icelan
d
Poland
Austria
Switz
erlan
dJap
an
France
Irelan
d
Canad
a
Czech Rep Ita
ly
Australi
a
United Kingd
om
German
yKorea Chile
Urugu
aySp
ain
Zambia
Guatemala
Azerbaij
an
Nigeria
Brazil
Indonesia
Nepal
Malaysi
a
Vietnam
Philippines
Thail
and
Bulgaria
Costa Rica
Argentina
Turke
y
Paragu
ayPeru
Venezu
elaSe
rbia
-12%
-10%
-8%
-6%
-4%
-2%
0%
2%
4%
6%
8%
HIC LMIC
Aver
age
annu
al p
erce
ntag
e ch
ange

Trends in real gin prices 1990-2012
Chile
Switz
erlan
d
Denmark
Czech Rep Ita
lyRussi
a
Bahrai
n
Austria
Greece
Israe
l
Swed
enSp
ain
Canad
a
Netherl
ands
Australi
a
New Ze
aland
United St
ates
Puerto Rico
Kazakh
stan
India
Venezu
ela
Ecuad
or
Cambodia
Brazil
Panam
a
Azerbaij
an
Guatemala
Thail
and
PeruNep
al
Malaysi
a
Sri La
nka
Seneg
al
Algeria
South
Africa
Mexico
Paragu
ay-16%
-14%
-12%
-10%
-8%
-6%
-4%
-2%
0%
2%
4%
HIC LMIC
Aver
age
annu
al p
erce
ntag
e ch
ange
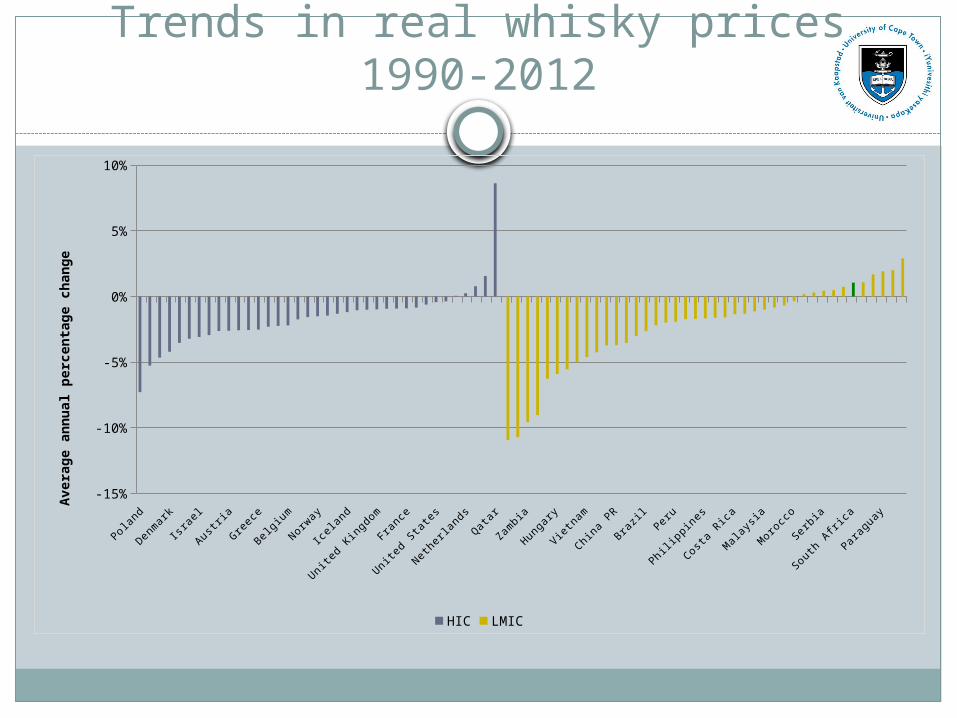
Trends in real whisky prices 1990-2012
PolandRussi
aChile
Israe
lJap
an
Urugu
ay
Greece
Hong Kong
Luxe
mbourg
Norway
Australi
a
Irelan
d
United Kingd
omIta
ly
Canad
a
United St
ates
German
y
Bahrai
nQata
r
Kazakh
stan
Venezu
ela
Hungary
Ukraine
Bulgaria
China PR
Guatemala
Cambodia
PeruNep
al
Seneg
al
Costa Rica
Algeria
Cote d'Iv
oire
Morocc
o
Tunisi
aSy
ria
South
Africa
Indonesia
Ecuad
or-15%
-10%
-5%
0%
5%
10%
HIC LMIC
Aver
age
annu
al p
erce
ntag
e ch
ange
Summary
Trends in real prices (1990-2012) Real price declined in most LMIC and HIC
South Africa Real prices increased for all products This corroborates other findings elsewhere

Affordabilty of beer (RIP) in 2012
Luxe
mbourg
Switz
erlan
d
Belgium
Netherl
ands
United Kingd
omFra
nce
Hong Kong
Italy
Canad
a
Australi
a
Puerto Rico
Icelan
d
Irelan
d
Finlan
d
Sinag
poreRussi
a
Urugu
ay
Bulgaria
Panam
a
Kazakh
stan
Brazil
Azerbaij
anSe
rbia
Ecuad
or
Colombia
Costa Rica
Turke
y
Paragu
ay
Malaysi
a
Algeria
Egyp
t
Indonesia
Guatemala
Vietnam
Morocc
o
Nigeria
Papua N
ew Guinea
Pakist
anNep
al0.0
0.1
0.2
0.3
0.4
0.5
0.6
0
2
4
6
8
10
12
14
16
HIC LMIC
Perc
enta
ge o
f per
capi
ta G
DP re
quire
d to
pur
chas
e 10
0 ca
ns o
f bee
r
Perc
enta
ge o
f per
capi
ta G
DP re
quire
d to
pur
chas
e 10
0 ca
ns o
f bee
r
Note the dual axes – next slide shows the same graph with a single axis

Affordabilty of beer (RIP) in 2012
Luxe
mbourg
Switz
erlan
d
Belgium
Netherl
ands
United Kingd
omFra
nce
Hong Kong
Italy
Canad
a
Australi
a
Puerto Rico
Icelan
d
Irelan
d
Finlan
d
Sinag
poreRussi
a
Urugu
ay
Bulgaria
Panam
a
Kazakh
stan
Brazil
Azerbaij
anSe
rbia
Ecuad
or
Colombia
Costa Rica
Turke
y
Paragu
ay
Malaysi
a
Algeria
Egyp
t
Indonesia
Guatemala
Vietnam
Morocc
o
Nigeria
Papua N
ew Guinea
Pakist
anNep
al0
2
4
6
8
10
12
14
16
HIC LMIC
Perc
enta
ge o
f per
capi
ta G
DP re
quire
d to
pur
chas
e 10
0 ca
ns o
f bee
r

Affordabilty of wine (RIP) in 2012
Luxe
mbourg
Switz
erlan
dIta
ly
United St
ates
Austria
German
y
Belgium
Slova
k Rep
ublic
Portuga
l
Irelan
dJap
an
Greece
Hong Kong S
AR, China
New Ze
aland
Urugu
ayChile
Russian
Federa
tion
Hungary
Kazakh
stan
Tunisi
a
Panam
a
Azerbaij
an
Mexico
Venezu
ela, R
B
Malaysi
aSe
rbia
Paragu
ay
Egyp
t, Arab
Rep.
Morocc
o
Philippines
Thail
andChina
Camero
on
Indonesia
Papua N
ew Guinea
Cote d'Iv
oireKen
yaIndia
Uzbek
istan
0
2
4
6
8
10
12
14
16
0
20
40
60
80
100
120
140
160
HIC LMIC
Perc
enta
ge o
f per
capi
ta G
DP re
quire
d to
pur
chas
e 10
0 bo
ttle
of
win
e
Perc
enta
ge o
f per
capit
a G
DP
requir
ed t
o p
urc
hase
100 b
ott
les
of
win
e
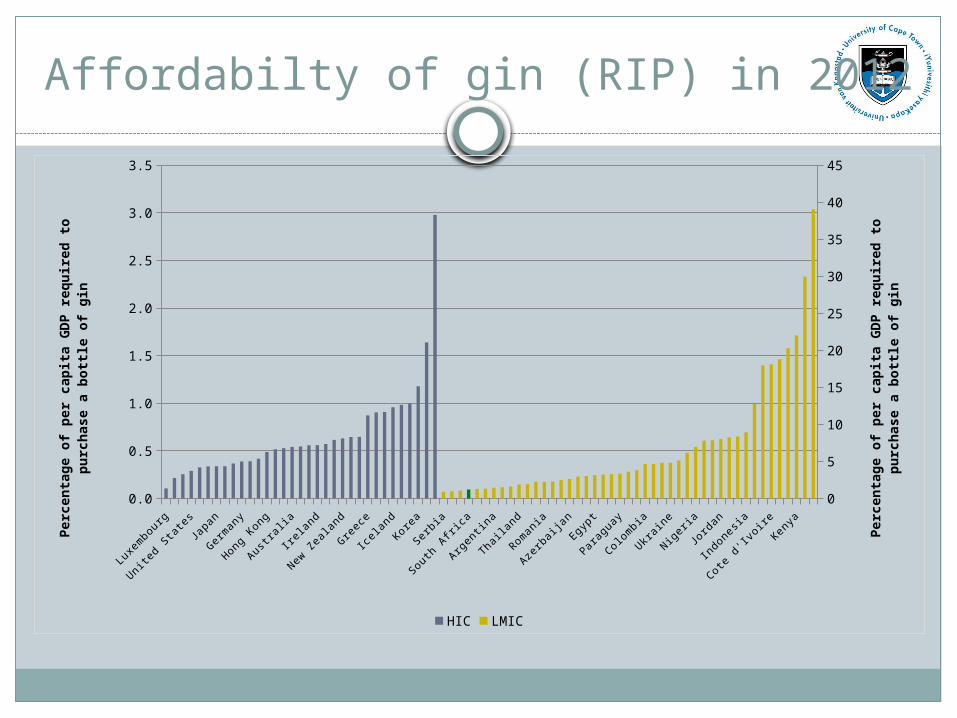
Affordabilty of gin (RIP) in 2012
Luxe
mbourgIta
ly
Austria
Japan
France
Netherl
ands
Hong Kong
Spain
Norway
Irelan
d
United Kingd
om
Sinag
pore
Greece
Poland
Slova
kiaKorea
Russia
Kazakh
stan
South
Africa
Peru
Bulgaria
Thail
and
Turke
yBraz
il
Azerbaij
an
Venezu
elaIndia
Paragu
ay
Guatemala
Algeria
Ukraine
Zambia
Syria
Jord
an
Zimbab
we
Camero
on
Cote d'Iv
oire
Papua N
ew Guinea
Nepal
0.0
0.5
1.0
1.5
2.0
2.5
3.0
3.5
0
5
10
15
20
25
30
35
40
45
HIC LMIC
Perc
enta
ge o
f per
capi
ta G
DP re
quire
d to
pur
chas
e a
bott
le o
f gin
Perc
enta
ge o
f per
capi
ta G
DP re
quire
d to
pur
chas
e a
bott
le o
f gin
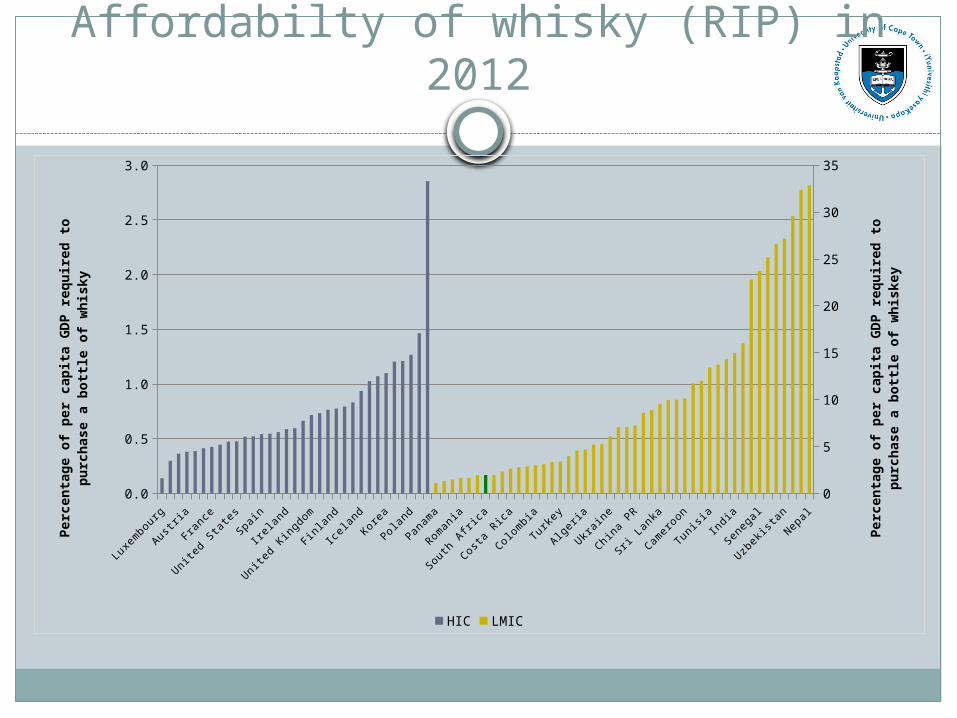
Affordabilty of whisky (RIP) in 2012
Luxe
mbourg
Belgium
Japan
France
Italy
German
ySp
ain
Hong Kong
Norway
United Kingd
om
Sinag
pore
Portuga
l
Icelan
dChile
Czech Rep
PolandRussi
a
Hungary
Romania
Argentina
Bulgaria
Costa Rica
Venezu
elaEg
ypt
Turke
y
Paragu
ay
Guatemala
Ukraine
Peru
Nigeria
Sri La
nka
Jord
an
Ecuad
or
Tunisi
aSy
ria
Cote d'Iv
oire
Seneg
al
Papua N
ew Guinea
Bangla
deshNep
al0.0
0.5
1.0
1.5
2.0
2.5
3.0
0
5
10
15
20
25
30
35
HIC LMIC
Perc
enta
ge o
f per
capi
ta G
DP re
quire
d to
pur
chas
e a
bott
le o
f whi
sky
Perc
enta
ge o
f per
capi
ta G
DP re
quire
d to
pur
chas
e a
bott
le o
f w
hisk
ey

Affordabilty of beer (MoL) in 2012
German
y
Switz
erlan
dSp
ainKorea
Denmark
Belgium
Italy
Portuga
l
New Ze
aland
Japan
Russia
Taiw
an
Hong Kong
Israe
l
Norway
Bahrai
n
United Arab
Emira
tes
Argentina
China PR
Romania
Hungary
Ukraine
Peru
Turke
y
Malaysi
a
Philippines
Kenya
0
10
20
30
40
50
60
70
HIC LMIC
Min
utes
of L
abou
r req
uire
d to
pur
chas
e a
can
of b
eer

Affordabilty of wine (MoL) in 2012
Switz
erlan
dIta
ly
United St
ates
German
y
Denmark
Austria
Japan
Slova
kia
Belgium
Australi
a
Canad
a
Bahrai
n
New Ze
aland
Poland
United Arab
Emira
tes
Taiw
anIsr
ael
Argentina
Romania
Bulgaria
ColombiaBraz
il
Venezu
ela Peru
Thail
and
Philippines
India0
100
200
300
400
500
600
HIC LMIC
Min
utes
of L
abou
r req
uire
d to
pur
chas
e a
bott
le o
f win
e

Affordabilty of gin (MoL) in 2012
Switz
erlan
dIta
ly
United St
ates
Austria
France
Netherl
ands
Portuga
lSp
ain
United Kingd
omTa
iwan
New Ze
aland
Swed
en
Greece
Norway
Poland
Slova
kiaChile
South
Africa
India
Argentina
China PR
Turke
yEg
ypt
Mexico
Colombia
Malaysi
aKen
ya0
100
200
300
400
500
600
700
800
900
1000
HIC LMIC
Min
utes
of L
abou
r req
uire
d to
pur
chas
e a
bott
le o
f gin
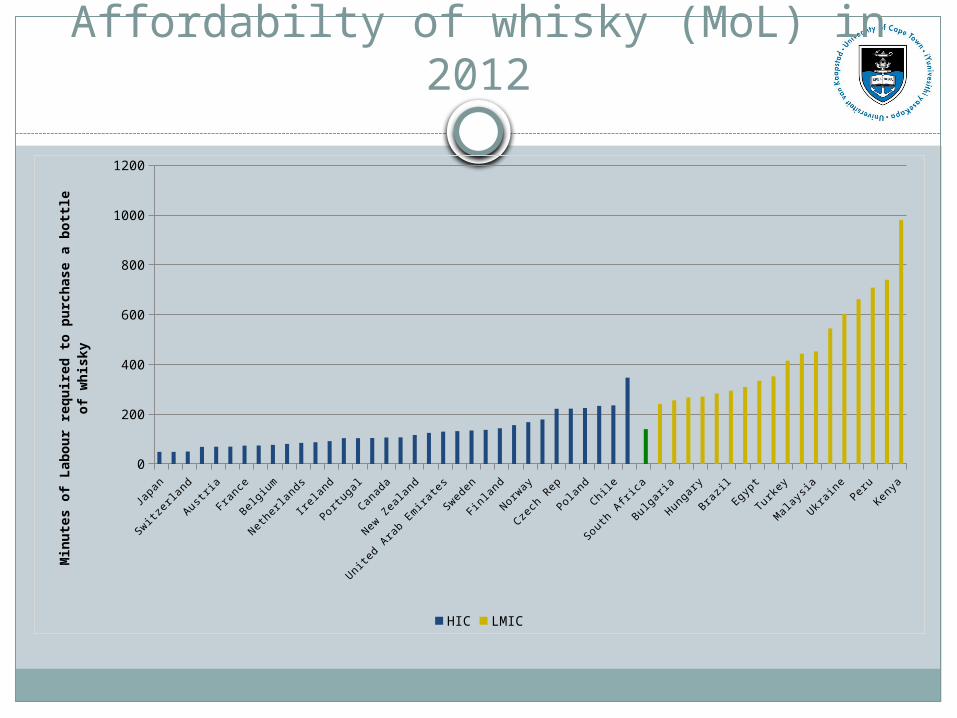
Affordabilty of whisky (MoL) in 2012
Japan
Switz
erlan
d
Austria
France
Belgium
Netherl
ands
Irelan
d
Portuga
l
Canad
a
New Ze
aland
United Arab
Emira
tes
Swed
en
Finlan
d
Norway
Czech Rep
Poland
Chile
South
Africa
Bulgaria
Hungary
Brazil
Egyp
t
Turke
y
Malaysi
a
Ukraine
PeruKen
ya0
200
400
600
800
1000
1200
HIC LMIC
Min
utes
of L
abou
r req
uire
d to
pur
chas
e a
bott
le o
f whi
sky
Summary
Affordability in most recent year (2012) All products more affordable in HICs than LMICs Expected result since incomes are so much higher Scale of affordability much higher with RIP than MoL
South Africa Beer and wine are more affordable in South Africa
than most LMICs Gin and whisky are amongst the most affordable in
the developing world Alcohol is more affordable in South Africa than some
HICs
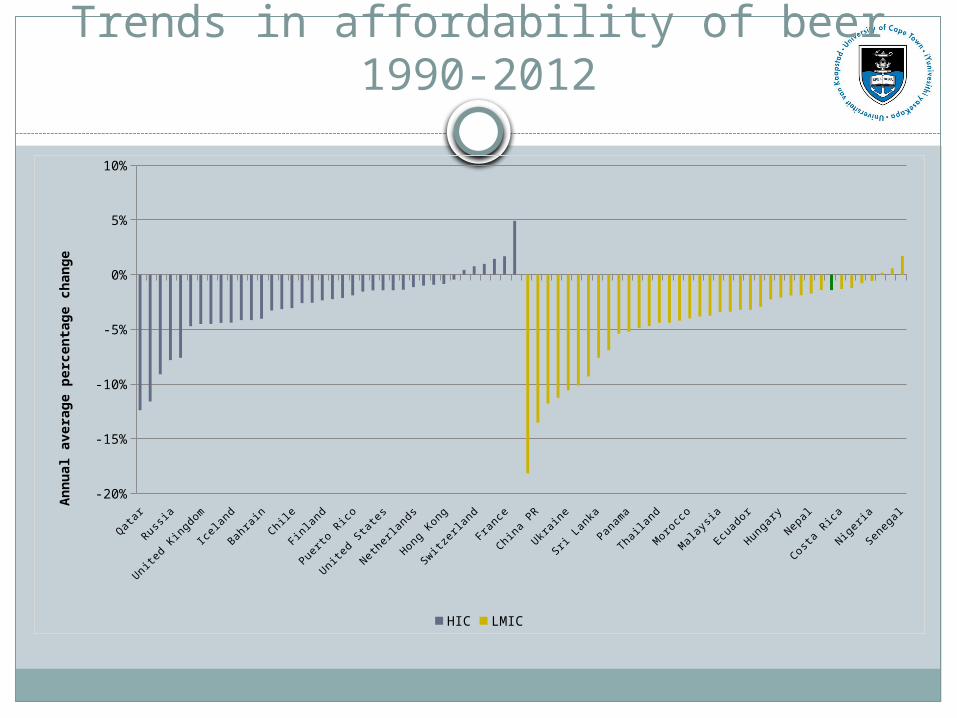
Trends in affordability of beer 1990-2012
Qatar
Poland
Korea
United Kingd
om
Sinag
pore
Norway
Bahrai
n
Luxe
mbourg
Greece
Finlan
dIsr
ael
Denmark
United St
ates
Australi
aIta
ly
Hong Kong
Japan
Austria
France
Romania
Bulgaria
Ukraine
Kazakh
stan
Tunisi
a
Panam
a
Cote d'Iv
oire
Indonesia
Morocc
oBraz
il
Colombia
Ecuad
or
Serb
ia
Bangla
deshNep
al
South
Africa
Philippines
Nigeria
Argentina
-20%
-15%
-10%
-5%
0%
5%
10%
HIC LMIC
Annu
al a
vera
ge p
erce
ntag
e ch
ange

Trends in affordability of wine 1990-2012
Slova
kia
Greece
Poland
Norway
Bahrai
n
United St
ates
Portuga
l
Sinag
pore
Swed
en
France
Russia
Australi
a
United Kingd
omIta
lyKorea
United Arab
Emira
tes
German
yIsr
ael
Spain
Ukraine
Romania
Vietnam
Ecuad
or
Colombia
Malaysi
a
Venezu
elaNep
alBraz
il
Kazakh
stan
Philippines
Cote d'Iv
oire
Mexico
Costa Rica
South
Africa
Turke
yPeru
Paragu
ay-25%
-20%
-15%
-10%
-5%
0%
5%
10%
HIC LMIC
Aver
age
annu
al p
erce
ntag
e ch
ange

Trends in affordability of gin 1990-2012
Poland
Finlan
d
Switz
erlan
d
Norway
Slova
kia
Sinag
pore
Portuga
l
Swed
enIsr
ael
Italy
Chile
Belgium
Japan
Netherl
ands
United Kingd
om
New Ze
aland
German
y
Puerto Rico
Urugu
ay
Azerbaij
an
China PR
India
Bulgaria
Vietnam
Panam
a
Nigeria Peru
Algeria
Hungary
Nepal
Costa Rica
Turke
y
South
Africa
Ecuad
or
Colombia
Cote d'Iv
oire
Venezu
ela-30%
-25%
-20%
-15%
-10%
-5%
0%
5%
10%
HIC LMIC
Aver
age
Annu
al P
erce
ntag
e Ch
ange
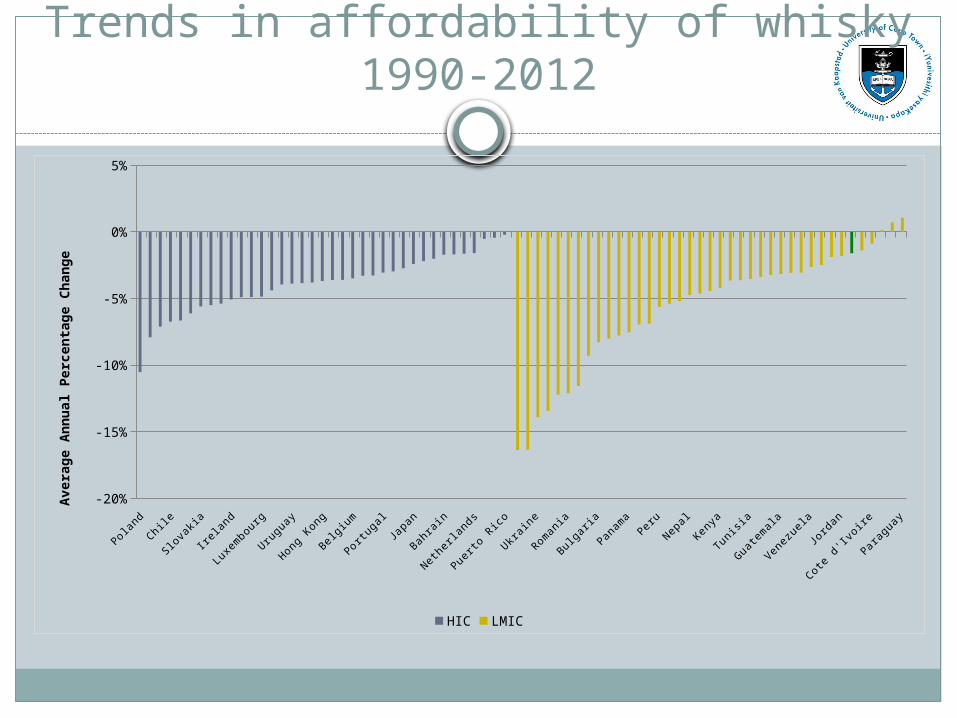
Trends in affordability of whisky 1990-2012
Poland
Korea
Czech Rep
Slova
kia
Norway
Finlan
d
Luxe
mbourg
New Ze
aland
Austria
Hong Kong
Australi
a
United Kingd
om
Portuga
l
Canad
a
Icelan
d
Bahrai
n
United St
ates
German
y
Puerto Rico
Uzbek
istan
China PR
Romania
Nigeria
Hungary
Panam
aBraz
il
Malaysi
aNep
al
Mexico
Serb
ia
Tunisi
a
Seneg
al
Bangla
desh
Venezu
ela
Camero
on
South
Africa
Cote d'Iv
oire
Ecuad
or-20%
-15%
-10%
-5%
0%
5%
HIC LMIC
Aver
age
Annu
al P
erce
ntag
e Ch
ange

Summary
Trends in affordability (1990-2012) Beer and wine became more affordable in the majority
of HICs and LMICs Gin and whisky became more affordable in all HICs Gin and whisky became more affordable in the
majority of LMICsSouth Africa
All products became more affordable However, they became more affordable at a slower
rate than most LMICs
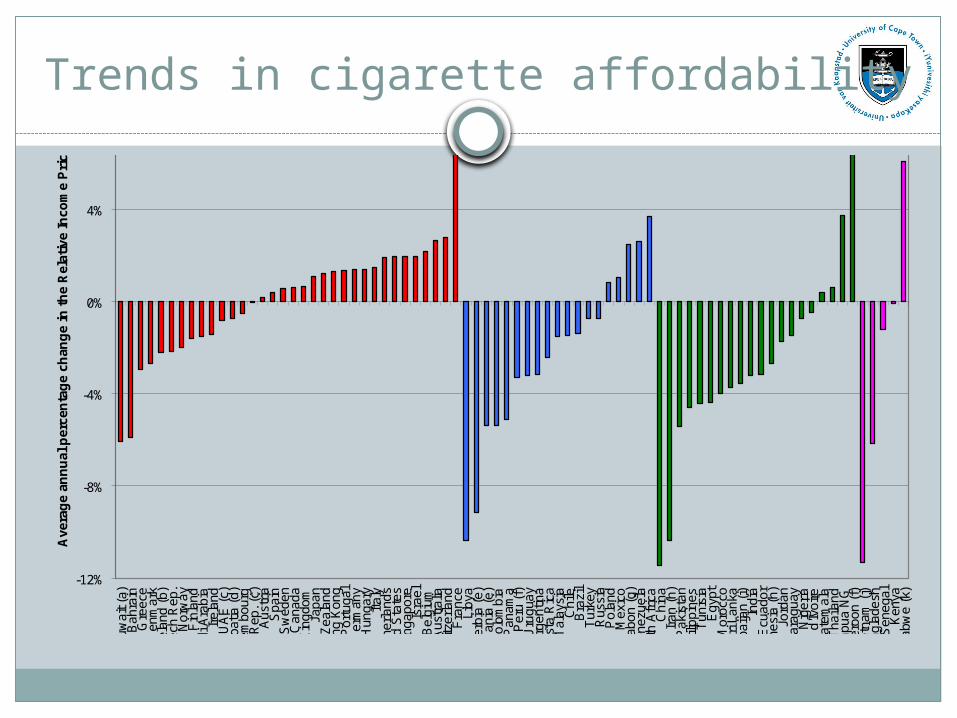
Trends in cigarette affordability
-12%
-8%
-4%
0%
4%
8%K
uwai
t (a
)B
ahra
inG
reec
eD
enm
ark
Icel
and
(b)
Cze
ch R
ep.
Nor
way
Fin
land
Sau
di A
rabi
aIr
elan
dU
AE
(c)
Cro
atia
(d)
Luxe
mbo
urg
Kor
ea R
ep.
(c)
Aus
tria
Spa
inS
wed
enC
anad
aU
nite
d K
ingd
omJa
pan
New
Zea
land
Hon
g K
ong
Por
tuga
lG
erm
any
Hun
gary
Ital
yN
ethe
rland
sU
nite
d S
tate
sS
inga
pore
Isra
elB
elgi
umA
ustr
alia
Sw
itzer
land
Fra
nce
Liby
aS
erbi
a (e
)R
oman
ia (
e)C
olom
bia
Pan
ama
Per
u (f
)U
rugu
ayA
rgen
tina
Cos
ta R
ica
Mal
aysi
aC
hile
Bra
zil
Tur
key
Rus
sia
Pol
and
Mex
ico
Gab
on (
g)V
enez
uela
Sou
th A
fric
aC
hina
Iran
(h)
Pak
ista
nP
hilip
pine
sT
unis
iaE
gypt
Mor
occo
Sri
Lank
aA
zerb
aija
n (i)
Indi
aE
cuad
orIn
done
sia
(h)
Jord
anP
arag
uay
Nig
eria
Cot
e d'
Ivoi
reG
uate
mal
aT
haila
ndP
apua
NG
Cam
eroo
n (f
)V
ietn
am (
j)B
angl
ades
hS
eneg
alK
enya
Zim
babw
e (k
)
Ave
rag
e an
nu
al p
erce
nta
ge
chan
ge
in t
he
Rel
ativ
e In
com
e P
rice
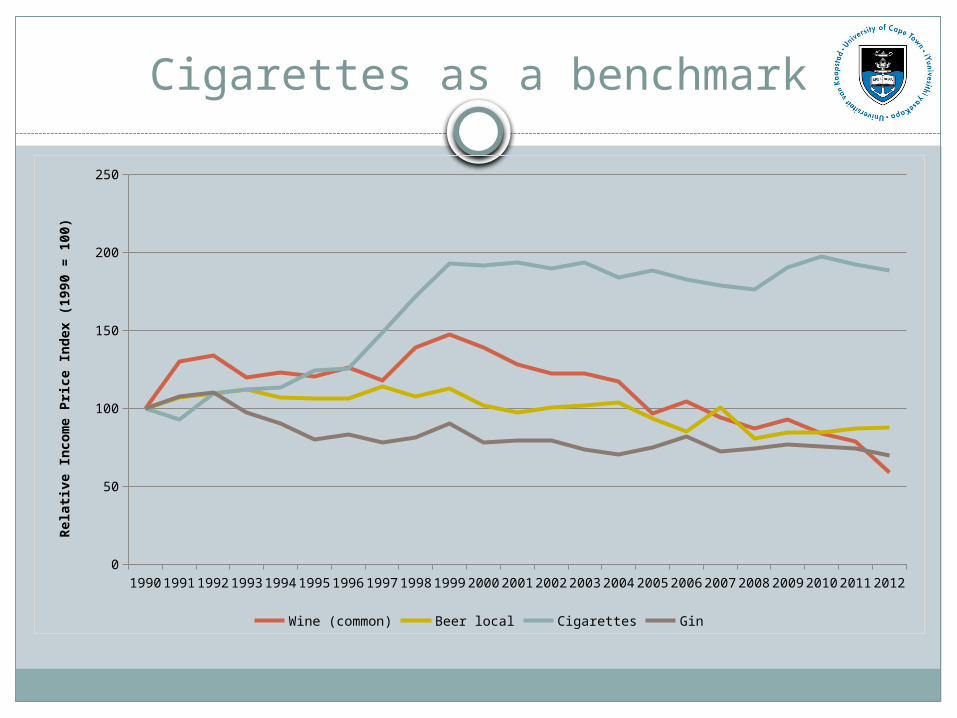
Cigarettes as a benchmark
1990 1991 1992 1993 1994 1995 1996 1997 1998 1999 2000 2001 2002 2003 2004 2005 2006 2007 2008 2009 2010 2011 20120
50
100
150
200
250
Wine (common) Beer local Cigarettes Gin
Rela
tive
Inco
me
Price
Inde
x (1
990
= 10
0)
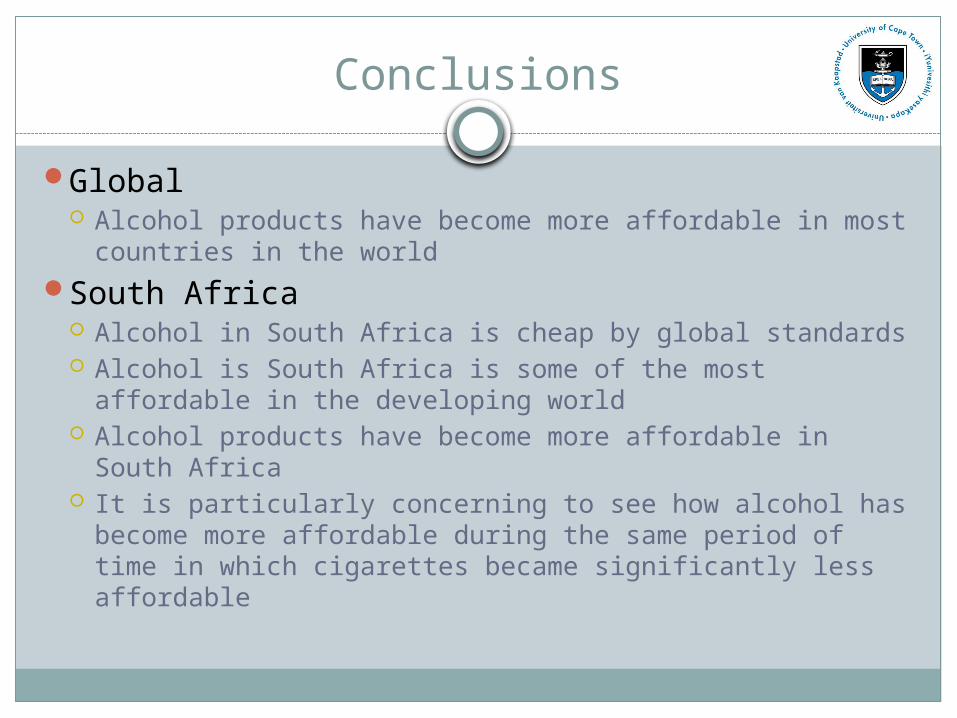
Conclusions
Global Alcohol products have become more affordable in most
countries in the worldSouth Africa
Alcohol in South Africa is cheap by global standards Alcohol is South Africa is some of the most affordable in
the developing world Alcohol products have become more affordable in
South Africa It is particularly concerning to see how alcohol has
become more affordable during the same period of time in which cigarettes became significantly less affordable
Recommended