Air Service Development UpdateNovember 16, 2015
British Airways announces SJC‐LHR service
• Daily service on Boeing 787‐9• Launch date of May 4, 2016
SJC Air Service Development: Overview
Strategic Objective:
Address domestic and international opportunities to meet market demand through:
1) Viable airline options (right carrier)2) Profitable and sustainable aircraft fleets (right
aircraft)3) Value‐added service (right fit)4) Proper timing of implementation (right time)
SJC Air Service Development: Challenges
Regulatory: Nation‐nation bilateralsAirport slot or mileage constraintsJV’s and anti‐trust immunityFreedoms of the Air
Competition: International and fortress hubsHigh‐focus corridorsAlliances influenceHighly motivated cities (subsidies)

Aircraft cost ($80 ‐ $300 mil)Operating cost ($60,000 ‐ $300,000)Effect of “cannibalization”Opportunity/competitive cost (???)
Economic Impact: $100+ mil/year
Airline Financial Hurdles:

Air Service Development: Activity Summary
Airline Headquarters Meetings:
18
Local HDQStaff SiteVisits:15
AirlineConferences/Meetings:
7
Total Points ofContact:470
Total AirlinesEngaged:
41
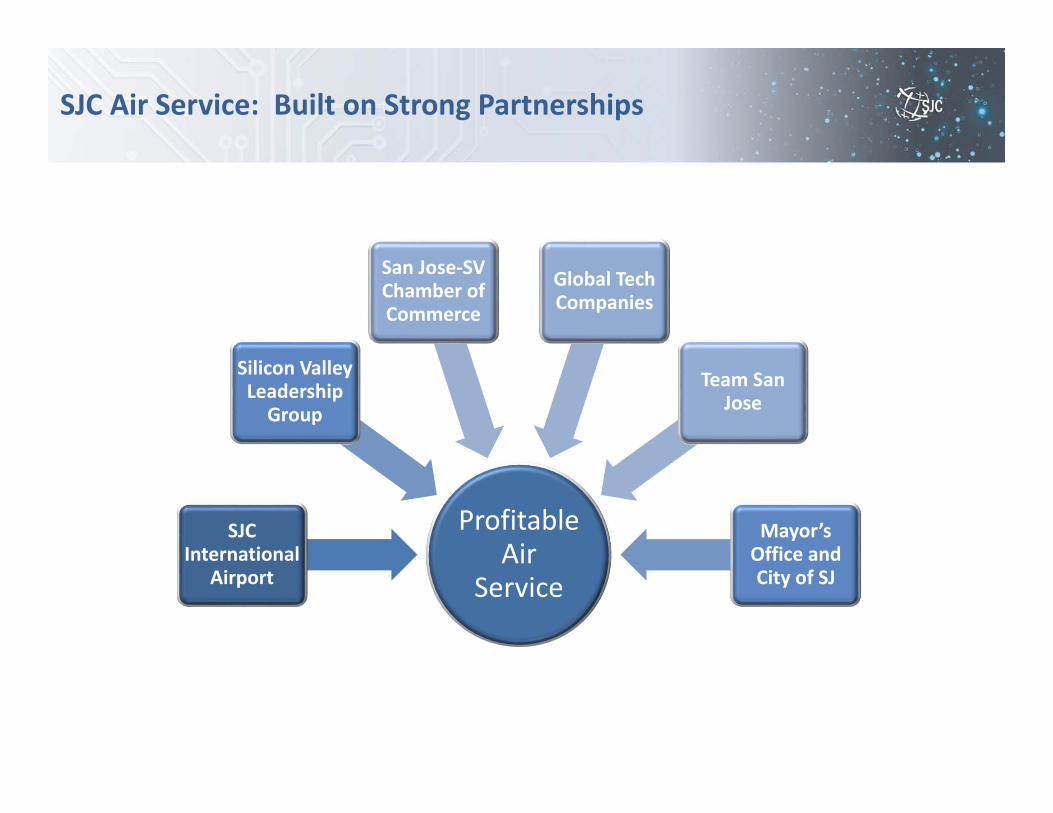
SJC Air Service: Built on Strong Partnerships
Profitable Air
Service
SJC International
Airport
Silicon Valley Leadership Group
San Jose‐SV Chamber of Commerce
Global Tech Companies
Team San Jose
Mayor’s Office and City of SJ
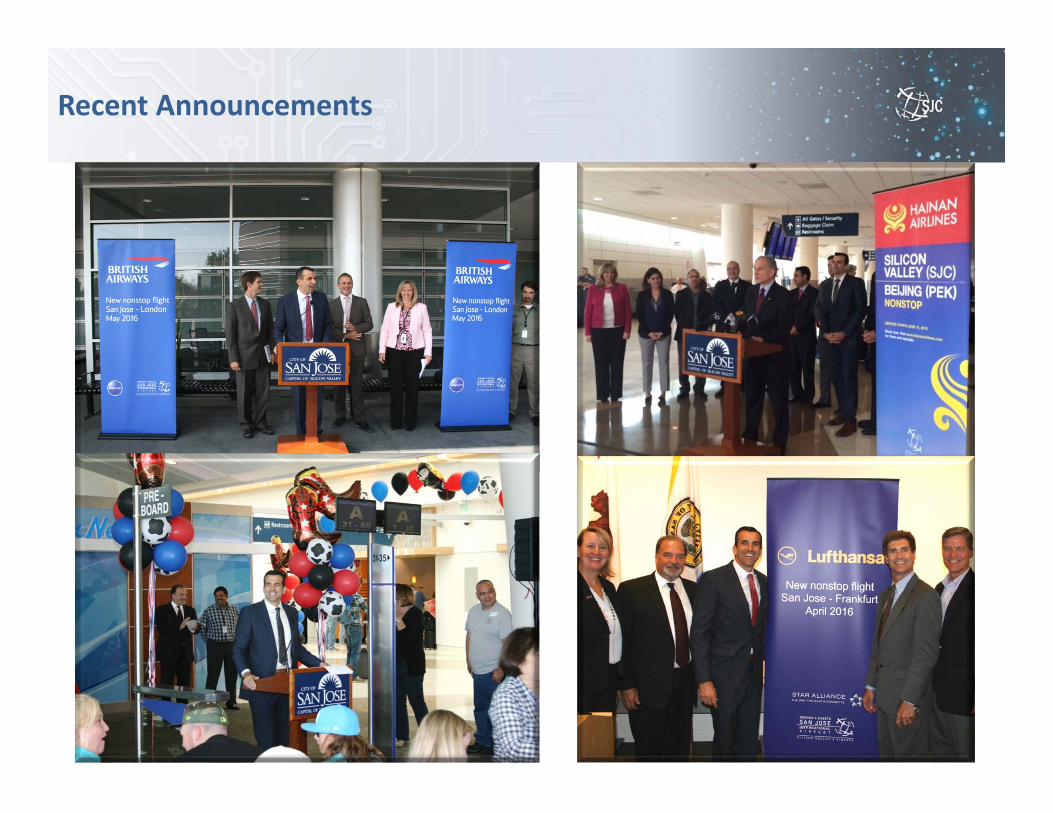
Recent Announcements

International Service Profiles
• Hainan Airlines launches SJC‐PEK service• 5x/week on Boeing 787‐8• Launch date of June 15, 2015
• British Airways announces SJC‐LHR service• Daily service on Boeing 787‐9• Launch date of May 4, 2016
• Lufthansa announces SJC‐FRA service• 5x/week service on Airbus A340‐300• Launch date of April 29, 2016
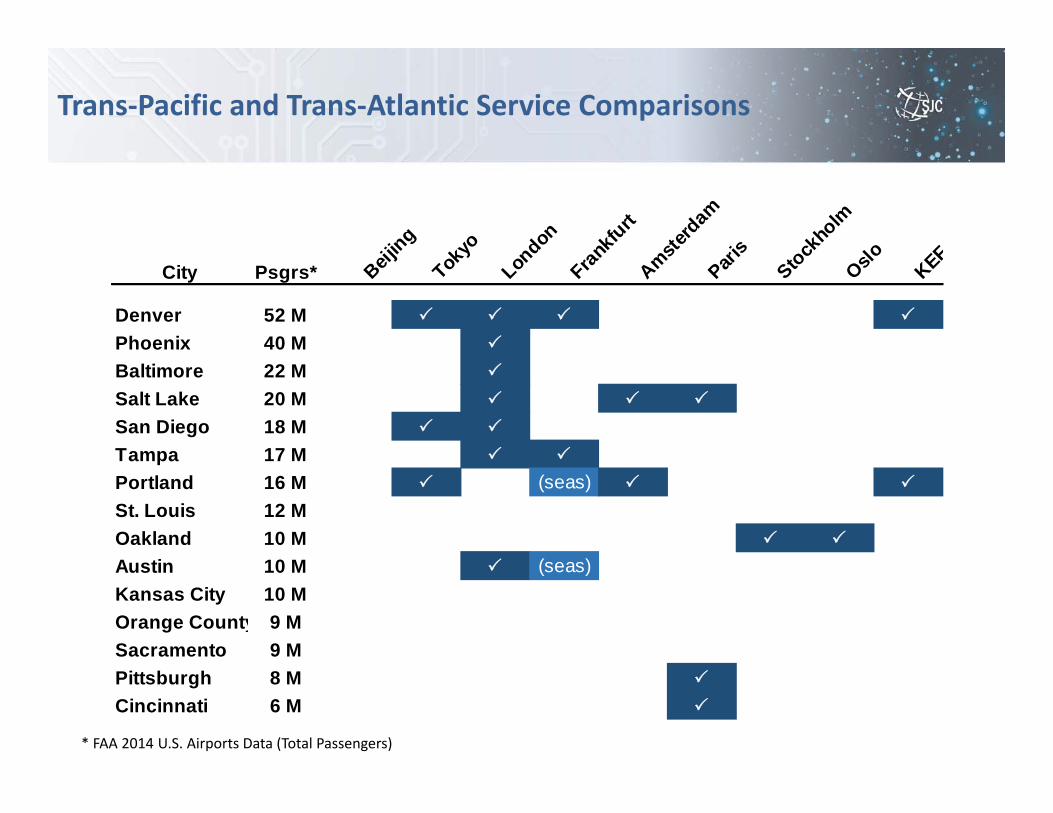
Trans‐Pacific and Trans‐Atlantic Service Comparisons
City Psgrs* Beijing
Tokyo
London
Frankfu
rtAmste
rdam
Paris
Stockho
lmOslo KEF
Denver 52 M
Phoenix 40 M
Baltimore 22 M
Salt Lake 20 M
San Diego 18 M
Tampa 17 M
Portland 16 M (seas)
St. Louis 12 MOakland 10 M
Austin 10 M (seas)Kansas City 10 MOrange County 9 MSacramento 9 MPittsburgh 8 M
Cincinnati 6 M
* FAA 2014 U.S. Airports Data (Total Passengers)

City Psgrs* Beijing
Tokyo
London
Frankfu
rtAmste
rdam
Paris
Stockho
lmOslo KEF
Denver 52 M
Phoenix 40 M
Baltimore 22 M
Salt Lake 20 M
San Diego 18 M
Tampa 17 M
Portland 16 M (seas)
St. Louis 12 MOakland 10 M
Austin 10 M (seas)Kansas City 10 MSJC 9 M
Orange County 9 MSacramento 9 MPittsburgh 8 M
Cincinnati 6 M
Trans‐Pacific and Trans‐Atlantic Service Comparisons
12
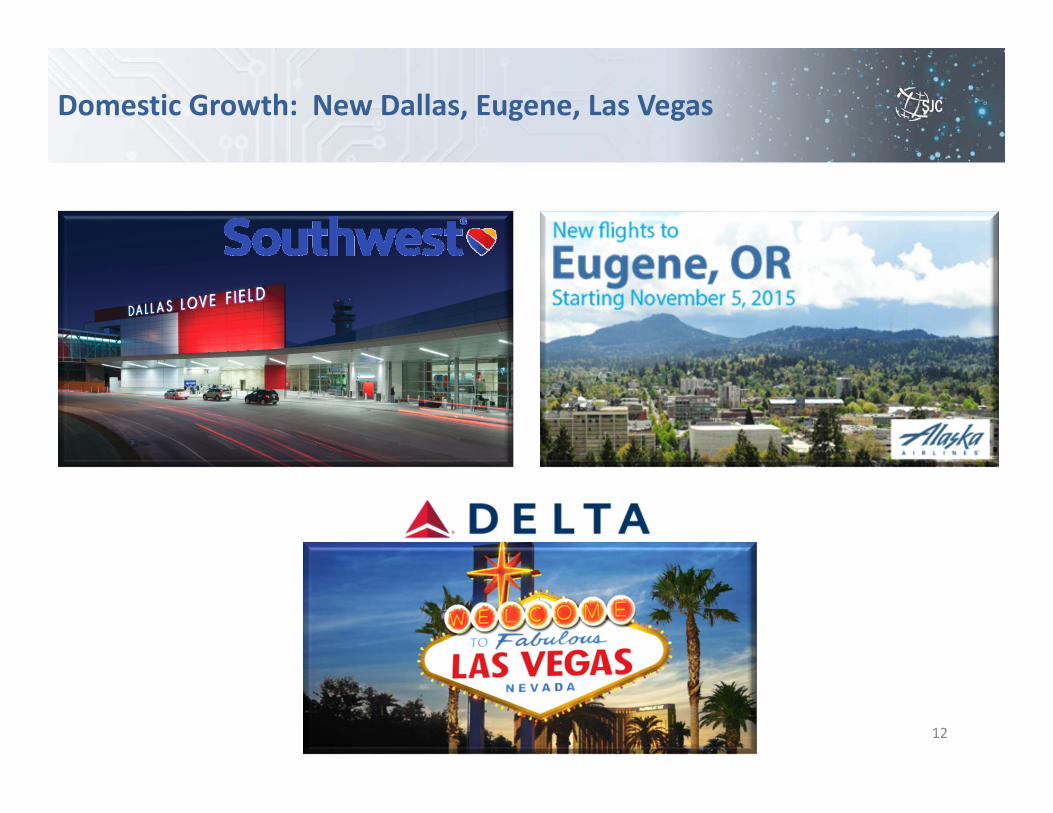
Domestic Growth: New Dallas, Eugene, Las Vegas
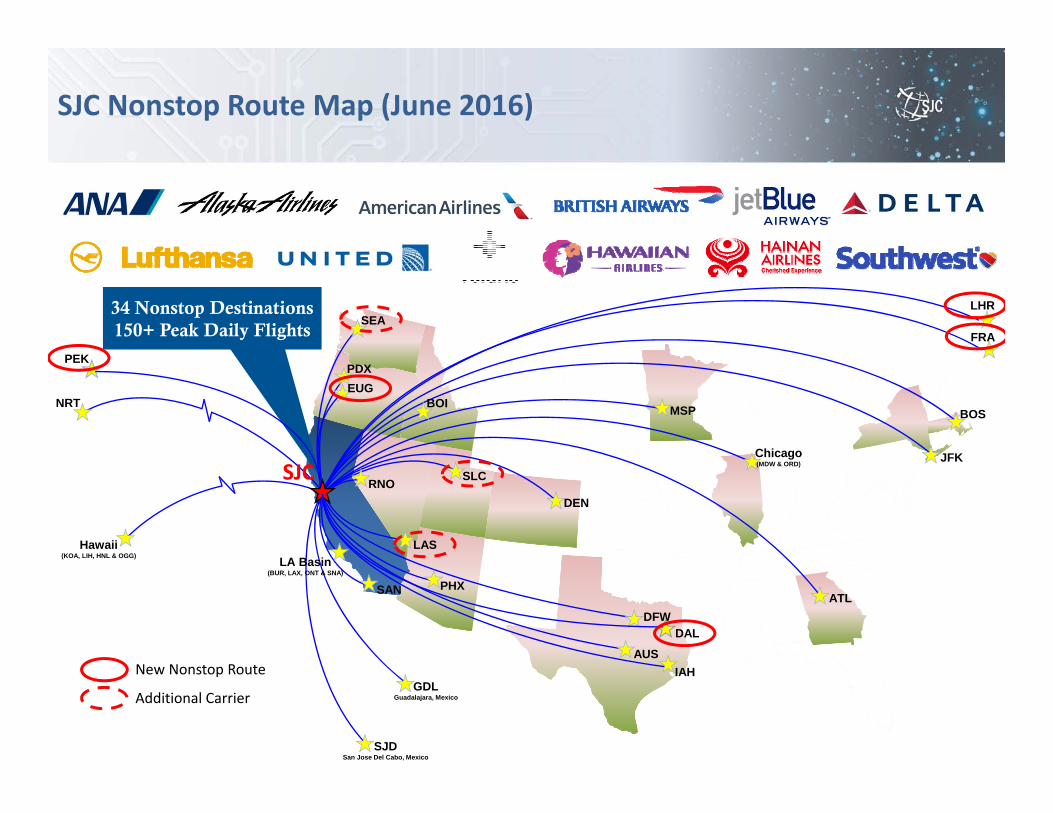
SJC Nonstop Route Map (June 2016)
IAH
LAS
ATL
AUS
DEN
DFW
BOS
GDLGuadalajara, Mexico
Hawaii(KOA, LIH, HNL & OGG)
JFK
MSP
Chicago(MDW & ORD)
PDX
SAN
SEA
SJDSan Jose Del Cabo, Mexico
BOI
SLCRNO
PHX
LA Basin(BUR, LAX, ONT & SNA)
34 Nonstop Destinations150+ Peak Daily Flights
NRT
SJC
DAL
PEK
LHR
EUG
FRA
New Nonstop Route
Additional Carrier
0
100,000
200,000
300,000
400,000
500,000
600,000
700,000
800,000
900,000
1,000,000
Jan Feb Mar Apr May Jun Jul Aug Sep Oct Nov Dec2012 2013 2014 2015
Calendar Year
Total Passengers
Year-Year
Cumulative Increase
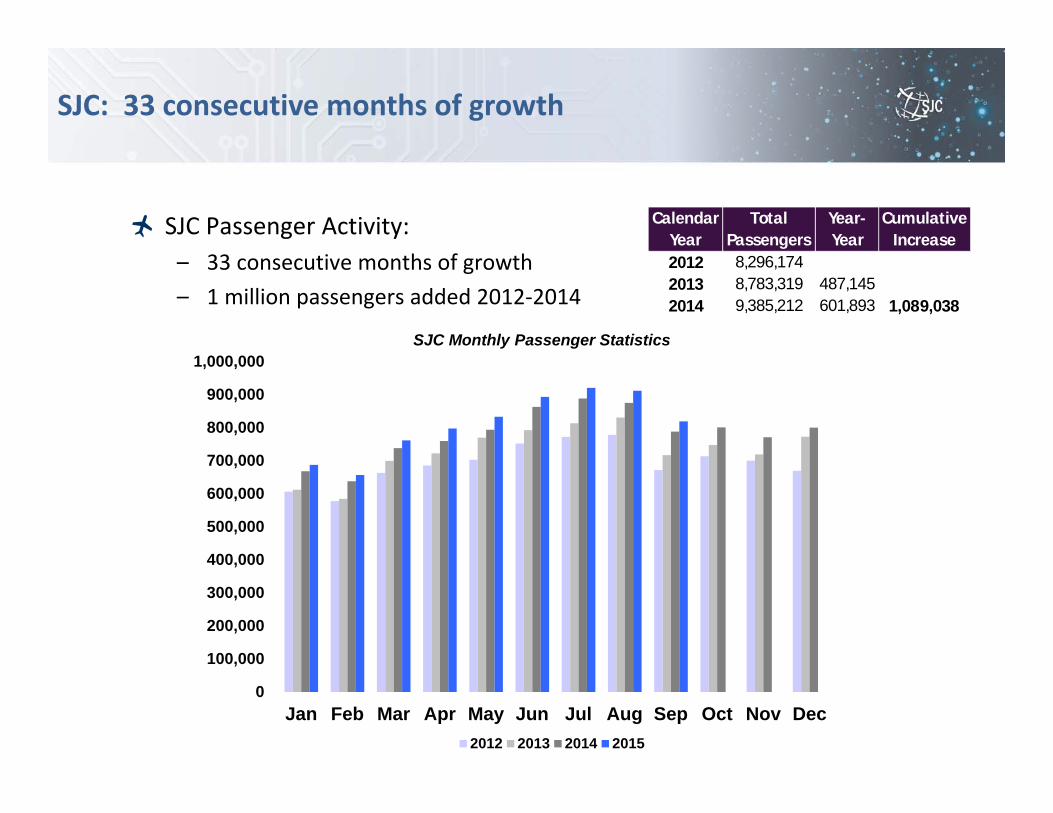
2012 8,296,1742013 8,783,319 487,1452014 9,385,212 601,893 1,089,038
SJC: 33 consecutive months of growth
SJC Monthly Passenger Statistics
SJC Passenger Activity:– 33 consecutive months of growth – 1 million passengers added 2012‐2014
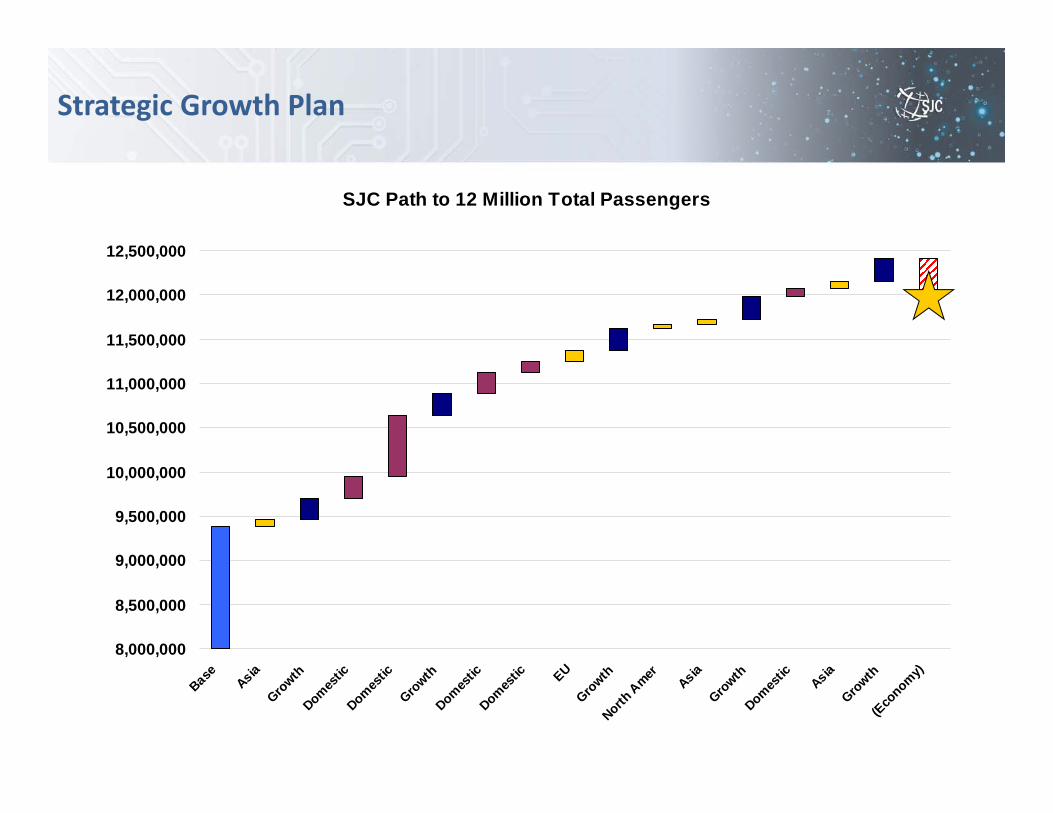
SJC Path to 12 Million Total Passengers
8,000,000
8,500,000
9,000,000
9,500,000
10,000,000
10,500,000
11,000,000
11,500,000
12,000,000
12,500,000
Base AsiaGro
wthDomes
ticDomes
ticGro
wthDomes
ticDomes
tic EUGro
wthNorth
Amer
AsiaGro
wthDomes
tic AsiaGro
wth(E
conomy)
Strategic Growth Plan
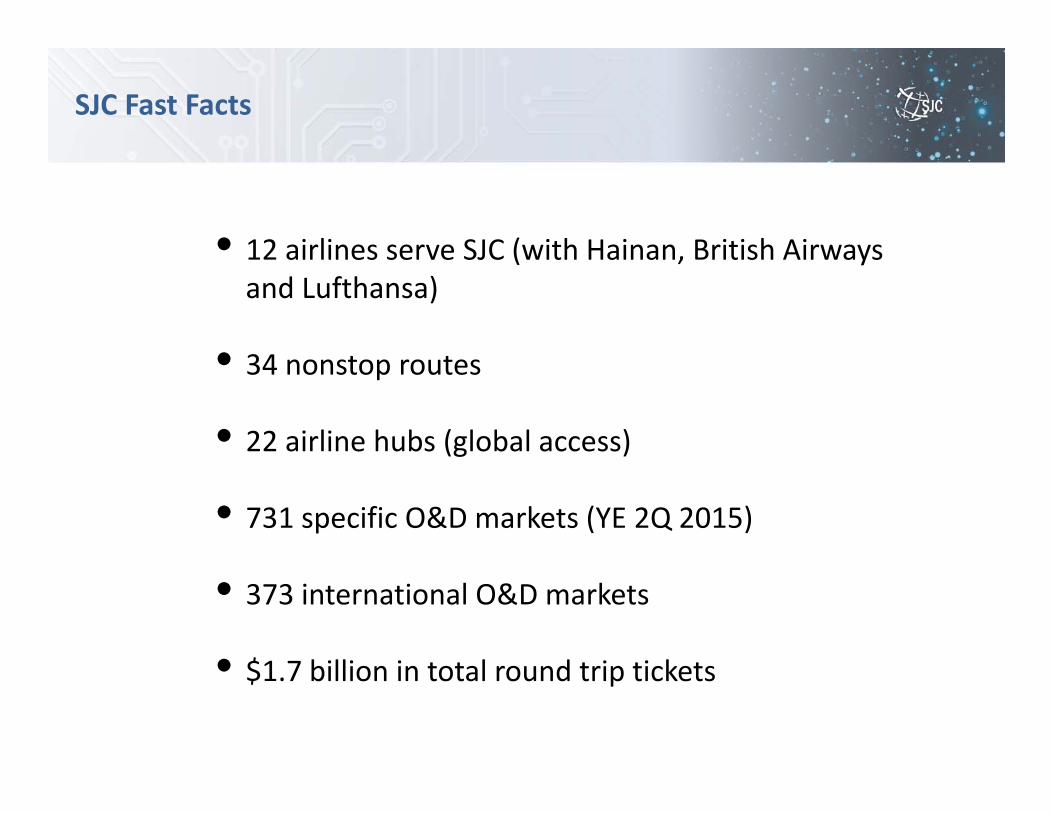
SJC Fast Facts
• 12 airlines serve SJC (with Hainan, British Airways and Lufthansa)
• 34 nonstop routes
• 22 airline hubs (global access)
• 731 specific O&D markets (YE 2Q 2015)
• 373 international O&D markets
• $1.7 billion in total round trip tickets

Thank You!
Recommended