AIM modeling and recent on-going research activities
Shinichiro Fujimori and Tomoko Hasegawa
National Institute for Environmental Studies
24th, October, 2017
FEEM seminar @Millan, Italy
Outline
• AIM modeling team✓History of AIM
✓ Team organization
• Recent activities✓ Asian climate mitigation policy assessment
✓ Climate change impact economics
✓Global land use and agricultural modeling in AIM
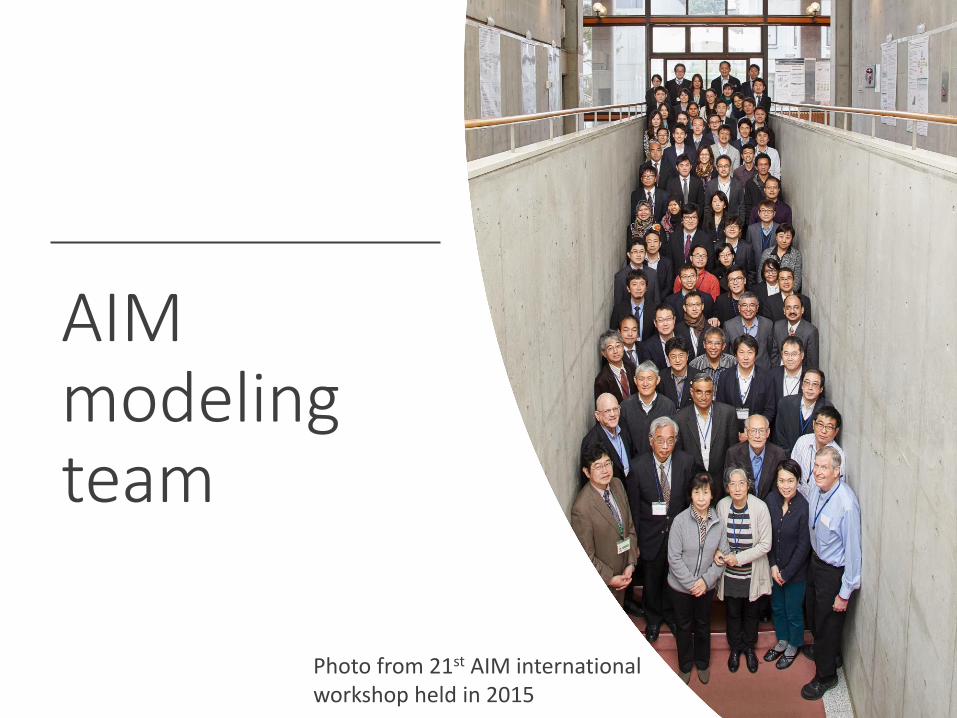
AIM modeling team
Photo from 21st AIM international workshop held in 2015
UKI
NIES
KEISNU
ERI
FEEM, IIASA, PBL,
PIK, PNNL, CIRED
Kyoto UNIV.
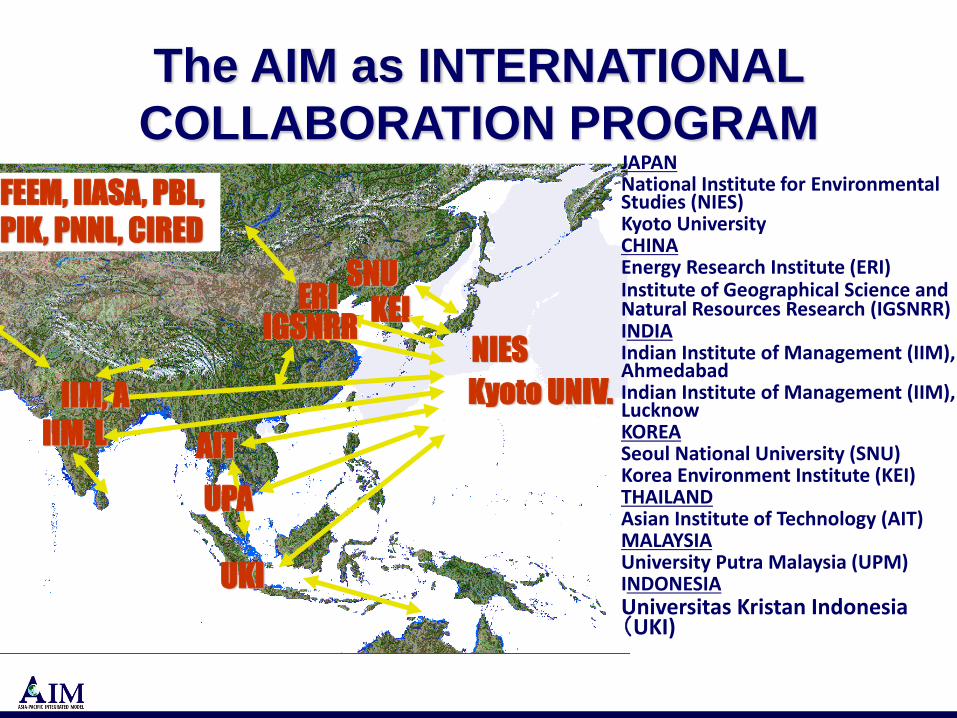
The AIM as INTERNATIONAL
COLLABORATION PROGRAMJAPANNational Institute for Environmental Studies (NIES)Kyoto UniversityCHINAEnergy Research Institute (ERI)Institute of Geographical Science and Natural Resources Research (IGSNRR)INDIAIndian Institute of Management (IIM), AhmedabadIndian Institute of Management (IIM), LucknowKOREASeoul National University (SNU)Korea Environment Institute (KEI)THAILANDAsian Institute of Technology (AIT)MALAYSIAUniversity Putra Malaysia (UPM)INDONESIAUniversitas Kristan Indonesia(UKI)
IGSNRR
AIT
UPA
IIM, A
IIM, L

AIM brief history (1)
1992 First AIM/Enduse model development
1993 Long-term emissions scenario development
1996 1st AIM international workshop
1997 1st AIM training workshop
1998 CGE model development • IPCC SRES
• IS92 scenario
• GEO22000
1990 AIM project launchedImpact Model development
• IPCC SAR
International activity National activity
• EMF
• IPCC TAR2001 AIM/Enduse[global] model development
• Carbon tax policy
• Japan Kyoto Protocol emissions target assessment
Dawn
International participation and growing
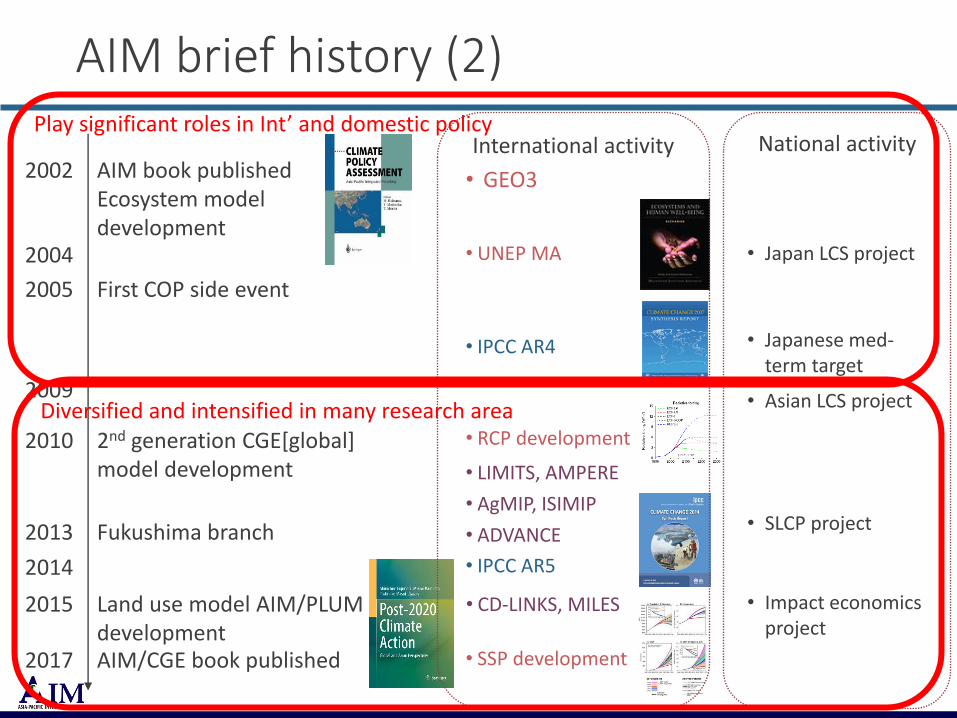
AIM brief history (2)
2002 AIM book publishedEcosystem model development
2004
2005 First COP side event
2009
2010 2nd generation CGE[global] model development
• IPCC AR5
2013 Fukushima branch
• Japan LCS project• UNEP MA
• Asian LCS project
• IPCC AR4
2014
• Impact economics project
2015 Land use model AIM/PLUMdevelopment
• RCP development
• LIMITS, AMPERE
• ADVANCE
• CD-LINKS, MILES
2017 AIM/CGE book published
• AgMIP, ISIMIP• SLCP project
• SSP development
• Japanese med-term target
• GEO3
National activityInternational activityPlay significant roles in Int’ and domestic policy
Diversified and intensified in many research area
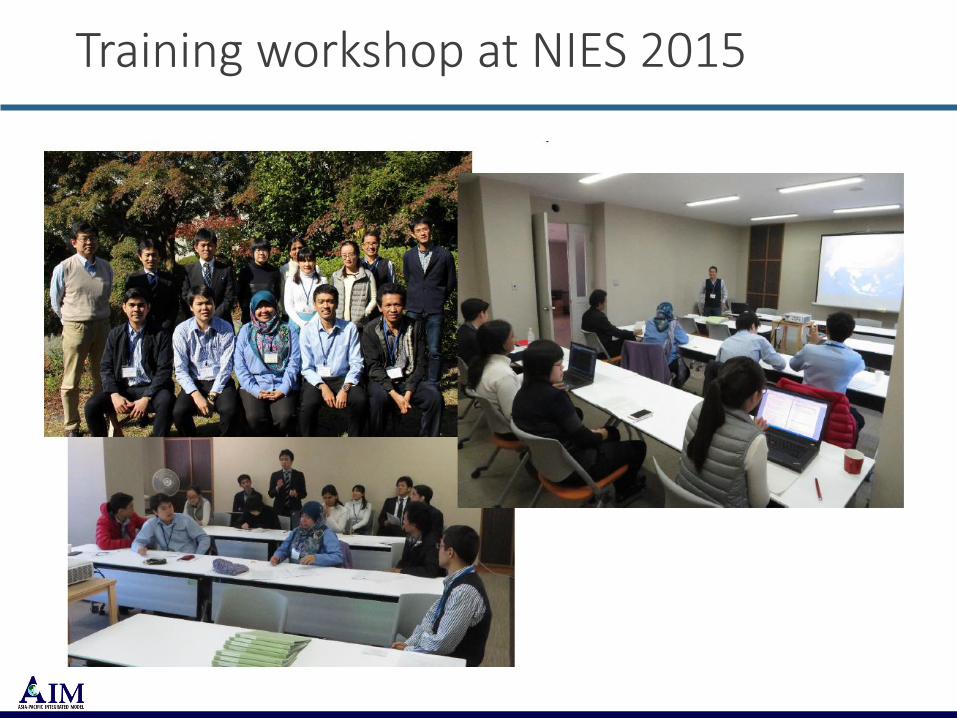
Training workshop at NIES 2015

Who we are
• Core institution✓ NIES ✓ Kyoto University ✓ MHIR (consultant company)
• NIES✓ 23 researchers (including postdoc)✓ Internal and external funding from Ministry of
Environment Japan✓ Current main externally funded projects
➢ Climate mitigation and SDGs long-term scenario➢ Climate change impact economic assessment➢ Short lived climate pollutants assessment➢ Local low carbon scenario development
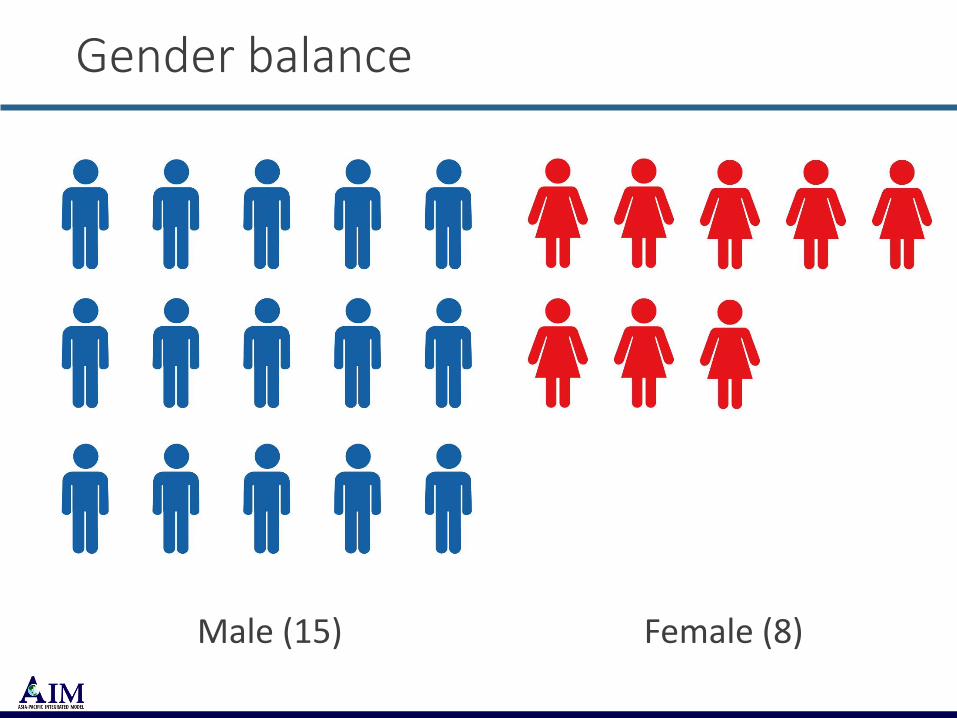
Gender balance
Male (15) Female (8)
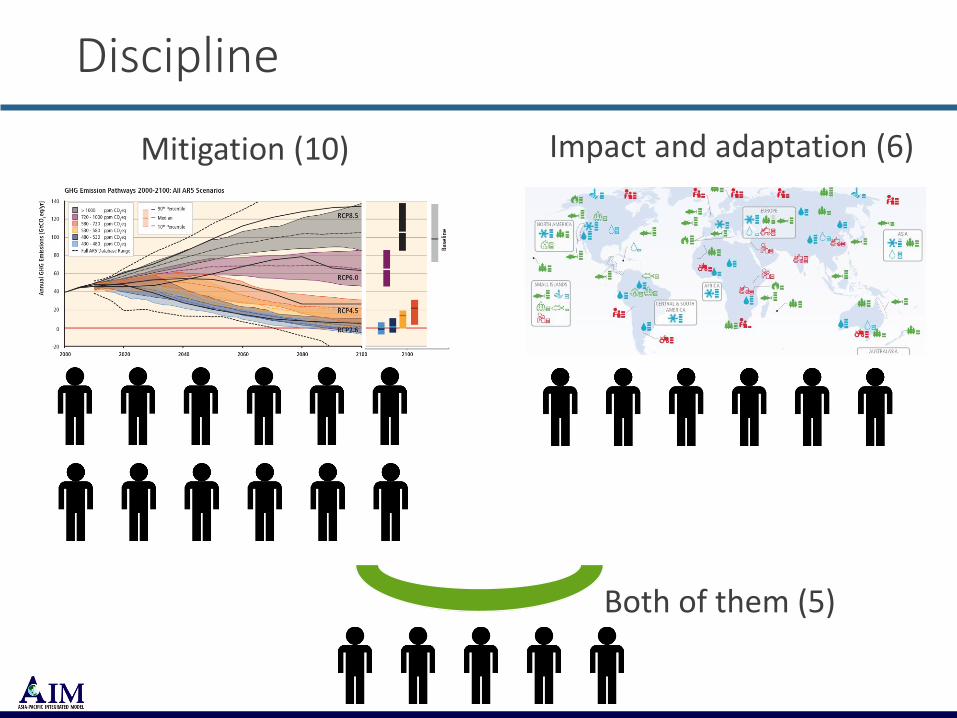
Discipline
Impact and adaptation (6)Mitigation (10)
Both of them (5)

Research area
Global (13) National (7)
Subnational (3)
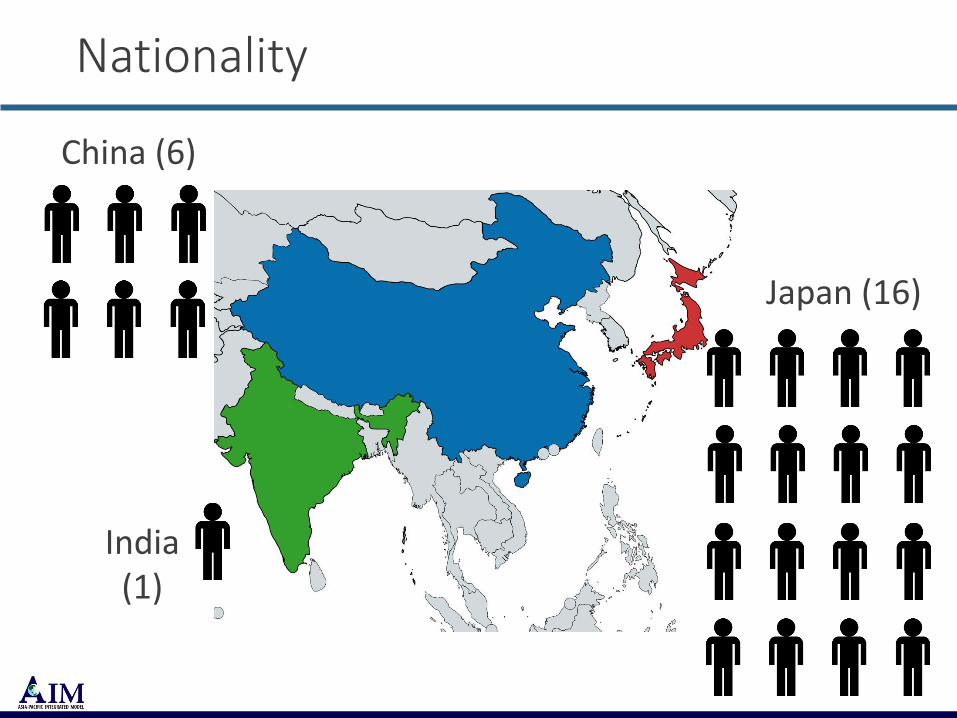
Nationality
Japan (16)
China (6)
India (1)
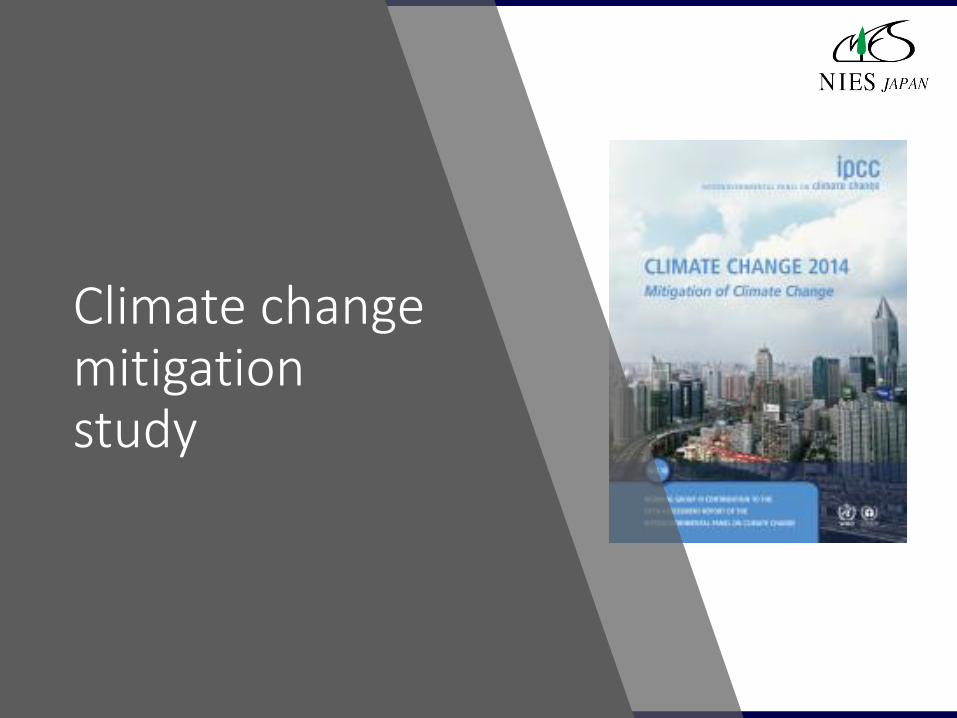
Climate change mitigation study

Recursive Dynamic
Economic model
AIM/CGE
Land allocation model
AIM/PLUM
Emissions
downscaling AIM/DS
GHG and
air pollutant emissions
Biomass
supply curve
Gridded emissions
Energy production
and consumption
6
8
10
12
14
16
0 100 200 300 400
Yiel
d (
tDM
/ha)
Area (Mha)
DICE type
optimization model
AIM/Dynamic
MAC curveGHG emissions
pathway
Biophysical
potential
Land use and
agriculture price Transport model
AIM/Transport
Energy and
carbon price
Transport and
energy demand
Simplified climate
MAGICC
Global mean
temperature
Gridded land
use
Enduse
information
AIM/AFOLU
MAC and
land use
Activity
AIM modeling (Mitigation)

AIM/CGE
• General equilibrium global economic model
• 43 industrial sectors (Energy and agriculture are highly disaggregated) and 17 region.
• Recursive dynamic
• Domestic and international market is assumed
• Emissions; CO2, CH4, N2O, SOx, NOx, CO, BC, OC, VOC, NH3
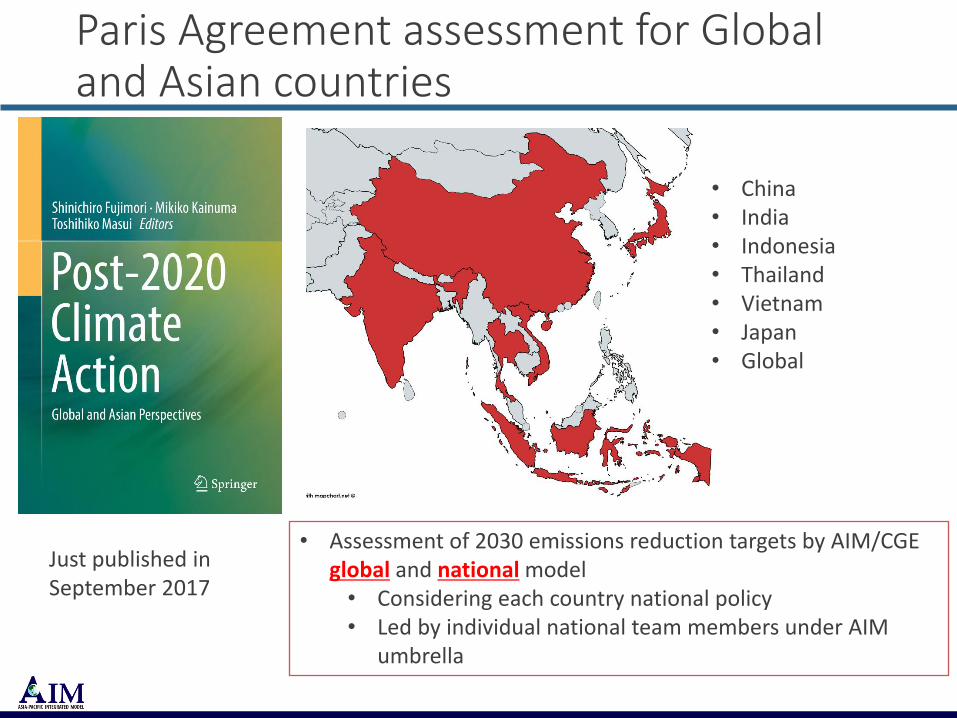
Paris Agreement assessment for Global and Asian countries
Just published in September 2017
• Assessment of 2030 emissions reduction targets by AIM/CGE global and national model• Considering each country national policy• Led by individual national team members under AIM
umbrella
• China• India• Indonesia• Thailand• Vietnam• Japan• Global

Indonesia energy Indonesia land use
Thailand Vietnam

Global studies
Fujimori et al., (2016) SpringerPlus
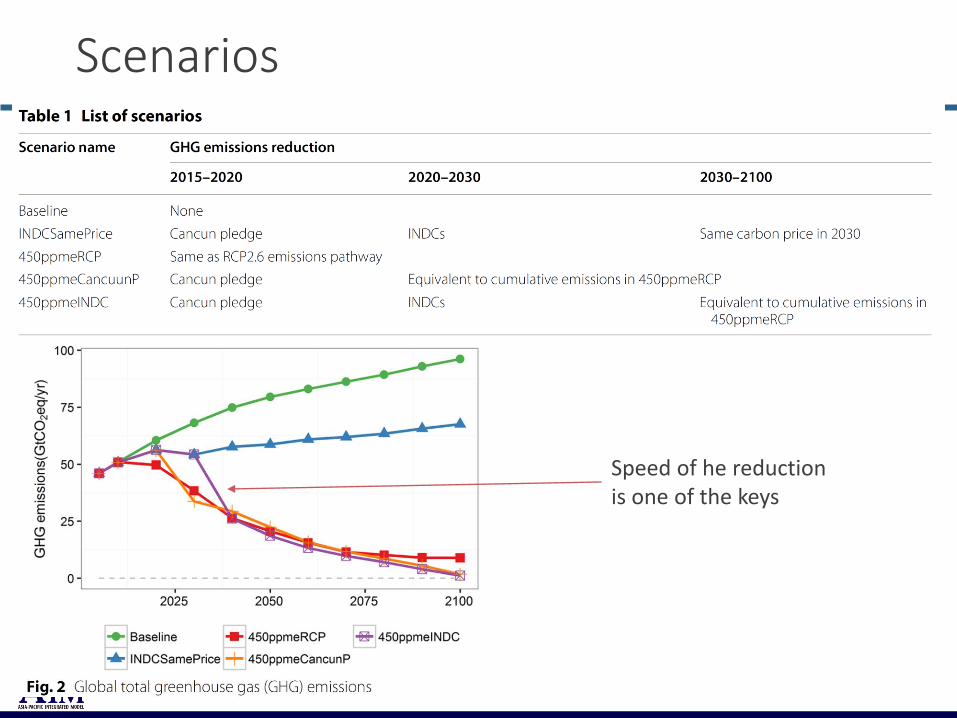
Scenarios
Speed of he reduction is one of the keys
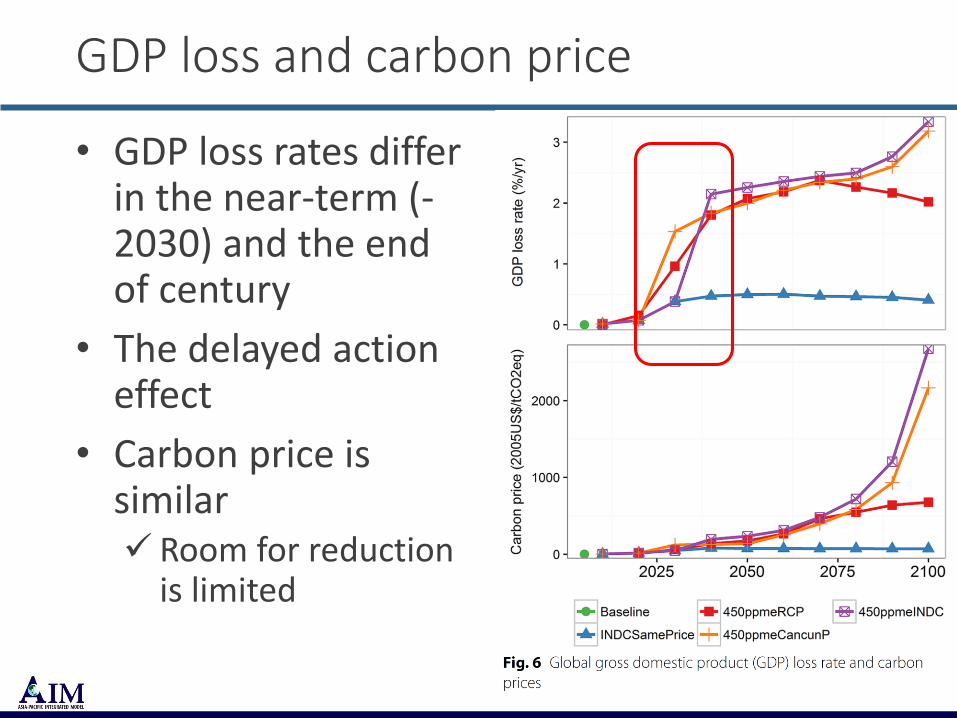
GDP loss and carbon price
• GDP loss rates differ in the near-term (-2030) and the end of century
• The delayed action effect
• Carbon price is similar✓ Room for reduction
is limited

GHG emissions in 2100
• Our immediate reduction scenario does not go negative CO2
• INDC and Cancun scenarios are almost same at the end of century.✓ Total GHG
emissions in 2100
Remarks
• Near-term✓ Rapid emissions reduction
• Long-term✓Negative emissions
✓ Land competition

Climate change impact economics
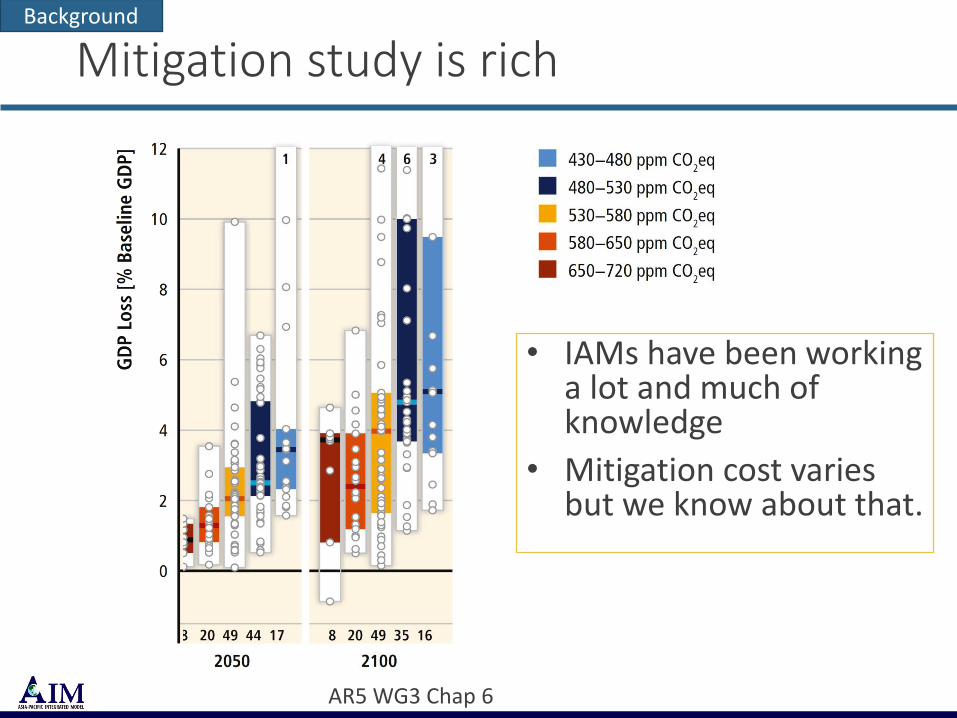
Mitigation study is rich
• IAMs have been working a lot and much of knowledge
• Mitigation cost varies but we know about that.
Background
AR5 WG3 Chap 6
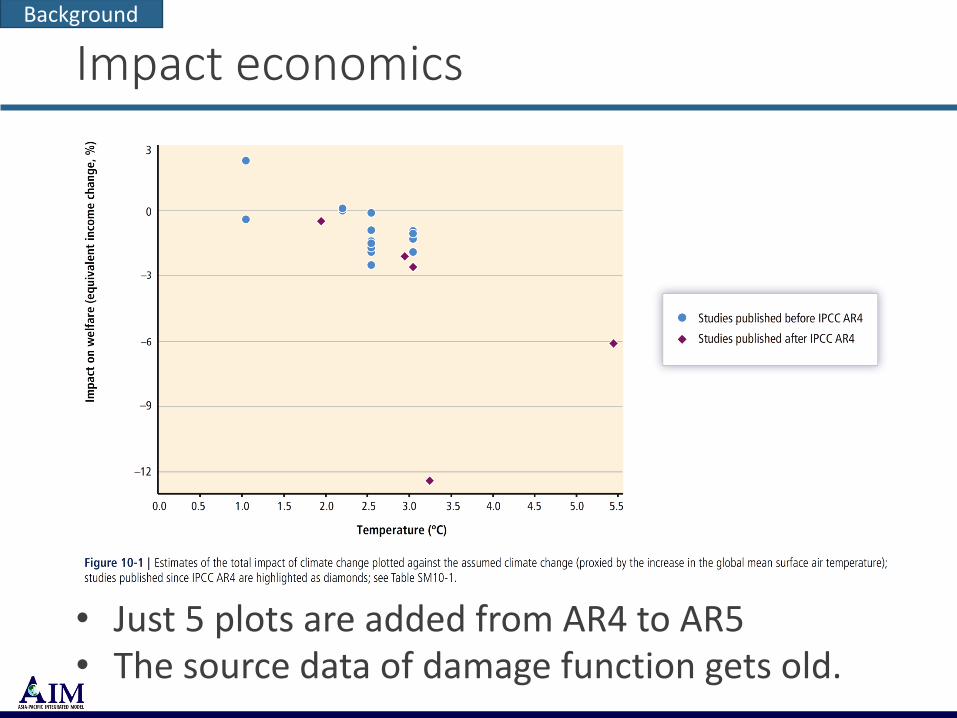
Impact economics
• Just 5 plots are added from AR4 to AR5• The source data of damage function gets old.
Background
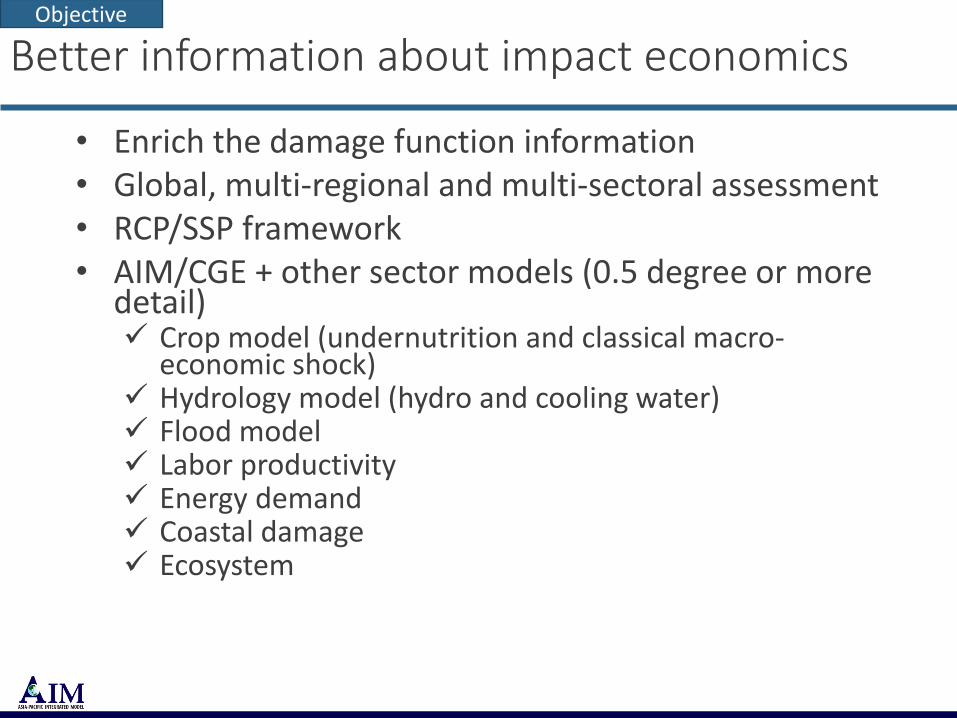
Better information about impact economics
• Enrich the damage function information• Global, multi-regional and multi-sectoral assessment• RCP/SSP framework• AIM/CGE + other sector models (0.5 degree or more
detail)✓ Crop model (undernutrition and classical macro-
economic shock)✓ Hydrology model (hydro and cooling water)✓ Flood model✓ Labor productivity ✓ Energy demand✓ Coastal damage✓ Ecosystem
Objective
28
SSPRCP
Climate
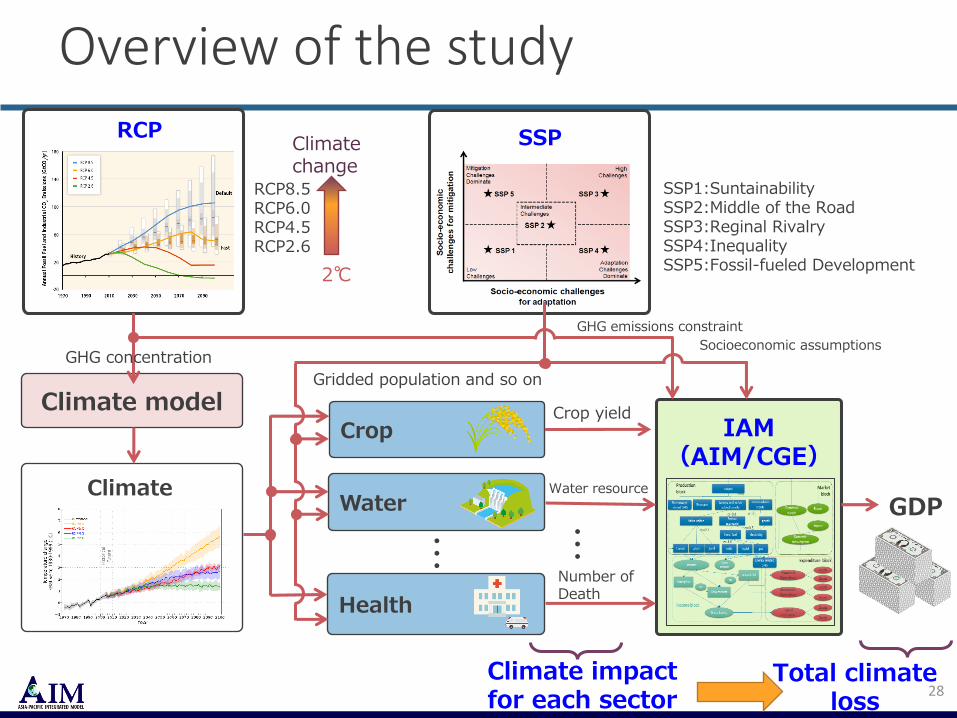
Overview of the study
IAM(AIM/CGE)
Climate change
2℃
RCP8.5RCP6.0RCP4.5RCP2.6
SSP1:SuntainabilitySSP2:Middle of the RoadSSP3:Reginal RivalrySSP4:InequalitySSP5:Fossil-fueled Development
Climate modelCrop
Water
Health
・・・
GHG emissions constraint
GHG concentration
Gridded population and so on
Socioeconomic assumptions
Climate impact for each sector
・・・
GDP
Crop yield
Water resource
Number of Death
Total climate loss
Energy demand

Methodology
• AIM/CGE coupled with an end-use type model• In the model, energy demand is changed according
HDD&CDD changes.
Socioeconomic
conditions
• Population
• GDP
AIM/CGE model
Economic impact
• GDP loss
• Consumption loss
Energy supply & demand
Technology changes &
costs
Gridded data
• Temperature
• Population
HDD & CDD
30
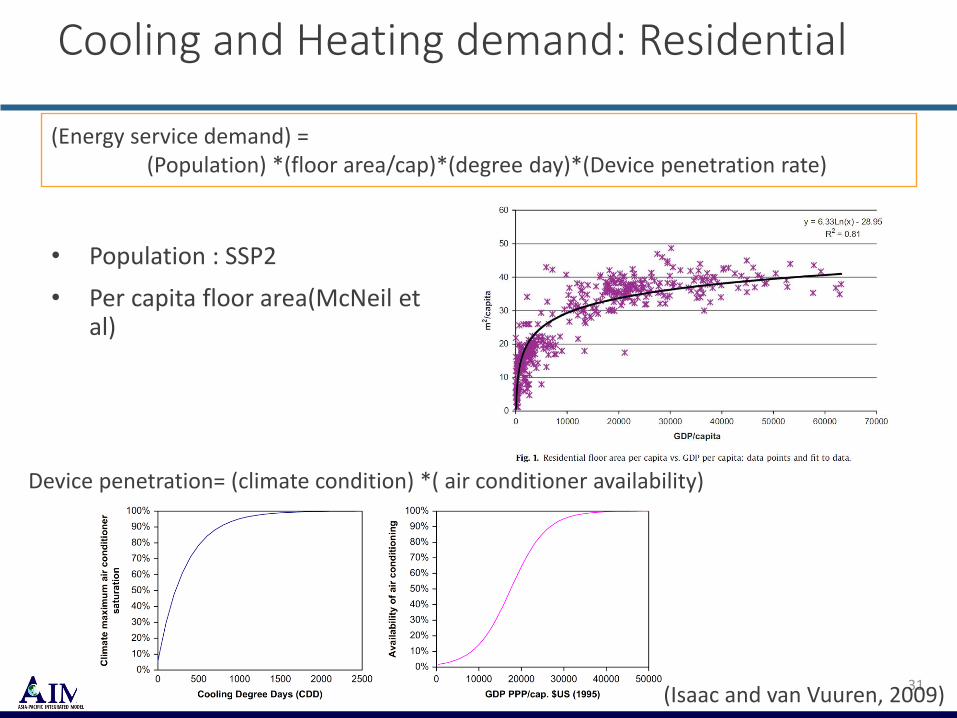
(Energy service demand) =(Population) *(floor area/cap)*(degree day)*(Device penetration rate)
• Population : SSP2
• Per capita floor area(McNeil et al)
Cooling and Heating demand: Residential
31
Device penetration= (climate condition) *( air conditioner availability)
(Isaac and van Vuuren, 2009)
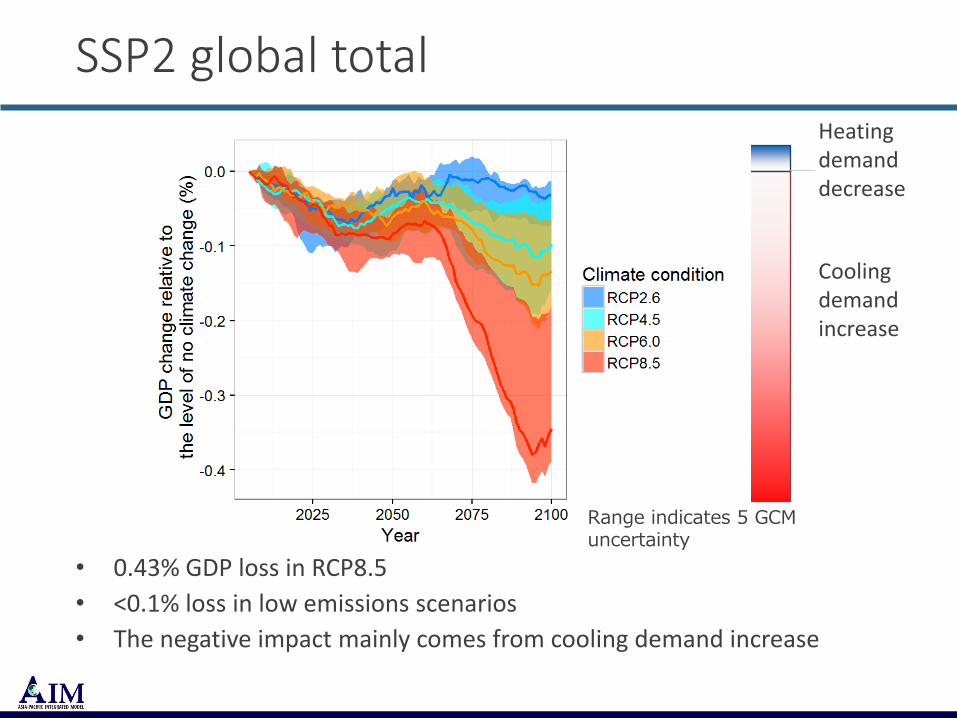
SSP2 global total
• 0.43% GDP loss in RCP8.5
• <0.1% loss in low emissions scenarios
• The negative impact mainly comes from cooling demand increase
Cooling demand increase
Heating demand decrease
Range indicates 5 GCM uncertainty

Labor productivity
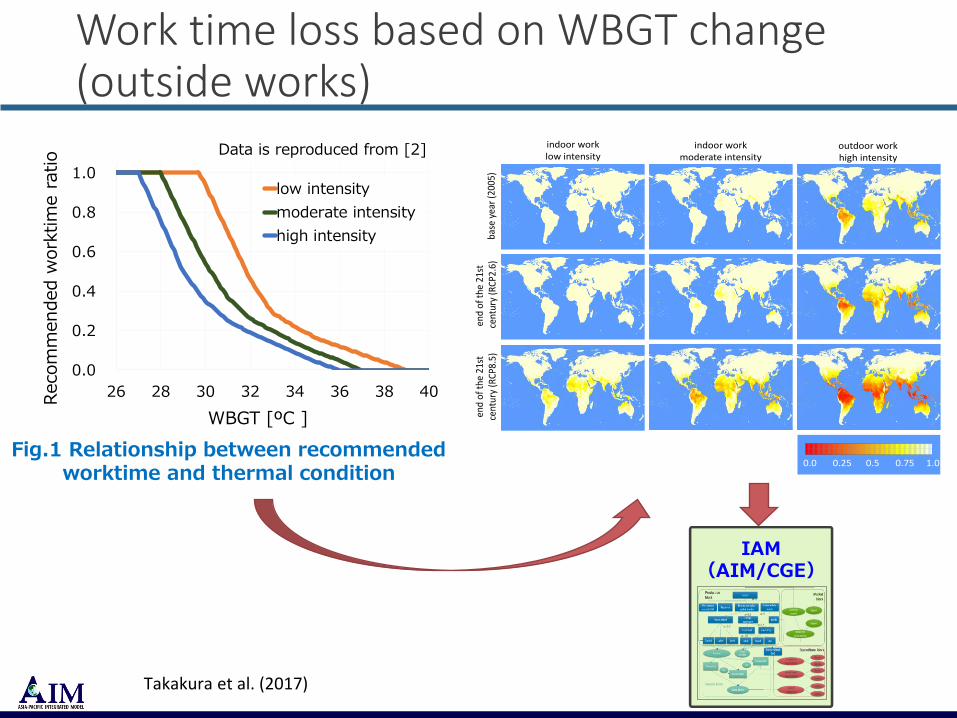
Work time loss based on WBGT change (outside works)
indoor workmoderate intensity
outdoor workhigh intensity
base
yea
r(2
005)
end
of t
he 2
1st
cent
ury
(RCP
2.6)
end
of t
he 2
1st
cent
ury
(RCP
8.5)
0.0 1.00.50.25 0.75
indoor worklow intensity
Takakura et al. (2017)
0.0
0.2
0.4
0.6
0.8
1.0
26 28 30 32 34 36 38 40
low intensity
moderate intensity
high intensity
Recom
mended w
ork
tim
e r
atio
WBGT [ºC ]
Fig.1 Relationship between recommended worktime and thermal condition
Data is reproduced from [2]
IAM(AIM/CGE)
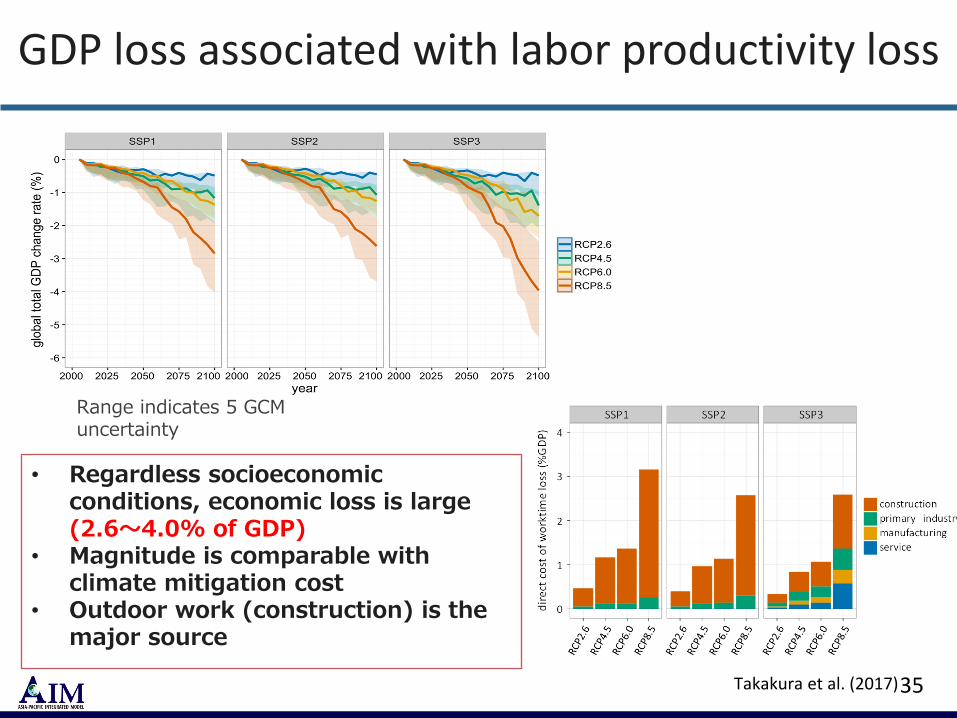
GDP loss associated with labor productivity loss
35
• Regardless socioeconomic conditions, economic loss is large (2.6~4.0% of GDP)
• Magnitude is comparable with climate mitigation cost
• Outdoor work (construction) is the major source
Takakura et al. (2017)
Range indicates 5 GCM uncertainty
Hydropower
Q Zhou, N Hanasaki, S Fujimori, Y Masaki, K Takahashi, Y Hijioka, The economic consequences of global climate change and mitigation on future hydropower, Climatic Change, Under review
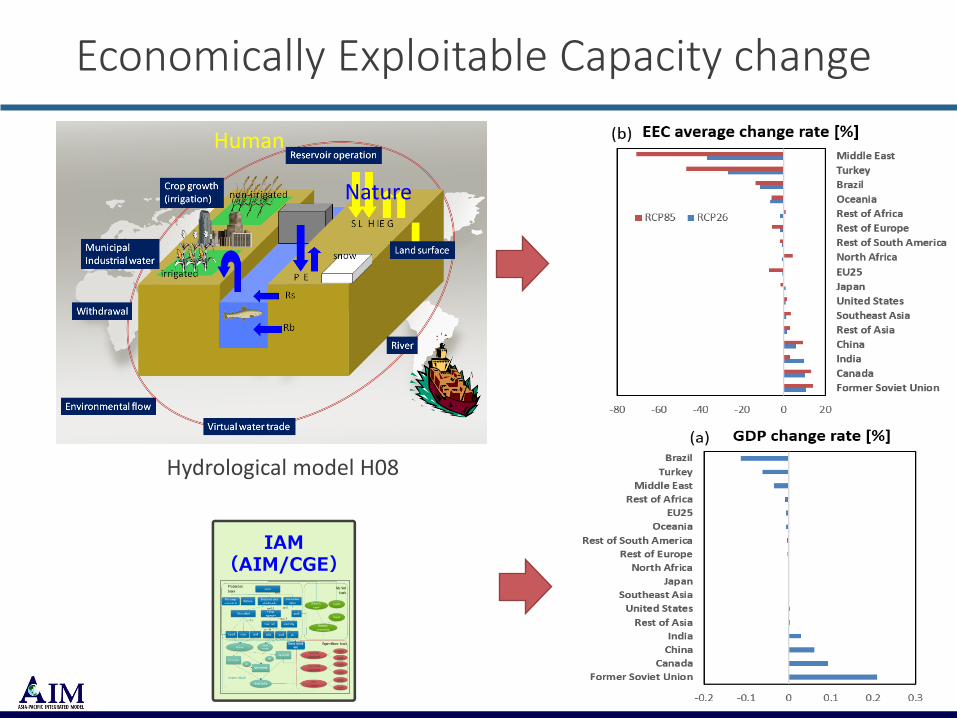
Economically Exploitable Capacity change
Human
Nature
Hydrological model H08
IAM(AIM/CGE)
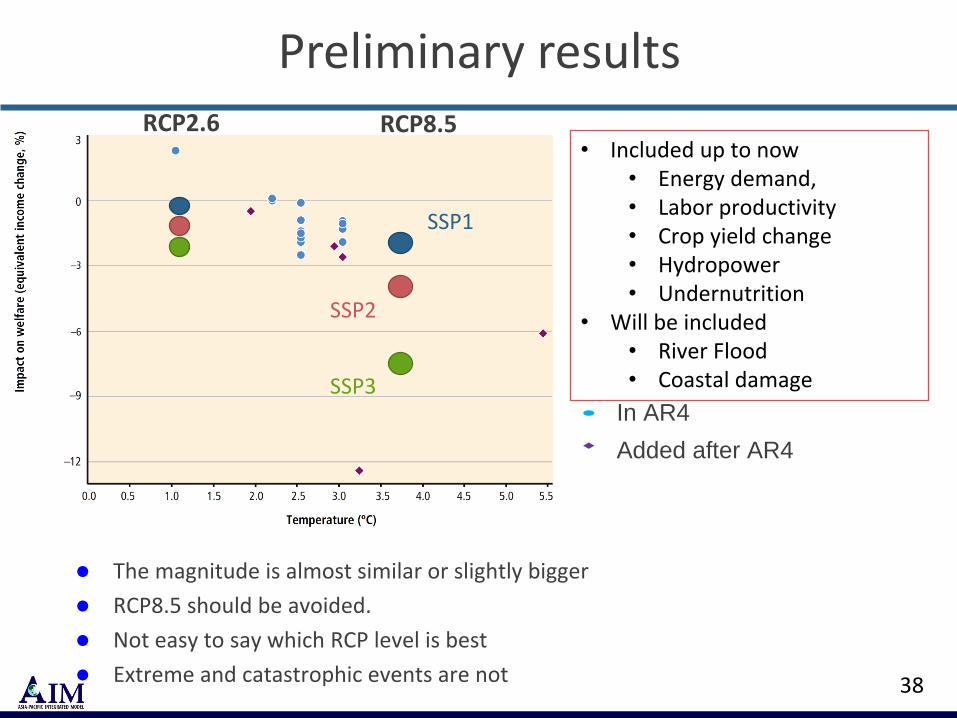
Preliminary results
38
• Included up to now• Energy demand,• Labor productivity• Crop yield change• Hydropower• Undernutrition
• Will be included• River Flood• Coastal damage
SSP2
SSP3
SSP1
The magnitude is almost similar or slightly bigger
RCP8.5 should be avoided.
Not easy to say which RCP level is best
Extreme and catastrophic events are not
RCP2.6 RCP8.5
In AR4
Added after AR4
Discussion
• The need for considering regional variety✓Offset issue
• Temporal and generation aggregation issue
• Extreme and catastrophic events
Global food, agriculture and land use in AIM

Recent studies
• Food security vs Climate Change• Effects of mitigation policies on food security
• Model comparison in AgMIP
• Health impacts caused by undernutrition
• Extreme events
• Biodiversity loss vs Climate and Land-use Changes
41
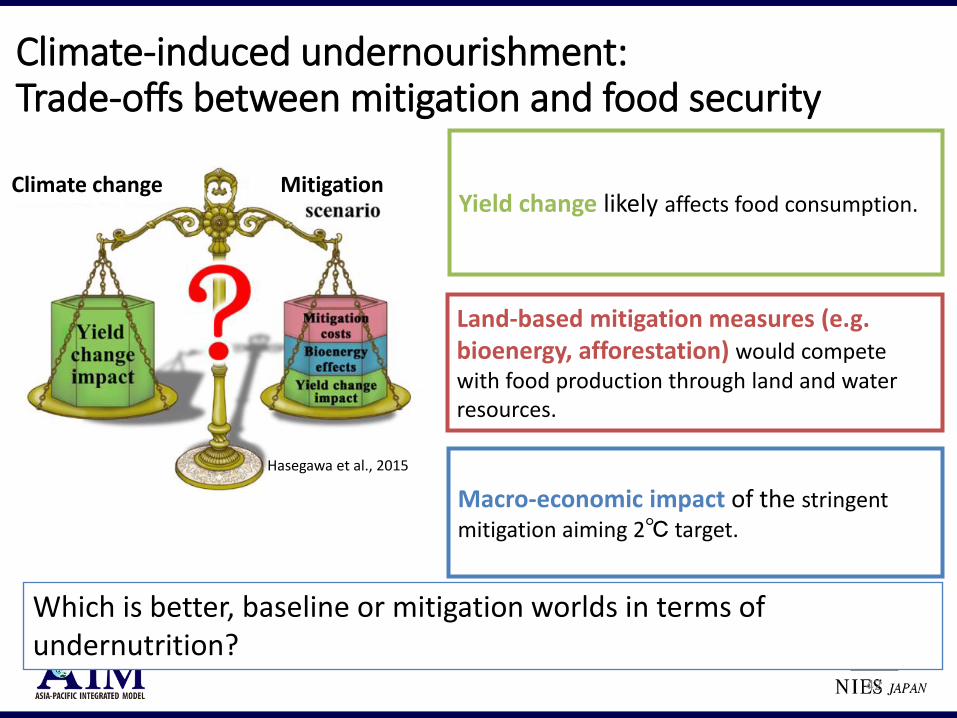
Climate-induced undernourishment:Trade-offs between mitigation and food security
42
Yield change likely affects food consumption.
Land-based mitigation measures (e.g. bioenergy, afforestation) would compete with food production through land and water resources.
Macro-economic impact of the stringent mitigation aiming 2℃ target.
Which is better, baseline or mitigation worlds in terms of undernutrition?
Climate change Mitigation
Hasegawa et al., 2015

Consequence of Climate Mitigation on the Risk of Hunger
12050 with NoCC: 2950 kcal/cap/day 2050 with NoCC: 90 mil.
2005: 2680 kcal/cap/day 2005: 830 mil.
Mean food calorie intake Global population at risk of hunger
-40
-35
-30
-25
-20
-15
-10
-5
0
Mitigation BaU
World
Ch
ange
in c
alo
rie
inta
ke
[kca
l/d
ay/c
ap]
RCP2.6 RCP8.5
0
2
4
6
8
10
12
14
16
Mitigation BaU
World
Ch
ange
in p
op
ula
tio
n a
t ri
sk o
f h
un
ger
[mill
ion
]
Landcompetition
Mitigationcost effects
Change incrop yields(median)
RCP2.6 RCP8.5
Hasegawa et al., 2015 EST43
Health impacts caused by undernutrition
44
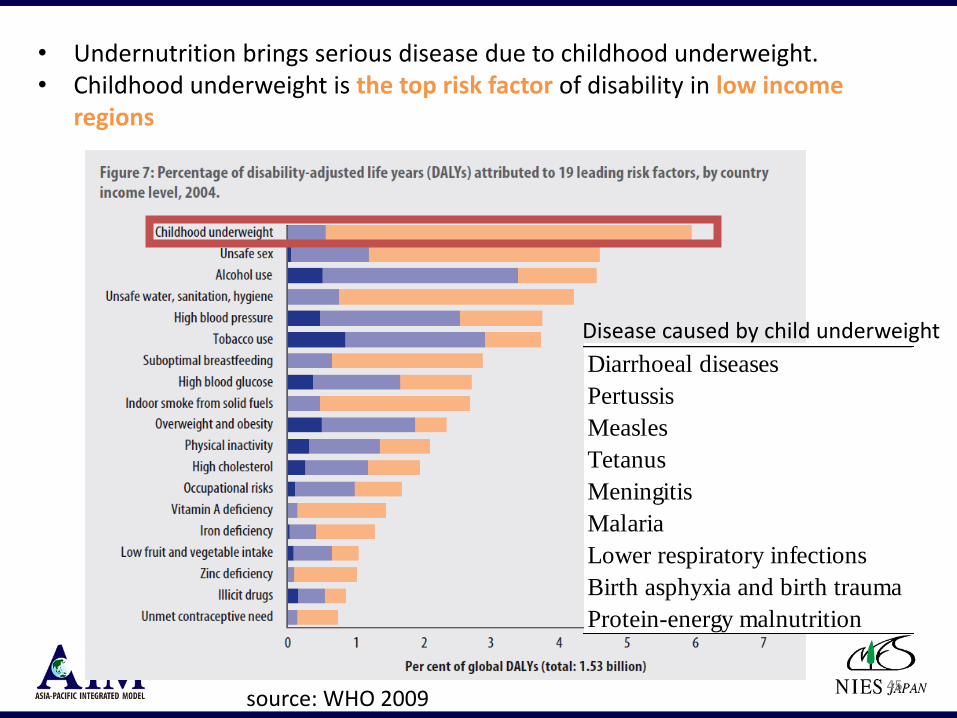
source: WHO 2009
• Undernutrition brings serious disease due to childhood underweight.• Childhood underweight is the top risk factor of disability in low income
regions
45
病種(d) φ ψ 調整済み決定係数 t値
Diarrhoeal diseases 5.03 1.71 0.52 9.47
Pertussis 2.68 1.90 0.41 7.63
Measles 3.11 2.53 0.23 4.37
Tetanus 3.93 3.20 0.38 6.98
Meningitis 2.27 1.49 0.45 8.30
Malaria 4.32 3.80 0.38 7.05
Lower respiratory infections 4.98 2.02 0.52 9.51
Birth asphyxia and birth trauma 2.70 2.12 0.70 13.52
Protein-energy malnutrition 3.38 0.98 0.44 8.10
Disease caused by child underweight

How much climate change impact on undernutrition and economy?
• Effects of labor force & healthcare costs:
• Effects of mortality (value of lives lost):
Rest of Africa
North Africa
Middle East
Former Soviet Union
Rest of Latin America
Brazil
Rest of Asia
Southeast Asia
India
China
World
Indirect impacts
Rest of Africa
North Africa
Middle East
Former Soviet Union
Rest of Latin America
Brazil
Rest of Asia
Southeast Asia
India
China
World
Low
Middle
High
Proportion of GDP [%]
Proportion of GDP [%]
a) World b) By regionDirect impacts
Hasegawa et al., 2016
Uncertainty:• 5 GCMs• 4 crop models• VSL uncertainty
SSP3-RCP8.5 in 2100
-0.1–0.0% of Global GDP
-0.4-0.0% of Global GDP

Biodiversity loss vs Climate and Land-use Changes
47
Discussion
• The strict emissions cuts toward Paris Agreement could indirectly lead indirect impacts on food security and biodiversity loss.
• This risk doesn’t negate need of climate mitigation.
• Highlight importance of careful design of climate mitigation and complementary measures to vulnerable groups or area.
• Next question is how much costs or food needs to be paid by whom.
48
Summary
• AIM modeling team✓History of AIM
✓ Team organization
• Recent activities✓ Asian climate mitigation policy assessment
✓ Climate change impact economics
✓Global land use and agricultural modeling in AIM
ご清聴ありがとうございました
Asia-Pacific Integrated Modelhttp://www-iam.nies.go.jp/aim/index.html
Illustrates sourceshttp://shigotogirai.hatenablog.jp/entry/2015/07/01/191247https://pixabay.com/p-146843/?no_redirect
Grazie per l'attenzione
Recommended