
Trial StatisticsIPR, PGR, CBMPatent Trial and Appeal Board October 2017

IPR7,07492%
CBM5297%
PGR821%
7,685 Total
3
Petitions by Trial Type (All Time: 9/16/12 to 10/31/17)
Trial types include Inter Partes Review (IPR), Post Grant Review (PGR), and Covered Business Method (CBM).

4
Petitions Filed by Technology in FY18(FY18 to date: 10/1/17 to 10/31/17)
Electrical/Computer70
54%
Mechanical & Business Method
3326%
Chemical6
5%
Bio/Pharma19
15%
Design0
0%
128 Total

10
0 0
5
0
5
10
Oct-16 Oct-17CBM
(5 CBMs in FY18)
0
74 4 4
0
5
10
Oct-16 Oct-17PGR
(4 PGRs in FY18)
237
116 119 124 119
100125150175200225250
Oct-16 Oct-17IPR
(119 IPRs in FY18)
5
Petitions Filed by Month (October 2017 and Previous 12 Months: 10/1/16 to 10/31/17)

NTE
NTE
NTENTE NTE
86% 82% 86% 87%
64%71%
85% 85% 83% 87%
49%63%
35% 38% 37%
Pre Post Pre Post Pre Post Pre Post Pre Post
Bio/Pharma Chemical Design Electrical/Computer Mechanical &Business Method
6
Preliminary Response Filing RatesPre- and Post-Rule To Allow New Testimonial Evidence (NTE)(All Time: 9/16/12 to 10/31/17)
The rule to allow new testimonial evidence was effective May 2, 2016.

191
664
1,012 1,011 955
8729223
469 496 557
90
87%
75%68% 67% 63%
49%
0
200
400
600
800
1,000
1,200
1,400
1,600
1,800
2,000
0%
10%
20%
30%
40%
50%
60%
70%
80%
90%
100%
FY13 FY14 FY15 FY16
Instituted Denied
7
FY17
Institution Rates(FY13 to FY18: 10/1/12 to 10/31/17)
Institution rate for each fiscal year is calculated by dividing petitions instituted by decisions on institution (i.e., petitions instituted plus petitions denied). The outcomes of decisions on institution responsive to requests for rehearing are excluded.
FY18

69% (997 of 1,441)
69% (2,311 of 3,364)
41% (17 of 41)
66% (258 of 388)
61% (337 of 550)
Mechanical &Business Method
Electrical/Computer
Design
Chemical
Bio/Pharma
8
Institution Rates by Technology(All Time: 9/16/12 to 10/31/17)
Institution rate for each technology is calculated by dividing petitions instituted by decisions on institution (i.e., petitions instituted plus petitions denied). The outcomes of decisions on institution responsive to requests for rehearing are excluded.

9
Settlement rate for each year is calculated by dividing pre-institution settlements by the sum of proceedings instituted, denied institution, dismissed, terminated with a request for adverse judgment, and settled before decision on institution.
Settlements
Settlement Rate
Pre-Institution Settlements(FY13 to FY18: 10/1/12 to 10/31/17)
23
127
291242 249
18
9%
12%
16%
14% 14%
9%
0%
2%
4%
6%
8%
10%
12%
14%
16%
18%
20%
FY13 FY14 FY15 FY16 FY17 FY18

10
Settlement rate for each year is calculated by dividing post-institution settlements by proceedings terminated post-institution (i.e., settled, dismissed, terminated with a request for adverse judgment, and final written decision), excluding joined cases.
Settlements
Settlement Rate
Post-Institution Settlements(FY13 to FY18: 10/1/12 to 10/31/17)
18
110
212 194 187
6
90%
40%29% 22% 22%
11%
-75%
-55%
-35%
-15%
5%
25%
45%
65%
85%
FY13 FY14 FY15 FY16 FY17 FY18
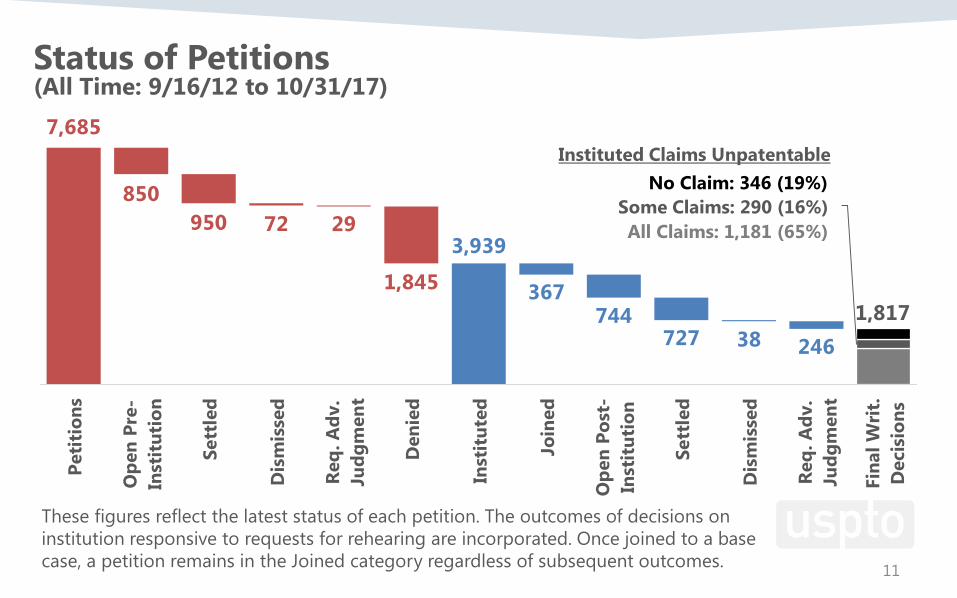
7,685
3,939
1,817
850950 72 29
1,845 367744
727 38 246
All Claims: 1,181 (65%)Some Claims: 290 (16%)
No Claim: 346 (19%)
Peti
tion
s
Ope
n Pr
e-In
stit
utio
n
Sett
led
Dis
mis
sed
Req.
Adv
.Ju
dgm
ent
Den
ied
Inst
itut
ed
Join
ed
Ope
n Po
st-
Inst
itut
ion
Sett
led
Dis
mis
sed
Req.
Adv
.Ju
dgm
ent
Fina
l Wri
t.D
ecis
ions
Instituted Claims Unpatentable
11
Status of Petitions(All Time: 9/16/12 to 10/31/17)
These figures reflect the latest status of each petition. The outcomes of decisions on institution responsive to requests for rehearing are incorporated. Once joined to a base case, a petition remains in the Joined category regardless of subsequent outcomes.

Recommended