JOURNAL OF THE -L Northeastern
Agricultural
Economics
Counci!J G!AN. • FO\JNO TIO:O! 0
AGRICULTURAL ECONOMICS LlliiRARY
OCT 2 01975
VOLUME IV, NUMBER 2
OCTOBER 1975
Introduction
-47-
CAN WE DE-MECHANIZE AGRICULTURE?
Earle E. Gavett ll Coordinator, Energy Related Research
Economic Research Service, USDA
American agricultural production is viewed by starving masses in the world as a great white knight; it can come charging into their lives and rescue them from starvation, malnutrition, and misery. Over the years we have maintained a granary that fed many millions of starving people. Now that these granaries are essentially depleted, there is a demand on the part of the World Health Organization, members of Congress and others that we replenish these reserves and continue to serve this role, rescu~
ing people from starvation.
Another group sees our agricultural production as the black-coated villain with the stovepipe hat. This group views agricultural production as being one that is extremely wasteful of energy· and can only operate with increasing energy intensity. [2, 10, 11] For the most part these individuals tend to be physical scientists who are concerned with the amount of fossil fuel energy required to supplement solar energy in the harvest of crops. Seldom have they considered economics. [13] It is common for them to point the finger of scorn at our highly productive agricultural system and point a finger of pride at some primitive agricultural system where a native may walk out and pick bananas or harvest a few vegetables between burned out tree stumps in the tropics. Not much energy is expended, but there is precious little output per acre. [ 2' 10, 11]
These latter individuals have been quite vocal in portraying the bad features of the U.S. agricultural production system. They attribute to agricultural production many of the ills of today's society. These include forcing people off the farms only to be unemployed in the cities, contributing to the growing crime rate in the cities and suburbs, the overcrowding of our school systems, the breakdown of family life and the increased incidence of divorce. [5] They propose that we retrench back down the mechanization ladder by giving up tractors, self-propelled combines, and other fossil fuel powered machines and utilize workstock
ll The views expressed are those of the author and do not necessarily represent the views of the United States Department of Agriculture.

-48-
and h~an labor instead. 110,11] They propose using animal waste and other organic fertilizer instead of inorganic fertilizer. I2,3] And they would sharply reduce use of pesticides--particularly herbicides-and use more cultural labor. Ill] They propose a back-to-the-farm migration as a means of saving cities and saving energy in our agricultural production. [5] These ·people are indeed serious and desire to demechanize farming.
Workstock Needs
Let us consider what would be required in the way of workstock to farm without tractors. In 1918 there were only 85,000 on farms. In that year the number of horses and mules of all ages on farms peaked at 26.7 million head. Farm output in 1918 was an index of 48 (1967=100). In the poor crop year of 1974·, farm output was an index of 109 or 2.27 times this much. 117] Assuming the ability to effectuate zero human population growth, hold demand for· farm products at current levels, and farm only with workstock, how long would it take to produce 61 million horses and mules (2. 2 7 times the 26. 7 million animals in 1918). The exact number of workstock would probably be less than 61 million as yields would not likely drop to the same low level as in 1918.
It is estimated that there are currently 3 million horses and mules of all ages on farms. Assuming a 25-year life span for these animals and half of them to be mares, we estimate there are 960 thousand mares capable of foaling colts. This eliminates as breeders those less than 2 years of age and older than 18. Assuming a 60-percent foal rate we could, by 1992 or 1993, build a stock of horses and mules to 60 million. It would be less than 6 million by 1980 and less than 15 million by 1985. But in 1992 and 1993 it is conceivable to have sufficient workstock to produce the current output of food. However, we would need over 180 million acres of land to produce feed for these work animals. Where is this land to come from?
During the late sixties and early seventies, we were blessed with several years of extremely fine weather and produced bountiful crops. At the most, 60 million acres were taken out of production by various land retirment programs. Since then most of this land has come back into production.
Labor Needs
In addition to the workstock and land problem is the problem of finding enough human stock. In 1918 about 13.5 million people were working on farms. The current farm work force is around 4 million people. 117] Encumbering ourselves with technology to accompany horses and mules would restrict the ability of human labor to produce to nearly the same level of productivity that occurred in 1918. Therefore, we might need something on the order of 2.27 times more workers than the 13.5 million used then, or about 30 to 31 million farmworkers. [4]
Can you picture the effect on this Nation's economy of removing from the industrial work force some 26 or 27 million able-bodied

-49-
workers to go back to the farms to supplement the 4 million workers that are there now? Are we ready to back down the technology ladder to the extent of producing much of the food and fiber in this country by workstock and hand labor?
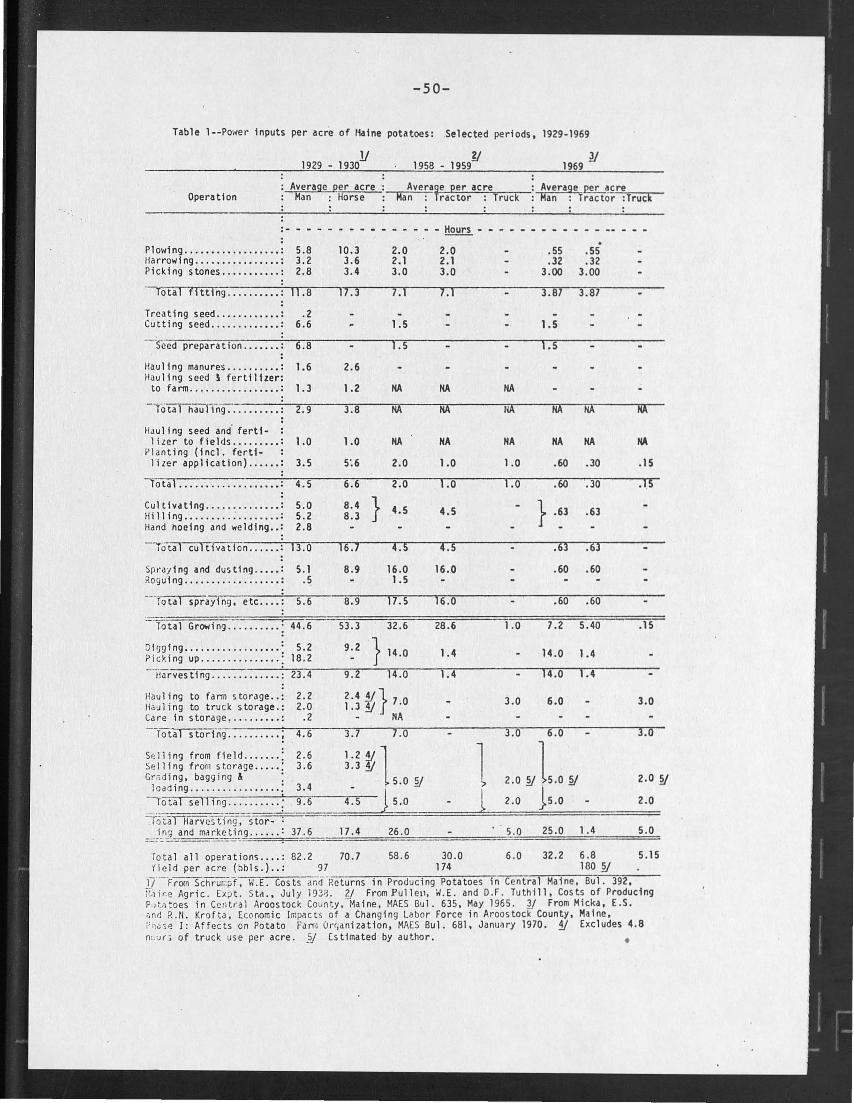
Let us look at the power inpu.ts on a ~rop vital to Maine--potatoes. Table 1 is a compilation from several sources of Maine potato production from the horse era to modern fossil fuel technology. To shift back to .horse and manpower operations would require 50 hours more labor per acre than was used in 1969. Currently, technology using the air separation harvester reduces labor for harvesting by 7 hours per acre from the 1969 level so that about 25 hours per acre are used for all operations. [8] The 82 hours in 1929-30 do not include labor required to feed and care for workstock. This was another 14 hours per acre (180 hours per team of horses). !16] So, to produce Maine potatoes with horse and manpower would really take 71 hours more labor per acre than used today.
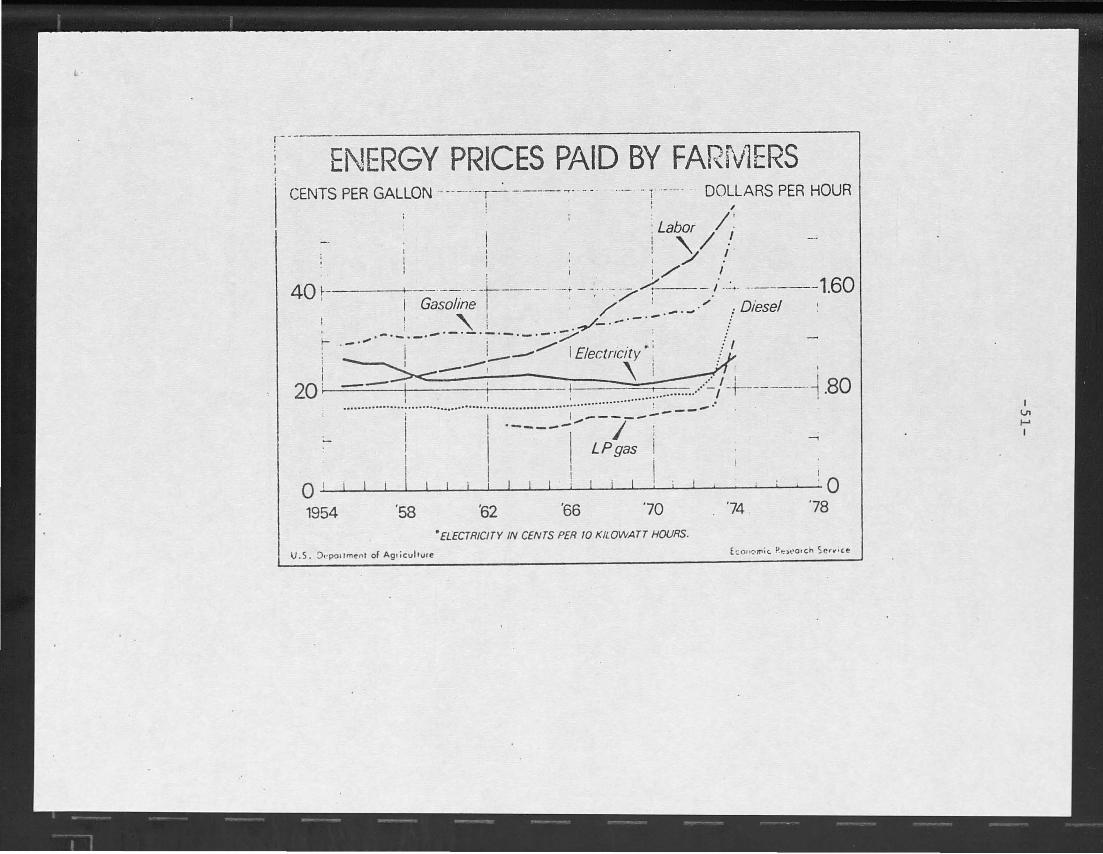
What kind of a price would we have to pay labor to move back to the farm and do hard phy'sical work under conditions that today are called "hostile. environments"--either hot broiling sun in sunnner or a cold bitter wind in winter. Figure 1 shows the energy prices paid by farmers from 1955 through 1974. Human energy prices rose faster throughout the period than any other energy and are continuing to rise. To call forth more workers onto our nations' farms would require a sharply higher ·wage rate than is currently paid workers. Even with a slack nonfarm economy and a high unemployment rate, we have been unable to obtain sufficient workers to do "stoop" jobs such as picking vegetables and fruit. The Northeast, over the years, has had formal labor importation programs. Over 7,000 Canadians and 1,800 Indians were used in picking Maine potatoes in the late 1950's. [8] Some are still imported each year.
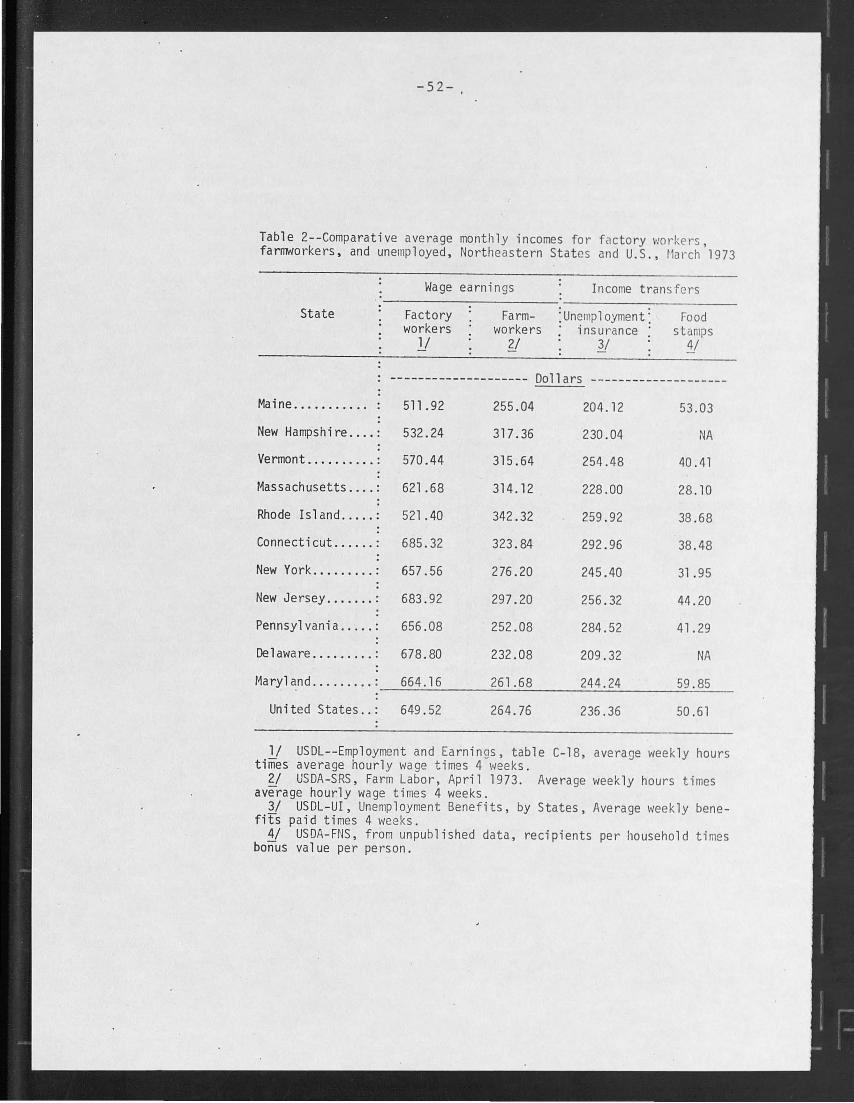
Table 2 indicates that for most States in the Northeast and for the United States, factory workers cash wages are at least double those received by hired farmworkers. Nonfarmworkers on unemployment insurance earn nearly as much as do farmworkers. When one adds the value of food stamps, the combined monthly income exceeds that earned in farming. It would appear that wages 2 to 3 times greater than are currently paid would be required to move many workers back to the farm. At $6 to $7 per hour, can you picture the impact of farm labor on food prices? At 96 hours per acre of potatoes and a 180-barrel yield, labor costs alone would be $3.20 per barrel. On April 25, the street price at Presque Isle was $2.25 to $2.50 per barrel.
Nutrient Needs
American farmers have been accused of. being extremely wasteful of fertil1zer. Opponents contend that agricultural production has grown mainly because farmers have been adding more fertilizer to the input mix. Total fertilizer use more than doubled from 1950-54
-50-
Table 1--Power inputs per acre of 11aine potatoes: Selected periods, 1929-1969
1/ 1929 - 1930
y 1958 - 1959
y 1969
Average per acre Man Horse Operation
Average per acre Average ~acre Man : Tracto-"-r'-':"'T~ru-c~k-Man : Tractor : Truck
:-
Plowing .................. : 5.8 Harrowing ................ : 3.2 Picking stones ........... : 2.8
Total fitting ... ...•... ; 11.8
Treating seed ...... .. ..•• : .2 Cutting seed .. . ..... ...•. : 6.6
Seed preparation ... •... : 6.8
Hau ling manures .. .. . ...•• : 1.6 Hauling seed! fertilizer:
to farm ................. : 1.3
Total hauling . ... .....• : 2.9
HJul ing seed and fertl- : lizer to fields ......••• : 1.0
Plant ing (incl. ferti-lizer application) . ..... : 3.5
Iota\. ..... · ............. ; 4.5
Cultivating ..........••.• : 5.0 Hi 11 i ng ......... : ... ..... : 5. 2 Hand hoeing and welding •• : 2.8
10.3 3.6 3.4
17.3
2.6
1.2
3.8
1.0
5:6
6.6
2.0 2.1 3.0
7.1
1.5
1.5
HA
HA
HA
2.0
2.0
::~ } 4.5
- Hours •
2.0 2.1 3.0
7.1
HA
NA
NA
1.0
l.o
4.5
HA
rlA
NA
1.0
(.o
.55
.32 3.00
. .55 .32
3.00
3.87 3.87
1.5
1.5
NA NA
HA HA
.60 .30
.60 '.30
} .63 .63
NA
NA
.15
.l.s
·-ra~-curtrv.lucn~-.. -.-.-.~.:~1'3.'o.---~,,6~.7r---,4-.sr----,4r.7s---------------.T63r---.6~3r---------
Sp.-ayi ng and dusting ..... : 5.1 8.9 16.0 16 •. 0 .60 .60 Rogu 1 ng ..•...•. .. ......•. : . ~ 1.5
--lo tal sprayi~g. etc •... : 5.6 8.9 17.5
Total Growin') ......... . : 44.6 53.3 32.6
Digging ......... . . . ..•••• : 5.2 Picking up ............... : 18.2
g,2 ' } 14.0
-·i"larvestlng .. .. . .... .... ; 23.4 9.2 14.0
Hauling to farm storage .. : 2.2 2.4 Y} 7 0 Hauling to truck storage.: 2.0 1.3 y · Care In storage, ......... : .2 - NA
16.0
28.6
1.4
1.4
1.0
3.0
.60 .60
7.2 5.40
14.0 1 .4
14.0 1.4
6.0
Tota l storing .......... ; 4.6 3.7 7.0 3.0 6.0
SF:l ling from field ... .... : 2.6 1.2 4/1 1 1 Se lling frorol storage .... . : 3.6 3.3 "9 Gr;;ding, bagging & : _ 5.0 y 2.0 y . 5.0 §/
.15
3.0
3.0
2.0 '§1
2.0 loading ................. : 3.4 - J l I
- tCitarSelling .......... : 9.6 4.5 5.0 2.0 _}5.0
-Yo taT11arvcs t ing , s:=;:t==or==-:=;::========6======d=====~======== 1.4 5.0 ---~~~and marketi~g ...... : 37.6 17.4 26.0 5.0 25.0
Total all operations . . •. : 82.2 70.7 58.6 30.0 6.0 32 . 2 6.8 5.15 rie ld per acre (bbls.) .. : 'J7 174 180 §j
·17·- From Schrur.:pf , H.E . Costs dnd .. Rcturns in Producing Potatoes in Central Maine, Bul. 392, J:., ;r.e Agric. Ex;it . Sta., July 19 3~ . 21 From Pull etl, W.E. and D.F . Tuthill, Costs of Producing p , ~_;,toes in Cen tral Aroostock County, -Maine, MAES !lul. 635, May 1965. 3/ From Micka, E.S. ;,nrJ R.N. Krofta, Eco nomic I mpact~ of a Changing Labo r Force in Aroostocf County, Maine, P~ ~:;.; I : Affects on Potato FdrT•l On:;a nization, MAES Bul. 681, Janu~ry 1970. 1/ Excludes 4.8 n ~ u r .; of truck use per acre . '?J Estimated by author. •
,-------------------. : ENERGY PRICES PAID BY FARfv1ERS
CENTS PER GALLON ------·- T-· · -·--·-~- · - - ... _ .. _ r ·- --·· DOLLARS PER HOUR I · i
: : /~ . Labor/ i I ' . : . ! 'y I .
I I i / •
! i ! / I
40 r- I G~;oll~;-r---·-- · .... :- ->;?1~--=--;/ --~: · ;~es-;;-~ 160 I ' I /.. .-·-· . : ' j • .,.,.,-·-- ... . -·---·~·-·-·-·-·-·-·-/ : t- __ ..... , ,.............- . :I
' i ! _ _.... I Electricity· : / -- \ ' . I - I I . I I
20 ! ' ... I I I 80 I I I --4- /- -+---·---·-,
........................................ ~ ...................... ~ .................... --: ........... -..' ' . i I I ---------1 ·------ / : .
l I j L P gas I ...,
0 I i I I I I I I I I I I i I I I I i I j I i i ; ! 0 1954 '58 '62 '66 '70 '74 '78
• ELECTRICITY IN CENTS PER 10 KILOWATT HOURS.
V. S. C>•·po1 lmenl of Ag• icu!ture ECOII'=' tr"it. P.t)t.~orch 5r.l'v•ce
I Vl ...... I
-52- .
Table 2--Comparative average monthly incomes for f actory workers, farrrworkers, and unemployed, Northeastern States and U.S., r·1a i'Ch 1973
State
Wage earnings
Factory workers
1!
Farmworkers
y
Income transfers
:unemp loyment: insurance
y
Fo od st amp s
y
Dollars
Maine........... 511.92
New Hampshire .... : 532.24
Vermont. ......... : 570.44
Massachusetts .... : 621.68
Rhode Island ..... : 521.40
Connecticut ...... : 685.32
New York ......... : 657.56
New Je rsey ....... : 683.92
Pennsylvania ..... : 656.08
Delaware ..... . ... : 678.80
255.04
317.36
315.64
314.12
342.32
323.84
276.20
297.20
252.08
232.08
204.12 53.03
230.04 NA
254.48 40.41
228.00 28.10
259.92 38.68
292.96 38.48
245.40 31.95
256.32 44.20
284 .52 41.29
209.32 NA
Ma ryl ~n d ..... .. . . : ---=6-'-6-'-4 ·:.....:1...:.6 ___ 2_6_1 .:...:· 6--=8 ___ 2...:.4_4.:...:. 2---'4 ____ 5.;.._9 _. 8_5_
United States .. : 649.52 264 .76 236.36 50.61
l/ USDL--Employment and Earnin gs, table C-18, avera 9e week ly hours times average hourly wage times 4 weeks.
2/ USDA-SRS, Farm Labor, April 1973. Average weekly hours times average hourly wage times 4 weeks.
3/ USDL-UI, Unemployment Benefits, by States, Average weekly benefits paid ti mes 4 wee ks.
4/ USOA-FNS, from unpublished data, recipients per household ti mes bonus value per person.

-53-
to 1974. It is true that farmers have relied heavily on commercial fertilizer as an input in production. Figures 2 and 3 show the quantities and prices of selected inputs used, and that fertilizer and lime use grew faster in quantity than any other major input group. Fertilizer appears to be the cheapest and most productive input that a farmer can buy. Since 1970, roughly 94 or 95 percent of all corn acreage has received some fertilizer. Nitrogen used per acre on corn has fluctuated at 110 to 115 pounds until 1974, then dropped to 103 pounds per acre. This decline in pounds could be attributed to price. However, supply was extremely short, farmers were asked to conserve use, they were planting more acres, and planting them later because of the bad spring weather. As a result, fewer pounds of nitrogen were applied to corn.
Organic Vs. Inorganic
Conservationists suggest substituting animal manure for highly energy intensive inorganic fertilizer. [2, 3] We recently calculated the value of manure based on 1974 costs of nutrients in commercial fertilizer. Dairy cow manure as fertilizer was worth $3.33 per ton; for beef cow manure, $4.84. Farmers cannot haul such low value fertilizer material very far (22 pounds of fertilizer nutrients per ton) before the cost of hauling exceeds the value.
It is proposed that high yielding crops can be produced without ~norganic fertilizer by growing and turning under green manure crops. It has been contended that 140 pounds of nitrogen can be produced by an acre of legumes. Unfortunately, not all this nitrogen is readily available for the next crop. By turning the crop under in the fall and leaving it to decay over winter, some 70 pounds of nitrogen becomes available during the next crop year. The following year, 35 pounds more become available. In the third year the remaining 35 pounds becomes available. So use of green manure as the supplier of nitrogen is not an immediate panacea. Farmers would have to shift from continuous production of corn, wheat, and other desired crops to a rotation including soybeans, alfalfa, clover, or other legumes. Even at current high fertilizer prices, this is not an economic alternative for most farmers.
Some interesting research is underway along this line. Researchers at Washington University, St. Louis, Missouri, are studying 16 matched pairs of farms, half of which are organic farming operations; the other half are conventional inorganic type operations. 11 The study has just begun and results are not available yet.
ll Commoner, B. et. al. NSF Project Grant No. GI-43890, renewal, Washington, University, April 1975.

-54-
Figure 2
QUP.NTITIES OF SElECTED FARf~\ INPUTS %0 F 1950
Felt;!;,., .L Hmel~~-)-~~ r-
'/ / 300 /
/
r- /
/'"'1 / /
'/ --200 Power and machinery ...... , All others I I I .... 1-... I I I ...................... r- _.... ................ I _....,.. __ .,.., ................. I - ••••••• I ,. ....... I ···············• I ,_ .. _. .. -~-.,.-· -·- 6
_._,_ ... _,_ ...
100 ~ .. _, __ , __ ,~,.-· .... "~"!' ______ ,_,_ I I I
,tr;;;s,<·······' ............... I , a:.-:._ I . --
0 1950
I _l I
'53
·-·-·-·-·-·' ~Real estate j I '/-.-.-.-.-. J..-., I ·-·-·-·-·-·-·-
labor I I I I I I t t t I I I I l l_ ..,.
'56 '59 '62 '65 '68 '71 A PRELIMINARY._
'74
U.S. DEPARTMENT OF AGRICULTURE NEG. EAS 5753 • 73 ( 8 I ECONOMIC RESEARCH SERVICE
Figure 3
PRICES OF SELECTED FA~M INPUTS %OF 1950
300~~---r--~--+---r--+--~[7
·"' .. ·· 250 1-----if-------l---+-Fo<i wage i'K' [. ...... // / 200 ~--+-----If---Farm real · estate_ 4--\ ..... j__/'-+"'""----i
I ' I 1 •••• ·••• L-..... · I ·········(_...2 .......
150 l----+--+-:~~ .............. 1::·::.--=r-;"---t---t-----1 ........ , .............. -;l::;:·;:::::·;:.'~----~ Farm m
1 achineryl .
... ~~= .. = .. :::: . ._, __ .. _ ... _, ______ ,_,_,_,_~ ,_,_.,-" 71 ------· 100 Fertilizer
5o~~~~~~~~~~~~~~~~~~~~~~-A~
1950 '53 '56 '59 '62 '65 '68 71 7 4 A PRELIMINARY.
U.S. DEPARTMENT OF AGRICULTURE NEG. ERS 3995 • 73 ( 8 I ECONOMIC RESEARCH SERVICE

-55-
Pesticide Needs
Another area of substantial energy use per acre is in the use of pesticides. For no-till operations to work, herbicides must be applied. When one assesses the energy content of pesticides against the reduced needs of diesel and gasoline fuel for tillage, the savings of energy are reduced somewhat. [1] Some applications of no-till have been accompanied by reduced yields. Studies are underway to determine the net energy effect of reduced tillage and changing farm output.
For some crops, pesticide use can be reduced by eliminating some preventive type sprays and relying more on combating outbreaks. However, for an area such as the Northeast where quality apples are produced, it is most unlikely that many apple producers will change their spray schedule. The difference in price of dessert quality fruit and that of culls for cider is so great that farmers cannot risk reductions in quality of product. And experience has shown that U.S. housewives will not buy wormy apples.
Some argue for application of chemical pesticides with hand labor rather than by tractor or airplane sprayer. I 6, 11] The Occupational Safety and Health Administration (OSHA) regulations are incompatible with hand application. OSHA recently adopted stringent standards requiring that certain pesticides be applied only by licensed applicators using proper protective equipment, and they established re-entry time periods before workers can enter a treated area.
Crop Drying Needs
Artificial crop drying is another area suggested for energy conservation. Currently, it takes more energy to dry corn than to produce it. !20] Farmers could resort to producing ear corn and crib dry it naturally. Of course we must be willing to accept the losses occurring from: (1) leaving it to dry longer in the field until it is safe to bring into a crib--field losses of 5 percent or more aren't unusual--and (2) losses due to rodents and birds getting into the cribs--a combination of grain eaten as well as grain contaminated with fecal material that tight bins of shelled corn eliminate. Research is underway to reduce fuel needs for drying by using heat pumps and to replace propane with solar heat.
Conclusions
We have been considering ways of reducing energy intensity in farm production as suggested by numerous critics. In time it could be done, but at great cost to farm production, food prices, and the economy. It is perplexing to understand why critics single out farm production as the major area for conservation and change. In the farm production process, supplemental energy is invested to harvest free solar energy captured by plants through photosynthesis. Currently about 3 calories are received for each one invested in farm production. Is this the process
-56-
to restrict? I think not. I think agricultural production should continue to use the technology developed, but conserve fuel in the process. Rising fuel prices will likely assure that farmers will conserve. I believe agricultural production of the future will be by refinement of our mechanized technology, not be discarding that technology.
There are many other areas in the food system where energy-intensive practices have proliferated and consume far more energy than in production. 120] Freezing and freeze-drying foods instead of canning them or serving them fresh are examples. Items are often packaged into single servings for consumer convenience. Society adopted the throwaway habit for bottles, cartons, and other containers, and now most citizens are unwilling even to pass laws banning no-return containers.
The total food and fiber system consumes about 10 percent of the Nation's energy (not including home refrigeration and cooking). By conserving energy, mostly beyond the farm· production sector, by restricting use of energy-intensive technology, it is possible to save 2 to 3 percent of our total energy use and still provide the Nation with plenty of wholesome food.
References
1. C.A.S.T. Potential for Energy Conservation in Agricultural Production, Committee on Agricultural Science and Technology Report No. 40, Feb. 6, 1975.
2. Clark, Wilson, U.S. Agriculture is Growing Trouble As Well As Crops, Smithsonian, January, 1975.
3. Commoner, B., et. al., The Vulnerability of Crop Production to Energy Problems, CBNS-AE-2, Washington University, January 1975.
4. Gavett, E.E., Agriculture and the Energy Crisis, address at the National Conference on Agriculture and the Energy Crisis , University of Nebraska, April 10-11, 1973.
5. Hall, A.T., Socio-Economic Problems--The Consumer--Standard of Living--Style of Life, National Conference on Agriculture and the Energy Crisis, University of Nebraska, April 10-11, 1973.
6. Heichel, G.H., Energy Needs and Food Yields, MIT, Technology Review, Vol. 76, No. 8, July/August 1974.
7. Implement and Tractor, 59th Annual Farm and Industrial Equipment Redbook, Intertech. Pub. Co., Janaury 31, 1975.
8. Johnston, E.F. and H.B. Metzger, Labor Replacement in Potato Harvesting in Aroostock County, Maine, University of Maine, Vol. 22, No. 5, December 1974.
-57-
9. Micka, E.S. and R.N. Krofta, Economic Impacts of a Changing Labor Force in Aroostock County, Maine: Phase of Affects of Potato Farm Organization, MAES Bul. 681, January 1970.
10. Perelman, M.J., Farming With Petroleum, Environmentalist, Vol. 14, No. 8, October 1972.
11. Pimen~al, David, et al., Food Production and the Energy Crisis, Science, Vol. 182, November 2, 1973.
12. Pullen, W.E. and D.F. Tuthill, Costs of Producing Potatoes in Central Aroostock County, Maine, MAES Bul. 635, May 1965.
13. Ruttan, V.W., Food Production and the Energy Crisis: A Comment, Science, Vol. 187, February 14, 1975.
14. Schrumpf, W.E., Costs and Returns in Producing Potatoes in Central Maine, MAES Bul. 392, July 1938.
15. Steinhart, J.S. and C.E. Steinhart, Energy Use in the Food System, Science, Vol. 184, April 19, 1974.
16. USDA-BAE, FM-40, Labor Requirements for Crops and Livestock, May 1943.
17. USDA-ERS, Stat. Bul. 233, Changes in Farm Production and Efficiency, 1964 and 1973 issues.
18. USDA-ERS-FS-5, The 1975 Fertilizer Situation, December 1974.
19. USDA-SRS, Prices Paid by Farmers, selected issues.
20. U.S. Senate, Committee on Agriculture and Forestry, The U.S. Food and Fiber Sector, Energy Use and Outlook, September 20, 1974.
Recommended