Performing BluetoothTM
RF Measurements TodayApplication Note 1333
Agilent

2
IntroductionBluetoothTM wireless technology is an open specifica-tion for a wireless personal area network. It provideslimited range RF connectivity for voice and datatransmissions between information appliances.Bluetooth wireless technology eliminates the need forinterconnecting cables and enables ad hoc networkingamong devices.
Named after a tenth-century Danish King, Bluetoothinvokes images of Viking conquests and plundering;notwithstanding this, the good King Harald Blatand iscredited with uniting Denmark and Norway duringhis reign. Similarly today, Bluetooth unites technologies.
Bluetooth wireless technology will allow seamlessinterconnectivity among devices. Computers and per-sonal digital assistants (PDAs) will share files andsynchronize databases remotely; laptop PCs willaccess e-mail by linking to nearby cellular phones;and wireless headsets will permeate the cellularphone market to simplify hands-free operation.Applications for this technology are already under-way in many R&D labs around the world. The technol-ogy’s potential is limitless when one considers thegrowing sector of information appliances that wouldbenefit from wireless connectivity.
This application note describes transmitter andreceiver measurements to test and verify today’sBluetooth RF designs. Since the Bluetooth wirelesstechnology is in its early development stages, testmethodologies will differ from those typically seen inmature technologies. Test procedures will range frommanual intervention or custom software control, toeasy-to-use, one-button measurements. A list ofAgilent Technologies solutions for Bluetoothmeasurements is provided in Appendix A. This application note assumes a basic understanding of RF measurements. To learn more about basic RFmeasurements, refer to Appendix B, “RecommendedReading,” at the end of this application note.
3
Table of contentsIntroduction . . . . . . . . . . . . . . . . . . . . . . . . . . . . . . . . . . . . . . . . . . . . . . . . . . . . . . . . . . . . . . . . . . . . .21. Basic concepts of Bluetooth . . . . . . . . . . . . . . . . . . . . . . . . . . . . . . . . . . . . . . . . . . . . . . . . . . . . . .4
1.1 Bluetooth radio unit . . . . . . . . . . . . . . . . . . . . . . . . . . . . . . . . . . . . . . . . . . . . . . . . . . . . . . . . . . . . . .51.2 Bluetooth link control unit and link management . . . . . . . . . . . . . . . . . . . . . . . . . . . . . . . . . . . . . .7
2. Transmitter measurements . . . . . . . . . . . . . . . . . . . . . . . . . . . . . . . . . . . . . . . . . . . . . . . . . . . . . . .92.1 Power tests . . . . . . . . . . . . . . . . . . . . . . . . . . . . . . . . . . . . . . . . . . . . . . . . . . . . . . . . . . . . . . . . . . . .11
2.1.1 Output power . . . . . . . . . . . . . . . . . . . . . . . . . . . . . . . . . . . . . . . . . . . . . . . . . . . . . . . . . . . . . . .112.1.2 Power density . . . . . . . . . . . . . . . . . . . . . . . . . . . . . . . . . . . . . . . . . . . . . . . . . . . . . . . . . . . . . . .132.1.3 Power control . . . . . . . . . . . . . . . . . . . . . . . . . . . . . . . . . . . . . . . . . . . . . . . . . . . . . . . . . . . . . . .13
2.2 Transmit output spectrum . . . . . . . . . . . . . . . . . . . . . . . . . . . . . . . . . . . . . . . . . . . . . . . . . . . . . . . .142.3 Modulation tests . . . . . . . . . . . . . . . . . . . . . . . . . . . . . . . . . . . . . . . . . . . . . . . . . . . . . . . . . . . . . . . .15
2.3.1 Modulation characteristics . . . . . . . . . . . . . . . . . . . . . . . . . . . . . . . . . . . . . . . . . . . . . . . . . . . .152.3.2 Modulation quality . . . . . . . . . . . . . . . . . . . . . . . . . . . . . . . . . . . . . . . . . . . . . . . . . . . . . . . . . . .162.3.3 Initial carrier frequency tolerance . . . . . . . . . . . . . . . . . . . . . . . . . . . . . . . . . . . . . . . . . . . . . .162.3.4 Carrier frequency drift . . . . . . . . . . . . . . . . . . . . . . . . . . . . . . . . . . . . . . . . . . . . . . . . . . . . . . .18
2.4 Timing tests . . . . . . . . . . . . . . . . . . . . . . . . . . . . . . . . . . . . . . . . . . . . . . . . . . . . . . . . . . . . . . . . . . .192.4.1 Burst profile . . . . . . . . . . . . . . . . . . . . . . . . . . . . . . . . . . . . . . . . . . . . . . . . . . . . . . . . . . . . . . . .192.4.2 Spectrogram measurements . . . . . . . . . . . . . . . . . . . . . . . . . . . . . . . . . . . . . . . . . . . . . . . . . . . .20
3. Transceiver measurements . . . . . . . . . . . . . . . . . . . . . . . . . . . . . . . . . . . . . . . . . . . . . . . . . . . . . .213.1 Spurious emissions tests . . . . . . . . . . . . . . . . . . . . . . . . . . . . . . . . . . . . . . . . . . . . . . . . . . . . . . . . .21
4. Receiver measurements . . . . . . . . . . . . . . . . . . . . . . . . . . . . . . . . . . . . . . . . . . . . . . . . . . . . . . . . .224.1 Bit error rate (BER) tests . . . . . . . . . . . . . . . . . . . . . . . . . . . . . . . . . . . . . . . . . . . . . . . . . . . . . . . . .22
4.1.1 Sensitivity—single-slot packets . . . . . . . . . . . . . . . . . . . . . . . . . . . . . . . . . . . . . . . . . . . . . . . . . .224.1.2 Sensitivity—multi-slot packets . . . . . . . . . . . . . . . . . . . . . . . . . . . . . . . . . . . . . . . . . . . . . . . . . .224.1.3 Carrier-to-interference (C/I) performance . . . . . . . . . . . . . . . . . . . . . . . . . . . . . . . . . . . . . . . .234.1.4 Blocking performance . . . . . . . . . . . . . . . . . . . . . . . . . . . . . . . . . . . . . . . . . . . . . . . . . . . . . . . .234.1.5 Intermodulation performance . . . . . . . . . . . . . . . . . . . . . . . . . . . . . . . . . . . . . . . . . . . . . . . . . .234.1.6 Maximum input level . . . . . . . . . . . . . . . . . . . . . . . . . . . . . . . . . . . . . . . . . . . . . . . . . . . . . . . . .234.1.7 Signal generation for receiver BER tests . . . . . . . . . . . . . . . . . . . . . . . . . . . . . . . . . . . . . . . . . .244.1.8 BER test setup . . . . . . . . . . . . . . . . . . . . . . . . . . . . . . . . . . . . . . . . . . . . . . . . . . . . . . . . . . . . . .26
4.2 Supplementary receiver tests . . . . . . . . . . . . . . . . . . . . . . . . . . . . . . . . . . . . . . . . . . . . . . . . . . . . .305. Power supply measurements . . . . . . . . . . . . . . . . . . . . . . . . . . . . . . . . . . . . . . . . . . . . . . . . . . . . .31Appendix A: Agilent solutions for Bluetooth . . . . . . . . . . . . . . . . . . . . . . . . . . . . . . . . . . . . . . . . . .32Appendix B: Recommended reading . . . . . . . . . . . . . . . . . . . . . . . . . . . . . . . . . . . . . . . . . . . . . . . . .33Appendix C: Glossary . . . . . . . . . . . . . . . . . . . . . . . . . . . . . . . . . . . . . . . . . . . . . . . . . . . . . . . . . . . .34Appendix D: Symbols and acronyms . . . . . . . . . . . . . . . . . . . . . . . . . . . . . . . . . . . . . . . . . . . . . . . . .35Appendix E: References . . . . . . . . . . . . . . . . . . . . . . . . . . . . . . . . . . . . . . . . . . . . . . . . . . . . . . . . . . .36

4
1. Basic concepts of Bluetooth
Bluetooth, in its most elementary form, is definedas a global specification for wireless connectivity.Because it is intended to replace cables, cost mustbe low and operation must be intuitive and robust.These requirements for Bluetooth create manychallenges. Bluetooth meets these challenges byseveral means. The radio unit employs FrequencyHopping Spread Spectrum (FHSS), and the designemphasis is on very low power, extremely low cost, and robust operation in the uncoordinated,interference-dominated RF environment of theIndustrial, Scientific, and Medical (ISM) radioband.
A wide variety of Bluetooth radio block diagramsare in use. For transmission, these range fromdirect VCO modulation to IQ mixing at the finalRF. In the receiver, a conventional frequency discriminator or IQ down-conversion combinedwith analog-to-digital conversion has been noted.While many options can satisfy the Bluetooth radiospecifications, each will have its own characteris-tics if not operating correctly.
The Bluetooth system consists of a radio unit, abaseband link control unit, and link managementsoftware. It also includes higher-level software utilities that focus on interoperability features andfunctionality. Figure 1 is a block diagram for thistype of frequency hopping system, showing thebaseband controller and the RF transmitter andreceiver sections.
Figure 1. Block diagram of a Bluetooth system
FMmodulator
Low-passfilter
DAC
Burstmodulator
Transmitter
Switchdriver
RFfilter
DSPbaseband processor
(burst mode control)
FlashROM
16-bitprocessor
RAM
Input/output
Clock
Control/processor
Tohost
Baseband RF
FMdemodulator
Thresholddetector& clock
recovery
IFfilter
Receiver
Frequency hopping control
µ

Specification
2400 to 2483.5 MHz (ISM radio band)
0.5 BT Gaussian-filtered 2FSK at 1 Msymbol/s
Modulation index: 0.28 to 0.35 (0.32 nominal)
1600 hops/s (in normal operation)1
1 MHz channel spacing
The system has five different hopping sequences:
1) Page hopping sequence
2) Page response sequence
3) Inquiry sequence
4) Inquiry response sequence
5) Channel hopping sequence
The first four are restricted hopping sequences used
during connection setup. The normal channel hopping
sequence is pseudorandom based on the master clock value
and device address.
Power Class 1:
1 mW (0 dBm) to 100 mW (+20 dBm)
Power Class 2:
0.25 mW (–6 dBm) to 2.5 mW (+4 dBm)
Power Class 3:
1 mW (0 dBm)
10 cm to 10 m (100 m with Power Class 1)
The asynchronous channel can support an asymmetric
link of maximally 721 kbps in either direction while permit-
ting 57.6 kb/s in the return direction, or a 432.6 kbps
symmetric link.
5
1.1 Bluetooth radio unitThe Bluetooth radio unit is shown in figure 1 asthe transmitter and receiver sections of the blockdiagram. The transmitter upconverts the basebandinformation to the frequency-modulated carrier.Frequency hopping and bursting are performed at this level. Conversely, the receiver downconvertsand demodulates the RF signal. Table 1 summa-rizes some of the key RF characteristics ofBluetooth.
The Bluetooth channels are each 1 MHz wide. Thefrequency hopping occurs over the 79 channels.Figure 2 depicts the frequency hopping channels,divided by geographic regions.
Characteristic
Carrier frequency
Modulation
Hopping
Transmit power
Operating range
Maximum datathroughput
Notes
f = 2402 + k MHz, k = 0, 1, 2...,78
Digital FM scheme
The peak frequency deviation allowed
is 175 kHz
The channel hopping sequence is
designed to visit each frequency
regularly and with roughly equal
probability. It has a periodicity of
23 hours and 18 minutes.
Class 1 power control:
+4 to +20 dBm (required)
–30 to 0 dBm (optional)
Class 2 power control:
–30 to 0 dBm (optional)
Class 3 power control:
–30 to 0 dBm (optional)
Data throughput is lower than the
1 Msymbol/s rate as a result of the
overhead, which is inherent in the
protocol.
1. Hop speed may vary depending on packet length.
Table 1. Key Bluetooth RF characteristics

6
The modulation in a Bluetooth system is 2-levelfrequency shift keying (2FSK). This is a digitalmodulation format in which the modulated carriershifts between two frequencies representing a “1”and a “0”. As a result, 2FSK provides one bit ofdata per symbol. Figure 3 is an example of 2FSKmodulation illustrating the two discrete frequen-cies. Unlike many other forms of digital modula-tion—such as GSM—amplitude and phase are not ofprimary concern in this type of modulationscheme.
Figure 2. Bluetooth frequency channels
2FSKAmplitude versus time
Figure 3. 2FSK modulation

7
1.2 Bluetooth link control unit and link managementThe Bluetooth link control unit, also known as the link controller, determines the state of thedevice and is responsible for establishing the network connections as well as power efficiency, error correction, and encryption.
The link management software works with the linkcontrol unit. Devices communicate among eachother through the link manager. Table 2 provides a summary of the link control and managementfunctions. More detail follows the table.
Function
Network connections
Link types
Packet types
Error correction
Authentication
Encryption
Test modes
Description
The master’s link controller initiates the connection procedure
and sets the power saving mode of the slave.
Two link types:
• Synchronous Connection Oriented (SCO) type,
primarily for voice
• Asynchronous Connectionless (ACL) type, primarily for
packet data
NULL, POLL, FHS—System packets
DM1, DM3, DM5—Medium rate, error-protected data packets
DH1, DH3, DH5—High rate, non-protected data packets
HV1, HV2, HV3—Digitized audio, 3 levels of error protection
DV—Mixed data and voice
AUX1—For other uses
Three error correction schemes:
• 1/3 rate forward error correction (FEC) code
• 2/3 rate FEC code
• Automatic repeat request (ARQ) scheme for data
Challenge-response algorithm.
Authentication may be unused, unidirectional,
or bi-directional.
Stream cipher with secret key lengths of 0, 40, or 64 bits.
Provides the ability to place the device into test loopback mode
and allows control of test parameters such as frequency settings,
power control, and packet type.
Notes
Bluetooth can support an asynchronous
data channel, up to three simultaneous syn-
chronous voice channels, or a channel that
simultaneously supports asynchronous data
and synchronous voice.
Time-Division Duplexing for full duplex
operation.
The 1, 3 and 5 suffixes indicate the number
of time slots occupied by the data burst.
Nominal burst lengths:
DH1–366 µs
DH3–1622 µs
DH5–2870 µs
Error correction is provided by the
Link Manager
Authentication is provided by the
Link Manager
Table 2. Summary of link control and management functions

8
Bluetooth radios may operate as either master or slave units. The link manager sets up the con-nection between master and slave units and alsodetermines the slave’s power saving mode. A mas-ter can be actively communicating with up to sevenslaves, while another 200+ slaves can be registeredin a noncommunicating, power-saving mode. This area of control is defined as a piconet. A mas-ter in one piconet may be a slave to a master froma different piconet. Similarly, multiple mastersfrom different piconets may control a single slave.This network of piconets is referred to as a scatter-net. Figure 4 depicts two piconets comprising ascatternet. Units that are not part of either piconetremain in standby mode.
The Bluetooth band is divided into time slots, whereeach slot corresponds to an RF hop frequency. Inthe time division duplex (TDD) scheme used, themaster transmits in even-numbered time slots, andthe slave in odd-numbered time slots. Voice bits or
data bits within piconets are transmitted in pack-ets. Packets transmitted by the master or the slavemay extend over one, three, or five time slots. Apacket, shown in figure 5, contains an access code,a header, and payload. The access code consists ofa preamble, a sync word, and an optional trailer.The header contains piconet address and packetinformation. The payload carries the user’s voiceor data information. Refer to the Specification ofthe Bluetooth System [2] for further details onpacket construction.
The link manager needs to support the Bluetoothtest modes. These test modes should provide keycapabilities for testing Bluetooth devices. Theseinclude the ability to place the device into testloopback mode and the ability to define transmitand receive frequencies, power control, and otherkey parameters.
Figure 4. Network topology
S
S
MS
M
ps
sb
S
S
S
sb
ps
Master unit
Slave unit
Slave unit in power
saving mode
Unit in standby mode
M -
S -
ps -
sb -
)
codeHeader Payload (w/CRC)
LSB MSB
72 bits 54 bits 0 - 2745 bits
Preamble
LSB MSB
4 bits 64 bits 4 bits
Sync word (including BD address)
Access
AM_ADDR HEC
LSB MSB
3 bits 1 bit4 bits
Type
Trailer
Flow ARQN
1 bit 1 bit 8 bits
SEQN
Figure 5. Bluetooth general packet format

9
2. Transmitter measurementsThis chapter provides a framework for theBluetooth transmitter tests and test methodology.It describes the measurements that can be madetoday on Bluetooth components and systems.Examples and supporting information are provid-ed. The Bluetooth RF Test Specification [1], whichdescribes the test requirements for certification of the Bluetooth RF layer, is the definitive guide.1
Figure 6 illustrates an example of a transmittermeasurement setup. For transmitter tests, theBluetooth device under test may be placed in loop-back. As a slave device it will need to generate itsburst timing by receiving poll packets from the signal generator. This allows a signal from the digital signal generator to be transmitted intothe device’s receiver and looped back through itstransmitter for analysis. The Bluetooth device’stest mode is controlled either by protocol sent overa RF connection or by direct digital control of thedevice; either method requires a type of Bluetooth
test mode control. Note that cable losses and mismatches in the frequency band used by theBluetooth system can have severe effects on thesignal levels within a test system. It is importantto use components whose performance is knownto be adequate.
If a direct cable connection is not possiblebetween the Bluetooth device and the measure-ment equipment, a suitable coupling device suchas an antenna will be necessary. The path lossbetween the antenna should be accounted for inthe calculations. This can be evaluated using nor-mal swept-frequency testing.
Figure 6. Transmitter measurement setup
RF outRF in
Spectrumanalyzer
Bluetooth deviceunder test
(loopback mode)
Bluetooth testmode control
Vectorsignal
analyzer
Powermeter
PCcontroller(optional)
LMP testcommands
(host link or RF)
GPIB
RS-232
forloopback
Digital signalgenerator
1. At the time of writing, RF test requirements for Bluetooth are still being defined. Refer to the latest Bluetooth RF Test Specification [1]
for the most current test requirements.

Frequency Test Packet Payload MeasurementTransmitter test hopping mode type data bandwidths
Tx output spectrum Off Loopback1 DH1 PRBS 9 100 kHz RBW
Frequency range 300 kHz VBW
Tx ouput spectrum Off Loopback1 DH1 PRBS 9 10 kHz RBW
–20 dB bandwidth 30 kHz VBW
Tx output spectrum Off Loopback1 DH1 PRBS 9 100 kHz RBW
adjacent channel power 300 kHz VBW
Modulation characteristics ≥3 MHz
10
Table 3 provides a summary of the test parametersrequired for the transmitter tests.
Because the Bluetooth signal is a sequence of TDD bursts, it is necessary to trigger properly.Triggering is on the rising edge of the envelope to obtain a viewable signal.
The frequency hopping of the Bluetooth systemadds a further degree of complexity to signalanalysis. Hopping is needed for testing the func-tional capability of the Bluetooth device, whereasfor parametric tests, hopping isn’t essential. Toreduce the number of variables and identify indi-vidual performance characteristics, hopping isturned off for a number of tests. However, thetransmit and receive channels can be set at theextreme ends of the band, forcing the voltage-controlled oscillator (VCO) in the device under testto switch frequency. Each method is tailored to therequirements of the test and is documented in theBluetooth RF Test Specification [1].
Three different types of payload data are called forin different test cases. They are PRBS9, 10101010,and 11110000. Each pattern provides differentstress mechanisms and is selectively chosen foreach measurement. PRBS9 is a pseudorandom bitsequence of period 29-1 that is intended to simu-late live traffic and so produces a modulated signalwith a spectral distribution approximating that ofa real signal. The 10101010 pattern provides anadditional test for the modulation filter. It also changes the spectral shape of the transmit-ter output. The 11110000 pattern allows a check of the Gaussian filtering. After a series of four 1sor four 0s, the output should have reached its fully settled condition. The use of different pat-terns also helps identify problems with IQ modula-tion schemes. Note, an ideal Gaussian filter willproduce a ratio of 88 percent between the peak frequency deviation of a 10101010 signal and thatof the 11110000 signal. The Bluetooth radio speci-fication calls for >80 percent to be achieved.
1. If loopback is not initially available, use of a method utilizing a special mode, called Tx Mode, is allowed.
Table 3. Transmitter test parameters
11
Throughout this transmission measurement sec-tion, reference is made to two types of signal ana-lyzers, vector signal analyzers and swept-tunedspectrum analyzers. Vector signal analyzers differfrom spectrum analyzers in that they capture boththe magnitude and phase of the input signal, allow-ing them to make a wide selection of measure-ments in the time, frequency, and modulationdomains. In addition, some spectrum analyzers,such as the Agilent ESA-E series, have FM demodu-lation and DSP capability. This allows these analyz-ers to perform many of the tests traditionallyassociated with vector signal analyzers. For manyof the Bluetooth tests, either type of instrument iscapable of performing the measurements; in somecases, one is faster or simpler than the other.Selection of the appropriate instrument will varydepending upon the needs of the user and the sta-tus of the product design. Refer to Appendix A fora matrix identifying which type of equipment canbe used for each test.
2.1 Power testsRF transmitter power measurements include aver-age power in a burst, peak power, power density,and power control. Power level is a critical parame-ter in digital communication systems. These testshelp to ensure that power levels are high enough to maintain links, yet low enough to minimizeinterference within the ISM band and to maximize battery life.
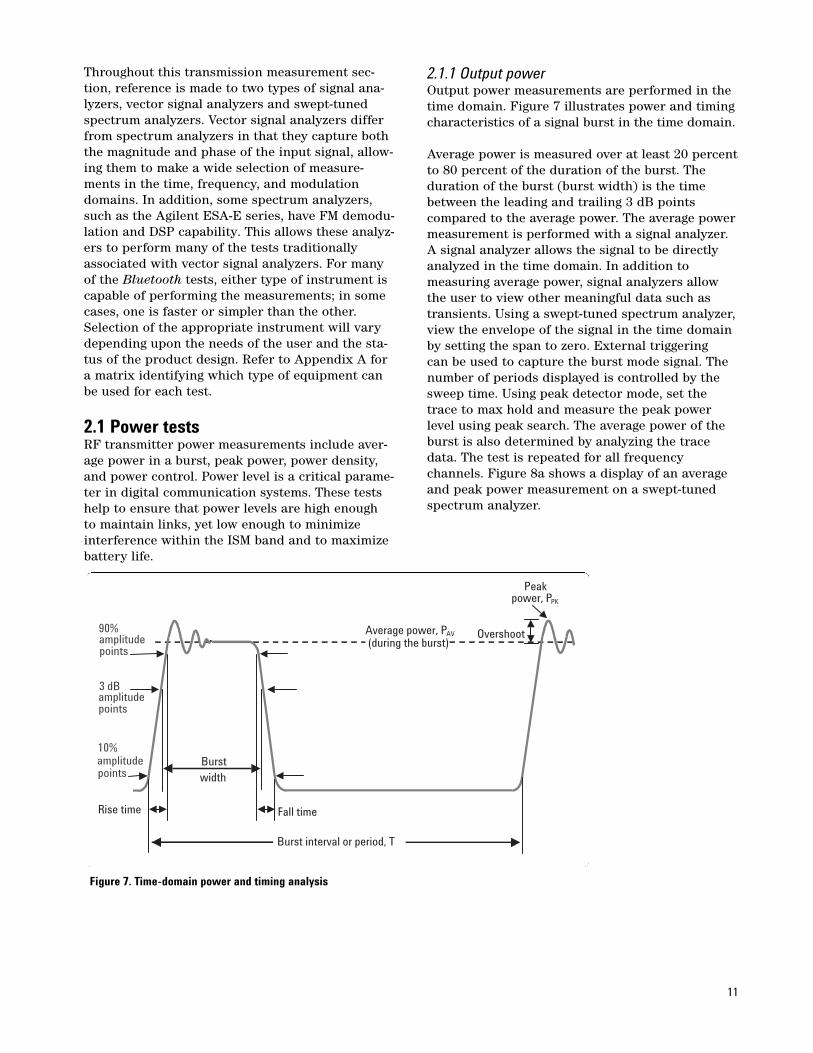
2.1.1 Output powerOutput power measurements are performed in thetime domain. Figure 7 illustrates power and timingcharacteristics of a signal burst in the time domain.
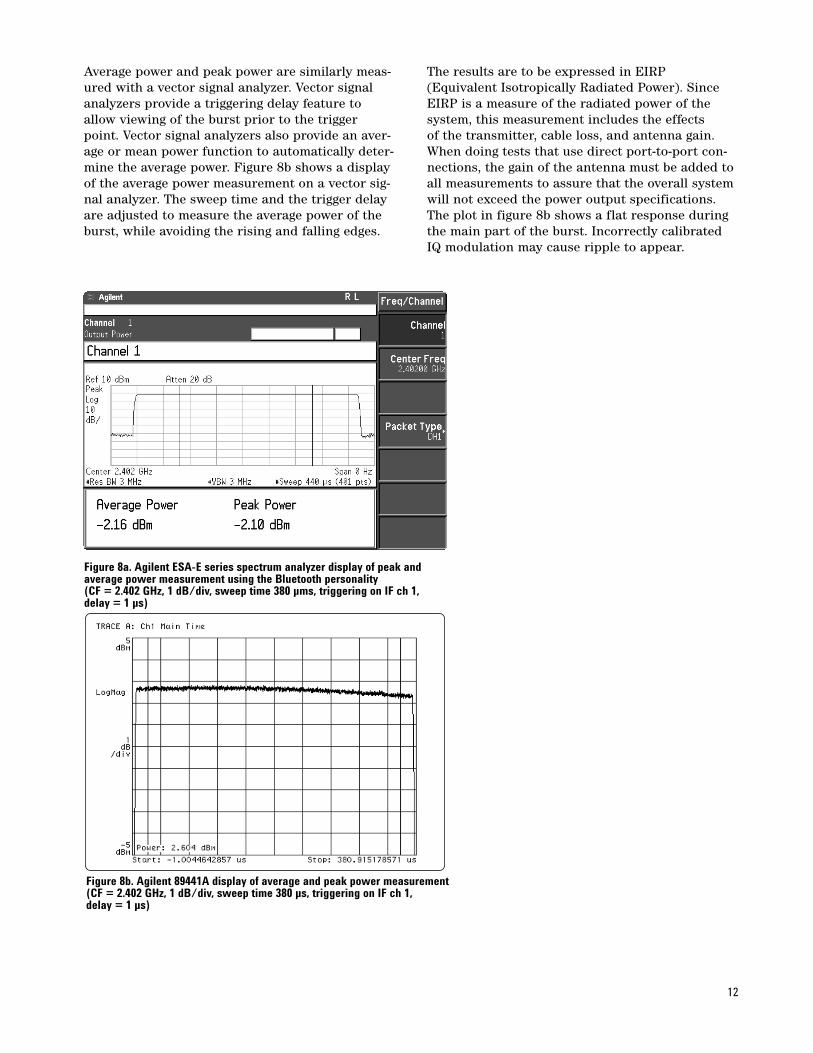
Average power is measured over at least 20 percentto 80 percent of the duration of the burst. Theduration of the burst (burst width) is the timebetween the leading and trailing 3 dB points compared to the average power. The average powermeasurement is performed with a signal analyzer.A signal analyzer allows the signal to be directlyanalyzed in the time domain. In addition to measuring average power, signal analyzers allowthe user to view other meaningful data such astransients. Using a swept-tuned spectrum analyzer,view the envelope of the signal in the time domainby setting the span to zero. External triggering can be used to capture the burst mode signal. The number of periods displayed is controlled by thesweep time. Using peak detector mode, set thetrace to max hold and measure the peak powerlevel using peak search. The average power of theburst is also determined by analyzing the tracedata. The test is repeated for all frequency channels. Figure 8a shows a display of an averageand peak power measurement on a swept-tunedspectrum analyzer.
Figure 7. Time-domain power and timing analysis
Overshoot
Peakpower, PPK
3 dBamplitudepoints
10%amplitudepoints
90%amplitudepoints
Average power, PAV
Rise time Fall time
Burst
width
Burst interval or period, T
(during the burst)
12
Average power and peak power are similarly meas-ured with a vector signal analyzer. Vector signalanalyzers provide a triggering delay feature toallow viewing of the burst prior to the triggerpoint. Vector signal analyzers also provide an aver-age or mean power function to automatically deter-mine the average power. Figure 8b shows a displayof the average power measurement on a vector sig-nal analyzer. The sweep time and the trigger delayare adjusted to measure the average power of theburst, while avoiding the rising and falling edges.
The results are to be expressed in EIRP(Equivalent Isotropically Radiated Power). SinceEIRP is a measure of the radiated power of the system, this measurement includes the effects of the transmitter, cable loss, and antenna gain. When doing tests that use direct port-to-port con-nections, the gain of the antenna must be added toall measurements to assure that the overall systemwill not exceed the power output specifications.The plot in figure 8b shows a flat response duringthe main part of the burst. Incorrectly calibratedIQ modulation may cause ripple to appear.
Figure 8a. Agilent ESA-E series spectrum analyzer display of peak andaverage power measurement using the Bluetooth personality(CF = 2.402 GHz, 1 dB/div, sweep time 380 µms, triggering on IF ch 1, delay = 1 µs)
Figure 8b. Agilent 89441A display of average and peak power measurement(CF = 2.402 GHz, 1 dB/div, sweep time 380 µs, triggering on IF ch 1, delay = 1 µs)
13
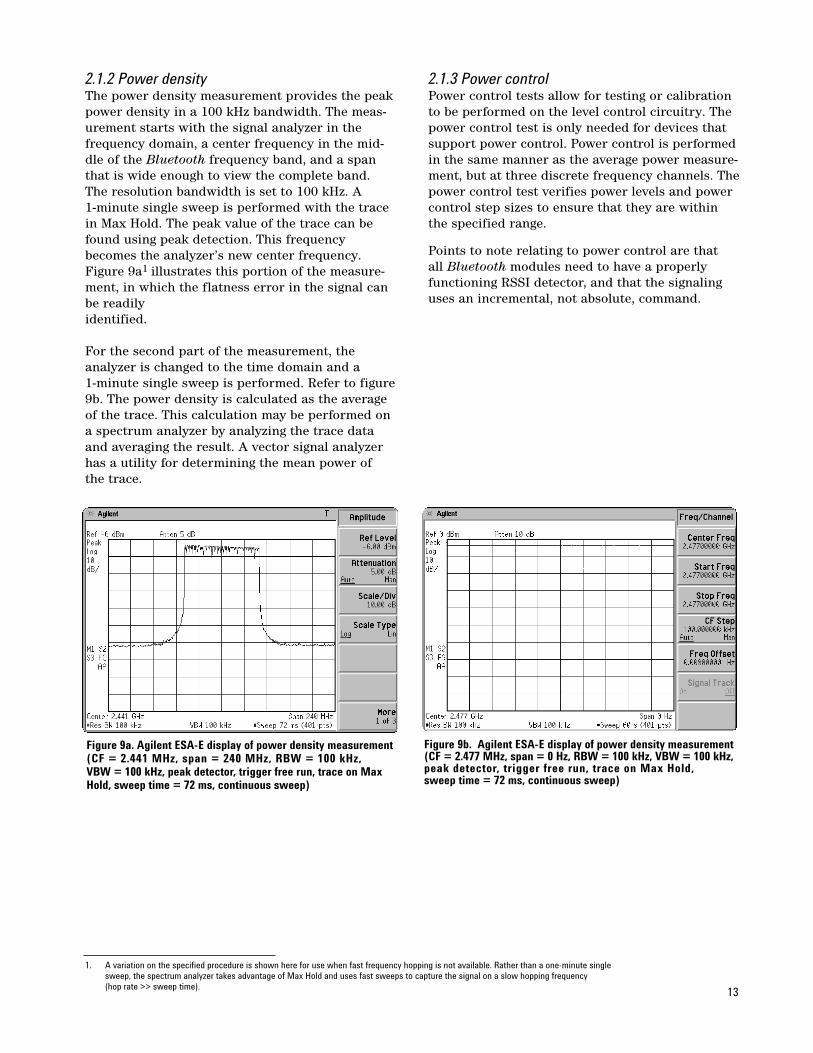
2.1.2 Power densityThe power density measurement provides the peakpower density in a 100 kHz bandwidth. The meas-urement starts with the signal analyzer in the frequency domain, a center frequency in the mid-dle of the Bluetooth frequency band, and a spanthat is wide enough to view the complete band. The resolution bandwidth is set to 100 kHz. A 1-minute single sweep is performed with the tracein Max Hold. The peak value of the trace can befound using peak detection. This frequencybecomes the analyzer’s new center frequency.Figure 9a1 illustrates this portion of the measure-ment, in which the flatness error in the signal canbe readily identified.
For the second part of the measurement, the analyzer is changed to the time domain and a 1-minute single sweep is performed. Refer to figure9b. The power density is calculated as the averageof the trace. This calculation may be performed ona spectrum analyzer by analyzing the trace dataand averaging the result. A vector signal analyzerhas a utility for determining the mean power of the trace.
2.1.3 Power controlPower control tests allow for testing or calibrationto be performed on the level control circuitry. Thepower control test is only needed for devices thatsupport power control. Power control is performedin the same manner as the average power measure-ment, but at three discrete frequency channels. Thepower control test verifies power levels and powercontrol step sizes to ensure that they are withinthe specified range.
Points to note relating to power control are that all Bluetooth modules need to have a properlyfunctioning RSSI detector, and that the signalinguses an incremental, not absolute, command.
Figure 9a. Agilent ESA-E display of power density measurement (CF = 2.441 MHz, span = 240 MHz, RBW = 100 kHz, VBW = 100 kHz, peak detector, trigger free run, trace on MaxHold, sweep time = 72 ms, continuous sweep)
Figure 9b. Agilent ESA-E display of power density measurement (CF = 2.477 MHz, span = 0 Hz, RBW = 100 kHz, VBW = 100 kHz,peak detector, trigger free run, trace on Max Hold, sweep time = 72 ms, continuous sweep)
1. A variation on the specified procedure is shown here for use when fast frequency hopping is not available. Rather than a one-minute single
sweep, the spectrum analyzer takes advantage of Max Hold and uses fast sweeps to capture the signal on a slow hopping frequency
(hop rate >> sweep time).
14
2.2 Transmit output spectrumThe transmit output spectrum measurements analyze the power levels in the frequency domain to ensure that out-of-channel emissions are mini-mized. This helps reduce overall system interferenceand ensure regulatory compliance. The measure-ments compare the device’s output power spectrumto a predefined mask that has the characteristicsshown in table 4.
Table 4. Outline spectrum mask requirements
NOTE: M is the integer channel number of the transmitting channel
and N is the integer channel number of the adjacent channel that is
being measured.
As summarized in table 3, the Bluetooth specifica-tion splits the test into three parts:1. frequency range2. –20 dB bandwidth3. adjacent channel power
The first two use peak detection; adjacent channelpower uses average detection. All three use Max Hold.
For the frequency range test, the carrier is set tothe upper and lower channels. Having sampledlong enough to capture the highest RF levels, apower density check is made. The signal must be below –80 dbm/Hz EIRP at 2400 MHz and 2483.5 MHz.
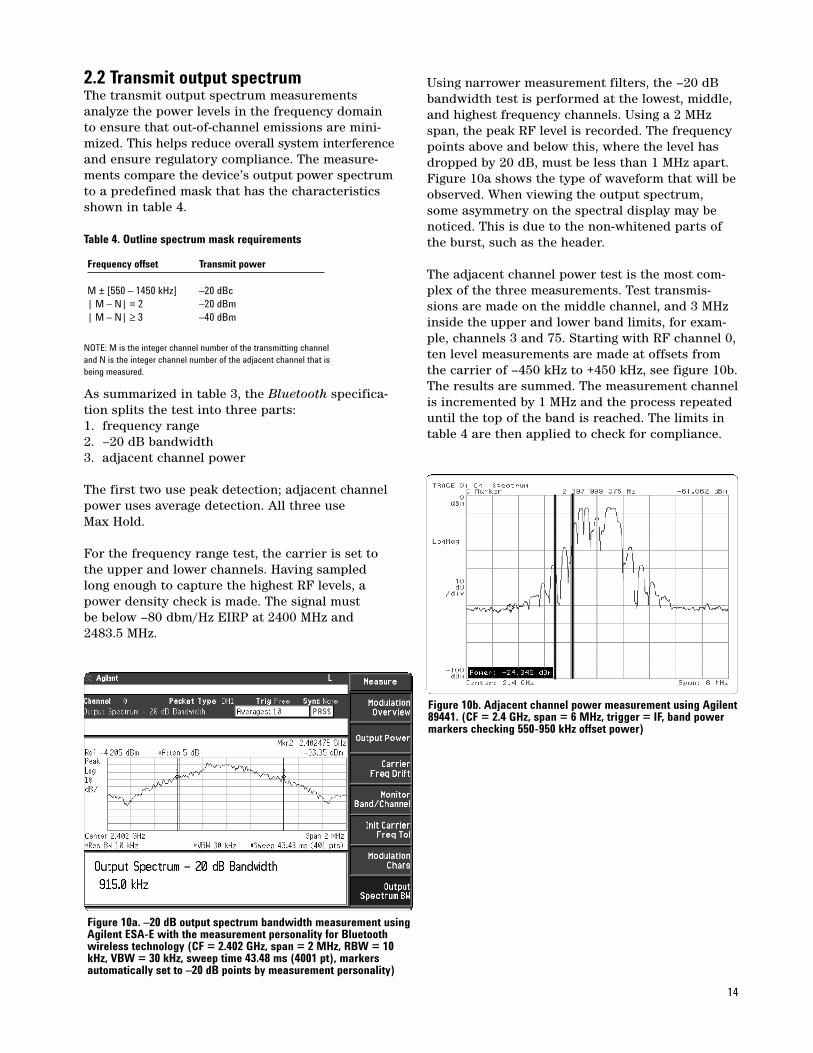
Using narrower measurement filters, the –20 dBbandwidth test is performed at the lowest, middle,and highest frequency channels. Using a 2 MHz span, the peak RF level is recorded. The frequencypoints above and below this, where the level hasdropped by 20 dB, must be less than 1 MHz apart.Figure 10a shows the type of waveform that will beobserved. When viewing the output spectrum,some asymmetry on the spectral display may benoticed. This is due to the non-whitened parts ofthe burst, such as the header.
The adjacent channel power test is the most com-plex of the three measurements. Test transmis-sions are made on the middle channel, and 3 MHzinside the upper and lower band limits, for exam-ple, channels 3 and 75. Starting with RF channel 0,ten level measurements are made at offsets fromthe carrier of –450 kHz to +450 kHz, see figure 10b.The results are summed. The measurement channelis incremented by 1 MHz and the process repeateduntil the top of the band is reached. The limits intable 4 are then applied to check for compliance.
Figure 10a. –20 dB output spectrum bandwidth measurement usingAgilent ESA-E with the measurement personality for Bluetoothwireless technology (CF = 2.402 GHz, span = 2 MHz, RBW = 10kHz, VBW = 30 kHz, sweep time 43.48 ms (4001 pt), markers automatically set to –20 dB points by measurement personality)
Figure 10b. Adjacent channel power measurement using Agilent89441. (CF = 2.4 GHz, span = 6 MHz, trigger = IF, band powermarkers checking 550-950 kHz offset power)
Frequency offset Transmit power
M ± [550 – 1450 kHz] –20 dBc
| M – N| = 2 –20 dBm
| M – N| ≥ 3 –40 dBm
15
2.3 Modulation testsBluetooth modulation measurements consist ofmodulation characteristics, initial carrier frequencytolerance, and carrier frequency drift. Modulationmeasurements reflect the performance of the mod-ulator circuitry as well as the stability of the localoscillator. Both the modulator and the VCO may beaffected by digital noise on the power supply or bythe transmit power bursts. Care is needed in theradio design to avoid frequency pulling by thepower supply. Verification of modulation charac-teristics requires the ability to demodulate theBluetooth signal so that the frequency of each bitcan be determined.
2.3.1 Modulation characteristicsThe modulation characteristics test is a frequencydeviation measurement. For modulation character-istics, two sets of a repeating 8-bit sequence areused in the payload. These are 00001111 and01010101. The combination of the two sequenceschecks both the modulator performance and thepremodulation filtering.
If a vector signal analyzer is used to demodulatethe signal, phase and symbol information are main-tained. The frequencies of certain bits in the 8-bitsequence are measured and averaged together.Then, the maximum deviation from the average forthese bits is recorded. Finally, an average of themaximum deviations is computed. Both the maximum deviations and the average of the maximum deviations are used in the result. Thisprocedure is performed for the 00001111 payloadsequence over a period of at least 10 packets.
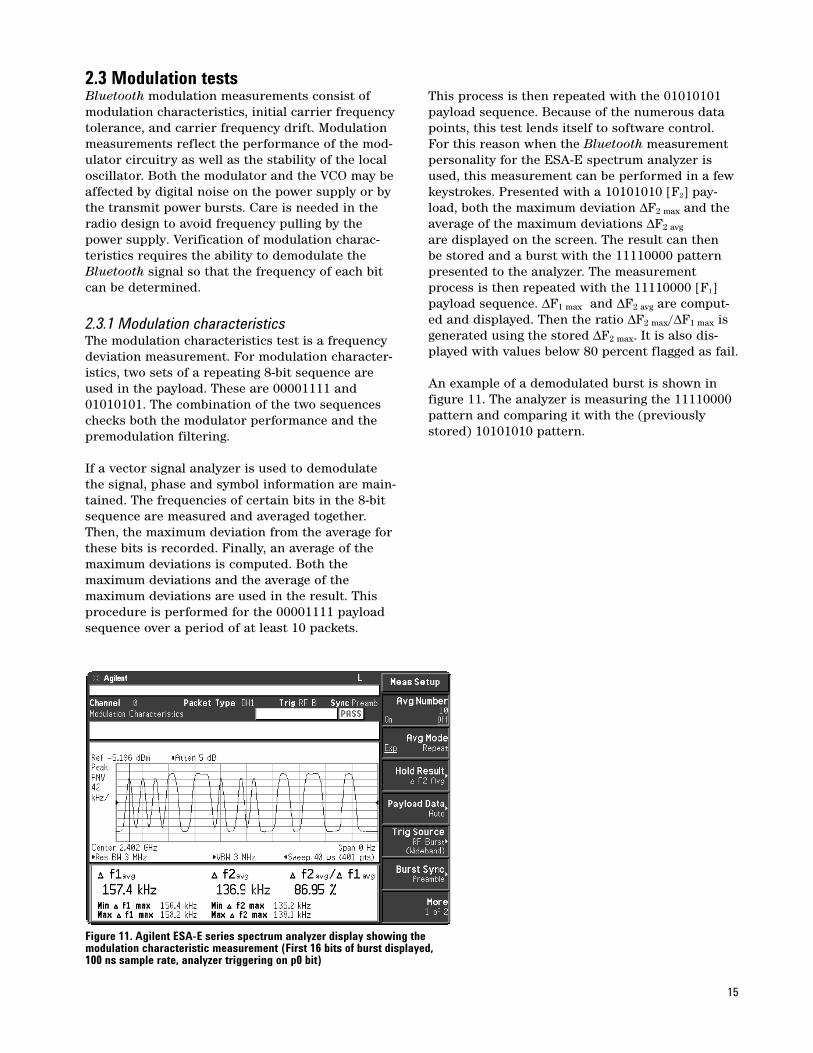
This process is then repeated with the 01010101payload sequence. Because of the numerous datapoints, this test lends itself to software control.For this reason when the Bluetooth measurementpersonality for the ESA-E spectrum analyzer isused, this measurement can be performed in a fewkeystrokes. Presented with a 10101010 [F2] pay-load, both the maximum deviation ∆F2 max and theaverage of the maximum deviations ∆F2 avg
are displayed on the screen. The result can then be stored and a burst with the 11110000 patternpresented to the analyzer. The measurementprocess is then repeated with the 11110000 [F1]payload sequence. ∆F1 max and ∆F2 avg are comput-ed and displayed. Then the ratio ∆F2 max/∆F1 max isgenerated using the stored ∆F2 max. It is also dis-played with values below 80 percent flagged as fail.
An example of a demodulated burst is shown infigure 11. The analyzer is measuring the 11110000pattern and comparing it with the (previouslystored) 10101010 pattern.
Figure 11. Agilent ESA-E series spectrum analyzer display showing themodulation characteristic measurement (First 16 bits of burst displayed,100 ns sample rate, analyzer triggering on p0 bit)

16
2.3.2 Modulation qualityVector signal analyzers have the ability to providecomprehensive modulation quality measurements,which can detect, quantify, and help track downthe sources of signal problems such as intermodu-lation due to transmitter interference, power sup-ply noise modulation, and power and stability atantenna mismatch. Although not directly a part ofthe Bluetooth RF Test Specification [1], modula-tion quality measurements such as FSK error, magnitude error, and the eye diagram are valuabletroubleshooting tools. Figure 12 provides a four-display view of a demodulation measurement on a Bluetooth signal with frequency drift impair-ment. The frequency drift is easily seen in thelower left display.
2.3.3 Initial carrier frequency toleranceThe initial carrier frequency tolerance test verifies the accuracy of the transmitter’s carrierfrequency. A standard DH1 packet with a pream-ble and with a pseudorandom bit sequence (PRBS)as payload is used. The initial 4 bits of a packet,the preamble bits, are analyzed to determine theextent of the frequency deviation from center frequency. This measurement requires the signal tobe demodulated to measure the frequency devia-tion of each symbol. After demodulation, the fre-quency offset of each of the preamble bits ismeasured and averaged. When performing thismeasurement, make sure that the frequency spanof the signal analyzer is wide enough to provideproper demodulation of the wide-bandwidthBluetooth signal.
Figure 12. Agilent 89441A display of demodulation quality test

17
Figure 13 shows an example of the measurement in which the first 8 bits are displayed; the first 4 of these bits comprise the “1010” preamble.Frequency hopping is off. The test specificationrequires this measurement to be performed bothwith hopping on and with hopping off. In eithercase, the signal analyzer will be set to one frequen-cy channel; however, when hopping is on, therewill be the additional effect of slew as the trans-mitter quickly jumps from one frequency to thenext. The slew may be noticed in the initial carrierfrequency offset as the carrier frequency settles.The additional stress from hopping will help iden-tify amplifier response problems.
An alternative method of measuring the initial carrier frequency tolerance is available with theAgilent 89441A vector signal analyzer in demodula-tion mode. With its result length set to the mini-mum number of symbols (10), this analyzerprovides the carrier offset at a glance in its symbolerror display. Since this minimum number of sym-bols is greater than four, the user may notice lessvariation on the result due to noise. It is importantthat the 0101 pattern is continued. The carrier off-set result, which is provided in the summary tableof the display shown in figure 12, provides anexample of this initial carrier offset measurement.
Figure 13. Agilent ESA-E spectrum analyzer display of initial carrier frequency tolerance showing a 8.5 kHz offset (CF = 2.402 GHz, triggered on p0 bit)

18
2.3.4 Carrier frequency driftCarrier frequency drift is also measured as ademodulated signal using either a spectrum analyz-er capable of FM demodulation or a vector signalanalyzer. The payload data consists of a repeating4-bit 1010 sequence. To perform the measurement,the absolute frequencies of the 4 preamble bits aremeasured and integrated; this provides the initialcarrier frequency. Then the absolute frequencies of each successive 10-bit part in the payload aremeasured and integrated. The frequency drift isthe difference between the average frequency ofthe 4 preamble bits and the average frequency ofany 10 bits in the payload field. The maximumdrift rate is also checked, and is defined as the
difference between any two adjacent 10-bit groupswithin the payload field. This measurement isrepeated with the lowest, middle, and highest oper-ating frequencies, first with hopping off, then withhopping on. It is also repeated for varying packetlengths. Software control makes this repetitivemeasurement easier. Figure 14 provides an exam-ple of a carrier frequency drift measurement usingthe Bluetooth measurement personality of theESA-E series spectrum analyzer. It shows animpaired Bluetooth signal with a 101010 repeatingpayload sequence and –35.7 kHz of frequency drift.This is outside the limits set by the standards, so itis flagged as a fail (F) by the automated software.
Figure 14. Agilent ESA-E spectrum analyzer display of frequency drift showingan initial carrier frequency (ICFT) of -72 Hz with respect to nominal channel 1center frequency, –35.7 kHz drift across the burst and –1.168 kHz maximumdrift rate. (CF = 2.402 GHz, triggered on p0 bit, DH1 packet length, channel 1,F indicates maximum frequency drift limit exceeded)

19
2.4 Timing testsTiming tests may be performed on Bluetoothsignals; these tests include analysis of the burstprofile, phase lock loop (PLL) settling time, andother timing characteristics. These tests, althoughnot part of the specifications, help R&D engineersensure that their designs meet the criteria of theirspecifications.
2.4.1 Burst profileBurst rise and fall time can be measured in thetime domain using a signal analyzer. No definitionsfor rise time and fall time have been developed forBluetooth wireless technology. The conventionalindustry definition of rise time is the time requiredto rise from the 10 percent (–20 dB) amplitudepoint to the 90 percent (–0.9 dB) amplitude point;the fall time is defined with the same amplitudepoints, but in reverse. Digital enhanced cordless
telecommunication (DECT), a standard with simi-larities to Bluetooth, specifies the rise and falltimes somewhat differently, with the rise time fromthe –30 dB to –3 dB amplitude points and the falltime from the –6 dB to –30 dB amplitude points.Pretriggering allows the rise time to be easily cap-tured and measured. There is no defined mask testfor the burst profile. Some devices may exhibitconsiderably faster transients than that shown.Excessively fast switching will cause failures in theoutput spectrum test by creating increased spec-trum spreading due to the sharper edges of theburst. Figure 15 provides a measurement exampleof a burst rise time and a burst fall time.Additional burst profile characteristics includeon/off ratio of the burst and overshoot (refer to figure 7).
Figure 15a. Agilent 89441A display showing burst rise times(CF = 2.45 GHz, Span = 3 MHz, vector mode, triggering on IFchannel 1, main time ch1, magnitude log(dB), main length = 20 µs)
Figure 15b. Agilent 89441A display showing burst fall times (CF= 2.45 GHz, Span = 3 MHz, vector mode, triggering on IF channel 1, main time ch1, magnitude log(dB), main length = 20 µs)

20
2.4.2 Spectrogram measurementsFigure 16 provides a spectrogram display in whicha radio transmitter exhibits poor PLL settling timeat turn-on. The spectrogram is useful in analyzingthese types of conditions. The spectrogram dis-plays frequency on the x-axis and time on the y-axis. Amplitude is displayed through colors orshades of gray with the brighter colors or shadesrelating to higher amplitudes.
More complex spectrograms may be created byusing the time-capture capabilities of a vector signal analyzer. This allows replaying real-timedata at a slower speed. Symbol timing and ratemay be analyzed in this fashion. Figure 17 shows aspectrogram of the initial 120 µs of a Bluetoothburst. The payload data in this example is11110000, and these alternating patterns of 4 onesand 4 zeros can be seen 157.5 kHz away fromeither side of the center frequency.
Figure 16. Agilent 89441A spectrogram display for PLL settling time
Figure 17. Agilent 89441A spectrogram display for symbol timing and rate
Data bits
21
3. Transceiver measurements
3.1 Spurious emissions testsThe out-of-band spurious emissions tests confirmthat the Bluetooth radio is operating within regula-tory requirements. Two types of spurious emis-sions tests are identified in the specification: conducted emissions and radiated emissions.Conducted emissions are a measure of the spuri-ous emissions generated by the device under testfrom its antenna or output connector. Radiatedemissions are a measure of the spurious emissionsleakage from the cabinet of the device under test.
Separate standards are specified for the USA and for Europe. The USA follows the FederalCommunications Commission (FCC) part 15.247standard. Europe follows the European TechnicalStandards Institute (ETSI) ETS 300 328 standard.
Spurious emissions tests are performed using a spectrum analyzer to sweep through frequencyranges looking for spurs. Specifications for spuri-ous emissions are provided in the Bluetooth RFTest Specification [1]. The ETSI standard requiresa spectrum analyzer frequency range of up to 12.75 GHz, while the FCC standard specifies a frequency range of up to 25.0 GHz.
Tests requiring compliance to the InternationalSpecial Committee on Radio Interference (CISPR)publication 16 may require electromagnetic com-patibility (EMC) spectrum analyzers with quasi-peak detection. These tests are not covered in thisapplication note. Contact your local Agilent salesrepresentative for more information on AgilentEMC products.

22
4. Receiver measurements
4.1 Bit error rate (BER) testsThe receiver measurements specified for Bluetoothwireless technology include the following:
• sensitivity—single-slot packets• sensitivity—multi-slot packets• carrier-to-interference (C/I) performance• blocking performance• intermodulation performance• maximum input level
BER is the criterion used to determine receiverperformance. These tests perform BER analysisunder various conditions. Table 5 provides a summary of the test parameters required for the receiver tests.
Table 5. Receiver test parameters
4.1.1 Sensitivity—single-slot packetsSensitivity is tested by sending various impairedsignals to the receiver and then measuring thereceiver’s BER. The transmit power is chosen sothat the input to the receiver is –70 dBm. The testis performed at the lowest, middle, and highestoperating frequency. The impairments are definedin the test procedure and include variations in thecarrier frequency offset, carrier frequency drift,modulation index, and symbol timing drift. TheAgilent ESG-D series signal generators are theideal tools for generating these signal impairments.Figure 14 provides an example of a signal impair-ment created by this family of signal generators.
4.1.2 Sensitivity—multi-slot packetsThe sensitivity test for multi-slot packets is similarto that of the single-slot packets, except that DH5packets are used instead of DH1 packets. If DH5packets are not supported, DH3 packets are used.
Frequency Test Packet Payload BERReceiver tests hopping mode type data measurement
Sensitivity— Off Loopback DH1 PRBS 9 ≤ 0.1%
single-slot packets On (optional)
Sensitivity— Off Loopback DH5 PRBS 9 ≤ 0.1%
multi-slot packets On (optional) (DH3)
C/I performance Off Loopback Longest supported PRBS 9 ≤ 0.1%
Blocking performance Off Loopback DH1 PRBS 9 ≤ 0.1%
Intermodulation Off Loopback DH1 PRBS 9 ≤ 0.1%
performance
Maximum input level Off Loopback DH1 PRBS 9 ≤ 0.1%
23
4.1.3 Carrier-to-interference (C/I) performanceC/I performance is measured by sending co-chan-nel or adjacent channel Bluetooth signals in paral-lel with the desired signal and then measuring thereceiver’s BER. The ratio of the carrier signal levelto the interfering signal level is specified. The testis performed at the lowest, middle, and highestoperating frequencies, with the interfering signalsat all operating frequencies within the band.1
4.1.4 Blocking performanceThe blocking performance test specifies a transmitand receive frequency of 2460 MHz. The tester continuously sends a Bluetooth signal that is 3 dBover the reference sensitivity level.2 Simultaneously,the tester sends a continuous wave interfering signal and measures the BER of the receiver. Thefull compliance test requires the interfering signalto range from 30 MHz to 12.75 GHz in 1 MHz incre-ments. The power levels associated with each fre-quency range are provided in the specification.1
4.1.5 Intermodulation performanceIntermodulation performance measures unwantedfrequency components resulting from the interac-tion of two or more signals passing through a non-linear device. The test is performed by the testercontinuously sending a Bluetooth signal that is 6dB above the reference sensitivity. Simultaneously,the tester sends signals to generate 3rd, 4th, and5th order intermodulation products. The BER isthen measured to determine the performance ofthe receiver in the presence of intermodulationdistortion.1
4.1.6 Maximum input levelThe maximum input level test measures the BERperformance when the input signal is at a maxi-mum power level specified at –20 dBm. The test is performed at the lowest, middle, and highestoperating frequencies.
1. When performing the carrier-to-interference test, blocking performance test, and the intermodulation performance test, an additional signal generator
may be required to provide the interference signal.
2. The reference sensitivity level is defined as the power level at the receiver input at which the BER is 0.1 percent. The reference sensitivity shall be –70 dBm
(± 1 dB) or better.

For non-frequency-hopping applications, there areseveral ways of creating a Bluetooth signal usingan Agilent ESG-D series signal generator.
Using Option UNDThe personality for Bluetooth wireless technologyillustrated in figure 18 is available with the ESG-Dseries internal dual arbitrary waveform generator(Option UND). This personality produces high datarate, single time slot (DH1) packets with severaluser defined signal and impairment parameters asoutlined in table 6. The ability to produce a multi-slot packet is not built into the personality.However, multi-slot packet signal generation is stillpossible with the arbitrary waveform generator.
Custom wave forms can be created using a varietyof programming languages and then downloaded tothe arbitrary waveform generator for playback.This provides the ability to simulate both normaland impaired multi-slot Bluetooth waveforms.Example Bluetooth waveforms, including un-impaired DH3 and DH5 packets with truncatedPN9 payload data, are available online at:http://www.agilent.com/find/bluetooth_waveforms.
Figure 18. Agilent ESG-D series Option UND configuration menu forBluetooth wireless technology
Table 6. Signal generation example using the Agilent ESG-D series Option UND personality for Bluetooth
Function Setup Notes
Frequency Set the appropriate Bluetooth channel. f = 2402 + k MHz, k = 0, 1, 2,...,78
Amplitude Set the appropriate power level depending upon the test.
Addressing Set the Bluetooth device address and Used by the arbitrary waveform generator when creating the
active member address of the DH1 packet: Access Code and Header fields of the DH1 packet.
1) BD-ADDR 2) AM-ADDR
Payload data Set payload data type for the DH1 packet: Three payload data formats are available for the
1) Continuous PN9 DH1 packet.
2) Truncated PN9
3) User defined 8-bit pattern
Signal Set the signal impairment Generate normal or impaired signals by turning
impairments characteristics: signal impairments OFF or ON.
1) Carrier frequency offset
2) Carrier frequency drift
3) Modulation index
4) Symbol timing rrror
5) AWGN with adjustable C/N
Burst Turn Burst ON or OFF. When ON, Useful when analyzing a receiver’s response
set the number of symbols per ramp. to various transmitter burst profiles.
Clock/gate Set the clock/gate delay in 1/10th Clock and gate signals are generated on Event 1 and Event 2
signals with symbol increments. ports respectively only when continuous PN9 payload data
delay control is selected. Delay control allows re-alignment of the clock and
gate signals with the DH1 packet pay load data when
performing receiver BER analysis.
Section 4.1.7 Signal generation for receiver BER tests

25
Function Setup
Frequency Set to the appropriate Bluetoothchannel, 2.45 GHz, for example
Amplitude Set to the appropriate conditions
depending on the test
FilterFilter shape Gaussian
Filter BbT 0.5
Symbol Rate 1 Msps
DataFrequency deviation –157.5 kHz (for “0”)
Frequency deviation 157.5 kHz (for “1”)
Data bits four “1s” and four “0s”
PulsePulse width 366 µs
Pulse period 1.25 ms1
Pulse on/off On
Figure 19. Agilent ESG-D series Option UN8 pre-configured mode for Bluetooth
Using Option UN8The ESG-D series real-time I/Q baseband generator(Option UN8) also provides signal generation capa-bility for Bluetooth. The baseband generator offersthe ability to manually create pulsed 2FSK signalswith Gaussian filtering and customizable data pat-terns. A step-by-step example of a manually config-ured Bluetooth signal is provided in table 7. A one-button Bluetooth setup is also available to simplifythe configuration process, see figure 19. The real-time I/Q baseband generator does not create struc-tured Bluetooth packets. However, it does offer theability to modulate an assortment of built-in datapatterns including PN9, PN15, PN23, and user-defined bit patterns.
Furthermore, custom user data files for Bluetoothcan be created and downloaded to the real timeI/Q baseband generator for modulation. AdditionalRAM (Option UN9) may be required for generatinglonger packet data files such as DH3 and DH5. Thebaseband generator also offers an external datainput for modulating Bluetooth baseband signals inreal time.
1. Since Bluetooth devices transmit and receive bursts in alternating time slots, the pulse period is defined as two time slots or 2 * 0.625 ms.
Table 7. Bluetooth signal generation example withAgilent ESG series Option UN8 signal generator
26
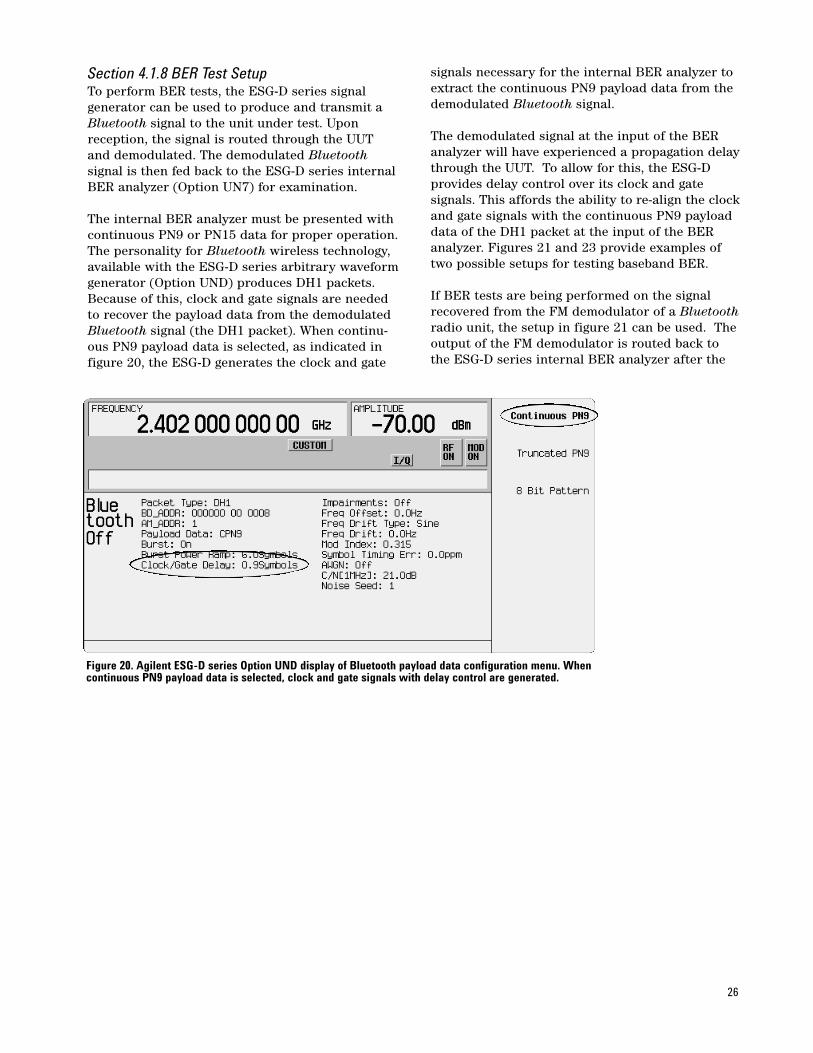
Figure 20. Agilent ESG-D series Option UND display of Bluetooth payload data configuration menu. Whencontinuous PN9 payload data is selected, clock and gate signals with delay control are generated.
Section 4.1.8 BER Test SetupTo perform BER tests, the ESG-D series signal generator can be used to produce and transmit aBluetooth signal to the unit under test. Uponreception, the signal is routed through the UUTand demodulated. The demodulated Bluetoothsignal is then fed back to the ESG-D series internalBER analyzer (Option UN7) for examination.
The internal BER analyzer must be presented withcontinuous PN9 or PN15 data for proper operation.The personality for Bluetooth wireless technology,available with the ESG-D series arbitrary waveformgenerator (Option UND) produces DH1 packets.Because of this, clock and gate signals are neededto recover the payload data from the demodulatedBluetooth signal (the DH1 packet). When continu-ous PN9 payload data is selected, as indicated infigure 20, the ESG-D generates the clock and gate
signals necessary for the internal BER analyzer toextract the continuous PN9 payload data from thedemodulated Bluetooth signal.
The demodulated signal at the input of the BERanalyzer will have experienced a propagation delaythrough the UUT. To allow for this, the ESG-D provides delay control over its clock and gate signals. This affords the ability to re-align the clockand gate signals with the continuous PN9 payloaddata of the DH1 packet at the input of the BERanalyzer. Figures 21 and 23 provide examples oftwo possible setups for testing baseband BER.
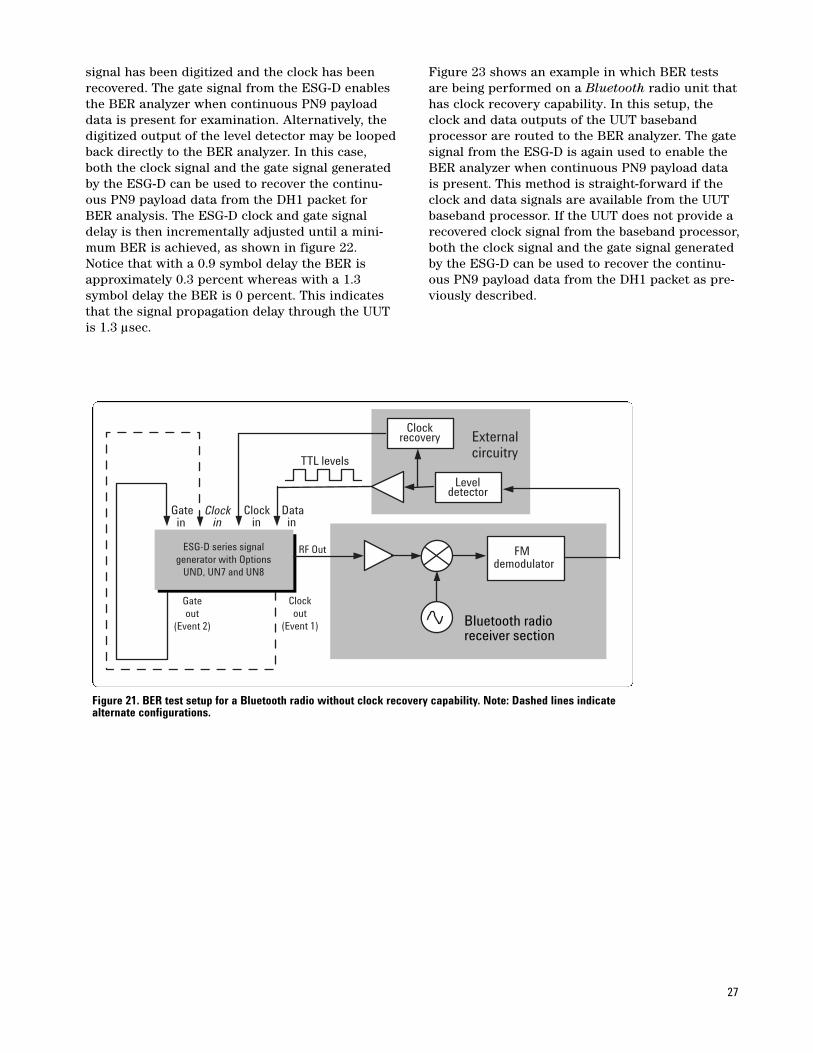
If BER tests are being performed on the signalrecovered from the FM demodulator of a Bluetoothradio unit, the setup in figure 21 can be used. Theoutput of the FM demodulator is routed back tothe ESG-D series internal BER analyzer after the
27
Figure 21. BER test setup for a Bluetooth radio without clock recovery capability. Note: Dashed lines indicatealternate configurations.
FMdemodulator
Bluetooth radioreceiver section
Clockin
Datain
Gatein
Gate
out
(Event 2)
Clock
out
(Event 1)
RF Out
TTL levels
Clockin
ESG-D series signal
generator with Options
UND, UN7 and UN8
External circuitry
Clockrecovery
Leveldetector
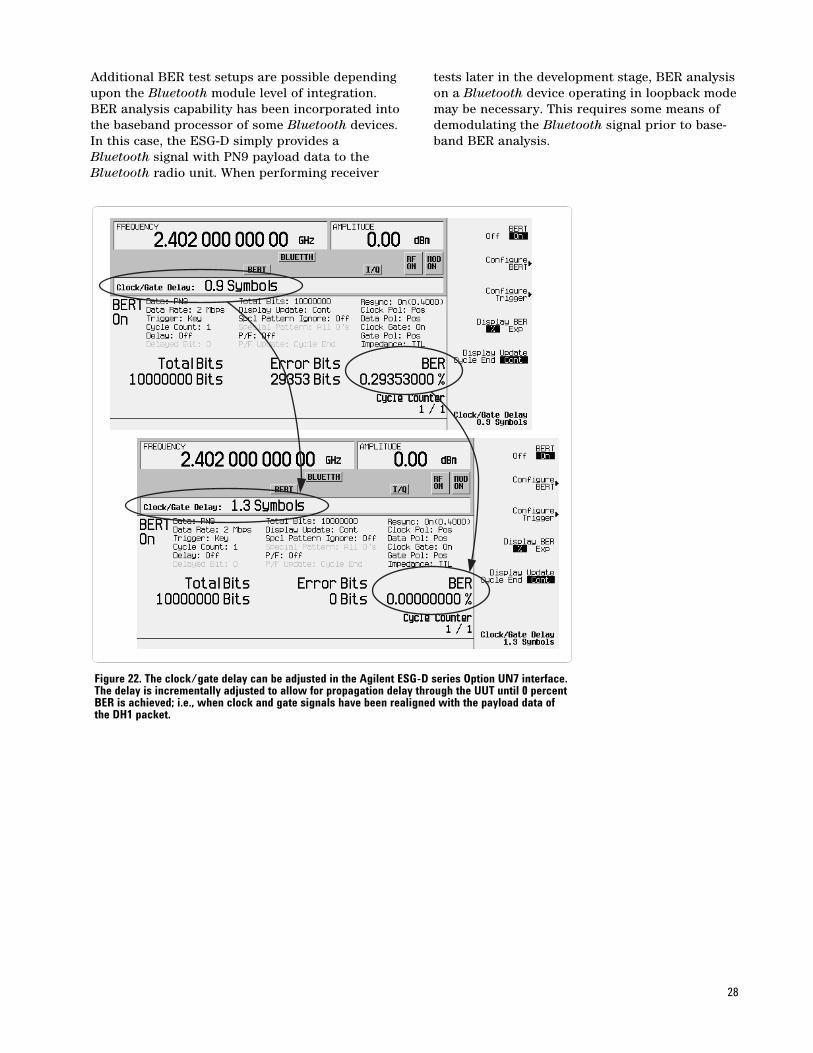
signal has been digitized and the clock has beenrecovered. The gate signal from the ESG-D enablesthe BER analyzer when continuous PN9 payloaddata is present for examination. Alternatively, thedigitized output of the level detector may be loopedback directly to the BER analyzer. In this case,both the clock signal and the gate signal generatedby the ESG-D can be used to recover the continu-ous PN9 payload data from the DH1 packet forBER analysis. The ESG-D clock and gate signaldelay is then incrementally adjusted until a mini-mum BER is achieved, as shown in figure 22.Notice that with a 0.9 symbol delay the BER isapproximately 0.3 percent whereas with a 1.3 symbol delay the BER is 0 percent. This indicatesthat the signal propagation delay through the UUTis 1.3 µsec.
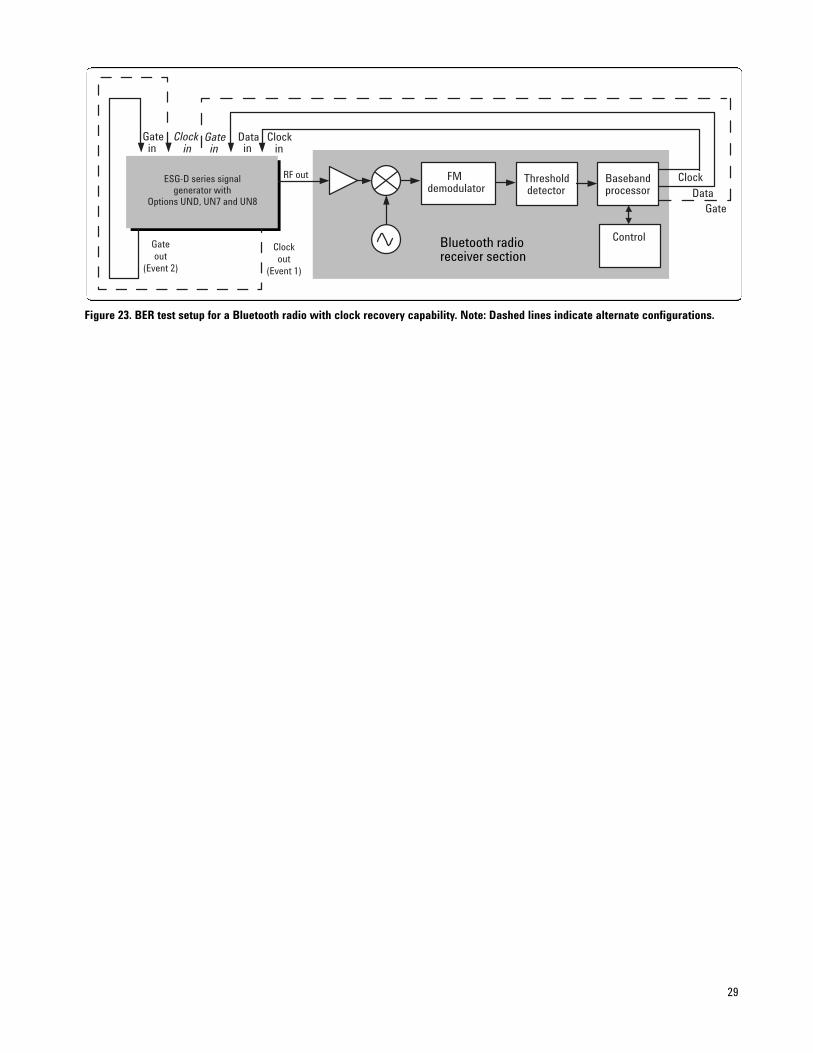
Figure 23 shows an example in which BER testsare being performed on a Bluetooth radio unit thathas clock recovery capability. In this setup, theclock and data outputs of the UUT basebandprocessor are routed to the BER analyzer. The gatesignal from the ESG-D is again used to enable theBER analyzer when continuous PN9 payload datais present. This method is straight-forward if theclock and data signals are available from the UUTbaseband processor. If the UUT does not provide arecovered clock signal from the baseband processor,both the clock signal and the gate signal generatedby the ESG-D can be used to recover the continu-ous PN9 payload data from the DH1 packet as pre-viously described.
28
Additional BER test setups are possible dependingupon the Bluetooth module level of integration.BER analysis capability has been incorporated intothe baseband processor of some Bluetooth devices.In this case, the ESG-D simply provides aBluetooth signal with PN9 payload data to theBluetooth radio unit. When performing receiver
tests later in the development stage, BER analysison a Bluetooth device operating in loopback modemay be necessary. This requires some means ofdemodulating the Bluetooth signal prior to base-band BER analysis.
Figure 22. The clock/gate delay can be adjusted in the Agilent ESG-D series Option UN7 interface.The delay is incrementally adjusted to allow for propagation delay through the UUT until 0 percentBER is achieved; i.e., when clock and gate signals have been realigned with the payload data ofthe DH1 packet.
29
Figure 23. BER test setup for a Bluetooth radio with clock recovery capability. Note: Dashed lines indicate alternate configurations.
FMdemodulator
Thresholddetector
Basebandprocessor
ControlBluetooth radioreceiver section
Clock
Data
Clockin
Datain
Gatein
Gate
out
(Event 2)
Clock
out
(Event 1)
RF out
Gate
Clock in
Gatein
ESG-D series signal
generator with
Options UND, UN7 and UN8
Frequency hopping is not required by theBluetooth RF Specification [1] for the receivertests. It is possible to ensure the main local oscilla-tor switches to its extremes by setting the transmitand receive channels to be at opposite ends of theband. Some choices of intermediate frequencyrequire even larger frequency changes in the VCO.
For situations where more in-depth testing isrequired, fast frequency hopping may be performed using the Agilent E6432A VXImicrowave synthesizer with an Agilent ESG-Dseries signal generator to modulate the signal. Forthis measurement, the source, the receiver, and thedevice under test are controlled so that they fre-quency hop in unison. The device under test isplaced in test loopback mode. The E6432A mayalso be used as the broadband RF interferencesource noted in 4.1.4.
4.2 Supplementary receiver tests
30
31
5. Power supply measurementsThe Bluetooth RF Test Specification [1] specifiestests at power source voltages that are extreme for some Bluetooth devices.1 Power supply testing,and the Bluetooth device’s rejection of spurioussignals carried on the power line, are importantparts of integration testing for many applications.Measurements of power versus time during DH5bursts and careful monitoring of the frequencyerror measurements are good ways to uncover power-line related problems.
Agilent offers a complete line of DC power supplies that are suitable for these tests. Theseinclude general-purpose supplies as well as supplies specifically designed to meet the demandsof mobile communications products. These DC voltage supplies also offer low-current measuringcapability, which is useful for evaluating currentconsumption during standby and sleep modes.
1. These tests are not required when the equipment under test is designed for operation as part of and powered by another system or
piece of equipment.
32
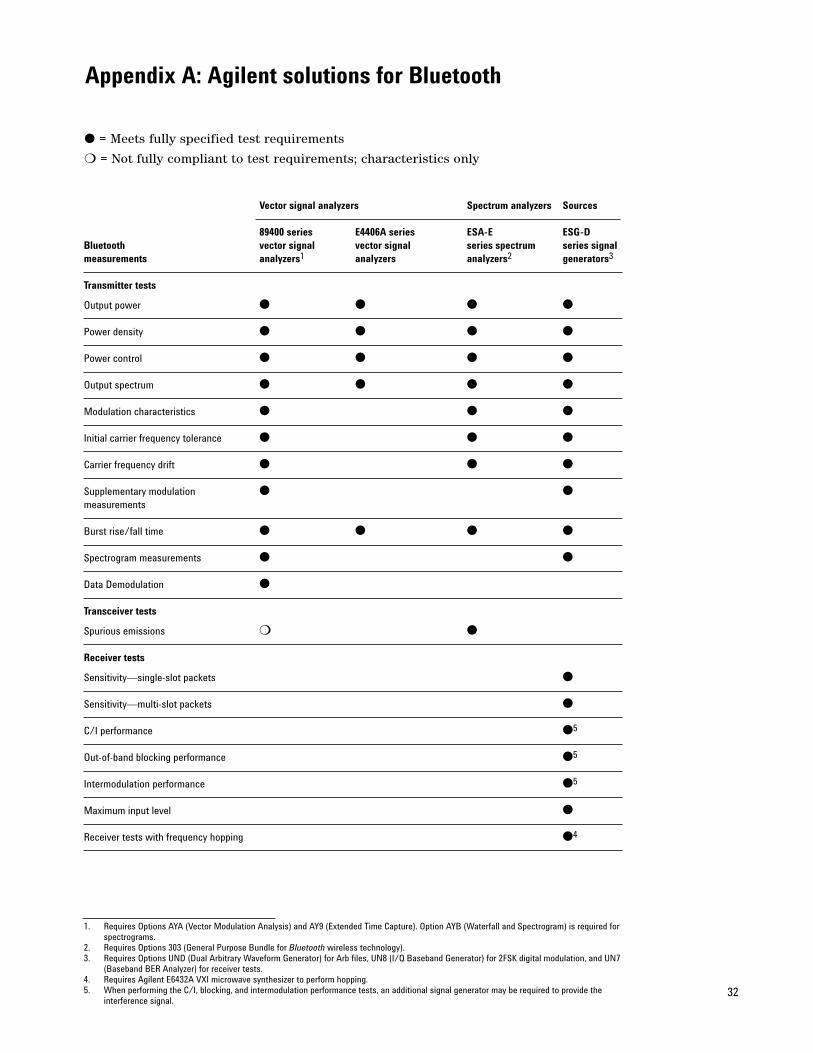
Appendix A: Agilent solutions for Bluetooth
Vector signal analyzers Spectrum analyzers Sources
89400 series E4406A series ESA-E ESG-DBluetooth vector signal vector signal series spectrum series signalmeasurements analyzers1 analyzers analyzers2 generators3
Transmitter tests
Output power � � � �
Power density � � � �
Power control � � � �
Output spectrum � � � �
Modulation characteristics � � �
Initial carrier frequency tolerance � � �
Carrier frequency drift � � �
Supplementary modulation � �measurements
Burst rise/fall time � � � �
Spectrogram measurements � �
Data Demodulation �
Transceiver tests
Spurious emissions ❍ �
Receiver tests
Sensitivity—single-slot packets �
Sensitivity—multi-slot packets �
C/I performance �5
Out-of-band blocking performance �5
Intermodulation performance �5
Maximum input level �
Receiver tests with frequency hopping �4
1. Requires Options AYA (Vector Modulation Analysis) and AY9 (Extended Time Capture). Option AYB (Waterfall and Spectrogram) is required for
spectrograms.
2. Requires Options 303 (General Purpose Bundle for Bluetooth wireless technology).
3. Requires Options UND (Dual Arbitrary Waveform Generator) for Arb files, UN8 (I/Q Baseband Generator) for 2FSK digital modulation, and UN7
(Baseband BER Analyzer) for receiver tests.
4. Requires Agilent E6432A VXI microwave synthesizer to perform hopping.
5. When performing the C/I, blocking, and intermodulation performance tests, an additional signal generator may be required to provide the
interference signal.
� = Meets fully specified test requirements
❍ = Not fully compliant to test requirements; characteristics only
33
Appendix B: Recommended reading8 Hints for Making Better Measurements Using RF Signal Generators, Application Note 1306-1, literature number 5967-5661E.
8 Hints for Making Better Spectrum Analyzer Measurements, Application Note 1286-1, literature number 5965-7009E.
10 Steps to a Perfect Digital Demodulation Measurement, Product Note 89400-14A, literature number 5966-0444E.
Cookbook for EMC Precompliance Measurements, Application Note 1290-1, literature number 5964-2151E.
Customizing Digital Modulation with the Agilent ESG-D Series Real-Time I/Q Baseband Generator,Option UN8, literature number 5966-4096E
Generating and Downloading Data to the Agilent ESG-D RF Signal Generator for Digital Modulation, literature number 5966-1010E
Generating Digital Modulation with the Agilent ESG-D Series Dual Arbitrary Waveform Generator,Option UND, literature number 5966-4097E
Measuring Bit Error Rate using the Agilent ESG-D Series RF Signal Generators Option UN7, literature number 5966-4098E.
Spectrum Analysis, Application Note 150, literature number 5952-0292.
Testing and Troubleshooting Digital RF Communications Receiver Designs, Application Note 1314, literature number 5968-3579E.
Testing and Troubleshooting Digital RF Communications Transmitter Designs, Application Note 1313,literature number 5968-3578E.
Using Vector Modulation Analysis in the Integration, Troubleshooting, and Design of Digital RFCommunications Systems, Product Note 89400-8, literature number 5091-8687E.
34
Appendix C: Glossary
Hold mode—Power saving mode in which thedevice is placed in an inactive state, running onlyan internal timer to occasionally perform a statuscheck.
Information appliances—The category of informa-tion-focused devices that provide voice or data tothe user. Examples are not limited to, but includecellular phones, Personal Digital Assistants, anddigital cameras.
Master unit—The device in a piconet whose clockand hopping sequence are used to synchronize allother devices in a piconet.
Packet—A single bundle of information transmittedwithin a piconet. A packet is transmitted on a fre-quency hop and nominally covers a single timeslot, but may be extended to cover up to five slots.
Park mode—Power saving mode in which thedevice is placed in an inactive state. The device issynchronized to the piconet but does not partici-pate in the traffic. Park mode provides the highestpower efficiency.
Payload—The user’s voice or data information,which is carried in a packet.
Piconet—The piconet is the smallest Bluetooth net-work structure. A piconet consists of one masterand up to seven actively communicating or 200+ inactive noncommunicating slaves. The piconet isdefined by its hopping sequence.
Power saving mode—Three power saving modesexist—sniff mode, hold mode, and park mode—each of which puts the slave unit in a varying stateof sleep. No data is transferred to or from a slaveunit while it is in a power saving mode.
Pretriggering—A feature which allows examinationof the waveform at a point in time prior to thedefined trigger point.
Scatternet—Multiple independent and nonsynchro-nized piconets form a scatternet. Devices can sharepiconets.
Slave units—All devices in a piconet that are not the master. Slave units may be in active mode, inwhich they are actively communicating with themaster, or they may be in an inactive sleep mode.
Sniff mode—Power saving mode in which thedevice listens to the piconet at a reduced rate toconserve power. Sniff mode is the least efficientpower saving mode.
Standby mode—The state of a Bluetooth unitwhich is not connected to a piconet. In this mode,devices listen for messages every 1.28 seconds.
Appendix D: Symbols and acronyms2FSK 2-Level Frequency Shift Keying; also known as
binary FSK
ACL Asynchronous Connectionless Link
ARQ Automatic Repeat reQuest error correction
scheme for data
BT(BbT) Bandwidth-Time product
BER Bit Error Rate
CF Center Frequency
CISPR International Special Committee on Radio
Interference
CW Continuous Wave
dBc Decibels relative to the carrier frequency
dBi Decibels relative to an isotropic radiator
in free space
dBm Decibels relative to 1 milliwatt
(10log(power/1mW))
DECT Digital Enhanced Cordless Telecommunication
EIRP Equivalent Isotropically Radiated Power
(Effective Isotropic Radiated Power)
EMC Electromagnetic Compatibility
ETSI European Technical Standards Institute
EUT Equipment Under Test
EVM Error Vector Magnitude
FCC Federal Communications Commission
FEC Forward Error Correction
FHSS Frequency Hopping Spread Spectrum
GFSK Gaussian-filtered Frequency Shift Keying
GSM Global System for Mobile communications
Hz Hertz or cycles/second
IF Intermediate Frequency
ISM Industrial, Scientific, and Medical radio band
LM Link Manager software
LMP Link Manager Protocol
LO Local Oscillator
PDA Personal Digital Assistant
PLL Phase Lock Loop
PN9 Pseudorandom Noise of period 29-1 bits
PRBS 9 PseudoRandom Bit Sequence
PSD Power Spectral Density
RBW Resolution Bandwidth
RF Radio Frequency
SCO Synchronous Connection-Oriented link
SIG Bluetooth Special Interest Group
TDD Time Division Duplex
UUT Unit Under Test
VBW Video Bandwidth
VSA Vector Signal Analyzer
35
36
By internet, phone, or fax, get assistancewith all your test and measurement needs.
Online assistance:
www.agilent.com/find/assist
Phone or FaxUnited States:(tel) 1 800 452 4844
Canada:(tel) 1 877 894 4414
(fax) (905) 282 4695
Europe:(tel) (31 20) 547 2000
Japan:(tel) (81) 426 56 7832
(fax) (81) 426 56 7840
Latin America:(tel) (305) 267 4245
(fax) (305) 267 4286
Australia:(tel) 1 800 629 485
(fax) (61 3) 9272 0749
New Zealand:(tel) 0 800 738 378
(fax) 64 4 495 8950
Asia Pacific:(tel) (852) 3197 7777
(fax) (852) 2506 9284
Product specifications and descriptions in
this document subject to change without
notice.
Copyright © 2000, 2001 Agilent TechnologiesPrinted in USA, March 9, 20015968-7746E
Appendix E: References
[1] Bluetooth RF Test Specification, revision 0.31, 18.06.99, and revision 0.53r, 27.08.99.
[2] Specification of the Bluetooth System, version 1.0, May 10, 1999.
[3] Official Bluetooth Web site, www.bluetooth.com, 8/99.
Bluetooth is a trademark owned by its proprietor and used by Agilent Technologies
under license.
Recommended


