CY
Africa Group I Constituency
FY16 Interim Report
April 2016
Louis Rene Peter Larose
Executive Director
Botswana – Burundi – Eritrea – Ethiopia - Gambia, The – Kenya – Lesotho – Liberia – Malawi – Mozambique – Namibia
Rwanda - Seychelles - Sierra Leone – Somalia - South Sudan – Sudan - Swaziland – Tanzania – Uganda – Zambia - Zimbabwe
Pub
lic D
iscl
osur
e A
utho
rized
Pub
lic D
iscl
osur
e A
utho
rized
Pub
lic D
iscl
osur
e A
utho
rized
Pub
lic D
iscl
osur
e A
utho
rized

I

II
Table of Contents
FOREWORD BY THE EXECUTIVE DIRECTOR ............................................................................................ V
EXECUTIVE SUMMARY ...................................................................................................................... VII
CHAPTER 1 ........................................................................................................................................ 2
ECONOMIC DEVELOPMENTS AND PROSPECTS ....................................................................................... 2 1.1 Overview ............................................................................................................................................ 2 1.2 Global Economic Performance ........................................................................................................... 2 1.3 Economic Performance in High Income Countries .............................................................................. 5 1.4 Economic Performance in Developing Countries ................................................................................ 6 1.5 Economic Performance in Africa Group 1 Constituency Countries ................................................... 12 1.6 The Medium Term Outlook .............................................................................................................. 14 1.7 Progress on Global Development Goals ........................................................................................... 16
CHAPTER 2 ...................................................................................................................................... 20
WORLD BANK GROUP OPERATIONS ................................................................................................... 20 2.1 Overview .......................................................................................................................................... 20 2.2 IBRD and IDA Operations ................................................................................................................. 20 2.3 IBRD Lending Operations ................................................................................................................. 21 2.4 IDA Lending Operations ................................................................................................................... 21 2.5 IFC Operations ................................................................................................................................. 23 2.6 MIGA Operations ............................................................................................................................. 24
CHAPTER 3 ...................................................................................................................................... 30
SELECTED POLICY AND STRATEGIC ISSUES ........................................................................................... 30 3.1 Overview .......................................................................................................................................... 30 3.2 Review of the World Bank Environmental and Social Safeguards Framework ................................... 30 3.3 Update on the 2015 Voice Reform ................................................................................................... 32 3.4 Update on IDA Reforms ................................................................................................................... 33 3.5 World Bank Group’s Role in the Data Revolution ............................................................................. 36 3.6 Climate Change: COP21 and the Africa Climate Business Plan .......................................................... 37 3.7 Brief on the Global Agriculture and Food Security Program (GAFSP) ................................................ 38 3.8 Update on Diversity and Inclusion .................................................................................................... 40
CHAPTER 4 ...................................................................................................................................... 44
CONSTITUENCY ISSUES ..................................................................................................................... 44 4.1 Overview .......................................................................................................................................... 44 4.2 Highlights of Eleventh Statutory Meeting of the Africa Group 1 Constituency .................................. 44 4.3 Update on Review of the Constituency Rules, Guidelines and Procedures ....................................... 46 4.4 Update on WBG Reengagement with the State of Eritrea, Federal Republic of Somalia, Republic of
The Sudan and Republic of Zimbabwe ............................................................................................. 47 4.5 African Caucus Update ..................................................................................................................... 48

III
TABLES PAGE 1.1 The Global Economic Performance and Outlook 4 1.2 Real GDP Growth in High Income Countries 6 1.3 Real GDP Growth in Developing Countries 9 1.4 Selected Indicators for Sub-Saharan Africa 12 1.5 Real GDP Growth Rates in Africa Group 1 Constituency 13 2.1 IBRD and IDA Commitments by Region 20 2.2 IBRD and IDA Disbursements by Region 20 2.3 IBRD Commitments by Region 21 2.4 IBRD Gross Disbursements by Region 22 2.5 IDA Commitments by Region 22 2.6 IDA Gross Disbursements by Region 22 2.7 IFC Approvals by Region 23 2.8 IFC Commitments by Region 24 2.9 IFC Disbursements by Region 24 2.10 MIGA Operations 25 2.11 MIGA Net Exposure by Region 25 2.12 MIGA Guarantees in Sub-Saharan Africa 26 2.13 MIGA Portfolio by Sector 26 FIGURES 1.1 Commodity Prices 5 1.2 Real GDP Growth in Developing Countries 10 1.3 Real GDP Growth for Sub-Saharan Africa 12 1.4 Africa Group 1 Constituency GDP Growth Rates 13 1.5 Share of Population Below US$1.90 a Day 17 BOXES 3.1 The Proposed Environmental and Social Safeguard Framework Standards 31 3.2 Indicative List for the ESSF Consultations 31 3.3 Summary of Scale Up Facility Lending Terms 33 3.4 Special Themes for IDA18 35 3.5 Leveraging Options Under IDA18 36 ANNEXES Annex 1 IFC Operation in Africa Group 1 Constituency 52 Annex 2 Joint Statement by IDA Borrowers’ Representatives 53 Annex 3 Development Committee Member Statement – October 2015 55 Annex 4 Development Committee Communiqué – October 2015 58 Annex 5 African Caucus Luanda Declaration 60 Annex 6 WBG President’s Response to the 2015 Memorandum of African Governors 62 Annex 7 Rotation Schedule for Constituency Chairmanship 64 Annex 8 Rotation Schedule for Constituency Panel 65 Annex 9 Rotation Schedule for Constituency Representation on the Development
Committee 66
Annex 10 Rotation Schedule for Executive Director and Alternate Executive Director 67
IV
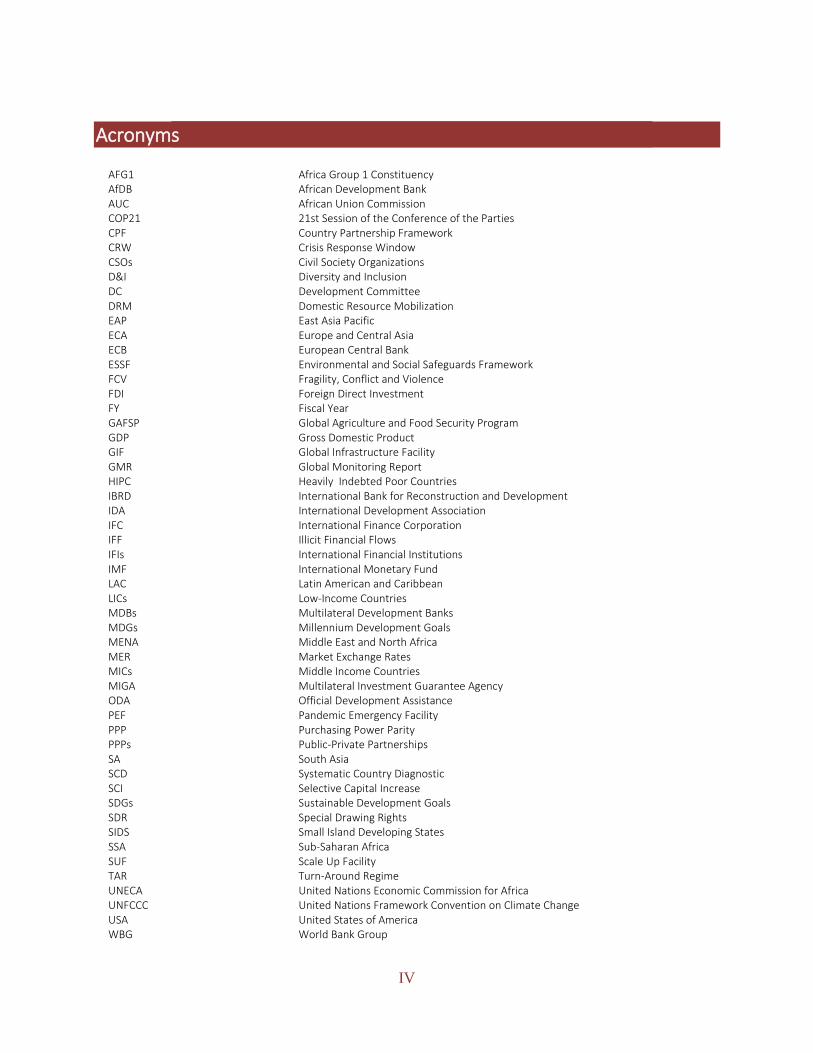
Acronyms
AFG1 Africa Group 1 Constituency AfDB African Development Bank AUC African Union Commission COP21 21st Session of the Conference of the Parties CPF Country Partnership Framework CRW Crisis Response Window CSOs Civil Society Organizations D&I Diversity and Inclusion DC Development Committee DRM Domestic Resource Mobilization EAP East Asia Pacific ECA Europe and Central Asia ECB European Central Bank ESSF Environmental and Social Safeguards Framework FCV Fragility, Conflict and Violence FDI Foreign Direct Investment FY Fiscal Year GAFSP Global Agriculture and Food Security Program GDP Gross Domestic Product GIF Global Infrastructure Facility GMR Global Monitoring Report HIPC Heavily Indebted Poor Countries IBRD International Bank for Reconstruction and Development IDA International Development Association IFC International Finance Corporation IFF Illicit Financial Flows IFIs International Financial Institutions IMF International Monetary Fund LAC Latin American and Caribbean LICs Low-Income Countries MDBs Multilateral Development Banks MDGs Millennium Development Goals MENA Middle East and North Africa MER Market Exchange Rates MICs Middle Income Countries MIGA Multilateral Investment Guarantee Agency ODA Official Development Assistance PEF Pandemic Emergency Facility PPP Purchasing Power Parity PPPs Public-Private Partnerships SA South Asia SCD Systematic Country Diagnostic SCI Selective Capital Increase SDGs Sustainable Development Goals SDR Special Drawing Rights SIDS Small Island Developing States SSA Sub-Saharan Africa SUF Scale Up Facility TAR Turn-Around Regime UNECA United Nations Economic Commission for Africa UNFCCC United Nations Framework Convention on Climate Change USA United States of America WBG World Bank Group

V
Foreword by the Executive Director
This Interim Report is being issued at a time when global growth fell short of expectations and much uncertainty continues to clout the outlook. Sub-Saharan Africa (SSA) has been one of the fastest growing regions in the last decade, but recent global economic developments reflected in the decline of commodity prices and volatile exchange rates pose a real challenge for policy makers. The World Bank forecast of global economic performance shows that growth in SSA slowed to an estimated 3.4 percent in 2015, the lowest rate since 2009.
A rebound is expected in 2016-18, but is subject to downside risks, including a slowdown in China and widespread weakness across the major emerging economies that could have spillover effects in SSA and other developing countries. The lack of diversified production and exports exposes SSA economies to severe shocks in the global markets highlight the need for an economic transformation of the region. Therefore, policy obstacles within the region that constrain regional integration need to be removed or minimized and efforts towards reforms in governance and building stronger institutions as well as human capacities should be strengthened.
The uncertain outlook also calls for continued action on the financial and macroeconomic policies front to create the necessary conditions for sustainable inclusive growth and job creation in SSA. Greater international cooperation is needed to augment national policies to ensure an appropriate scale of financing. In this regard, our Office has been vigorously advocating for additional resource transfer to SSA. On its part, the WBG is undertaking a ‘forward look’ exercise to examine how it can best respond to the changing development landscape and demands among its clients.
We have also pursued our commitment to get the WBG reengaged and normalize its relationship with four countries in our Constituency. In this regard, I am pleased to report that we are beginning to see some positive results. Our Office facilitated a Roundtable Conference between the Government of the Republic of Zimbabwe and development partners and creditors that was held during the 2015 Annual Meetings of the International Monetary Fund (IMF) and the WBG in Lima, Peru. The Conference adopted an arrears clearance strategy known as the Lima Strategy, which lays the roadmap for Zimbabwe to clear its arrears with the World Bank, IMF and the African Development Bank (AfDB). The implementation of the Strategy has proceeded smoothly and to date, Zimbabwe continues to meet all its obligations as agreed under the Lima Strategy.
While Zimbabwe has made the most progress in reengaging with the International Financial Institutions (IFIs), discussions are still continuing to find the best options that could allow the State of Eritrea, the Federal Republic of Somalia and the Republic of The Sudan to reengage with the IFIs. In this regard, three Roundtable Conferences between the Governments of the Federal Republic of Somalia, the State of Eritrea and the Republic of The Sudan and development partners are scheduled to be held during the 2016 Spring Meetings of the WBG and IMF. The re-engagement of these countries with the international community is a top priority for our Office and we will continue to explore all possible means to secure arrears clearance strategies for them.

VI
On diversity and inclusion, our Office has been at the forefront of the fight to increase the representation of African nationals at all levels of the WBG workforce. As a result, the WBG undertook a recruitment mission to SSA in August 2015. From the mission, 40 candidates have been offered positions. The WBG has also committed to continue with its efforts to recruit more SSA nationals to fill positions in Units with significant under representation of SSA staff.
This Interim Report provides further highlights of these and other issues pertinent to our development agenda. It is my hope that the Honorable Governors find the Report informative.
Louis, Rene, Peter LAROSE Executive Director

VII
Executive Summary The world economy continued to face serious headwinds in 2015, with global growth falling short of
expectations. A modest recovery in high income countries was overshadowed by a deceleration of
economic activities in key emerging and developing economies, mainly due to the decline in commodity
prices, subdued global trade, financial markets volatility and weakening capital flows. The global economy
grew by 2.4 percent in 2015, down from 2.6 percent in 2014, as developing economies shed 0.6 percentage
points to grow at 4.3 percent. Growth slowed down in most developing regions with only the South Asia
(SA) region being a bright spot, due to a strong performance of the Indian economy.
A continuation of excess supply across commodity markets extended the downward trend in commodity
prices, especially in the crude oil market where the average price fell by nearly 50 percent. These
developments severely cut export and fiscal revenues for commodity-exporting countries, forcing revisions
in spending plans and a tightening in monetary policy. Growth in the Sub-Saharan Africa (SSA) region
dropped to 3.4 percent in 2015 from 4.3 percent in 2014, due to this factor, an intensifying energy deficit
and a severe drought in some parts of the region.
Over the medium term, a rebound in global economic growth is expected as demand in high income
countries strengthens and commodities prices firm up. Major risks remain, however, particularly those
relating to a further slowdown in the Chinese economy, tightening of financing costs in international
markets, additional gains in the US dollar, and a continuation in the outflow of portfolio investment from
developing regions. Against this background, global economic growth is projected to improve to 2.9 percent
in 2016, and then stabilize at a higher rate of 3.1 percent in 2017 and 2018. For the SSA region, growth is
expected to pick up to 4.2 percent in 2016 and 4.7 percent in 2017 and 2018.
By 2015, the target year for the Millennium Development Goals (MDGs), significant progress had been
made in the quest to reduce poverty, as the global poverty rate was estimated to have fallen from the 1990
position of 37.1 percent to 9.6 percent. The goal to cut poverty in half was reached five years ahead of
time, mainly due to significant progress in the rapidly growing regions of East Asia and Pacific and South
Asia. However, progress in the SSA region was slow, with the poverty rate falling only marginally from 58.0
percent in 1999 to an estimated rate of 35.2 percent in 2015. As such, the ease in the growth momentum
of the SSA region poses a major challenge in the pursuit of the WBG twin goals and the Sustainable
Development Goals (SDGs). Protecting job growth and social sector spending in this region will therefore
be important under these circumstances.
Performance of the World Bank Group (WBG) strengthened in the first half of financial year 2016 (FY16),
with improvements in overall commitments and disbursements by the International Bank of Reconstruction
and Development (IBRD) and the International Development Agency (IDA). Commitments for IBRD rose
from US$14.4 billion in the first half of FY15, to US$17.1 billion in the first half of FY16. IBRD commitments
to SSA region continued to be relatively small at only US$0.4 billion, as most countries of the region are
IDA-only countries. IBRD disbursements were higher at US$13.9 billion during the first half of FY16, up from
US$11.7 billion in the corresponding period of FY15. Disbursements to the SSA region remained unchanged
at US$0.6 billion. Total IDA commitments increased slightly from US$5.8 billion in the first half of FY15, to
US$5.9 billion, with the SSA accounting for US$2.9 billion (49.2 percent), compared to US$3.1 billion (53.4

VIII
percent) previously. Similarly, IDA gross disbursements increased marginally from US$5.8 billion in the first
half of FY15, to US$5.9 billion in the corresponding period of FY16, with the SSA receiving US$3.3 billion.
The activities of the International Finance Corporation (IFC) in support of private sector development had
a mixed trend in the first half of FY16 with increases in commitments and approvals, but a decline in
disbursements. Total commitments increased by 36.5 percent to US$7.0 billion, though commitments to
the SSA regions declined to US$668 million from US$809 million in the first half of FY15. Total IFC approvals
increased to US$7.6 billion from US$6.2 billion, while total disbursements decreased to US$2.1 billion from
US$5.3 billion. For the SSA region, both approvals and disbursements declined, from US$858 million and
US$756 million to US$618 million and US$156 million, respectively.
Issuance of new political risk guarantees by the Multilateral Investment Guarantee Agency (MIGA)
increased to US$2.0 billion in the first half of FY16 from US$1.1 billion in the corresponding period in FY15.
MIGA supported eight projects with a gross issuance value of US$2.0 billion, six of which were in Africa
Group 1 Constituency (AFG1). MIGA’s net exposure to the SSA region grew by 10.5 percent to US$2.0
billion. New guarantees to SSA amounted to US$907.4 million, which supported four projects.
As regards selected policy and strategic issues in the WBG, significant progress has been registered on
several fronts since October 2015. The review of the environmental and social safeguards framework has
progressed with conclusion of the third round of consultations in March 2016, making way for Board
approval of the new policy by end of FY16. Regarding the 2015 Voice Reform, an interim report on the
dynamic formula will be presented to Governors for their consideration during the 2016 Spring Meetings
of the WBG and International Monetary Fund (IMF). With respect to IDA, the IDA17 Mid-Term Review and
first IDA18 Replenishment meetings were held in November 2015 and March 2016, respectively, where
discussions were held on the strategic outlook including scaling up of financing and IDA special themes.
As regards the WBG reengagement with Constituency countries where active collaboration had been
suspended, the State of Eritrea, the Federal Republic of Somalia and the Republic of The Sudan were
grandfathered to follow the Heavily Indebted Poor Country (HIPC) path to reengagement, while the
Republic of Zimbabwe adopted a non-HIPC path. Further, Roundtable meetings are scheduled for the State
of Eritrea, Federal Republic of Somalia and the Republic of The Sudan during the 2016 Spring Meetings of
the WBG and IMF.
IX
Crops - Kenya
Kitabi Tea Processing Facility - Rwanda

Chapter 1
Economic Developments and Prospects
Global Economic
Performance
Economic Performance in High Income Countries
Economic Performance
in Developing Countries
Economic Performance in Africa Group 1 Constituency Countries
Medium Term Outlook
Progress on Global Development Goals

2
Chapter 1
Economic Developments and Prospects
1.1 Overview
This Chapter highlights the economic
developments during 2015 and outlines the
medium term economic outlook in the various
regions of the world. It also provides a profile of
global trends in poverty and income inequality.
The world economy continued to face serious
headwinds in 2015, with global growth falling short
of expectations. The modest recovery in high
income countries in 2015 was overshadowed by
deceleration of economic activities in key
emerging and developing economies, mainly due
to the declines in commodity prices, subdued
global trade, financial markets volatility, and
weakening capital flows. The global economy is
expected to strengthen to over the medium term
on account of steady growth in both high-income
and developing economies.
1.2 Global Economic Performance
Global economic growth eased in 2015 mainly due
to a slowdown in the pace of activity in the
developing economies. The global economy grew
by 2.4 percent in 2015, down from 2.6 percent in
2014, with developing economies shedding 0.6
percentage points from the previous year at 4.3
percent (Table 1.1). Though recovery in most high
income economies1 firmed up in 2015, their output
growth was slightly lower at 1.6 percent, compared
to 1.7 percent in 2014, owing to a deep contraction
in the economy of the Russian Federation.
1 In July 2015, the class of high income countries was
broadened to include Argentina, Hungary, Seychelles and Venezuela.
The Russian economy contracted by 3.8 percent in
2015, after registering tepid growth of 0.6 percent
in the previous year. The continued slide of crude
oil prices on international markets and economic
sanctions weighed heavily on economic activity,
especially investment. With oil and gas export
receipts accounting for about 40 percent of fiscal
revenues, the fiscal position deteriorated,
prompting cuts in public expenditures.
In contrast, the USA, Euro Area and Japan all
registered stronger growth performance in 2015
than in 2014, with the former two economies
supported by rising domestic demand. The USA
economy grew by 2.4 percent for the second
consecutive year, on the back of robust personal
consumption and investment, countering the
effects that weakening external demand and a
strong US dollar had on exports. Growth in the
Euro Area picked up to 1.5 percent in 2015 from
0.9 percent in the previous year. This was mainly
due to credit growth and a depreciation of the
euro, which boosted domestic demand and
exports. However, government finances came
under strain as the region experienced a significant
surge in the inflow of asylum seekers. In Japan,
accommodative monetary policy and weakening of
the yen propped up exports, resulting in growth of
0.8 percent in 2015, after contracting by 0.1
percent in the previous year. Unlike in other high
income countries, personal consumption

3
contracted in Japan despite the loose monetary
policy.
Economic growth in developing countries
continued to ease in 2015, under an environment
of weaker private investment, a strong dollar and
more importantly, the sustained declined in a wide
range of commodity prices. Four out of the six
developing regions recorded lower growth rates in
2015 than in 2014, which placed the overall growth
rate at 4.3 percent, down from 4.9 percent. The
South Asia (SA) region was the only bright spot,
with growth accelerating to 7.0 percent from 6.8
percent, due to a strong performance of the Indian
economy at 7.3 percent. India was also the only
country that broke ranks with other BRICS (Brazil,
Russia, India, China, South Africa), by registering a
stronger performance in 2015 than the year
before. Output expansion in the East Asia and
Pacific (EAP) region remained strong at 6.4
percent, but a rebalancing of the Chinese economy
and slower investment across the region saw the
regional economy lose 0.4 percentage points in
growth. Significant growth momentum was lost in
the Latin America and the Caribbean (LAC) region
as the economies of Brazil and Venezuela
contracted severely by 3.7 percent and 8.2
percent, respectively, under the strain of
depressed oil prices. As a result, output in the LAC
region contracted by 0.7 percent, compared to
growth of 1.5 percent in 2014.
Growth in the Sub-Saharan Africa (SSA) region and
the Europe and Central Asia (ECA) region declined
to 3.4 percent and 2.1 percent from 2015,
respectively, from 4.6 percent and 2.3 percent in
2014, respectively, mainly due to low commodity
prices. The ECA region was however partly
cushioned by strengthening growth in the Euro
Area. Economic output in the Middle East and
North Africa (MENA) region remained unchanged
at 2.5 percent, as the slowdown in oil exporting
economies was counterbalanced by strong
performance in non-oil producing countries,
especially Egypt.
Developments in the commodities markets
continued to dominate the events in 2015. The
sustained softening in commodity prices across all
markets, weighed down the performance in
several developing countries, especially
commodity-dependent oil exporters. Ample
supplies and weak demand for crude oil placed
downward pressure on crude oil prices, causing
the price to extend a decline that began in mid-
2014 to close 47 percent lower at an average of
50.8 percent in 2015 (Figure 1.1). This
development severely cut export and fiscal
revenues for these countries, forcing them to cut
spending plans and tighten monetary policy.
Brazil, Russia and Venezuela registered deep
recessions under the combined scenario of these
headwinds and binding domestic constraints. In
the Sub-Saharan Africa (SSA) region, Nigeria and
Angola, two of the region’s three largest
economies, both significantly cut their capital
expenditures in response to the fiscal strain.
The price of base metals continued to slide as
China, the world’s largest consumer in the metals
market, began its transition away from an
investment-driven economic model to a slower
paced service-led economic model. Base metal-
exporting countries registered significant currency
pressures as exports declined and investment
projects were put on hold. Similar to their oil-
exporting counterparts, these countries cut
spending plans and tightened monetary policy to
starve off further depreciation and pass-through
effects to inflation. The decline in agricultural
commodities prices was more modest when
compared to the drop in other commodity prices.
The agricultural commodities price index fell by
11.1 percent in 2015, compared with declines of
23.4 percent and 22.4 percent in the respective
indices for energy and base metals (see Figure 1.1).

4
As expected, exporters of agricultural products
generally performed better than oil and metal
producers, including some of the East African
economies that continue to grow robustly.
Global inflation remained low, largely reflecting
the price effect of lower energy costs across most
regions. Annual inflation in high-income countries
declined to an average of 1.0 percent from 1.6
percent in 2014, despite the accommodative
stance of most central banks and the
strengthening domestic demand. For developing
countries, inflation declined marginally to 4.3
percent in 2015 from 4.5 percent in 2014.
However, an uptick late in 2015 presented
indications of slightly higher inflation for 2016,
partly driven by the carryover effects of weakening
currencies.
Taking into consideration the prospects of both
high income and developing countries, the
medium outlook points to a rebound in global
economic growth. This projection is anchored on
stronger demand from high income countries, and
a firming up of commodities prices as a rebalancing
of supply and demand dynamics in commodity
markets allows for a narrowing in excess supplies
and reductions in stockpiles. This notwithstanding,
major risks remain, particularly those relating to a
further slowdown in the Chinese economy,
tightening of financing costs in international
markets, additional gains by the US dollar and a
continuation in the outflow of portfolio investment
from developing regions. Against this background,
global economic growth is projected to improve to
2.9 percent in 2016, and then stabilize at a higher
rate of 3.1 percent in 2017 and 2018.
Table 1.1: The Global Economic Performance and Outlook 2014 2015e 2016f 2017f 2018f
Real GDP Growth (%) 1
World 2.6 2.4 2.9 3.1 3.1
High income countries 1.7 1.6 2.1 2.1 2.1
Developing countries 4.9 4.3 4.8 5.3 5.3
BRICS 2 5.1 3.9 4.6 5.3 5.4
Commodity-exporting Frontier & Emerging Markets 1.9 -0.4 0.9 2.6 2.9
Inflation (%)
High Income 1.6 1.0 - - -
Developing Countries 4.5 4.3 - - -
Commodity prices
Non-Energy Commodity Price Growth (Percentage change) -4.6 -14.8 -1.8 1.9 1.9
Oil Price (US$ Per Barrel) 3 96.2 50.8 46.4 49.8 53.4
Oil Price changes (Percentage change) -7.5 -47.3 -8.5 7.2 7.2
Interest Rates (Percent)
US dollar, 3-Months 0.23 0.32 - - -
Euro, 3-Months 0.00 0.00 - - - Source: World Bank
Notes 1. Real Aggregate GDP growth rates calculated using constant 2010 dollars GDP weights. 2. BRICS = Brazil, Russia, India, China and South Africa. 3. Twelve-month simple average of spot price for Dubai, Brent and West Texas Intermediate.
e = estimate; f = forecast.

5
Figure 1.1: Commodity prices
Source: World Bank
1.3 Economic Performance in High Income
Countries
Growth in high-income countries moderated
slightly but was on stronger ground than in
previous years, with all the major economies
registering expansion. The sharp recession in the
Russian Federation, however, outweighed the
recovery that took place elsewhere, placing the
group’s performance at 1.6 percent in 2015, 0.1
percentage points lower than in 2014 (Table 1.2).
Improvements in domestic demand supported
the economic recovery in the USA and Euro Area.
In the USA, the labor and housing markets
extended their recovery, while monetary policy
remained accommodative, despite a moderate
tightening in the latter part of the year. Low
energy prices and rising wages gave a boost to
personal disposable income, which in turn drove
personal consumption. However, the
appreciation of the US dollar, weakening external
demand from major developing countries and a
consumption-driven rise in imports resulted in
0.00
50.00
100.00
150.00
20
11M
11
20
12M
02
20
12M
05
20
12M
08
20
12M
11
20
13M
02
20
13M
05
20
13M
08
20
13M
11
20
14M
02
20
14M
05
20
14M
08
20
14M
11
20
15M
02
20
15M
05
20
15M
08
20
15M
11
Commodity Indices
Energy Agriculture Base Metals (ex. iron ore)
$0.00
$5.00
$10.00
$15.00
$20.00
$0.00
$20.00
$40.00
$60.00
$80.00
$100.00
$120.00
Sep
-13
Dec
-13
Mar
-14
Jun
-14
Sep
-14
Dec
-14
Mar
-15
Jun
-15
Sep
-15
Dec
-15
Energy
Crude ($/bbl)Coal ($/mt)Natural gas LNG, $/mmbtu (RHS)
$0.00$200.00$400.00$600.00$800.00
$1,000.00$1,200.00$1,400.00$1,600.00
Precious Metals
Gold ($/toz) Platinum ($/toz)
$0.00
$50.00
$100.00
$150.00
$0.00
$5,000.00
$10,000.00
$15,000.00
$20,000.00
$25,000.00Base Metals
Copper ($/mt) Tin ($/mt)
Nickel ($/mt) Iron Ore ($/dmt) (RHS)
6
weak performance in net exports. This
notwithstanding, growth in the USA is poised to
remain firm over the medium term on the basis
of sustained domestic demand, with GDP growth
expected to rise to 2.7 percent in 2016, then
eased gradually to 2.4 percent and 2.2 percent in
2017 and 2018, respectively.
Activity in the Euro Area gained further
momentum in 2015 with the support of credit
growth and depreciation of the euro, which
uplifted domestic demand and exports. The Euro
Area recorded its strongest annual performance
since the global financial crisis, with output
growth of 1.5 percent in 2015 from 0.9 in the
previous year. Credit growth resumed following
an ease of monetary policy by the European
Central Bank (ECB) and improvements in
confidence and the health of the banking sector.
Government finances, however, came under
strain in the wake of member countries’ efforts
to respond to unanticipated surges in the inflow
of asylum seekers. Though the weak external
demand and a rebound of the euro are likely to
dampen growth prospects, consumer and
investor confidence are expected to maintain the
growth momentum. Output growth in the Euro
Area is therefore expected to accelerate to 1.7
percent in 2017, before easing slightly to 1.6
percent in and 2018.
The Japanese economy grew by 0.8 percent in
2015, after contracting by 0.1 percent in the
previous year. Accommodative monetary policy
and the deprecation of the yen propped up
exports, albeit modestly. Growth was held back
by personal consumption, which contracted
despite the loose monetary policy stance of the
Bank of Japan. However, growth is expected to
pick up in 2016, given the high corporate earnings
and near full employment rates. Though growth
is expected to exhibit some volatility on a
quarterly basis, output expansion in Japan is
projected at 1.3 percent in 2016. Growth is then
projected to dip to 0.9 percent in 2017 before
reverting to 1.3 percent in 2018.
Table 1.2: Real GDP Growth in High Income Countries (Percentage change from previous year)
2014 2015e 2016f 2017f 2018f
All High income countries
1.7 1.6 2.1 2.1 2.1
Euro Area 0.9 1.5 1.7 1.7 1.6
Japan -0.1 0.8 1.3 0.9 1.3
Russia 0.6 -3.8 -0.7 1.3 1.5
United States 2.4 2.4 2.7 2.4 2.2
Source: World Bank
Notes: e = estimate; f = forecast
1.4 Economic Performance in Developing
Countries
Economic activity in developing countries eased
in 2015, with growth decelerating to 4.3 percent
from 4.9 percent in 2015 (Table 1.3 and Figure
1.2). The continued decline in commodity prices
and the strengthening of the US dollar reinforced
a slowdown that was already in motion, resulting
in a drop in trade volumes across most regions.
With the exception of the SA region, all regions
registered lower growth in 2015. Firmer
commodity prices are, however, expected to
support a rebound over the medium term,
though this is contingent on growth in China. In
2016, output in developing regions is expected to
grow by 4.8 percent in 2016, and accelerating to
5.3 percent in 2017 and 2018.
In the EAP region, growth continued to ease,
falling to 6.4 percent in 2015, from 6.8 percent
and 7.1 percent in 2014 and 2013, respectively.
This was largely due to the slowdown of the
Chinese economy, where a rebalancing of the
economic model from investment-led to
consumption-led gained pace. The Chinese

7
economy slowed down from 7.3 percent in 2014
to 6.9 percent in 2015, against a backdrop of
slower investment in industry and the real estate
sector. Further, efforts by the Chinese authorities
to curb unconventional lending in the banking
sector led to a decline in nontraditional credit
growth and a consequent decline in activities by
entities that relied on that kind of financing,
including local governments’ investment in
infrastructure.
Concerns among investors about the
fundamentals of the worlds’ second largest
economy, an increase in the flexibility of the
foreign exchange framework (accompanied by an
unexpected devaluation of the yuan) and capital
controls, induced volatility in the stock market
and an increase in capital outflows. The Peoples’
Bank of China injected liquidity in the banking
sector to promote domestic credit and undertook
heavy currency interventions to ease pressure on
the yuan. Notwithstanding the adverse
sentiments of external sovereign investors, wage
and income growth prompted private domestic
consumption to firm, thereby assisting the
rebalancing effort by the authorities. Output
growth in China is projected to ease further to 6.7
percent in 2016 and then stabilize at a rate of 6.5
percent in 2016 and 2017.
Excluding China, growth in the EAP region was
marginally lower at 4.6 percent in 2015, only 0.1
percentage points lower than the year before.
Though growth remained robust in most of the
region’s economies, the majority recorded
slower growth, especially commodity-dependent
Mongolia where growth slowed to 2.3 percent
from 7.8 percent in 2014. The ease in growth was
a result of slowing trade, lower investment and
fiscal consolidation – a continuing trend from the
previous year. The slowdown was partly offset by
strong consumption spending supported by
accommodative monetary policy, lower oil prices
and robust remittances. Indonesia and Malaysia
experienced downward pressure on their
currencies as capital outflows accelerated in the
year, prompting a reduction in central banks
reserves. However, foreign direct investment
(FDI) remained steady despite the waning
confidence of portfolio investors.
Economic growth in the ECA region continued to
slide due to a combination of strong headwinds,
including weak commodity prices, spillovers from
the recession in Russia and unresolved
distortions in domestic financial markets.
Performance was stronger among western ECA
economies, which have close ties to the
recovering Euro Area and are net importers of oil.
The economy of Ukraine contracted by 12.0
percent due to geopolitical tensions, with
industrial production and exports falling,
following a disruption of trade with Russia.
Depreciation of the exchange rate attenuated
inflationary pressures from the contraction in
aggregated supply and pushed inflation to over
50 percent. Similarly, the economies of other
countries with close ties with the Russian
economy came under strain due to a slowdown
in trade, FDI and remittances. In Kazakhstan,
where crude oil accounts for approximately 70
percent of export revenue, growth slowed to 0.9
percent in 2015 from 4.4 percent in 2014. The
Kazakh authorities tightened monetary policy
and drew down reserves to defend the local
currency, constraining domestic demand in the
process.
In contrast, western ECA economies’
performance was stronger, led by Turkey, the
region’s largest economy. The Turkish economy
grew robustly at 4.6 percent in 2015, up from 2.9
percent in 2014.
Economic growth in the LAC region declined for
the third consecutive year in 2015 to -0.7

8
percent, from 1.5 percent in 2014. This was
mainly due to low commodity prices and weak
domestic demand, especially fixed investments.
Brazil, the region’s largest economy, contracted
by 3.7 percent, after growing at a tepid rate of 0.1
percent in 2014, on account of a combination of
external and domestic factors. Low commodity
prices and waning economic confidence weighed
down economic performance, as investors
rushed to pull capital out of the economy on
concerns about the medium term prospects of
the economy and political uncertainty. As a
result, the Brazilian real depreciated, raising
inflationary pressures, while inducing improved
competitiveness and a strong showing of exports.
Venezuela, which is highly dependent on oil
exports for government revenue and foreign
exchange, faced a decline in export receipts,
placing significant pressure on the supply of
foreign exchange. Restrictions on imports of both
intermediate and final goods, led to cutbacks in
production and elevated the rate of inflation.
Against this backdrop, the economy contracted
by 8.7 percent in 2015, a second consecutive year
of negative growth. Similarly, Ecuador, which is
also an oil exporter, registered a contraction in its
economy, with growth falling to -0.6 percent in
2015 from 3.7 percent in the previous year.
With lower prices in almost all commodity
markets, the majority of other countries in the
region recorded slower, but positive, growth in
2015 than in the previous year. Fiscal deficits
widened across the region as low commodity
prices squeezed tax revenues and export
receipts, prompting budget cuts in several
countries. Several central banks also responded
to currency depreciation by tightening monetary
conditions, which in turn hurt domestic demand.
Growth was stronger among Central American
and Caribbean countries than those in South
America. The Mexican economy grew by 2.5
percent on account of strengthening demand
from the US, countering the impact of losses in
the oil sector. The Dominican Republic recorded
slower growth as mining prospects declined in
tandem with softening gold prices.
In the MENA region, growth was unchanged at
2.5 percent in 2015, against a background of
falling oil production and disruptions in oil
production caused by insecurity. This that was
counterbalanced by growth in tourism and
personal consumption in oil importing countries.
Low oil prices cut export and fiscal revenues in
the region. For instance, Algeria and Iraq both
saw deterioration in their fiscal deficits to over 10
percent of GDP in 2015. Governments drew
down on sovereign wealth funds and cut
spending to narrow gaping budget deficits. An
escalation in conflicts in the region and the
disruption of production compounded the
economic strain imposed by low oil prices. Oil
production levels in Syria collapsed, while in Libya
output declined due to armed insurgencies.
Production in Iraq picked up despite the security
situation, as production sites were insulated from
disruption by distance. Instability in the region
triggered an unprecedented surge in the number
of asylums seekers and internally displaced
persons, particularly from and in Syria and Iraq.
This strained public services and infrastructure in
some host and transit countries, especially
Lebanon and Jordan.
Oil importing countries fared better in 2015 by
benefiting from lower import bills, moderating
inflation and stronger personal consumption.
Egypt benefited from an improvement in investor
confidence, while Morocco and Lebanon
recorded an improvement in performance on
account of growing consumption. With a
stabilization in oil prices, most oil exporting
economies are projected to have a stronger

9
showing over the medium term, especially Iran as
it re-enters the global economy.
The SA region became the world’s the fastest
growing region in 2015 as output expansion
strengthened to 7.0 percent from 6.8 percent in
2014, on the back of robust growth in domestic
consumption and domestic investment. Most
countries in the region improved performance
over their 2014 outcomes, with positive
spillovers from India, which led the region’s
growth of 7.3 percent. In India, momentum
picked up as fiscal and monetary policy began to
bear fruits. The fiscal deficit fell to 4.0 percent of
GDP, down from 7.6 percent in 2009, while
inflation slowed down with the aid of lower oil
prices. The external position also improved with
a narrowing of the current account to 1.0 percent
of GDP, from around 5.0 percent in 2013, while
net FDI stabilized. Similarly, economic
performance in neighboring Pakistan improved
within the context of an IMF program. Fiscal
consolidation reduced the fiscal deficit and
helped curtail inflationary pressures by reducing
domestic demand. Against this background,
growth in Pakistan picked up to 5.5 percent in
2015, from 5.1 percent in 2014.
In the rest of the SA region, economic activity
remained robust, despite unstable security
conditions (Afghanistan), political instability
(Maldives) and a drop in tourism (Bhutan). Strong
inflows of remittances, low oil prices and
infrastructure spending drove domestic demand
in most countries. Nepal, which was negatively
impacted by a major earthquake in early 2015,
registered lower but positive growth of 2.6
percent, compared to 4.4 percent in 2014.
Table 1.3: Real GDP Growth in Developing Countries (Percent change from previous year)
2013 2014 2015e 2016f 2017f 2018f
Developing Countries 5.3 4.9 4.3 4.8 5.3 5.3
East Asia and Pacific 7.1 6.8 6.4 6.3 6.2 6.2
China 7.7 7.3 6.9 6.7 6.5 6.5
Europe and Central Asia 3.9 2.3 2.1 3.0 3.5 3.5
Turkey 4.2 2.9 4.1 3.5 3.5 3.4
Latin America and Caribbean 3.0 1.5 -0.7 0.1 2.3 2.5
Brazil 3.0 0.1 -3.7 -2.5 1.4 1.5
Middle East and North Africa 0.6 2.5 2.5 5.1 5.8 5.1
Egypt 2.1 2.2 4.2 3.8 4.4 4.8
South Asia 6.2 6.8 7.0 7.3 7.5 7.5
India 6.9 7.3 7.3 7.8 7.9 7.9
Sub-Saharan Africa 4.9 4.6 3.4 4.2 4.7 4.7
Nigeria 5.4 6.3 3.3 4.6 5.3 5.3
Memo:
Low Income Countries 4.3 3.9 4.3 4.6 4.6 4.6 Source: World Bank
Notes: e = estimate; f = forecast 1. BRICS include Brazil, Russia, India, China and South Africa

10
Figure 1.2: Real GDP Growth in Developing Countries
(Percentage change from previous year)
Source: World Bank
Economic growth in the SSA region weakened in 2015 to 3.4 percent, from 4.6 percent recorded in the previous year (Table 1.4 and Figure 1.3), as the majority of the economies grew at a slower pace than in the previous year. This included the region’s three largest economies – Nigeria, South Africa and Angola. This performance was largely reflective of the adverse external environment faced by the region, with low commodity prices, weak demand, a strong US dollar and higher financing cost. The slowdown of the Chinese economy had a direct impact on the demand for the region’s supply of raw materials, which had spillover effects on other sectors, especially through the depreciation of exchange rates.
Oil and metal exporting countries, which were already strained by a sharp price decline in 2014, were most affected by changes in the external environment. Nigeria and Angola, which are heavily dependent of the performance of the oil sector for foreign exchange supplies and fiscal revenues, both saw their exchange rates and fiscal balances come under intensified pressure. This prompted significant drawdowns on their foreign reserves to prevent excessive currency
depreciation, particularly in Angola. To address their fiscal imbalances, both governments revised their budgets downwards by cutting infrastructure spending. Angola also looked to the international capital markets for financing and issued a maiden sovereign bond during 2015.
Growth in the South African economy remained
weak, despite the recovery in Euro Area, the
primary destination of its exports. Growth was
constrained by intensification of the energy
supply deficit, El Niño-induced drought
conditions, and labor disputes, while capital
market volatility and the decline in the price of
precious metals weighed down on the rand. Even
though exports volumes increased on account of
the weaker rand and the diversified economic
base, growth slowed to 1.3 percent from 1.5
percent in 2014. Growth in the mineral and
metal-exporting economies of Mauritania,
Zambia and Sierra Leone slowed on account of
cut backs in investments and production, as low
prices reduced the expected yields in the mining
sector. Suspension of iron ore mining operations
in Sierra Leone, exacerbated the impact of the
Ebola outbreak on the economy resulting in a 20
4.9
6.8
6.8
4.6
2.5
2.3
1.5
4.3
7.0
6.4
3.4
2.5
2.1
-0.7
4.8
7.3
6.3
4.2
5.1
3.0
0.1
5.3
7.5
6.2
4.7
5.8
3.5
2.3
5.3
7.5
6.2
4.7 5
.1
3.5
2.5
A L L D C S S O U T H A S I A E A S T A S I A A N D P A C I F I C
S U B - S A H A R A N A F R I C A
M I D D L E E A S T A N D N . A F R I C A
E U R O P E A N D C E N T R A L A S I A
L A T I N A M E R I C A A N D
C A R I B B E A N
2014 2015e 2016f 2017f 2018f

11
percent contraction in output. The combined
effect of falling export revenues and the
appreciation of the US dollar had knock on effects
on inflation in most commodity exporting
countries. Monetary authorities tightened
monetary conditions to ease currency and
inflationary pressures. However, this also
curtailed credit growth and private investment.
Other non-oil exporting countries were,
however, less impacted by the weakening
external demand. With prices for agriculture
products taking a relatively modest fall, economic
growth in these countries remained robust with
the help of strong domestic demand. Growth in
Ethiopia, Rwanda and Kenya, remained strong as
aggressive public expenditures on infrastructure
continued generally unabated by external
dynamics. In contrast to oil and metal exporting
countries, inflation in non-oil exporting countries
remained low under the scenario of low fuel
prices.
Several sub-regions of the SSA region continued
to face supply side constraints dominated by an
energy deficit. For southern African countries
dependent on hydropower, the situation was
compounded by record drought conditions.
These drought conditions also severely disrupted
agricultural activities, especially for small scale
and subsistence farmers that depend on rainfall.
Political instability also held back progress in
other parts of the region. For instance, political
conflict in Burundi lead to a contraction in GDP by
2.3 percent, while the GDP for South Sudan fell
by 5.3 percent.
Based on the projection of firming commodity
prices, the economic outlook for SSA points to a
gradual rebound in growth, though downside
risks remain strong. The continued slowdown of
growth in the region’s single largest trading
partner, China, erratic power supply, extreme
climatic conditions and conflict are also expected
to weigh down on the region’s economic
performance. These factors are expected to be
countered by ongoing public infrastructure
investments, new discoveries of natural
resources and consumer demand. Output is
projected to pick up in 2016 to 4.2 percent and
strengthen to 4.7 percent in 2017 and 2018.

12
Figure 1.3: Real GDP Growth for Sub-Saharan Africa
(Percentage change from previous year)
Source: World Bank Notes: e = estimate; f = forecast.
Table 1.4: Selected Indicators for Sub-Saharan Africa (Annual percentage changes unless otherwise indicated)
Indicator 2014 2015e 2016f 2017f 2018f Developing Countries 5.3 4.9 4.3 4.8 5.3
All SSA GDP growth 4.9 4.6 3.4 4.2 4.7
All SSA GDP growth, excl. South Africa 5.8 5.7 4.1 5.1 5.7
GDP per capita (constant 2010 US$) 2.0 1.9 0.8 1.5 2.0
Private consumption 9.9 3.2 3.1 3.7 4.0
Public consumption 1.9 3.9 3.2 3.5 3.7
Fixed investment 9.6 8.7 6.2 6.6 7.1
Exports, GNFS -2.2 5.0 3.1 2.6 2.9
Imports, GNFS 6.8 3.0 3.0 3.1 3.2
Net exports, contribution to growth -2.8 0.5 -0.3 -0.2 -0.2
Fiscal Balance (% of GDP) -1.7 -2.9 -2.5 -2.2 -2.2 Source: World Bank
Notes: e = estimate, f = forecast
1.5 Economic Performance in Africa Group 1
Constituency Countries
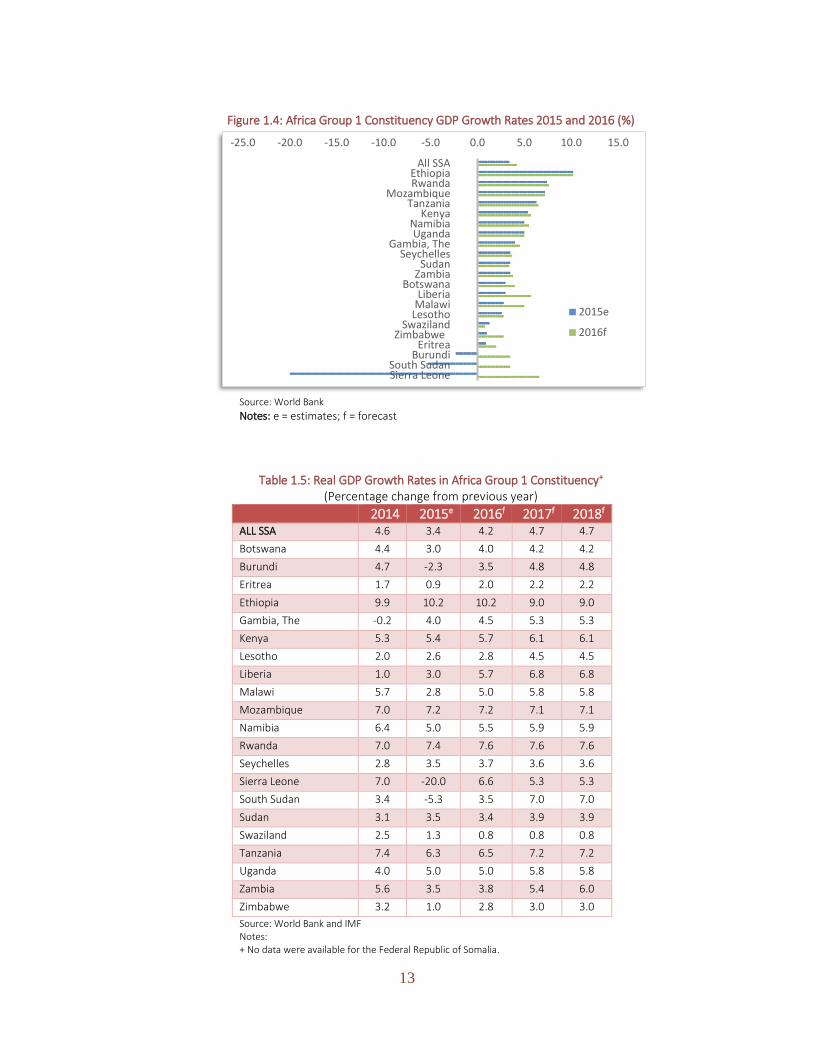
Output growth in 2015 eased in most of the 22
countries in the Africa Group 1 Constituency
(AFG1). Eleven countries outperformed the SSA
region’s average growth rate of 3.4 percent,
down from thirteen countries in 2014. Growth
rates ranged from -20.0 percent to 10.2 percent
in 2015, compared to the previous range of -0.2
percent to 9.9 percent in the previous year (Table
1.5 and Figure 1.4).
The fastest growing economies in 2015 were
Ethiopia (10.2 percent), Rwanda (7.4 percent),
Mozambique (7.2 percent) and Tanzania (7.2
percent). The Ethiopian economy grew rapidly on
account of robust investment in public
infrastructure, while in Rwanda growth was
driven by consumption demand and
infrastructure spending. Growth in Tanzania and
Mozambique were supported by investments in
the gas industry.
4.94.6
3.4
4.2
4.7 4.7
5.85.7
4.1
5.1
5.7 5.7
5.34.9
4.3
4.8
5.3 5.3
2013 2014 2015E 2016F 2017F 2018F
All SSA All SSA, excl. South Africa Developing Countries
13
Figure 1.4: Africa Group 1 Constituency GDP Growth Rates 2015 and 2016 (%)
Source: World Bank
Notes: e = estimates; f = forecast
Table 1.5: Real GDP Growth Rates in Africa Group 1 Constituency+ (Percentage change from previous year)
2014 2015e 2016f 2017f 2018f
ALL SSA 4.6 3.4 4.2 4.7 4.7
Botswana 4.4 3.0 4.0 4.2 4.2
Burundi 4.7 -2.3 3.5 4.8 4.8
Eritrea 1.7 0.9 2.0 2.2 2.2
Ethiopia 9.9 10.2 10.2 9.0 9.0
Gambia, The -0.2 4.0 4.5 5.3 5.3
Kenya 5.3 5.4 5.7 6.1 6.1
Lesotho 2.0 2.6 2.8 4.5 4.5
Liberia 1.0 3.0 5.7 6.8 6.8
Malawi 5.7 2.8 5.0 5.8 5.8
Mozambique 7.0 7.2 7.2 7.1 7.1
Namibia 6.4 5.0 5.5 5.9 5.9
Rwanda 7.0 7.4 7.6 7.6 7.6
Seychelles 2.8 3.5 3.7 3.6 3.6
Sierra Leone 7.0 -20.0 6.6 5.3 5.3
South Sudan 3.4 -5.3 3.5 7.0 7.0
Sudan 3.1 3.5 3.4 3.9 3.9
Swaziland 2.5 1.3 0.8 0.8 0.8
Tanzania 7.4 6.3 6.5 7.2 7.2
Uganda 4.0 5.0 5.0 5.8 5.8
Zambia 5.6 3.5 3.8 5.4 6.0
Zimbabwe 3.2 1.0 2.8 3.0 3.0
Source: World Bank and IMF Notes: + No data were available for the Federal Republic of Somalia.
-25.0 -20.0 -15.0 -10.0 -5.0 0.0 5.0 10.0 15.0
All SSAEthiopiaRwanda
MozambiqueTanzania
KenyaNamibiaUganda
Gambia, TheSeychelles
SudanZambia
BotswanaLiberia
MalawiLesotho
SwazilandZimbabwe
EritreaBurundi
South SudanSierra Leone
2015e
2016f

14
1.6 The Medium Term Outlook
The global economy is expected to strengthen to
2.9 percent in 2016, to 3.1 percent in 2017 and
2018, up from 2.4 percent in 2015. This will be on
account of steady growth in both high-income
and developing economies.
Growth is expected to firm up in high-income
economies to 2.1 percent in 2016, but remain flat
at this level till 2018. The economies of the USA
and Euro Area are expected to maintain their
recovery, while Japanese growth will fluctuate. In
the USA, domestic demand is expected to sustain
economic growth at 2.9 percent in 2016 and an
average 3.1 percent in 2017 and 2018. Growth in
the Euro Area is expected to accelerate to 1.7
percent in 2016, before easing to an average of
1.6 percent in 2017 and 2018. Japan is expected
register annual growth rates of 1.3 percent in
2016, 0.9 percent in 2017 and 1.3 percent in
2018.
For Russia, high inflation, lower fiscal buffers, low
oil prices and prolonged disagreements over
Ukraine, are expected to weigh heavily on its
economic prospects. Reforms aimed at
diversifying the economy are, however, expected
to counter these factors and assist the
emergence the Russian economy from a
recession, to record a modest recovery of -0.7
percent in 2016 and 1.3 percent and 1.5 percent
in 2017 and 2018, respectively.
Growth in developing countries is projected to
pick up as the slowdown in China flattens out,
commodity prices firm up and India extends its
economic rally. Prospects will, however, to a
large extent be contingent on the materialization
of the pickup in commodity prices. Growth in
developing countries as a whole is expected to
strengthen to 4.8 percent in 2016 and 3.1
percent in 2017 and 2018.
In the EAP region, the rebalancing of the Chinese
economy is expected to see regional growth
stabilize at 6.2 percent in 2017 and 2018, from
6.3 percent in 2016. To a large extent the
economic outlook for the region’s performance is
contingent upon activities in the Chinese
economy. Further reductions of economic
activities in China will have spillover effects in
other countries in the region and may counter
the expansion in the other major economies of
the region. Though the number of countries
projected to record stronger growth is higher in
2016 at six out of the 14 major economies,
compared to only four in 2015, regional growth is
expected slow down to 6.3 percent in 2016.
Growth, however, will stabilize in 2017 and 2018
at 6.2 percent, as demand from high income
countries firms. Further, the region is expected to
remain susceptible to capital market volatility
and outflows of capital.
Growth is expected to strengthen moderately in
Indonesia and Malaysia as reforms take hold and
political uncertainty diminishes. The EAP region
will grow by 6.3 percent in 2016 and then
stabilize at 6.2 percent in 2017 and 2018.
The SA region is likely to remain a bright spot, as
growth in India provides positive spillovers for
neighboring countries. The Indian economy is
expected to grow by nearly 8.0 percent over the
forecast period as fiscal and monetary reforms
continue to bear fruit and personal consumption
surges in a low oil price environment.
Nonetheless, some countries will continue to be
held back by political instability and insecurity.
The SA region will therefore maintain its position
as the fastest growing region with a growth rate
of 7.3 percent in 2016 and 7.5 percent in 2017
and 2018. The SA region as a whole is expected
to extend the rally in economic activity with
growth rates of 7.3 percent in 2016 and 7.5
percent in 2017 and 2018. Domestic demand is

15
projected to remain strong, even though the
inflows of remittances will moderate in the wake
of declining activity in non-regional oil exporting
countries.
The performance of the ECA region will continue
to be influenced by economic developments in
Russia and the recovery in the Euro Area. As such,
a rebound in Russia and a bottoming out of
commodity prices would provide support to the
economies in the east of the ECA region.
Economies in the western side of the region,
stand to benefit from growth in the Euro Area but
will have to contend with increased uncertainty
in the policy environment in Turkey and the
inflow of asylum seekers from the Middle East.
Based on these factors, growth in the ECA region
is projected to pick up to 3.0 percent in 2016,
then stabilize at 3.5 percent in 2017 and 2018.
Economic growth in the ECA region is expected to
strengthen with a recovery in the Russian
economy, firmer commodity prices, and stronger
private consumption. Performance is expected to
be stronger amongst western ECA region
countries that have close economic ties with the
Euro Area. The migrant situation will, however,
constrain several countries hosting
unprecedented large numbers of asylum seekers
and transitioning visitors, before any positive
labor effects are realized in these economies.
Economic growth in the ECA region will gradually
pick up from 3.0 percent in 2016 to 3.5 percent
in 2017 and 2018. Similarly, growth in the LAC
region will reflect geographical differences
associated with trade links. Output growth in the
LAC region is projected to recover, picking up in
2016 and 2017 to 2.0 percent and 2.8 percent,
respectively, from an anemic rate of 0.1 percent
in 2016. This outlook is based on stronger
performance by Central American economies
that will benefit from the strengthening USA
economy and the stabilization of commodity
prices. Brazil’s recession is, however, expected to
extend into 2016 and end in 2017.
Growth in the LAC region is expected to slow
further in 2016 to 0.4 percent, as Brazil contracts
by 1.3 percent in the year. Growth is projected to
return to positive in 2016, but only at a feeble 0.1
percent, then strengthen to 2.3 percent and 2.5
percent in 2017 and 2018, respectively, as
external headwinds ease.
Growth in the MENA region will pick up to 5.1
percent by 2018 on account the projected
stabilization of oil prices. The easing of economic
and financial sanctions on the Islamic Republic of
Iran in the latter half of 2015 should lead to a
surge in the region’s economic activity, though
political uncertainty and security concerns will
remain major downside risks. Growth in the
MENA region is expected to strengthen to 5.1
percent in 2016 and 5.8 percent in 2017, then
ease to 5.1 percent in 2018.
The SSA region is expected to rebound over the
medium term, rising to nearly 5.0 percent by
2018, as commodity prices are forecast to
gradually rise and investments in energy begin to
narrow the region’s gaping power deficit in some
areas of the region. Growth in domestic
investment and consumption is expected to pick
up as the external environment improves.
Infrastructure investment is expected to remain
strong, especially among countries less
dependent on extractives. A further slowdown in
China may, however, keep commodity prices low.
A continuation of low commodity prices could
cast a shadow on the viability of planned
investments, particularly in the extractives
sector, and could further erode the region’s low
policy buffers. Nevertheless, almost all the
region’s economies are projected to register
higher growth in 2016, including the three largest
economies. Growth in SSA region is projected at

16
4.2 percent in 2016 and 4.7 percent in 2017 and
2018, up from 3.4 percent in 2015.
1.7 Progress on Global Development Goals
In 2013, the WBG adopted the twin goals to
reduce extreme poverty to three percent by 2030
and to promote shared prosperity of the bottom
40 percent (B40) of the population in each
country in a sustainable manner. The first goal is
in effect a continuation of the first Millennium
Development Goal (MDG1), which aimed to
reduce extreme poverty and hunger by half by
2015. In its second goal, the WBG seeks to shift
focus from average income growth towards
growing inequality in basic living standards.
Countries made substantial progress over the
MDGs era, with rapid economic growth
supported by strong commodity prices and
improved macroeconomic policies. By 2010, the
world had achieved the MDG1 target, mainly due
to rapid growth in China and India, leading to
poverty rates of 4.1 percent and 13.5 percent in
the EAP and SA regions, respectively, in 2015 (See
Figure 1.5). In contrast, less progress was
registered in the SSA region, with poverty rates
falling only to 35.2 percent in 2015, from 58.0
percent in 1999. The SSA region is the only region
that was not on target to halve extreme poverty
by 2015, with only 16 countries on track to meet
this target and 21 countries not expected to meet
it even by 2030. It is also the only region that saw
a steady increase in the number of underweight
children below the age five, from 27.5 million in
1990 to 31.4 million in 2014, representing one
third of the underweight children under-five in
the developing world.
The EAP, ECA and LAC regions reached the target
on primary school completion rate. The
completion rate in SSA rose from 54 percent in
1994 to 69 percent in 2013, but it remained the
lowest among all regions. The SSA region, like the
MENA region, continues to have large gender
disparities in primary and secondary enrolment
rates and both regions were unlikely to meet
these targets by 2015. In contrast, the SA, EAP
and ECA regions reached gender parity in 2013.
While the SA and MENA regions achieved parity
in tertiary enrolment, the rate in SSA remained
low at 73 percent.
Although the global average rate of child
mortality declined from 91 to 43 deaths per 1,000
live births between 1990 and 2015, it fell short of
target to cut child mortality by two thirds of the
1990 rate. The SSA and SA regions bear the
highest rates, while the EAP and LAC regions
achieved the target. In the SSA region, the rate
declined by more than a half between 1990 and
2015, but remained high at 83 deaths per 1,000
live births. Similarly, the maternal mortality rate
remains high in the SSA region, accounting for 62
percent of the global maternal caused deaths of
289,000 women occurring in developing
countries in 2013. The target on maternal
mortality rates will not be achieved globally
despite the remarkable reductions across
countries. This is due to the increase in the
number of reproductive age women and the
fertility rate. Achievements on HIV/AIDS, malaria
and TB are also mixed. The spread of HIV/AIDS in
SSA led to reversals in the improvement in life
expectancy rates and increased the number of
orphaned children. The SSA region remains the
center of the epidemic with about 70 percent of
the world’s adults living with HIV/AIDS, with a
high prevalent rate of 4.5 percent in 2014,
compared to less than 1.0 percent in other
regions. Though TB and malaria continued to
claim millions of lives, the world achieved the
targets of halting and reversing both diseases by
2015 as incidence and death rates declined.

17
This unfinished agenda on the MDGs forms the
basis for the post-2015 development agenda, as
espoused in Sustainable Development Goals
(SDGs) framework. The WBG forecasts that the
global economy will rebound in the medium
term, albeit with several risks. Should these risks
materialize, developing countries spending on
social services and infrastructure for example,
may be constrained, while low growth will slow
down job creation. These are key for
achievement of the SDGs.
Figure 1.5: Share of Population below $1.90 a day (%)
Source: World Bank
Note:
1. Global poverty assessed with the re-estimated poverty line of $1.90 a day, based on the 2011 PPP.
2. Regional aggregates for MENA are omitted due to lack of sufficient observations.
3. Numbers up to 2012 are based on national household surveys. Numbers for 2015 are WBG calculations
based on growth scenarios and distributional assumptions.
0
10
20
30
40
50
60
1990 1999 2011 2012 2015
EAP ECA LAC SA SSA Developing world World
18
Juba, South Sudan
The road north out of Swakopmund up towards the Skeleton Coast National Park _ Namibia

Chapter 2
World Bank Group Operations
IBRD Lending Operations
IDA Lending Operations
IFC Operations
MIGA Operations

20
Chapter 2
World Bank Group Operations
2.1 Overview
This chapter gives an account of the performance
of the World Bank Group (WBG) operations
during the first half of financial year 2016 (FY16)
(July 1st 2015 –December 31st 2015).
2.2 IBRD and IDA Operations
The combined commitments2 for the
International Bank for Reconstruction and
Development (IBRD) and the International
Development Association (IDA) was 13.9 percent
higher in the first half of FY16 at US$23.0 billion,
compared to US$20.2 billion in the first half of
FY15 (Table 2.1). The Middle East and North
Africa (MENA) and South Asia (SA) regions,
accounted for the largest increases during this
period, with commitments of US$4.9 billion and
US$3.2 billion, respectively, up from US$2.0
billion and US$1.8 billion in the corresponding
period in FY15.
In contrast, commitments to the Sub-Saharan
Africa (SSA) and East Asia and Pacific (EAP)
regions recorded decreases in the first half of
FY16. Commitments to SSA region declined from
US$3.7 billion to US$3.3 billion, while the decline
in the EAP region was significant at 40 percent,
from US$4.1 billion to US$2.4 billion.
The combined disbursements for IBRD and IDA
rose from US$17.5 billion in the first half of FY15,
to US$19.9 billion in the first half of FY16 (Table
2 Legal obligation to provide financial products to clients for
Board approved projects.
2.2). Disbursements to the EAP and MENA
regions mainly accounted for this increase, with
additions of US$1.2 billion and US$0.9 billion,
respectively. In contrast, disbursements to the
ECA and LAC regions declined by US$0.8 billion
and US$0.6 billion, respectively.
Table 2.1: IBRD and IDA Commitments by Region (US$ billion)
Region First Half FY15
First Half FY16
Sub-Saharan Africa 3.7 3.3
East Asia and Pacific 4.1 2.4
Europe and Central Asia 5.1 5.3
Latin America and Caribbean 3.5 3.9
Middle East and North Africa 2.0 4.9
South Asia 1.8 3.2
Total 20.2 23.0
Source: World Bank
Table 2.2: IBRD and IDA Disbursements by Region (US$ billion)
Region First Half FY15
First Half FY16
Sub-Saharan Africa 3.8 3.9
East Asia and Pacific 2.7 3.9
Europe and Central Asia 4.3 3.5
Latin America and Caribbean 4.0 3.4
Middle East and North Africa 1.2 3.1
South Asia 1.5 2.1
Total 17.5 19.9
Source: World Bank
21
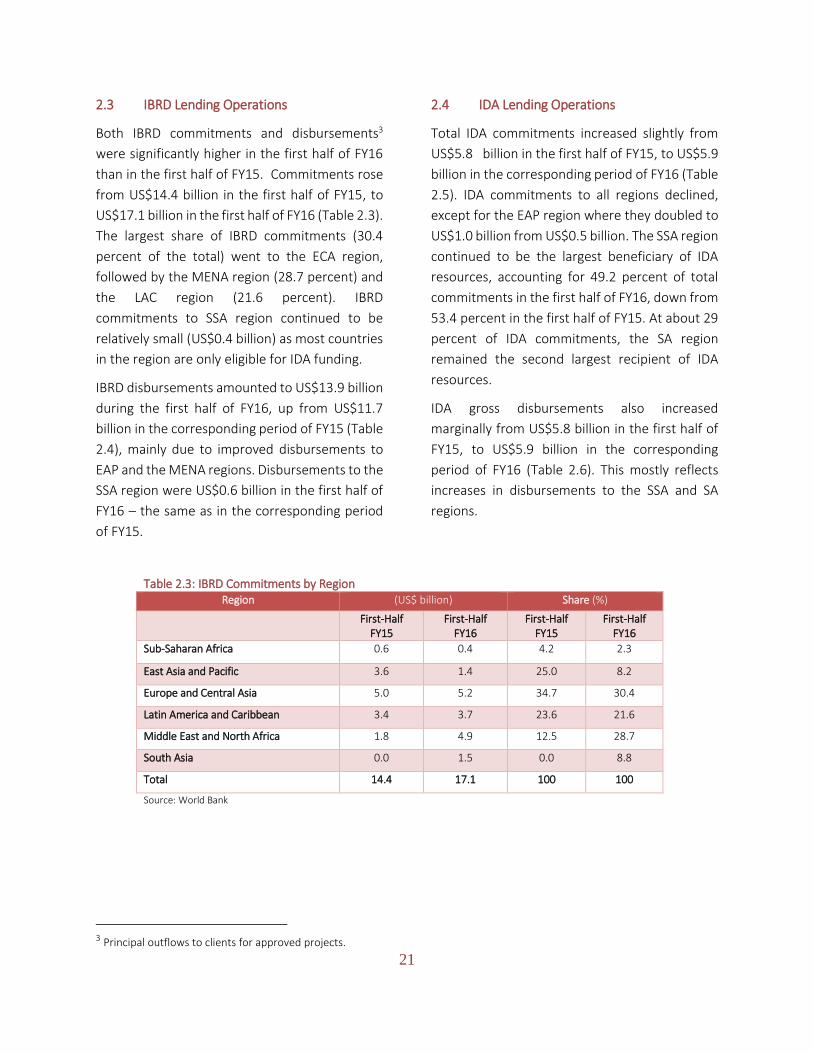
2.3 IBRD Lending Operations
Both IBRD commitments and disbursements3
were significantly higher in the first half of FY16
than in the first half of FY15. Commitments rose
from US$14.4 billion in the first half of FY15, to
US$17.1 billion in the first half of FY16 (Table 2.3).
The largest share of IBRD commitments (30.4
percent of the total) went to the ECA region,
followed by the MENA region (28.7 percent) and
the LAC region (21.6 percent). IBRD
commitments to SSA region continued to be
relatively small (US$0.4 billion) as most countries
in the region are only eligible for IDA funding.
IBRD disbursements amounted to US$13.9 billion
during the first half of FY16, up from US$11.7
billion in the corresponding period of FY15 (Table
2.4), mainly due to improved disbursements to
EAP and the MENA regions. Disbursements to the
SSA region were US$0.6 billion in the first half of
FY16 – the same as in the corresponding period
of FY15.
2.4 IDA Lending Operations
Total IDA commitments increased slightly from
US$5.8 billion in the first half of FY15, to US$5.9
billion in the corresponding period of FY16 (Table
2.5). IDA commitments to all regions declined,
except for the EAP region where they doubled to
US$1.0 billion from US$0.5 billion. The SSA region
continued to be the largest beneficiary of IDA
resources, accounting for 49.2 percent of total
commitments in the first half of FY16, down from
53.4 percent in the first half of FY15. At about 29
percent of IDA commitments, the SA region
remained the second largest recipient of IDA
resources.
IDA gross disbursements also increased
marginally from US$5.8 billion in the first half of
FY15, to US$5.9 billion in the corresponding
period of FY16 (Table 2.6). This mostly reflects
increases in disbursements to the SSA and SA
regions.
Table 2.3: IBRD Commitments by Region
Region (US$ billion) Share (%)
First-Half FY15
First-Half FY16
First-Half FY15
First-Half FY16
Sub-Saharan Africa 0.6 0.4 4.2 2.3
East Asia and Pacific 3.6 1.4 25.0 8.2
Europe and Central Asia 5.0 5.2 34.7 30.4
Latin America and Caribbean 3.4 3.7 23.6 21.6
Middle East and North Africa 1.8 4.9 12.5 28.7
South Asia 0.0 1.5 0.0 8.8
Total 14.4 17.1 100 100
Source: World Bank
3 Principal outflows to clients for approved projects.

22
Table 2.4: IBRD Gross Disbursements by Region Region (US$ billion) Share (%)
First-Half FY15
First-Half FY16
First-Half FY15
First-Half FY16
Sub-Saharan Africa 0.6 0.6 5.1 4.3
East Asia and Pacific 1.8 3.3 15.4 23.6
Europe and Central Asia 4.1 3.3 35.0 23.6
Latin America and Caribbean 3.8 3.2 32.2 22.9
Middle East and North Africa 1.1 3.1 9.4 22.0
South Asia 0.3 0.4 2.6 3.6
Total 11.7 13.9 100 100
Source: World Bank
Table 2.5: IDA Commitments by Region
Region (US$ billion) Share (%)
First-Half FY15
First-Half FY16
First-Half FY15
First-Half FY16
Sub-Saharan Africa 3.1 2.9 53.4 49.2
East Asia and Pacific 0.5 1.0 8.6 16.9
Europe and Central Asia 0.1 0.1 1.7 1.7
Latin America and Caribbean 0.1 0.2 1.7 3.4
Middle East and North Africa 0.2 0.0 3.4 0.0
South Asia 1.8 1.7 31.0 28.8
Total 5.8 5.9 100 100
Source: World Bank
Table 2.6: IDA Gross Disbursements by Region Region (US$ billion) Share (%)
First-Half FY15
First-Half FY16
First-Half FY15
First-Half FY16
Sub-Saharan Africa 3.2 3.3 55.2 55.9
East Asia and Pacific 0.9 0.6 15.5 10.2
Europe and Central Asia 0.2 0.2 3.4 3.4
Latin America and Caribbean 0.2 0.2 3.4 3.4
Middle East and North Africa 0.1 0.0 1.7 0.0
South Asia 1.2 1.6 20.7 27.1
Total 5.8 5.9 100 100
Source: World Bank

23
2.5 IFC Operations
The activities of the International Finance
Corporation (IFC) in support of private sector
development had a mixed performance in the
first half of FY16. While commitments and
approvals4 increased during the first half of FY16,
disbursements decreased substantially.
Total commitments increased by 36.5 percent
from US$5.1 billion in the first half of FY15 to
US$7.0 billion in the corresponding period of
FY16 (Table 2.7). Improvements in commitments
were recorded in the EAP, ECA and the LAC
regions, with increases of US$2.2 billion (up from
US$0.7 billion), US$1.2 billion (up from US$0.6
billion) and US$2.4 billion (up from US$1.2
billion), respectively.
IFC commitments to the SSA and SA regions,
however, continued the downward trend
observed since FY14. Commitments to the SSA
region decreased from US$809 million in the first
half of FY15 to US$668 million in the first half of
FY165. For the SA region, commitments
decreased from US$476 million in the first half of
FY15 to US$202 million in the first half of FY16.
Approvals during the first half of FY16 increased
to US$7.6 billion from US$6.2 billion in the
corresponding period of FY15 (Table 2.8). All the
regions recorded increases, except the SSA and
EAP regions where approvals decreased from
US$858 million to US$618 million and from
US$1.5 billion to US$988 million, respectively.
Total disbursements decreased to US$2.1 billion
in the first half of FY16 from US$5.3 billion during
the first half of FY15. Disbursements to the SSA
region decreased substantially from US$756
million in the first half of FY15 to US$156 million
in the first half of FY16 (Table 2.9).
Table 2.7: IFC Commitments by Region
Region (US$ million) Share (%)
First-Half FY15
First-Half FY16
First-Half FY15
First-Half FY16
Sub-Saharan Africa 809 668 16 10
East Asia and Pacific 734 2,183 14 31
Europe and Central Asia 585 1,184 11 17
Latin America and Caribbean 1,466 2,424 29 35
Middle East and North Africa 430 248 8 3
South Asia 476 202 9 3
World Region+ 619 80 12 1
Total 5,119 6,989 100 100
Source: IFC
Notes: +World Region refers to IFC operations undertaken in more than one region.
4 Authorization by Board/Management to proceed to
Commitment in accordance with Official Procedures.
5 See Annex 1 for the breakdown of IFC operations in the
Africa Group 1 Constituency.

24
Table 2.8: IFC Approvals by Region Region (US$ million) Share (%)
First-Half FY15
First-Half FY16
First-Half FY15
First-Half FY16
Sub-Saharan Africa 858 618 14 8
East Asia and Pacific 1524 988 25 13
Europe and Central Asia 1,033 1,445 17 19
Latin America and Caribbean 1,223 2,090 20 28
Middle East and North Africa 316 1,282 5 17
South Asia 491 533 8 7
World Region 745 638 12 8
Total 6,189 7,594 100 100
Source: IFC
Table 2.9: IFC Disbursements by Region
Region (US$ million) Share (%)
First-Half FY14
First-Half FY15
First-Half FY14
First-Half FY15
Sub-Saharan Africa 756 156 14 7
East Asia and Pacific 1,048 438 20 21
Europe and Central Asia 1,301 301 24 14
Latin America and Caribbean 391 1,058 7 50
Middle East and North Africa 565 76 11 4
South Asia 710 13 13 1
World Region 577 60 11 3
Total 5,346 2,102 100 100
Source: IFC
2.6 MIGA Operations
The Multilateral Investment Guarantee Agency
(MIGA), has the mandate of promoting foreign
direct investments (FDI) into developing
countries and, of its own accord, provides
political risk insurance and credit enhancement
products to investors and lenders. The products
include guarantees to cover non-honoring of
sovereign financial obligations and financial
obligations of state-owned enterprises.
During the first half of FY16, MIGA supported an
additional eight projects with a gross issuance
value of US$2.0 billion. This represents close to a
twofold increase in the volume of MIGA’s
business, but covering less than half the number
of projects in the corresponding period of FY15
(Table 2.10). Worth noting in this regard is that
97 percent of MIGA guarantees supported six
projects in IDA countries.
MIGA’s, total net exposure declined by 2.5
percent to US$7.1 billion at the end of the first
half of FY16 from the corresponding period in
FY15 (Table 2.11). The portfolio in the ECA region
declined by 16.1 percent, while that of the EAP
region declined by 6.1 percent. In contrast,
MIGA’s net exposure to the SSA region grew by
10.5 percent to US$2.0 billion. The new
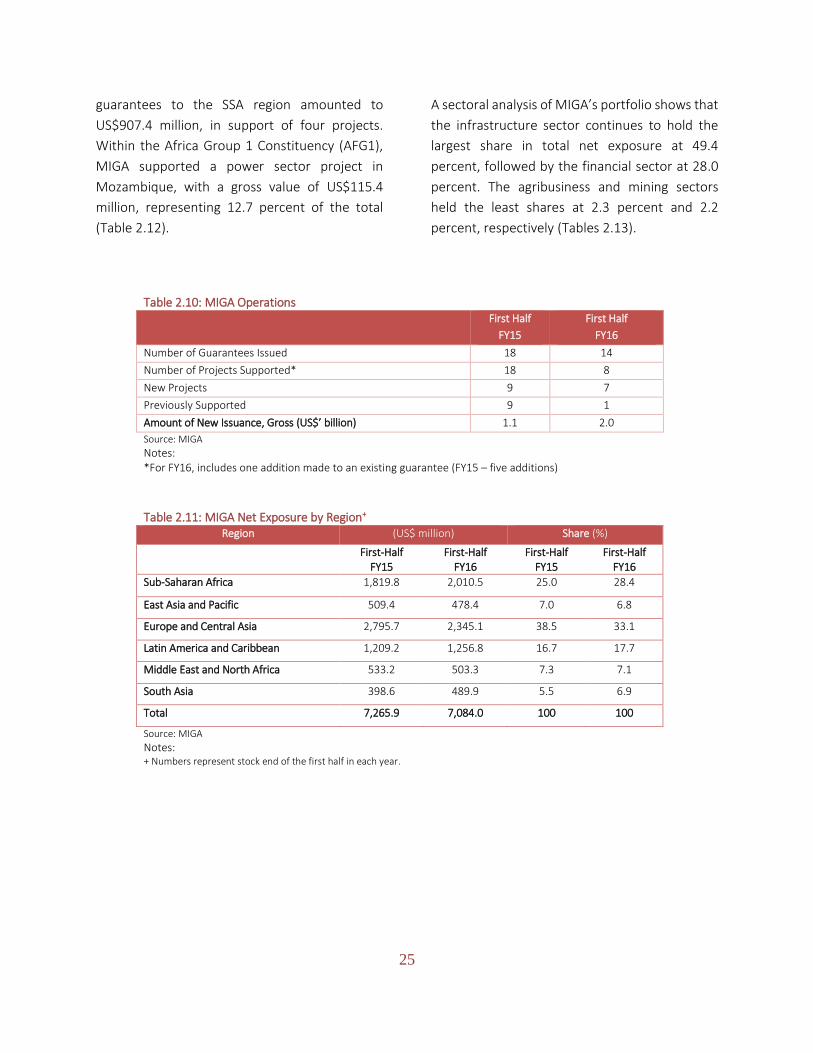
25
guarantees to the SSA region amounted to
US$907.4 million, in support of four projects.
Within the Africa Group 1 Constituency (AFG1),
MIGA supported a power sector project in
Mozambique, with a gross value of US$115.4
million, representing 12.7 percent of the total
(Table 2.12).
A sectoral analysis of MIGA’s portfolio shows that
the infrastructure sector continues to hold the
largest share in total net exposure at 49.4
percent, followed by the financial sector at 28.0
percent. The agribusiness and mining sectors
held the least shares at 2.3 percent and 2.2
percent, respectively (Tables 2.13).
Table 2.10: MIGA Operations First Half
FY15
First Half
FY16
Number of Guarantees Issued 18 14
Number of Projects Supported* 18 8
New Projects 9 7
Previously Supported 9 1
Amount of New Issuance, Gross (US$’ billion) 1.1 2.0
Source: MIGA
Notes: *For FY16, includes one addition made to an existing guarantee (FY15 – five additions)
Table 2.11: MIGA Net Exposure by Region+
Region (US$ million) Share (%)
First-Half FY15
First-Half FY16
First-Half FY15
First-Half FY16
Sub-Saharan Africa 1,819.8 2,010.5 25.0 28.4
East Asia and Pacific 509.4 478.4 7.0 6.8
Europe and Central Asia 2,795.7 2,345.1 38.5 33.1
Latin America and Caribbean 1,209.2 1,256.8 16.7 17.7
Middle East and North Africa 533.2 503.3 7.3 7.1
South Asia 398.6 489.9 5.5 6.9
Total 7,265.9 7,084.0 100 100
Source: MIGA
Notes: + Numbers represent stock end of the first half in each year.

26
Table 2.12: MIGA Guarantees in Sub-Saharan Africa, 1st Half FY16 Constituency/Country No. of
Projects
Sector Guarantee Amount
(US$M)
In % of SSA
Africa Group 1 (AFG1) 1 Power 115.4 12.7
Mozambique 1 Power 115.4 12.7
Other SSA (Non-AFG1) 3 Financial/Oil & Gas/ Power 792.0 87.3
Total SSA 4 907.4 100.0
Source: MIGA.
Table 2.13: MIGA Portfolio by Sector, 1st Half FY16+ Sector Gross Exposure
(US$ million) Net Exposure (US$ million)
Total Net Exposure (%)
Agribusiness 164.3 164.0 2.3
Financial 3,285.4 1,986.8 28.0
Infrastructure 6,511.8 3,496.6 49.4
Power 3,188.9 1,762.4 24.9
Telecom 334.5 210.5 3.0
Manufacturing 561.5 468.5 6.6
Mining 1,000.0 152.5 2.2
Oil and Gas 1,101.6 487.6 6.9
Tourism/Retail/Services 361.3 328.0 4.6
Total 12,985.9 7,084.0 100.0
Source: MIGA + Numbers represent stock end of the first half in each year.

27
A primary school in Kampala, Uganda
This school in Manan Telkouk, Kasala is now powered by Solar cells one of CDF’s projects in education- Sudan

28
Catching Hope- Saftey Nets Change Lives in Brazil and Ethiopia – Ethiopia
Nurse at Redemption Hospital _ Liberia

Chapter 3
Selected Policy and Strategic Issues
Environmental and Social Safeguards Framework
The 2015 Voice Reform
IDA Reforms
The World Bank Group’s Role in the Data Revolution
Climate Change: COP21 and the Africa Climate Business Plan
Global Agriculture and Food Security Program (GAFSP)
Diversity and Inclusion

30
Chapter 3
Selected Policy and Strategic Issues
3.1 Overview
This Chapter provides updates on selected policy
and strategic issues in the World Bank Group
(WBG) since October 2015. Overall, significant
progress has been registered on several fronts.
As regards the review of the Environmental and
Social Safeguards Framework (ESSF), the third
round of consultations was concluded in March
2016, paving the way for Board approval of the
new policy by end of FY16. Regarding the 2015
Voice Reform, an interim report on the Dynamic
Formula will be presented to Governors for their
consideration during the 2016 Spring Meetings of
the WBG and International Monetary Fund (IMF).
With respect to IDA, the IDA17 Mid-Term Review
and first IDA18 Replenishment meetings were
held in November 2015 and March 2016,
respectively, where discussions were held on the
strategic outlook including scaling up of financing
and IDA special themes.
Progress was also made on the WBG’s response
to closing data gaps in measuring development,
with a rollout of a Strategic Action Plan on data.
Similarly, the WBG responded to calls for greater
action on Climate Change by reaffirming its
commitment in this area and launching the Africa
Climate Business Plan at the 21st session of the
Conference of the Parties (COP21) in December
2015. On Diversity and Inclusion within the WBG,
progress has been made toward meeting the
Institution’s targets, with the recruitment of 40
nationals from SSA at professional and
management levels.
3.2 Review of the World Bank Environmental
and Social Safeguards Framework
As reported in the FY15 Annual Report, the third
phase of consultations on the second draft of the
ESSF concluded in March 2016 (Box 3.1). The
World Bank held discussions with a wide range of
stakeholders from Governments and
implementing agencies, Civil Society
Organizations (CSOs) involved in advocacy and
service delivery, the private sector, as well as
academia and applied research institutions.
These discussions focused on an indicative list
(Box 3.2) of the outstanding issues as indicated by
Executive Directors, including the feasibility of
implementing the proposed Framework and the
impact on borrowing countries especially on
costs.
Consultations in the Africa Group 1 Constituency
(AfG1) took place in the Republic of Rwanda
(January 13-15, 2016), the Republic of Kenya
(February 2-4, 2016), the Federal Democratic
Republic of Ethiopia (February 8-12, 2016), and
United Republic of Tanzania (February 13-17,
2016). All the other countries in the Constituency
were invited to participate in the consultation
process in one of these countries. In this respect,
government officials from the Republic of
Mozambique and the Kingdom of Lesotho were
present at the consultations in the Republic of
Kenya, while representatives from the Republic
of The Sudan and the Republic of South Sudan
participated in the consultations held in the

31
Federal Democratic Republic of Ethiopia.
Representatives from the Republic of Burundi
attended the consultations in the United
Republic of Tanzania.
Box 3.1: The Proposed ESSF Standards
ESS1: Assessment and Management of Environmental and Social
Risks and Impacts
ESS2: Labor and Working Conditions
ESS3: Resource Efficiency and Pollution Prevention and
Management
ESS4: Community Health and Safety
ESS5: Land Acquisition, Restrictions on Land Use and Involuntary
Resettlement
ESS6: Biodiversity Conservation and Sustainable Management of
Living Natural Resources
ESS7: Indigenous Peoples
ESS8: Cultural Heritage
ESS9: Financial Intermediaries
ESS10: Information Disclosure and Stakeholder Engagement
During the consultations, stakeholders reiterated
the view that the ESSF should primarily focus on
helping countries eradicate poverty and promote
shared prosperity in a sustainable manner. They
observed that flexibility and cost neutrality
should be at the center of the ESSF’s
implementation process. They further
emphasized that the ESSF should not impose
policies that are in conflict with Borrowers’
national values. Rather, the ESSF should fully
respect national Constitutions and laws. In
essence, the Framework should be an instrument
that helps build and strengthen their institutional
capacity, systems and frameworks.
Box 3.2 Indicative List for the ESSF Consultations Standard Issue Vision Approach to human rights in the ESSF ESS1
Non-discrimination and vulnerable groups
Use of Borrower’s Environmental and Social Framework
Co-financing/ common approach
Adaptive risk management
Risk classification
Environmental and Social Commitment Plan (ESCP)
ESS2 Operationalization of the Occupational Health and Safety (OHS) provisions/standards
Application and implementation impacts of certain labor requirements,
Referencing national law in the objective of supporting freedom of association and collective bargaining
ESS3 Climate change and GHG emissions
The relation between provisions on climate change in the ESF and broader climate change commitments, specifically the United Nations Framework Convention on Climate Change (UNFCCC)
ESS5 Land acquisition and involuntary resettlement ESS6 Role of national law with regard to protecting and
conserving natural and critical habitats
Criteria for biodiversity offsets, including consideration of project benefits
Definition and application of net gains for biodiversity
ESS7 Implementation of the Indigenous Peoples standard in complex political and cultural contexts as well as the national constitutions
Criteria for establishing and implementation of Free, Prior and Informed Consent (FPIC)
ESS8 Application of intangible cultural heritage when the project intends to commercialize such heritage, and when it has not been legally protected or previously identified or disturbed
ESS9 Application of standard to FI subprojects and resource implications depending on risk
Harmonization of approach with IFC and Equator Banks
ESS10 Definition and identification of project stakeholders and nature of engagement
General
Application of the Environmental, Health and Safety Guidelines (EHSGs) and Good International Industry Practice (GIIP), especially when different from national laws
Implementation and resource implications for Borrowers
Client capacity building and implementation support
Timing of the preparation and disclosure of specific environmental and social impact assessment documents
Bank internal capacity building, resourcing, and behavioral change in order to successfully implement the ESF
Ways of reaching mutual understanding between Borrower and Bank on issues of difficult interpretation

32
To facilitate the completion of the review and
update of the ESSF, Executive Directors formed
Working Groups to discuss various aspects of the
Framework. This process is envisaged to bring
consensus in a faster and smooth manner.
Following the closure of the consultations,
Executive Directors received feedback on the
consultations and the proposed next steps. The
comments and recommendations received
during this consultation phase would inform the
final draft framework for discussion and approval
by the World Bank’s Executive Board before the
end of FY16.
3.3 Update on the 2015 Voice Reform
In their 2015 Shareholding Review Report to
Governors, presented during the 2015 Annual
Meetings of the WBG and IMF in Lima, Peru,
Executive Directors made a commitment to
develop a dynamic formula based on the
guidance given by Governors. They aimed to
conclude and present their work to Governors by
the 2016 Annual Meetings, with an Interim
Report on progress presented at the 2016 Spring
Meetings of the WBG and IMF.
The dynamic formula was to be developed based
on guiding principles of the Voice Reform agreed
at the 2009 Annual Meetings held in Istanbul,
Turkey. The Shareholding Review Principles are:
(i) Regular shareholding reviews will take
place every five (5) years based on
agreed principles and a dynamic formula;
(ii) The guiding principle for shareholding
realignment is to achieve an equitable
balance of voting power, taking into
consideration country groups, and/or
country under-representation;
(iii) As a global cooperative, all voices are
important. Members have basic votes,
protected in the constituent documents
of respective WBG entities. Therefore,
where possible decision making is by
consensus.
(iv) The smallest shareholders shall be
protected from dilution of their voting
power.
(v) Shareholding brings both rights and
responsibilities, and all shareholders
have an interest in the long-term
financial sustainability of the WBG,
including IBRD and IFC’s AAA credit rating
and contributing capital in line with
members’ capacity to do so.
Since discussions that were held in Lima, Peru in
October 2015, Executive Directors have agreed
on the two core variables of the dynamic formula,
(i.e. GDP as a measure of economic weight and
IDA Contributions). Further work however,
remains to be undertaken to determine the
relative weights of these variables. As regards
the measure of economic weight, Executive
Directors support the use of a GDP variable that
blends Market Exchange Rates (MER) and
Purchasing Power Parity (PPP). They will
determine an appropriate weight to attach to
MER and PPP, and whether the GDP variable
should be averaged over 3 or 5 years, in order to
smooth out any fluctuations that may be caused
by economic cycles.
On IDA contributions, there is acknowledgement
of the need to both recognize historical
contributions to IDA and incentivize new donors
and future contributors to IDA replenishments.
Similarly, further work to refine the approach,
including determining the relative weights to be
given to historical and recent IDA contributions
remains to be done.
In order to protect the smallest shareholders, the
voting power of these countries will be ring-
fenced and kept out of the dynamic formula.
Going forward, significant compromise will be
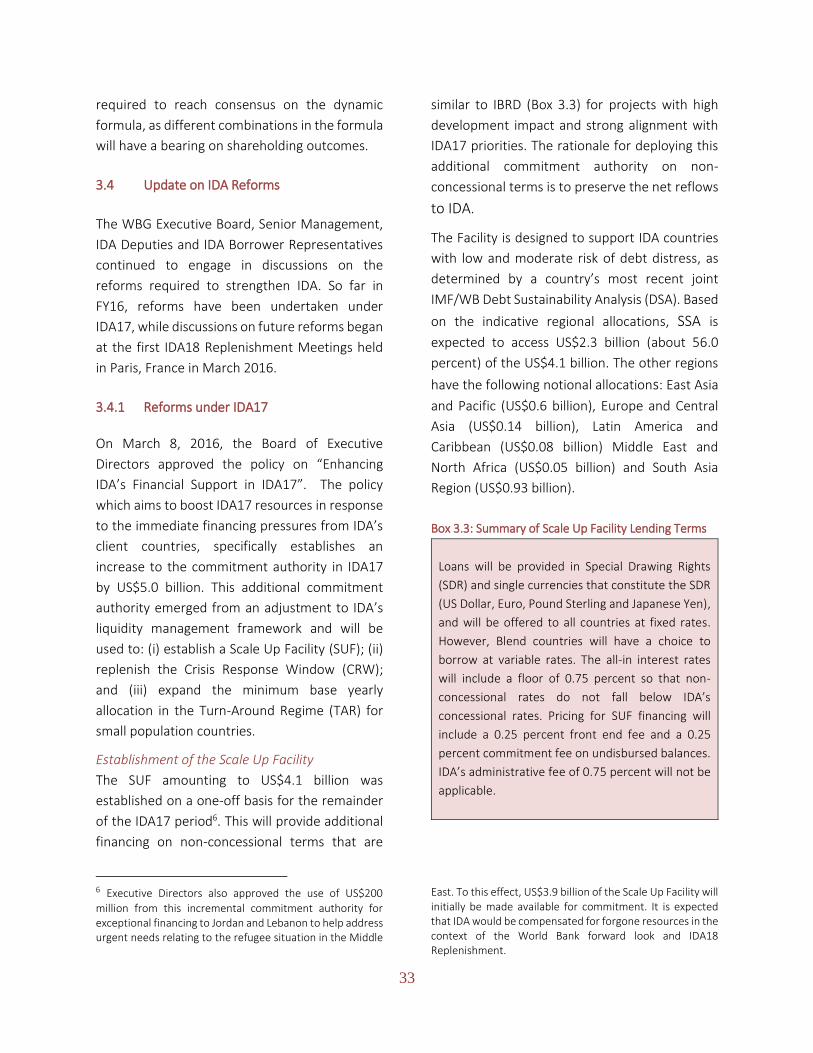
33
required to reach consensus on the dynamic
formula, as different combinations in the formula
will have a bearing on shareholding outcomes.
3.4 Update on IDA Reforms
The WBG Executive Board, Senior Management,
IDA Deputies and IDA Borrower Representatives
continued to engage in discussions on the
reforms required to strengthen IDA. So far in
FY16, reforms have been undertaken under
IDA17, while discussions on future reforms began
at the first IDA18 Replenishment Meetings held
in Paris, France in March 2016.
3.4.1 Reforms under IDA17
On March 8, 2016, the Board of Executive
Directors approved the policy on “Enhancing
IDA’s Financial Support in IDA17”. The policy
which aims to boost IDA17 resources in response
to the immediate financing pressures from IDA’s
client countries, specifically establishes an
increase to the commitment authority in IDA17
by US$5.0 billion. This additional commitment
authority emerged from an adjustment to IDA’s
liquidity management framework and will be
used to: (i) establish a Scale Up Facility (SUF); (ii)
replenish the Crisis Response Window (CRW);
and (iii) expand the minimum base yearly
allocation in the Turn-Around Regime (TAR) for
small population countries.
Establishment of the Scale Up Facility
The SUF amounting to US$4.1 billion was
established on a one-off basis for the remainder
of the IDA17 period6. This will provide additional
financing on non-concessional terms that are
6 Executive Directors also approved the use of US$200
million from this incremental commitment authority for exceptional financing to Jordan and Lebanon to help address urgent needs relating to the refugee situation in the Middle
similar to IBRD (Box 3.3) for projects with high
development impact and strong alignment with
IDA17 priorities. The rationale for deploying this
additional commitment authority on non-
concessional terms is to preserve the net reflows
to IDA.
The Facility is designed to support IDA countries
with low and moderate risk of debt distress, as
determined by a country’s most recent joint
IMF/WB Debt Sustainability Analysis (DSA). Based
on the indicative regional allocations, SSA is
expected to access US$2.3 billion (about 56.0
percent) of the US$4.1 billion. The other regions
have the following notional allocations: East Asia
and Pacific (US$0.6 billion), Europe and Central
Asia (US$0.14 billion), Latin America and
Caribbean (US$0.08 billion) Middle East and
North Africa (US$0.05 billion) and South Asia
Region (US$0.93 billion).
Box 3.3: Summary of Scale Up Facility Lending Terms
Loans will be provided in Special Drawing Rights
(SDR) and single currencies that constitute the SDR
(US Dollar, Euro, Pound Sterling and Japanese Yen),
and will be offered to all countries at fixed rates.
However, Blend countries will have a choice to
borrow at variable rates. The all-in interest rates
will include a floor of 0.75 percent so that non-
concessional rates do not fall below IDA’s
concessional rates. Pricing for SUF financing will
include a 0.25 percent front end fee and a 0.25
percent commitment fee on undisbursed balances.
IDA’s administrative fee of 0.75 percent will not be
applicable.
East. To this effect, US$3.9 billion of the Scale Up Facility will initially be made available for commitment. It is expected that IDA would be compensated for forgone resources in the context of the World Bank forward look and IDA18 Replenishment.

34
Replenishment of the Crisis Response Window
The CRW was replenished by an allocation of
concessional funds amounting to US$900 million,
to equip IDA to respond to further crises over the
remainder of the IDA17 period. The eligibility
criteria for accessing the CRW was expanded to
include health emergencies and pandemics that
have significant negative global spillovers. To
access the CRW, the new criterion requires
countries to declare a national public health
emergency and the World Health Organization to
declare that the outbreak was potentially of
international importance, under its Global Alert
and Response system and in accordance with the
2005 International Health Regulations. The
unused balances of the CRW would be carried
over for utilization in IDA18.
Increase in the Minimum Base Yearly Allocation
under the Turn-Around Regime for Small
Population Countries
Under IDA17, exceptional financing is provided to
IDA eligible countries facing a turn-around
situation in addition to their regular allocation.
For the purpose of the exceptional regime, a
“turn-around’ situation is a critical juncture in a
country’s development trajectory providing a
significant opportunity for building stability and
resilience. It is marked by: (i) the cessation of an
ongoing conflict which significantly disrupts a
country’s development process; and (ii) the
commitment to major change in the policy
environment following a prolonged period of
disengagement from Bank lending; or a major
shift in a country’s policy priorities addressing
critical elements of fragility.
At the IDA17 Mid Term Review, it was
determined that the TAR as originally designed
did not sufficiently provide for countries with
small populations, particularly those with low
Performance Based Allocation (PBA) ratings, due
to the allocation of funds on a per capita basis. To
ensure higher financing to countries with small
populations, the Executive Board, therefore
approved the introduction of a minimum base
yearly allocation in the TAR of SDR4.0 million.
3.4.2 Highlights of the First IDA 18
Replenishment Meeting
The IDA18 Replenishment discussions
commenced with the first Meeting in Paris,
France during March 14-15, 2016. The co-
chairing arrangement of the replenishment
process and increased participation of borrowing
countries from six to eight, which resulted from
the governance reforms agreed to in the course
of the IDA17 Working Group’s exercise, were put
into effect. Ms. Sri Mulyani Indrawati, Managing
Director and Chief Operations Officer, WBG, and
Ms. Dede Ekoue, Development Expert and
Former Minister of Planning and Development,
Republic of Togo, co-chaired the meeting. There
were fourteen Borrowers’ Representatives, of
which five were from SSA countries, namely,
Burkina Faso, Guinea Bissau, Democratic
Republic of Congo, Malawi, Nigeria, and Zambia.
Donor countries were represented by their IDA
Deputies.
The main objective of the Meeting was to set the
agenda and strategic directions for the IDA18
Replenishment. Three main issues were
discussed: (i) the overarching theme and special
themes; (ii) the IDA graduation policy; and (iii)
IDA leveraging. Borrowers’ Representatives
shared their views in a joint statement on these
issues (see Annex 4).
Strategic Direction for IDA18
Drawing from the changing global landscape for
development, which presents both opportunities
and challenges for developing countries, the
Meeting called upon the WBG to adapt and to
remain fit-for-purpose. The IDA18

35
Replenishment was deemed as the first
opportunity for the international development
community to make concrete their commitments
to scale up financing in order to deliver on global
development goals. With IDA acknowledged as a
powerful platform to tackle complex, global
challenges through country solutions, it was
considered that a thematically focused IDA18
would be crucial for attracting interest and
attention of partners to support a robust
replenishment in 2016.
The Meeting agreed on the following overarching
theme for IDA18: “Towards 2030 - Investing in
Growth, Resilience and Opportunity”. Also, given
the unfinished agenda in IDA17, the Meeting
agreed to continue with its special themes and
added two new ones (Box 3.4). Concrete policy
commitments on each of these themes would be
discussed and agreed in June 2016.
Review of IDA’s Graduation Policy
The Meeting considered: (i) the current
graduation policy and reviewed possible
adjustments to the graduation criteria; (ii) the
recommendations for three countries, namely,
Bolivia, Sri Lanka and Vietnam to graduate at the
end of the IDA17 period subject to a transition
support mechanism; and (iii) the proposed
modalities for improving coordination within the
WBG and with external development partners for
smoothing the transition from IDA.
As regards the review of the graduation criteria,
namely raising the GNI cut-off and
supplementing it with additional development
indicators, no change was made. The Meeting
however, underscored the importance of
transparency and equity in the application of the
graduation criteria. The WBG was also
encouraged to play a broader leadership role in
coordinating with external development partners
in the graduation process.
Box 3.4: Special Themes for IDA18
Climate Resilient Development – to acknowledge
the growing impact of climate change on
development, especially in small island states, and
the importance of building country resilience;
Gender Equality – to recognize the significant
progress that has been made in closing gender
gaps, especially in education, while acknowledging
the unfinished agenda, especially in economic
empowerment;
Fragility, Conflict and Violence (FCV) – to recognize
that this is among the most pressing global policy
issues, and that fragility, including refugee crises
and internally displaced people, presents major
obstacles to development with impacts at the
country, regional and global levels;
Economic Transformation and Jobs – this calls for
an economy-wide framework that supports the
transition to higher value production and improved
productivity. This should capture opportunities for
jobs, private sector development, and economic
diversification;
Governance and Institution Building – this
recognizes the crosscutting importance of good
governance and strong institutions in sustainably
attaining the development goals. This will foster
strong domestic resource mobilization and capacity
building.
The Meeting acknowledged that the three
graduating countries faced external
vulnerabilities that would impact their progress
in the absence of transitional support. Concerns
were also raised about the fiscal impact of a drop
in IDA concessional resources and accelerated
repayment of outstanding IDA credits upon
graduation. It was, therefore, agreed that their
graduation would be kept under review, while
consensus was being sought on a transition
support mechanism in upcoming IDA18
discussions.
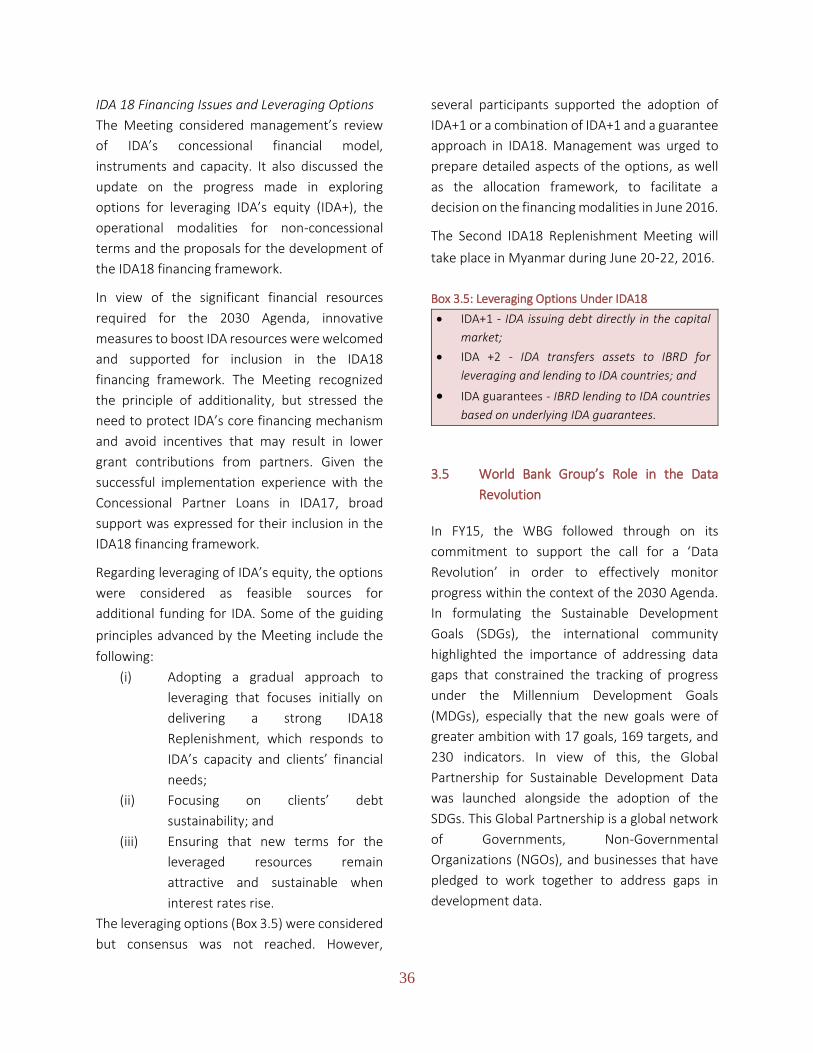
36
IDA 18 Financing Issues and Leveraging Options
The Meeting considered management’s review
of IDA’s concessional financial model,
instruments and capacity. It also discussed the
update on the progress made in exploring
options for leveraging IDA’s equity (IDA+), the
operational modalities for non-concessional
terms and the proposals for the development of
the IDA18 financing framework.
In view of the significant financial resources
required for the 2030 Agenda, innovative
measures to boost IDA resources were welcomed
and supported for inclusion in the IDA18
financing framework. The Meeting recognized
the principle of additionality, but stressed the
need to protect IDA’s core financing mechanism
and avoid incentives that may result in lower
grant contributions from partners. Given the
successful implementation experience with the
Concessional Partner Loans in IDA17, broad
support was expressed for their inclusion in the
IDA18 financing framework.
Regarding leveraging of IDA’s equity, the options
were considered as feasible sources for
additional funding for IDA. Some of the guiding
principles advanced by the Meeting include the
following:
(i) Adopting a gradual approach to
leveraging that focuses initially on
delivering a strong IDA18
Replenishment, which responds to
IDA’s capacity and clients’ financial
needs;
(ii) Focusing on clients’ debt
sustainability; and
(iii) Ensuring that new terms for the
leveraged resources remain
attractive and sustainable when
interest rates rise.
The leveraging options (Box 3.5) were considered
but consensus was not reached. However,
several participants supported the adoption of
IDA+1 or a combination of IDA+1 and a guarantee
approach in IDA18. Management was urged to
prepare detailed aspects of the options, as well
as the allocation framework, to facilitate a
decision on the financing modalities in June 2016.
The Second IDA18 Replenishment Meeting will
take place in Myanmar during June 20-22, 2016.
Box 3.5: Leveraging Options Under IDA18
IDA+1 - IDA issuing debt directly in the capital
market;
IDA +2 - IDA transfers assets to IBRD for
leveraging and lending to IDA countries; and
IDA guarantees - IBRD lending to IDA countries
based on underlying IDA guarantees.
3.5 World Bank Group’s Role in the Data
Revolution
In FY15, the WBG followed through on its
commitment to support the call for a ‘Data
Revolution’ in order to effectively monitor
progress within the context of the 2030 Agenda.
In formulating the Sustainable Development
Goals (SDGs), the international community
highlighted the importance of addressing data
gaps that constrained the tracking of progress
under the Millennium Development Goals
(MDGs), especially that the new goals were of
greater ambition with 17 goals, 169 targets, and
230 indicators. In view of this, the Global
Partnership for Sustainable Development Data
was launched alongside the adoption of the
SDGs. This Global Partnership is a global network
of Governments, Non-Governmental
Organizations (NGOs), and businesses that have
pledged to work together to address gaps in
development data.

37
As one of the Multilateral Development Banks
(MDBs) that form part of this Global Partnership,
the WBG has developed the Strategic Actions
Program to operationalize a long-term
development data strategy (2016-2030). The
objective of this Program is to reduce gaps in
both the quantity and quality of development
data and encourage clients to adopt innovative
methods of data collection that are scalable and
reduce time and cost of production. This Program
is anchored on the Institution’s comparative
advantage in data collection and statistics and
builds on its leadership in a number of data areas.
The Strategic Action Program has been
structured to first lend support in three action
areas, namely Civil Registration and Vital
Statistics (CRVS); price statistics; and household
statistics. This will be followed by action
programs on other areas including population
census, national accounts, and labor and jobs
data. CRVS will involve capturing information on
the population’s vital statistics such as birth,
death, marriage, divorce and adoption, while
support for price statistics will enhance the
record of prices across various markets and
consumer prices to capture the cost of living
accurately. Household surveys qualify in this first
round of action due to their significance in
tracking the dynamics of poverty and income
inequality, which are the core components of the
WBG’s twin goals. A key target that has been set
is to support each of the WBG’s client countries
to have at least one survey conducted every
three years.
Primary innovations under the Strategic Action
Program involve the following: (i) mainstreaming
data requirements into the Systematic Country
Diagnostic (SCD) and the Country Partnership
Framework (CPF); and (ii) scaling up financing. By
mainstreaming data in the country engagement
process, the WBG seeks to elevate the policy
discussion with country authorities around
support to their statistical frameworks and
capacities. This will involve an assessment of a
country’s statistical needs and capacity and how
the WBG could assist within the context of other
competing country needs. The WBG recognizes
that the financial requirements for this Program
are substantial and has therefore committed to
scale up funding in this area. It is estimated that
the three action areas will involve US$1.7 billion
in IBRD/IDA lending during the 15-year period to
2030, with additional administrative costs of
approximately US$150 million. Besides the use of
regular country envelopes, other financing
instruments will be utilized including
Reimbursable Advisory Services (RAS) and Trust
Funds resources. Already, the WBG has
committed to raise US$100 million through a
Trust Fund in support of data innovations.
The WBG seeks to place more effort in countries,
where data gaps are most severe, particularly in
lower income countries. Action plans in other
areas on population census, and labor and jobs
data are expected to be rolled out in FY2017.
Progress in the implementation of the Strategic
Action Program will be monitored through annual
reports by the WBG.
3.6 Climate Change: COP21 and the Africa Climate Business Plan
The international community, including the WBG
and other multilateral development institutions,
acknowledge that addressing climate change is
one of the leading issues relevant to poverty
reduction and development. The international
community agreed to take concerted actions to
address the inherent development challenges
that evolve from climate change. This is captured
in the Agreement of the COP21 to the United
Nations Framework Convention on Climate
Change (UNFCCC) that was held in Paris, from

38
November 30 to December 11, 2015. The
Agreement, signed by the 195 participating
countries, aims to reduce their respective levels
of carbon emissions with the intent to keep
global warming to well below two degrees Celsius
(2oC).
Prior to COP21, the WBG already had a Climate
Change Strategy for Africa that was adopted in
November 2010. This Strategy was based on four
pillars covering adaptation, mitigation, capacity
building and additional financing. It also had a
particular focus on sustainable water resources,
land and forest management, integrated coastal
development, increased agricultural productivity,
better health systems, and conflict and migration
issues.
During the COP21 Conference, a number of side
events were held, including group and bilateral
meetings. In many of these meetings, the WBGs’
on-going and planned work on climate change
was highlighted, including efforts to increase it by
a third to 28 percent of its overall work program
by 2020. Combined with other mobilized
resources, annual climate change funding could
potentially reach US$29.0 billion by 2020. This
support would constitute a robust response
requested by clients to implement their national
plans. Such support would be critical to ensuring
that the WBG’s mission of reducing extreme
poverty and boosting shared prosperity can be
achieved. In its programs, the WBG pledged to
consider mainstreaming climate change across its
strategies and operations in order to deliver
more sustainable results, with a particular focus
on the poor and most vulnerable segments of the
population.
Another highlight was the WBG President’s
presentation of the Bank’s Africa Climate
Business Plan, to African Leaders. The Plan, titled,
“Accelerating Climate-Resilient and Low-Carbon
Development”, calls for the mobilization of about
US$16.0 billion by 2020 and is expected to be
supported by US$5.7 billion from IDA and other
resources dedicated to climate finance, including
private financing. The Plan comprises measures
to boost the resilience of the Continent’s assets
(particularly people, land and water), as well as
the most vulnerable cities and rural communities.
It also includes programs to accelerate the use of
renewable energy, enhance early warning
systems and establish a new Africa Facility for
Climate-Resilient Investment. This Facility
primarily aims to facilitate the integration of
climate change in the planning and design of
infrastructure in Africa. It is expected to be
supported by the African Union Commission
(AUC) and the UN Economic Commission for
Africa (UNECA).
3.7 Brief on the Global Agriculture and Food
Security Program (GAFSP)
The Global Agriculture and Food Security
Program (GAFSP) is a multilateral financing
mechanism that was set up in 2009 by the G20,
with the World Bank as Trustee, to help Low-
Income Countries (LICs) reduce poverty and
improve rural livelihoods and food security. In
this regard, the objective of the Program is to
address the underfunding of country and
regional strategic investment plans in agriculture
and food security.
The focus of the Program is on the following
activities:
(i) Raising agricultural activity and production;
(ii) Linking farmers to markets;
(iii) Reducing risk and vulnerability;
(iv) Improving non-farm rural livelihoods; and
(v) Providing technical assistance for human
and institutional capacity building.

39
Eligibility for GAFSP financing is limited to IDA-
only countries in non-accrual status. Selection of
countries for GAFSP financing is based on the
following criteria:
a) Country Need: In addition to the IDA-only
status, other indicators such as prevalence of
undernourishment and relative levels of
current ODA for agriculture are considered.
b) Country Policy Environment: Countries with
policy environments more conducive to
generating higher investment returns are
given priority.
c) Country Readiness: For African countries,
completion of a Comprehensive Africa
Agriculture Development Programme
(CAADP) post-compact investment plan and
a subsequent CAADP technical review report,
are used to assess the readiness of the
country. For non-African countries the
completion of a comprehensive agricultural
development strategy and investment plan
that has undergone a technical review
covering similar technical aspects as the
CAADP reviews are used to assess readiness.
Since 2011, GAFSP has successfully pooled donor
funds to support these activities through two
windows, the Public Sector Window and the
Private Sector Window.
The Public Sector Window supports technically
sound, country-led plans. Since inception, GAFSP
has executed grants totaling US$1.0 billion
through this Window. Of this amount, US$0.6
billion or 60.0 percent was allocated to Africa,
including to Burundi, Ethiopia, The Gambia,
Kenya, Liberia, Malawi, Rwanda, Sierra Leone,
Tanzania, Uganda and Zambia.
The Private Sector Window, managed by the
International Finance Corporation (IFC), uses
blended finance solutions to support agricultural
projects in developing countries that may not
attract commercial funding due to perceived high
risks in this sector. This window invests largely in
projects that show potential for high
development impact and financial viability.
Specific activities supported through the Private
Sector Window include the strengthening of
smallholder supply chains, storage, agribusiness,
and food and beverages production and
processing. Since inception, the GAFSP Private
Sector Window has executed grants amounting
to US$221.4 million in various countries including
Ethiopia, Tanzania, Malawi, Uganda, Rwanda,
Liberia, and Mozambique.
To qualify for funding under the Private Sector
Window, investment proposals must meet the
following criteria:
1. Be sponsored by private entities in the
agribusiness sector;
2. Be located in eligible countries;
3. Have a minimum project size of US$5 million;
4. Have demonstrated profitability over the last
three years of the project or evidence of
long-term financial sustainability, with
financial capacity to service existing and new
debt;
5. Have high quality management; and
6. Comply with IFC's Environmental & Social
Performance Standards.
The ultimate decision making body of the GAFSP
is its Steering Committee, established in April
2010. The GAFSP Steering Committee ensures
coordination between the two windows. During
the 2015 Joint GAFSP Steering
Committee/Private Sector Window Donor
Committee Meeting (SC/DC), members approved
the proposal to hold the 2016 Meeting in a
beneficiary country to give them an opportunity
to appreciate GAFSP achievements and impacts.
It is in this context that the 2016 Joint GAFSP
Steering Committee and the Private Sector
Window Donor Committee Meeting was held in

40
Kigali-Rwanda during January 25-28, 2016. While
in Kigali, SC/DC members visited the GAFSP
funded projects and engaged directly with
project stakeholders. Furthermore, their
deliberations included the alignment of the
GAFSP monitoring and evaluation system and
performance indicators with the global
agriculture and food security agenda in the SDGs.
3.8 Update on Diversity and Inclusion
As a global organization with staff from more
than 170 countries, the WBG has committed to
foster and strengthen Diversity and Inclusion
(D&I) in its workforce. In August 2015, the World
Bank undertook a recruitment mission to Africa
aimed at increasing the number of SSA staff in its
workforce at level GF+ (professional level and
above) and at building a talent pipeline of SSA
mid to senior level career professionals. From the
mission, 40 candidates have been offered
positions. The World Bank has also committed to
continue with this effort to recruit more Africans
to fill positions in departments with significant
underrepresentation of SSA nationals.
While these efforts are commendable, African
Executive Directors will continue to call upon the
WBG Senior Management to ensure there is
always an adequate pool of Africans both at the
technical and managerial levels across all entities
of the WBG.

41
Woman cultivating crops. Tanzania
Maseru Mazenod Reservoir Pipelines&Villages- Lesotho
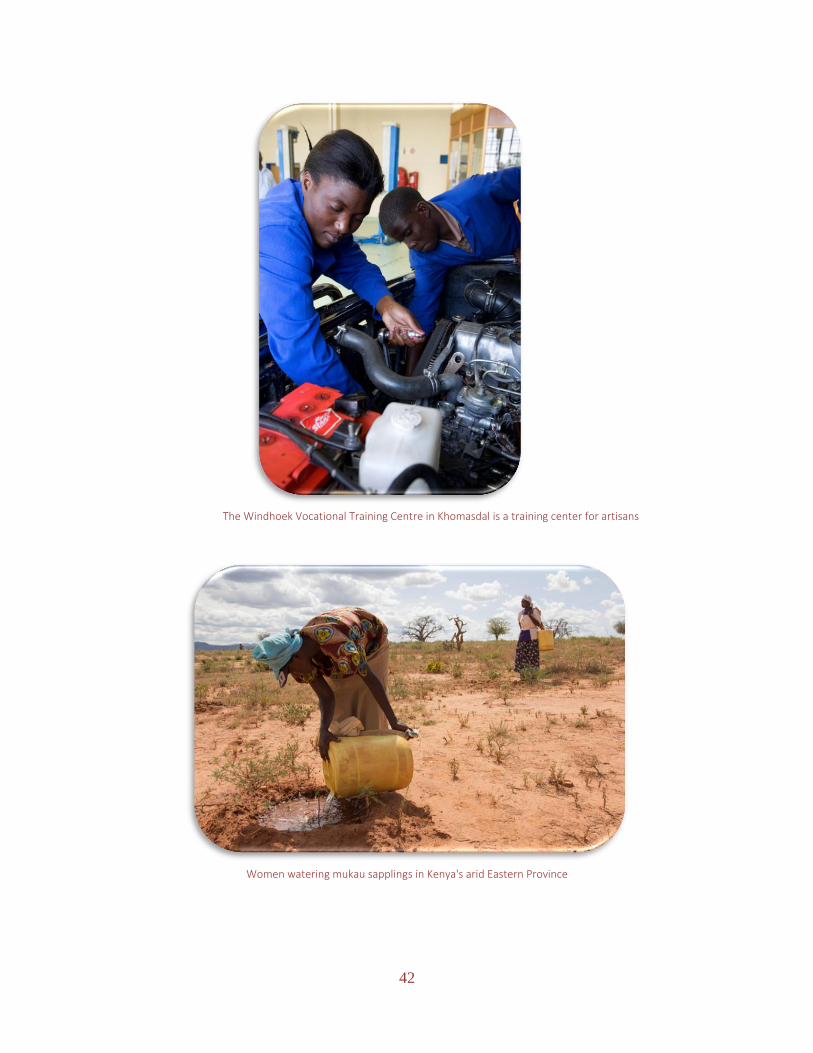
42
The Windhoek Vocational Training Centre in Khomasdal is a training center for artisans
Women watering mukau sapplings in Kenya's arid Eastern Province
Chapter 4
Constituency Issues
Highlights of Statutory Constituency Meeting
Update on Review of the Constituency Rules, Guidelines and Procedures
Update on WBG Reengagement with Republic of Zimbabwe, State of Eritrea, Republic of The Sudan and Federal Republic of Somalia
African Caucus

44
Chapter 4
Constituency Issues
4.1 Overview
This Chapter provides highlights of the Eleventh
Statutory Meeting of the Africa Group 1
Constituency (AFG1) and the African Caucus
Meeting, which were held on the margins of the
2015 Annual Meetings of the World Bank Group
(WBG) and the International Monetary Fund
(IMF).
The Chapter also highlights progress in the
reengagement of the WBG with Constituency
countries where active collaboration had been
suspended. As regards the reengagement of the
State of Eritrea, the Federal Republic of Somalia
and the Republic of The Sudan, these countries
have been grandfathered to follow the Heavily
Indebted Poor Country (HIPC) path. On the other
hand, the Republic of Zimbabwe has adopted a
non-HIPC path to reengagement. Further,
Roundtable conferences are scheduled for the
State of Eritrea, the Federal Republic of Somalia,
and the Republic of The Sudan during the 2016
Spring Meetings of the WBG and IMF.
4.2 Highlights of Eleventh Statutory Meeting
of the Africa Group 1 Constituency
The Africa Group 1 Constituency Rules, Guidelines
and Procedures as approved in 2010, stipulate
that the Constituency shall meet biannually to
deliberate on issues of common interest and map
out modalities for ensuring that these issues are
factored in the broad policy and operational
agenda of the WBG. Accordingly, the
Constituency held its Eleventh Statutory Meeting
on October 8, 2015 in Lima, Peru on the margins
of the 2015 Annual Meetings of the WBG and the
IMF. The following are highlights of the reports
considered, issues discussed and decisions taken.
4.2.1 The FY15 Annual Report of the Executive
Director
The Annual Report of the Executive Director for
Fiscal Year 2015 (FY15) highlighted the global
economic developments and prospects, as well
as the related development challenges in Sub-
Saharan Africa (SSA). It reported on the WBG’s
operational delivery and resource flow to SSA and
updated Governors on selected WBG policies and
programs that were under review in the course
of FY15. The Report also highlighted the
Executive Director’s Constituency outreach
activities.
Governors welcomed the Executive Director’s
Report and appreciated its comprehensiveness.
They noted the bleak global economic outlook
and acknowledged the adverse impact of
declining commodity prices on the fiscal and
external accounts of the commodity exporting
countries. They noted the uncertainty in the
flows of Official Development Assistance (ODA)
and urged the International Financial Institutions
(IFIs) to accelerate implementation of the
‘Billions to Trillions’ initiative, and to increase
support for enhanced Domestic Resource
Mobilization (DRM) and stemming Illicit Financial
Flows (IFFs).

45
Governors further welcomed the increased flow
of resources from the WBG to SSA in FY15. While
noting the increase in IFC commitments and
MIGA guarantees to the SSA region, Governors
called for a scale up of their operations, especially
in the Low-Income Countries (LICs).
Governors welcomed the roundtable meeting for
the reengagement of the Republic of Zimbabwe
that was held on October 8, 2015 in Lima, Peru.
While urging the Office of the Executive Director
to continue to advocate for arrears clearance for
the State of Eritrea, Federal Republic of Somalia
and the Republic of The Sudan, they specifically
requested for a time bound approach to the
processes for these three countries.
Governors appreciated the continued advocacy
by the Office of the Executive Director for support
to countries facing natural disasters arising from
climate change. They noted and welcomed that
the Office remained engaged with Management
on the need for a Strategy for Middle Income
Countries (MICs) and Small Island Developing
States (SIDS).
Regarding an update on the second draft of the
Environmental and Social Safeguards Framework
(ESSF), Governors noted the remaining
contentious issues and welcomed the
opportunity to discuss them during the third
phase of global consultations in 2016, including in
our Constituency countries. They encouraged
member countries to strongly advocate against
the inclusion of policies that are inconsistent with
African values and culture in the framework and
urged for the right balance in capturing the
terminology on Indigenous Peoples.
Governors welcomed the Executive Board’s
approval of the World Bank Procurement
Framework in July 2015 and appreciated the
greater focus on the use of country systems. They
also noted that the Global Infrastructure Facility
(GIF), which was set up to facilitate the
preparation and structuring of complex
infrastructure projects was operational.
Governors welcomed the update on the World
Bank Group Shareholding Review that includes
the design of the guiding principles and the
dynamic formula that would guide future
reviews. They noted the upcoming deadlines of
2016 and 2017 to meet obligations on the IBRD
Selective Capital Increase (SCI) subscription
based on the 2010 agreement. Governors
welcomed the progress on the promotion of
diversity in the WBG, in particular the ongoing
staff recruitment drive in Africa. However, they
stressed the need to continue advocating for
increased representation of Africans in the
management ranks of the Institution.
Governors appreciated the update on
preparations for the IDA17 Mid-Term Review and
the upcoming IDA18 Replenishment. They noted
the proposed actions aimed at increasing
resources under IDA17 and IDA18.
Governors also welcomed the proposed WBG’s
support for the 2030 Agenda for the Sustainable
Development Goals (SDGs) and the new
operating model, which will entail stronger
partnerships with other development
institutions, leveraging concessional and non-
concessional finance, support for strengthening
DRM and assistance in crowding-in private sector
resources. They also welcomed the focus on
regional opportunities and challenges, combating
the effects of climate change and catalyzing the
development data revolution.
Governors welcomed the highlights of the
findings of the Global Monitoring Report (GMR)
2015/16: Development Goals in an Era of
Demographic Changes. They noted the uneven
progress on the MDGs and acknowledged the
three key challenges, namely: (i) deep level of

46
poverty, especially in SSA and South Asia (SA)
regions; (ii) uneven shared prosperity; and (iii)
the persistent disparities in non-income
dimension of development. They also welcomed
the recommendation that responses to
demographic change would require sound
policies to sustain broad based growth, invest in
people, and insure the poor and vulnerable
against sudden and emerging risk.
4.2.2 Consideration of the Constituency
Statement to the Development
Committee
Governors appreciated the work of the
Development Committee (DC) Member
Committee and endorsed the proposed DC
Member’s Statement for the Constituency (see
Annex 2). The Statement articulated the position
of the Constituency on the Role of the WBG and
IMF in the implementation of the 2030 Agenda
for Sustainable Development; the GMR
2015/2016; WBG Support for Crisis Prevention,
Preparedness and Response; and the 2015
Shareholding Review. The Statement also
covered recurring development issues on
Diversity and Inclusion, support to Africa’s MICs
and SIDS, debt relief, and the WBG’s
Environmental and Social Safeguards Policies.
4.3 Update on Review of the Constituency
Rules, Guidelines and Procedures
The Constituency Panel has held two meetings
following a mandate given to it at the
Constituency Meeting in April 2015 in
Washington DC, USA to undertake the First
Statutory Review of the Constituency Rules,
Guidelines and Procedures. The Panel held its
inception meeting in Addis Ababa, Federal
Democratic Republic of Ethiopia, in July, 2015. At
that meeting, the Panel considered the Executive
Director’s “Report on the 2010 – 2015
Assessment of the Rules, Issues and Proposals for
the 2015 Review”. The Panel held a follow up
meeting in Lima, Peru, in October, 2015 to
deliberate and finalize the “Panel’s Report on the
Review of the Constituency Rules, Guidelines and
Procedures.
The Panel’s Report provides a detailed
assessment of the implementation of the Rules in
the last five years, highlights the issues that the
Panel has considered for review, and provides
details on the assessment and reasoning
underpinning the proposed recommendations.
Overall, the Panel finds that the Rules have
served the Constituency well over the five years
of implementation. The provisions and rotation
system have been applied fairly and have
accorded countries an equal opportunity to serve
the Constituency in all the governing bodies. The
Panel further observed that there was still room
for improvement to foster effectiveness in the
representation of the Constituency. The Panel
therefore proposed to maintain the areas where
there was consensus that no change was needed
and recommended changes to improve the areas
where it felt there was need for improvement.
Following the discussion of the Report at the
Constituency Meeting in Lima in October 2015, it,
was circulated to all Constituency Members for
consultations in December 2015. Governors were
invited to provide inputs and comments or no
objections to the Panel’s recommendations
through the Office of the Executive Director for
consolidation by end-March 2016.
In view of the consultation process, which was
extended to end-March 2016 from end-January
2016, the Panel revised the timeline for
completing the Review. The Panel will reconvene
during the 2016 Spring Meetings of the WBG and
47
IMF to consolidate the submissions, deliberate
and prepare the final Report and Revised Rules.
4.4 Update on WBG Reengagement with the
State of Eritrea, Federal Republic of
Somalia, Republic of The Sudan and
Republic of Zimbabwe
The Office of the Executive Director, in FY16,
continued to advocate for the reengagement of
the WBG in Constituency countries where active
collaboration had been suspended. This section
provides an update on the process in each of
these countries.
Eritrea, Somalia and Sudan have been
grandfathered to follow the HIPC path to
reengagement, while Zimbabwe has adopted a
non-HIPC path. Progress among these countries
remains uneven, with significant progress
registered in the case of Zimbabwe.
Reengagement of these countries is contingent
upon arrears clearance. At that point countries
would have access to regular IDA allocations.
Based on meeting additional eligibility
requirements, they could be granted exceptional
support under the Turn-Around Regime7 (TAR).
State of Eritrea
Through a joint initiative, the WBG, IMF, African
Development Bank (AfDB), United Nations
Development Programme (UNDP) and the
Government of Eritrea, produced an updated
country brief in December 2015. Further, the IMF
undertook a fact-finding mission to Eritrea in
February 2016, which laid the ground for further
engagement. In this same month, the Executive
Director undertook an official mission to Eritrea,
during which he exchanged views with the
authorities on how relations with the WBG could
7 The Turnaround Regime provides additional financing for IDA countries that are emerging from fragility and have committed to a strong program of reforms.
be enhanced. A Roundtable conference is
scheduled to be held on the margins of the 2016
Spring Meetings of the WBG and IMF.
Eritrea has retained its notional regular IDA
allocation under IDA17 due to recent arrears
accumulation. The country has been
grandfathered under the HIPC Initiative and
currently at pre-decision point status. Following
its track record in the HIPC process, the notional
allocation could be deployed to resolve the non-
accrual status of Eritrea. Eritrea is however not
eligible to access arrears clearance under the IDA
17 framework.
Federal Republic of Somalia
Progress on Somalia’s reengagement has been
very slow mainly because of the challenges of the
security situation. While the WBG welcomed
back Somalia as an active member, it remains
ineligible for financial assistance pending the
clearance of its longstanding arrears. A
Roundtable Conference for Somalia will be held
during the 2016 Spring Meetings of the WBG and
IMF, which will among other issues, discuss the
arrears clearance strategy for the country and a
roadmap to kick start the process of full
reengagement with the WBG. This conference
comes at the instance of the WBG, IMF, and other
development partners including DFID.
Republic of The Sudan
Some progress has been registered in the re-
engagement with the Republic of the Sudan.
Specifically, progress has been achieved in
getting IFC to support the private sector in Sudan.
Since the 2015 Annual Meetings, there have been
exchange visits between the IFC and a
consortium of private sector representatives of
Sudan. Going forward, the Office of the Executive

48
Director will continue to work on improving WBG
relations with Sudan beyond the Bank managed
Multi-Donor Trust Funds and interventions they
support. It will also leverage on the positive
indications from some major bilateral donors for
possible support of the initiatives to reengage
with the Republic of Sudan. It is in this vein that a
roundtable meeting has been organized for the
Republic of Sudan during the 2016 Spring
Meetings of the WBG and IMF.
Republic of Zimbabwe
Strong strides have been made in Zimbabwe’s
reengagement with the WBG. As reported during
the Eleventh Statutory Constituency Meeting, the
Quadripartite Committee on Zimbabwe
comprising representatives from the
Zimbabwean Government, WBG, IMF and AfDB
held a Roundtable Conference in October 2015
with other development partners during which
the Lima Strategy, was tabled and agreed. This
Strategy lays down the roadmap for clearance of
arrears with the three IFIs and for undertaking
comprehensive economic reforms that would
grow the economy. This Roadmap does not
involve a typical HIPC initiative path for arrears
clearance, and as such will not use IDA resources
under the set-aside window. Zimbabwe will
become eligible for regular IDA Performance
Based Allocation (PBA) upon clearance of arrears.
According to the IMF Staff Monitored Program
(SMP) review and the Article IV consultations
held in March 2016, Zimbabwe successfully met
all the quantitative targets and structural
benchmarks. It is envisaged that an IMF-funded
program will follow the discussion of the Staff
Mission Report by the IMF Board of
Executive Directors in May, 2016. Accordingly,
this would signal the formal start of the process
of clearing arrears, which will eventually lead to
debt negotiations at the Paris Club. Meanwhile
the IFC will reengage with the private sector in
Zimbabwe to support the reform process. It is
expected that the first projects for funding will
come to the WBG Board around the time the IMF
Board discusses the two Staff Reports.
4.5 African Caucus Update
On the margins of the 2015 Annual Meetings of
the WBG and the IMF, African Governors
endorsed His Excellency Mr. Lionel Zinsou, Prime
Minister of Benin, as Chairman of the African
Caucus and Honorable Kenneth Matambo,
Minister of Finance, Botswana, as Deputy
Chairman. His Excellency Zinsou took over from
Honorable Armando Manuel, Minister of Finance
for Angola.
Governors also used the occasion to present their
2015 Memorandum to the Managing Director of
the IMF, Ms. Christine Lagarde, and the President
of the WBG, Dr. Jim Yong Kim. Specific to the
WBG, the issues raised in the Memorandum
were: (i) Financing For Sustainable Development
(ii) Stemming Illicit Financial Flows (IFF); (iii)
Investing in Economic Transformation and
Diversification; (iv) Financing Regional
Transformative Infrastructure Projects; and (v)
Enhancing African Voice and Representation.
The WBG President’s response to the Governors’
Memorandum is contained in Annex 6. Among
other responses, the WBG committed to explore
innovative modalities to enhance its capacity
meet the demand for greater volumes of all types
of financing to support the SDGs. As regards the
stemming of IFF, the WBG President noted that
the WBG was pooling the different strands of its
multidisciplinary work into a cohesive IFF
program to cover administration, money
laundering, asset recovery, good governance and
accountability, procurement, and management
of extractives. As regards economic
49
transformation and diversification, the WBG
committed to step up investments in
infrastructure, especially energy, providing
support along value chains and focusing on
education, including science, technology,
engineering and mathematics.
The next planned engagement will be the African
Consultative Group (ACG) Meeting, which shall
be held in Washington DC on the margins of the
2016 Spring Meetings of the WBG and IMF.
50
Handcraft – Botswana
Zambeef - Zambia

Annexes
IFC Operations in Africa Group 1 Constituency
Joint Statement by IDA Borrowers’ Representatives
Development Committee Member Statement
Development Committee Communiqué
African Governors’ Caucus 2015 – Luanda Declaration
WBG President’s Response to African Governors
Rotation Schedule for Constituency Chairperson
Rotation Schedule for the Constituency Panel
Rotation Schedule for Constituency Representation on the Development Committee
Rotation Schedule for Executive Director and Alternate Executive Director

52
Annexes Annex 1: IFC Operations in AFG1 - First Half FY16
Country Approvals* US$ Million
Commitments** US$ Million
Disbursements** US$ Million
Botswana 0 0 0
Burundi 0 2.0 0
Eritrea 0 0 0
Ethiopia 0 100 89.3
Gambia 0 3.5 0
Kenya 163.2 230.6 98.9
Lesotho 0 0 0
Liberia 0 9.6 0.5
Malawi 0 7.8 0
Mozambique 86.3 0 2.3
Namibia 69.0 69.0 65.8
Rwanda 18.4 69.3 16
Seychelles 0 0 0
Sierra Leone 0 4.4 0
Somalia 0 0 0
South Sudan 0 0 0
Sudan 0 0 0
Swaziland 0 0 0
Tanzania 0 62.0 28.9
Uganda 0 3.5 34.0
Zambia 25.3 0.3 20.2
Zimbabwe 0 0 0
Total 362.2 562 355.9
Source: IFC
Notes
* Does not include regional projects
**Includes Short-Term Trade, and excludes regional projects

53
Annex 2: Joint Statement by IDA Borrowers’ Representatives at the First IDA18 Replenishment Meeting
IDA 18 Replenishment – First Meeting Joint Statement by IDA Borrowers’ Representatives for
Sub-Saharan Africa, East Asia Pacific, Europe and Central Asia, Latin America and Caribbean, Middle East and North Africa and South Asia
March 14-15, 2016 Paris, France Preamble 1. We welcome the IDA reforms in the areas of governance, financial sustainability, and results. The resultant co-chairing arrangement, enhanced borrower representation, concrete proposals on IDA leveraging options and a reinforced result management system for IDA, are very much appreciated. We commend the IDA Deputies – in particular, the co-chairs of the IDA17 Working Groups on Governance; Long-Term Vision and Financial Sustainability; and Results for these outcomes. We also commend the World Bank senior management and staff for the preparatory work and quality of the background materials for this first IDA 18 Replenishment Meeting. We are grateful to the Government of France for the excellent facilities and for hosting this Meeting.
IDA 18 Replenishment and the New Development Landscape 2. Following the paradigm shifts occasioned by the recently agreed upon global goals – Sustainable Development Goals, COP21 Climate Agreement, Sendai Framework, Addis Ababa Action Agenda, and the World Bank Group twin goals – this IDA 18 Replenishment presents development partners the first opportunity to make concrete their commitments for intensified, synergistic financing solutions to unlock, multiply and catalyze flows across all sources of finance to achieve these goals. As representatives of borrowing countries, we reaffirm our trust in IDA, as a uniquely suited aid delivery channel. IDA is and should therefore continue to be the primary concessional development finance instrumentality for assisting poor and vulnerable developing countries to achieve these global goals.
3. This early on the path to 2030, client countries are already experiencing severe development challenges leading to rising demand for additional resources primarily on concessional, but also on non-concessional terms. While our countries are committed to ramp up policy and institutional reforms and make investments to pursue the global goals, they simultaneously face the task of dealing with prevailing huge economic headwinds, including declining commodity prices, weaker capital flows, in certain cases severe currency devaluation and subdued global trade. Demand is also particularly elevated for support for the now more frequent, severe adverse events, and rising unemployment, especially of youths associated with climate related disasters, pandemics, forced displacement, terrorism, conflict and violence, which all undermine hard-won gains in poverty reduction and development. Development partners cannot, therefore, afford to miss this opportunity of providing clients timely access to direly needed resources at this crucial juncture. The highlighted current developments also make this an urgent imperative. We do recognize that many donor countries are facing fiscal challenges, which exert pressure on their development assistance budget. We sincerely hope that despite these difficulties, the commitment to shared responsibility and the support for multilateralism will spur partners to sustain their engagement with and bolster funding of IDA with grant resources to address the development needs of the poor and most vulnerable.
IDA18 Strategic Directions 4. We welcome that IDA is repositioning to remain fit–for-purpose while maintaining its competitive edge as the premier conduit for delivering development finance and expertise. The overarching theme of “Investing in growth, resilience and opportunity” for IDA18 is apt. With the important unfinished agenda in IDA17, we welcome the focus of the special themes on climate resilient development; fragility, conflict, violence and forced displacement; gender equality; and economic transformation and jobs. We urge for selective, bold and concrete interventions and policy commitments by IDA across these themes to deepen work in these areas and to enable countries move steadily on the path to attaining the global goals. To this effect, we expect that strong attention is accorded to economic transformation, prioritizing infrastructure, especially energy and transport and agricultural value chains, including those investments that maximize climate resilience and promote leap frog technologies with job creation and food security potentials. A cross-cutting focus on development of human capital across these themes is needed to leverage on the demographic dividend in the client countries. In this context it is crucial for IDA to scale up support to higher education and vocational training, in particular, to ensure that adequate relevant skills are available to meet the demand for skilled labor. The global public good agenda, including in the areas of health and environment, remain important in the effort to tackle global poverty and IDA must be in a position to take on a strategic role in this area. We therefore support a results measurement system that aims to clearly track delivery in these respective areas, through collaborative assistance with client countries.
54
IDA 18 Financing Framework 5. Delivering on these ambitious agenda in the face of rising demands from an evolving client structure would require a strong IDA 18 replenishment. The innovations being advanced for the IDA 18 replenishment are, therefore, steps in the right direction. As we innovate, however, we stress the importance of preserving IDA’s brand, as a premier provider of concessional finance, and its mandate to deliver development assistance to poorest and most vulnerable. While building the base for non-concessional finance, IDA should be ensuring adequate targeted concessionality, managing substitution risk, while seeking additionality and financial viability.
6. The update on the options for leveraging IDA’s equity through either (i) the interim IDA guarantee for IBRD lending to IDA countries, (ii) IDA+1, or (iii) IDA+2 are most welcomed. We welcome the feasibility of deploying an appropriate combination of these options beginning in IDA18 as supported by the assessment of the Bank’s Chief Risk Officer and the Rating Agencies. We urge that deliberations of these options be guided by the principles of guarding against substitution risks and avoid politically complex approaches that may delay the adoption of the leveraging instruments. We expect that all outstanding information to support full assessment of the respective combination of approaches would be available by the second IDA 18 Replenishment Meeting.
7. Beyond the traditional partner contributions and leveraging options, IDA could continue modalities of collaborating with wealthy, non-profit foundations and other social impact investors, including social hedge funds. Efforts must be made to advance the private donations and encourage IDA participation and continue the concessional partner loans mechanism. These efforts will assist in transforming IDA into a genuine global partnership.
IDA’s Graduation Policy 8. We welcome the update on IDA’s graduation policy. Graduation from IDA is an achievement by countries on their path towards economic and social development. Graduation however is a continuum with risk of reversal. To ensure a successful and lasting exit from IDA, structured transition support mechanism is needed. This is imperative in the prevailing circumstances when potential graduates are faced with the fiscal responsibility of not only meeting accelerated prepayments to IDA, but have to also contend with deteriorating external environment combined with the continuing significant pockets of extreme poverty. It is deeply discouraging that at present, the availability of IBRD resources does not meet the financing needs of all potential IDA graduates. IDA, together with IBRD, therefore need to address the financing gap that countries transitioning out of IDA face in order to guard against reverse-graduation, close the substantial dip in access to development finance in the immediate years after graduation (“graduation cliff”) and sustain the development achievements. In this context, we support to maintain a flexible graduation policy. We also support no change to the GNI per capita cut-off, and the establishment of a transition support mechanism for the potential graduates in IDA18.
Optimizing one WBG synergy 9. Beyond the leveraging of IDA’s own equity, we reiterate our call for the World Bank Group to optimize the synergy potentials within the IBRD, IDA, IFC and MIGA so as to deliver fully on the resources available in both the non-concessional and concessional windows for its clients. Complementary support, through WBG transfers to IDA, must be sustained to show our collective commitment to the mission of IDA in the poorest countries. We trust that genuine pursuit of the one World Bank Group value proposition will be catalytic in leveraging public and private investments to create jobs, promote gender equality, build much needed infrastructure, build resilience to natural and climate change disasters and diversify the economies of our countries.
10. In closing, IDA’s clients face an unforeseen deterioration in the development land scape that put at risk the gains registered thus far. It is therefore imperative that IDA is fit-for-purpose and of a commensurate size to urgently respond to increasing and pressing clients’ needs. Given the urgency, and the call for additionality and not substitution, we look forward to a constructive exchange with the IDA Deputies at this first meeting as we set the stage for a robust IDA 18 Replenishment in 2016.

55
Annex 3: Development Committee Member Statement – October 2015
92nd Meeting of the Development Committee
World Bank Group/IMF Annual Meetings October 10, 2015
Lima Peru
Honorable Patrick A. Chinamasa, M.P. Minister of Finance and Economic Development,
Republic of Zimbabwe
1. Introduction The year 2015 stands as historical landmark in the timeline of development, as we transition from the Millennium Development Goals (MDGs) to the Sustainable Development Goals (SDGs). Despite an outlook of robust growth in Sub-Saharan Africa (SSA), several dynamics will either aid or disrupt our ability to attain the SDGs and complete the unfinished business of the MDGs. Factors considered helpful include effective macroeconomic management, discoveries of natural resources and their prudent management, enhanced governance, increased participation and innovation of the private sector and a vision and commitment of African leaders to transform the Continent and reduce poverty. Further, enhanced trade and regional integration and South-South cooperation are expected to also contribute in the pursuit of our development aspirations. However, the region may have to contend with various disruptive factors including lack of fair trade opportunities, increased leakages of resources through illicit financial flows (IFFs), energy shortages, infrastructure inadequacies and intensified climate change and related vulnerabilities, high unemployment and a youthful demographic profile amidst limited educational and training opportunities, amongst other factors.
Currently, the region faces serious external head winds that risk reversing recent gains. Slower growth in emerging market economies, and the concomitant fall in commodity prices, ranging from oil, metal to agro-related products, and the strengthening of the U.S. dollar have put our revenues and currencies under severe strain, compromising critical fiscal expenditures. Collectively, these contemporary and medium term challenges constrain our ability to improve and sustain economic performance, raise the living standards of our people, attain the SDGs and complete the unfinished agenda of the MDGs. Hence, close collaboration with our development partners will remain essential to secure the financial and technical support necessary to attain these goals.
2. The Role of the World Bank Group (WBG) and International Monetary Fund (IMF) in Supporting the Implementation of the 2030 Agenda for Sustainable Development (The 2030 SDGs Agenda)
The 2030 SDGs Agenda remains ambitious; however, we believe that success can be realized by capitalizing on the lessons learnt from the experience of the MDGs and adopting the right approach with sustained commitment from all stakeholders. We note the endeavor to fine-tune the core operations of the WBG and the IMF to suit the changing environment that will define the post-2015 era, as articulated in the documents on the role these institutions can play in the pursuit of the SDGs.
We welcome the leading role that the two institutions have taken to elevate the dialogue on international tax issues and introduce new analytical tools to assess the fiscal trade-offs associated with robust infrastructure spending. We, however, call on both institutions to strengthen collaboration in areas where their mandates are complimentary. These include translating the “billions to trillions” agenda into actions, establishing specialized products to assist countries diversify their economies, and enhancing the tax effort in developing countries. In addition, we call on the two institutions to embrace the recommendations of the African Union (AU)/United Nations Economic Commission for Africa (UNECA) report on IFFs and to work with the UN and other development partners towards curbing these outflows with urgency. Relatedly, we note that uplifting the poor will, among other things, require SSA to increase its share in global trade and mitigate the effects of global warming. As such, we call on the WBG and IMF to assist countries improve their competitiveness to gain access to larger markets and to build and strengthen their Global Warning Systems to Africa on global and regional dynamics. Finally, we call for greater
56
assistance in building the statistical capacities of our countries to ensure the generation of accurate, good quality data to measure progress.
3. Global Monitoring Report 2015/2016 - Development Goals in an Era of Demographic Change
We welcome the 2015 Global Monitoring Report (GMR) and take note of the alignment of the WBG’s twin goals with the SDGs and the need for multi-dimensional approaches to complete the MDGs’ unfinished agenda. Significant progress has been made in meeting the MDGs globally, though this masks lags in different regions, including SSA where income and non-income poverty remain prevalent. Additionally, projections indicate that by 2030 the world poorest will be concentrated in the region’s natural resource-based countries and fragile and conflict-affected states (FCS). We, therefore, urge the WBG to ensure that analyses of the unfinished agenda and the demographic structure for each country are captured in the Systemic Country Diagnostics (SCD) to inform policy advice and the Country Partnership Framework (CPF).
4. World Bank Support for Crisis Prevention, Preparedness and Response
With its multiple challenges, including frequent humanitarian and other poverty-inducing crisis, which constitute a threat to sustainable development, SSA as a region is faced with compelling and competing priorities. The Ebola crisis that affected Guinea, Liberia and Sierra Leone is still fresh in our minds, as the challenge of dealing with it largely remains an unfinished business. We, therefore, cannot overemphasize the need for well-integrated multi-sectoral approaches and innovative financing modalities to mitigate the threat from crises and emergencies.
In this regard, we urge the WBG to fast-track the establishment of the Pandemic Emergency Facility (PEF), which was proposed as an instrument to provide rapid support to countries and other entities during the outbreak of pandemics in the future. Similarly, we reiterate our call for the WBG to deliver on its promises related to the actualization of the Marshall Plan, which the Ebola-affected countries need to complete the post-Ebola recovery as well as for their economic development. More generally, the WBG needs to allocate more resources, enhance and fast-track support to help our countries manage natural risks, including droughts and floods, as well as to ensure food security – here, we would like to draw the WBG’s urgent attention to the recent flood that has devastated Sierra Leone and impaired the country’s efforts to get out of crises. In the same vein, we call on the WBG to strengthen its partnership with the relevant UN agencies to help overcome security challenges that some of our countries are confronted with at the moment.
5. The 2015 Shareholding Review
It has been 13 years since the Monterrey Consensus (MC) was put out, calling for enhanced participation of Developing and Transition Countries (DTCs) in the decision-making structures of the WBG and the IMF. In this context, while we welcome the progress thus far and agree with the importance of regular shareholding reviews for the legitimacy of the WBG, we need not lose focus on the original objective of the MC. Therefore, we reiterate that the 2015 shareholding review needs to aim to achieve the original objective of the MC and ensure that no developing country faces dilution of their shareholding in voice and representation.
6. Other Recurring Development Issues
Diversity and Inclusion: We take note of the on-going efforts by the WBG to improve and meet the diversity targets set for SSA nationals. In particular, we welcome the D&I Compact, the diversity talent desk, modifications to the Young Professionals Program and the recruitment drive in SSA. While applauding these efforts, we urge Management to ensure that gains are sustained and improved in terms of the SSA staff strength both at the technical and managerial levels across all the WBG entities.
Support to Africa’s Middle Income Countries (MICs) and Small Island Developing States (SIDS): We regret the delay by the WBG to articulate an appropriate strategy tailored to the needs of the Middle Income Countries (MICs) of SSA, despite our repeated calls. We ask the WBG to consider this as an urgent matter and deliver the required instruments, through a constructive engagement process with the concerned countries. Likewise, while we appreciate the WBG’s role in promoting the Small States Forum and the establishment of the Small Islands States Resilience Initiative, we urge Management to ensure the roll out of this Initiative and use WBG’s convening power to mobilize adequate funding to help these states tackle threats borne out of climate change.

57
Debt Relief: We welcome the efforts by the WBG to reengage with the Republic of Zimbabwe and to resolve its debt burden. We urge the WBG to expedite this process. At the same time, we are frustrated with the continued delays by the WBG and other development partners to complete the debt resolution of other heavily indebted countries namely, the State of Eritrea, Federal Republic of Somalia, Republic of The Sudan and Republic of South Sudan. The debt burden and other challenges seriously undermined these countries’ efforts to meet the MDGs and will limit their chances to achieve the SDGs. We, therefore, reiterate our call for the WBG to champion the debt relief effort for these countries using the set aside provisions in the IDA17.
WBG’s Environmental and Social Safeguards Policies: We recognize and remain supportive of the ultimate objectives of the WBG’s Environmental and Social Safeguards Policies, which aim to protect the people and the environment. However, we are deeply concerned that the proposed second draft that is out for consultation, as part of the ongoing review exercise, did not take into account the views and suggestions provided earlier by our countries at various occasions including during the African Caucus Meeting held in September 2014 in Khartoum, Sudan. Our concern in this regard mainly relates to the use of the terminology ’Indigenous Peoples,’ which remains unacceptable to us. This terminology contradicts with the provisions of our countries’ national constitutions and undermines the strenuous efforts and progress made in promoting social cohesion and unity among our peoples. It also has the potential to create strife among our citizens. We, therefore, urge the WBG to consider our views and come up with universally acceptable terminology.
7. Conclusion
African countries have made appreciable efforts to attain the MDGs with mixed results. However, much remains to be done to achieve inclusive, equitable and sustainable development. We remain committed to tackling poverty and inequality, providing productive employment and empowering our women as well as addressing challenges associated with the fast growing population of the youth in Africa. We also reaffirm our commitment to continuing our efforts on domestic resource mobilization. In the same vein, we reiterate our call for innovative (long-term, non-traditional) financing mechanisms and quality and predictability of external financing, which are necessary for economic transformation and achieving the 2030 SDGs Agenda.
58
Annex 4: Development Committee Communiqué – October 2015
DEVELOPMENT COMMITTEE
JOINT MINISTERIAL COMMITTEE OF THE
BOARDS OF GOVERNORS OF THE BANK AND THE FUND ON THE
TRANSFER OF REAL RESOURCES TO DEVELOPING COUNTRIES
Lima, Peru, October 10, 2015
1. The Development Committee met today, October 10, 2015, in Lima.
2. Global growth remains weak, and the downside risks for the second half of 2015 and 2016 have risen. A moderate recovery in high-income countries is still continuing, but prospects of tighter financing conditions, slowing trade, and renewed weakness in commodity prices are weighing on confidence in many developing countries. We call on the World Bank Group (WBG) and the International Monetary Fund (IMF) to monitor risks and vulnerabilities closely, to enhance their assistance to countries to support growth and build resilience, and to play their countercyclical role when needed.
3. Given the scale of the current refugee and migrant crisis, we call for targeted support, in collaboration with the UN and other partners, in addressing the challenges for countries and regions in turmoil, especially in the Middle East and North Africa, but also in other fragile and conflict states.
4. The Sustainable Development Goals (SDGs) chart a new course for development for the next 15 years. The SDGs are universal, integrated, and align with the WBG’s corporate goals. Building on the Billions to Trillions discussion at the last Spring Meetings we endorse the WBG’s role and support for the 2030 Agenda for Sustainable Development. This will involve convening, connecting and coordinating with governments, UN, IMF, MDBs, and the WTO, private sector and civil society to mobilize the financing needed; deliver development solutions at country, regional, and global levels, including through South-South cooperation. We stress the need to focus on inclusive growth, jobs, infrastructure, human development and health systems, and to deepen the WBG’s engagement in fragile and conflict states. Private sector development is crucial to achieving the SDGs. We call on the IFC and MIGA to play a more catalytic role to mobilize private sector investment and finance for development. We welcome the steps the WBG has taken to enhance its effectiveness and delivery to respond to strong demand, through operational reforms and optimizing the use of its balance sheets and external resources. We recognize that the WBG must remain adequately resourced to meet its goals and to contribute to the SDGs and climate agendas.
5. IDA remains a critical tool to achieve the WBG’s goals and the SDGs and we look forward to continued strong IDA replenishments and further consideration of options to generate additional IDA financial capacity while ensuring continued focus on the poorest countries.
6. We welcome the IMF’s support for the 2030 Agenda, including its decision to increase access to concessional lending facilities, and its work to boost economic resilience and sustain global economic and financial stability.
7. We urge the WBG and the IMF to scale up their support to developing countries to improve domestic resource mobilization, public financial management and to curb illicit finance. Illicit finance and the underlying activities, including tax evasion, corruption, criminal activities, collusion, represent a major drain on the resources of developing countries. We welcome their plans to work jointly to build capacity for developing countries, including on international tax issues.
8. Climate change and natural disasters put hard-earned development gains at risk, particularly for the poor and vulnerable. Smart policy and investment choices can help transition to economic growth paths that reduce poverty while preserving the environment. We urge the WBG to scale up its technical and financial support and mobilize resources to assist countries in assessing climate risks and opportunities, to address the drivers of climate change, and to build resilience. We look forward to an updated report on Disaster Risk Management in Spring 2016. We

59
call on the WBG to enhance its support for small states in building resilience against and mitigating the impact of natural disasters and climate change, which are among the greatest challenges faced by these countries. We look forward to a successful COP21 meeting in Paris.
9. We reaffirm our commitment to gender equality, critical to ending poverty, boosting shared prosperity, and building more inclusive societies. We look forward to the implementation of a new WBG gender strategy aimed at closing persistent gender gaps.
10. The Global Monitoring Report has proven its value in tracking progress in achieving the MDGs and we are confident it will play a similar role for the SDGs. The latest GMR shows that changes in global demography will profoundly affect the trajectory of global development during the 2030 Agenda period. With the right policies, demographic change can help growth both in developing and developed economies. We urge the WBG to take demographic challenges into account in its work to support development policies.
11. We stress the importance of strengthening data quality and coverage, and its availability for policy making and for monitoring and implementing the SDGs. We call on the WBG and the IMF to increase their support to developing countries in building national data capacity and investing in evidence.
12. We welcome the Report of the 2015 Shareholding Review and agree to the shareholding review principles and the Roadmap for its implementation, including further consideration of the WBG’s long term role. We commit to implementing the Roadmap, including agreement on a dynamic formula by the 2016 Annual Meetings, based on the guidance set out in the report. We stress the critical importance of wider reforms to strengthen WBG responsiveness to its members and their voice and representation in its governance. We will continue to promote diversity and inclusion to reflect better the global nature of the WBG.
13. Delivering transformative development solutions requires a focus on results, support for implementation, and fiduciary and safeguards policies to manage risks. This will ensure responsiveness to client needs and deliver sustainable development outcomes. We welcome the new procurement framework approved in July 2015 and look forward to successful completion of the review and update of the World Bank's environmental and social framework.
14. The Committee expressed its appreciation to the Government of the Republic of Peru for hosting the Annual Meetings. We thanked Mr. Marek Belka, President of the National Bank of Poland, for his valuable and outstanding leadership and guidance as Chairman of the Committee during the past four years, and welcomed his successor, Mr. Bambang Brodjonegoro, Minister of Finance of Indonesia.
15. The next meeting of the Development Committee is scheduled for April 16, 2016, in Washington, D.C.

60
Annex 5: African Governors’ Caucus 2015 - Luanda Declaration
AFRICAN GOVERNORS’ CAUCUS LUANDA DECLARATION
Having met in Luanda, the Republic of Angola, at our 2015 Caucus, hosted and chaired by Honorable Armando Manuel, Minister of Finance of the Republic of Angola and Chairman of the African Caucus of the International Monetary Fund (IMF) and the World Bank Group (WBG):
We, the African Governors of the IMF and the WBG discussed ways and means the Bretton Woods Institutions (BWIs) can support our efforts to: (i) address the challenge of financing for sustainable development; (ii) combat tax evasion and eliminate illicit financial flows; (iii) invest in economic transformation and diversification; (iv) finance regional transformative infrastructure projects; and (v) enhance African voice and representation in the BWIs.
IN THIS CONTEXT
Mindful that the world’s increasingly volatile financial outlook means that finding the money to pay for the Sustainable Development Goals (SDGs) will be difficult, and conscious that without the right financing and policies, we cannot achieve the set ambitions:
We submitted for support by the BWIs transformative solutions and actions - including strengthening public policies, harmonizing regulatory frameworks, developing public/private partnerships (PPPs), improving business climate, and restructuring sovereign debt - to unlock the potential of people and the private sector and incentivize changes in financing, consumption and production patterns in support of sustainable development.
Acknowledging that illicit financial flows coupled with aggressive tax avoidance, repatriation of profits and debt repayments are tragically depriving our countries of hundreds of billions of dollars every year; and convinced that domestic resources that our countries can raise themselves will be our largest single resource for funding our countries’ development:
We proposed some focus areas where BWIs' assistance could help our countries to raise new development finance through domestic resource mobilization by increasing, inter alia, tax collection, private finance, international public finance; and, in particular, reducing illicit financial flows by 2030, with a view to eventually eliminate them, including through trade, monetary and financial systems, strengthened global economic governance, and improved international tax cooperation.
Underscoring that natural resource wealth presents vast opportunities for development; conscious that our countries that depend on it for export earnings and fiscal revenues face peculiar challenges and remain highly vulnerable to various external shocks; and concerned that more than two decades since the start of diversification programs, the lack of well-designed diversification strategies and inadequate monitoring mechanisms have not helped facilitate economic and export diversifications for Africa’s transformation:
We suggested few actions that the BWIs could undertake in support of our countries to achieve economic and export diversification by spurring innovation and technologies in higher-value sectors - including agriculture, infrastructure, energy, manufacturing, data improvement, and capacity building - to unleash the spirit of entrepreneurship and drive Africa’s transformation.
Reaffirming that infrastructure development remains a key driver and a critical enabler for sustainable growth in Africa; expressing concern on the inadequacy of current international funding and delivery architecture in responding to Africa's infrastructure needs; noting that the current favorable economic landscape in the continent provides us with a unique opportunity to collectively address regional transformative infrastructure financing with a sense of urgency:
We proposed for Bank's support six regional transformative projects in energy and agriculture sectors; as well as a few innovative solutions to reduce Africa's growing infrastructure financing gap. We also called for BWIs' financial contributions into the African Development Bank's (AfDB) Africa50 initiative

61
to unblock the challenges associated with infrastructure project preparation, bankability, and financial structuring as key prerequisites for attracting private capital investments.
Reemphasizing the critical importance and urgency of increasing Africa’s voice and representation within the BWIs:
We reiterated our position that the size of the IMF Executive Board be aligned with the institution’s growing mandate and renewed our longstanding commitment to a third chair for Sub-Saharan Africa. We recalled the commitment of the Fund membership to complete the comprehensive review of the quota formula by January 2013, and our position for enhanced Africa's representation through quota shares that reflect our economic dynamism and underlying vulnerabilities. We agreed to maintain a concerted dialogue with the leadership at the IMF and the Bank to enhance the representation of African nationals and effectively promote their career development within the agreed institutional goals of diversity and mobility at all levels of staff.
FINALLY Cognizant that IDA is and should continue to be the most important source of funding in achieving ambitious SDGs targets:
We renewed our support to the WBG’s new financing initiatives to facilitate the transition from concessional to non-concessional funding, as well as the ongoing discussion of options to increase the resources available for development finance through IDA. We stand ready to be consulted on options that would be identified.
ACKNOWLEDGEMENT We, African Governors, thank His Excellency President José Eduardo dos Santos, the Government and the People of the Republic of Angola, for the hospitality and support they accorded us throughout our stay in the country.
Luanda, August 28, 2015 African Caucus

62
Annex 6: WBG President’s Response to 2015 Memorandum of African Governors
Reply to the 2015 Memorandum of African Governors
to the Heads of the Bretton Woods Institutions
December 10, 2015 Thank you for the 2015 Memorandum of African Governors to the Heads of the Bretton Woods Institutions. This response addresses issues raised in the Memorandum concerning World Bank Group (WBG) support to Africa's development and how this could be made more effective.
I. World Bank Group Support to Africa I am pleased to indicate that in FY15 WBG lending levels continued the upward trend of assistance to the continent. FY15 IDA delivery to Sub-Saharan Africa was $10.4 billion, and IBRD lending was $1.2 billion. This is the highest IDA delivery by any Region, and the IDA and IBRD delivery of $11.6 billion is the highest volume of resources provided to Sub-Saharan Africa in the history of the Bank. We also provided $2.4 billion of IBRD for North Africa. IFC committed $3.6 billion in new long-term financing and mobilizations in Sub Saharan Africa, provided advice to governments and private investors in projects worth $47 million in 30 countries, and committed $142 million to North African countries. MIGA provided guarantees of $201 million to SSA countries, and $34 million to North Africa.
II. Enhancing Financing for Sustainable Development I share the Governors' concern to expand options for financing development and inclusive growth. The WBG's capacity to deliver is anchored in our unique model of long-term country-based engagement, providing regional and global solutions across the development spectrum, and offering a full range of services to public and private sectors. We are actively exploring innovations to enhance our capacity to meet the demand for greater volumes of all types of finance. The provision of additional non-concessional resources through leveraged IDA financing could potentially complement IDA's core concessional model and help meet the expanding demand for long-term financing for critical infrastructure. In addition, access to additional leveraged funds from IDA could free up concessional resources for the poorest IDA clients, including fragile states.
I very much appreciate your support for our efforts to innovate and find ways to increase the resources available for development finance through IDA. I trust we can count on the strong engagement of African Governors during the IDA 18 replenishment negotiations that begin in March, 2016. This replenishment round will address a number of the points you have raised in your memorandum, and a successful outcome will require sustained dialogue with borrower governments, including through the participation of senior representatives in IDA 18 meetings.
The global financial crisis underlined the importance of debt sustainability to the ability of countries to cope with external shocks, maintain growth, and reduce poverty. The joint IMF – World Bank Debt Sustainability Framework is designed to provide governments with an appropriate warning system, neither too conservative nor too lax, based both on the historical volatility of economies and on the observed relationship between debt ratios and actual payment difficulties (debt distress). The most recent review in 2012 introduced adjustments that made the risk-rating methodology more forgiving, incorporating remittances and a tailored approach to carefully evaluate marginal cases. The WBG and the IMF will present a further review of the Framework's implementation to their respective Boards in 2016. I note the Governors' concern regarding debt settlement for remaining African countries. The HIPC and arrears clearance processes are governed by specific requirements. The WBG can provide assistance to countries to meet these requirements but cannot waive them. Technical teams are therefore working to support the efforts of eligible countries, including discussions of arrears clearance with other development partners.
I welcome the emphasis on mobilizing domestic resources to finance development, and we are stepping up our efforts to provide support in collaboration with the IMF. A major component of the IMF-WBG tax policy partnership is development of an innovative tax policy assessment framework to diagnose, benchmark, and set a reform path for tax policy issues facing developing countries. In addition, we will focus on deepening the policy dialogue on cross-country experiences and emerging tax policy issues in developing countries. We will also help to increase their voice in the global debate on international tax rules and transfer pricing and harmful tax competition, among others.
63
III. Stemming Illicit Financial Flows Thank you for raising the issue of illicit financial flows (IFFs). The WBG is building on its expertise and comparative advantage to step up its contributions at the global level and to provide more integrated assistance to client countries to address IFFs. We are pooling the different strands of our multidisciplinary work into a cohesive integrated IFF program to cover administration, money laundering, asset recovery, good governance and accountability, procurement, and management of extractives, This approach covers both analytical work and assistance to ensure greater accountability and transparency, as well as adherence to international standards in tax transparency, automatic exchange of information, transfer pricing and audit procedures.
A number of specific initiatives are in place. The Stolen Asset Recovery (StAR) Initiative helps build capacity in countries to trace assets through the financial system. The Anti-Money Laundering (AML) program provides tools for countries to enable them to "follow the money" and evaluates AML regimes against international standards, while work to promote financial integrity monitors compliance with standards concerning tax evasion and reporting. We are also implementing several programs to support transparent management of extractive resources and use of revenues, as well as procurement and contract award.
IV. Economic Transformation and Diversification Economic transformation and diversification lies at the heart of WBG support to the continent. It is why we are stepping up investments in infrastructure, especially energy, providing support along the agriculture value chain, and focusing on education, including science, technology, engineering and mathematics. We welcome the Memorandum's suggestions on how we can further promote economic diversification and integration, including through increased assistance to manufacturing, trade, and entrepreneurship. We note the request for policy advice and technical assistance to meet specific challenges that African countries are facing. In this regard, I am pleased that we have developed a comprehensive Africa Climate Business Plan to be rolled out at COP21 that will help address the impacts of climate change on the continent.
V. Financing Regional Transformative Infrastructure Projects Our lending for infrastructure is dependent on the overall financial resources available to us and the priorities of client countries. However, we have put a number of mechanisms in place to increase the resources available for infrastructure and are actively leveraging private sector investment, including through expansion of guarantees. We are also exploring innovative financing mechanisms, and in this regard, I appreciate the suggestions made in the Memorandum. The Global Financing Facility (GIF), launched at the 2014 Annual Meetings, became operational in July 2015. It will support PPPs and other complex infrastructure investments, and aims to mobilize long-term private capital to finance infrastructure. The first phase of GIF activities provides funding for the design, preparation, transaction and financial structuring of a limited number of projects, leveraging its $100 million in seed funds. I am pleased to note that the GIF Governing Council envisions about 3 to 4 complex infrastructure projects from Africa to be supported during this pilot phase. Technical teams are working to accelerate implementation of the priority projects identified by the Energy and Agriculture Task Forces. Going forward, the additional projects proposed in your Memorandum will be included in the Task Force priority lists.
VI. Quota, Voice, and Diversity In FY15, we strengthened our efforts to increase Sub-Saharan African representation at senior and mid-management levels and develop a pipeline of talent. All of the members of our Senior Management Team have signed a Commitment to Diversity and Inclusion Compact, and Vice Presidents have signed similar Compacts with their management teams. The Diversity Talent Desk is dedicated to the attraction and recruitment of mid to senior level Sub-Saharan African professionals to the institution, and we have launched a direct sourcing campaign. Through these efforts, 20 percent of recently appointed Practice Managers are from Sub-Saharan Africa and the Caribbean, bringing the total of Sub-Saharan African and Caribbean Practice Managers to 14.3 percent. We have also increased the number of Sub-Saharan nationals serving at the Vice President level. The Africa Recruitment Mission is part of our global campaign to recruit Sub-Saharan African candidates for mid and senior level position, with a focus on women, and over 60 positions will be filled as a result of this process. We are also developing a pipeline of young Africans through increased focus on attracting Sub-Saharan African staff through the Young Professional and Analyst Programs. Once again, I thank you for your 2015 Memorandum, and I look forward to our continued partnership in support of Africa's development.

64
Annex 7: Rotation Schedules for the Constituency Chairmanship
FIRST ROUND 2010 - 2052
YEAR CHAIRPERSON VICE CHAIRPERSON
2010 BOTSWANA BURUNDI
2012 BURUNDI ERITREA*
2014 ERITREA ETHIOPIA
2016 ETHIOPIA GAMBIA, THE
2018 GAMBIA, THE KENYA
2020 KENYA LESOTHO
2022 LESOTHO LIBERIA
2024 LIBERIA MALAWI
2026 MALAWI MOZAMBIQUE
2028 MOZAMBIQUE NAMIBIA
2030 NAMIBIA RWANDA
2032 RWANDA SEYCHELLES
2034 SEYCHELLES SIERRA LEONE
2036 SIERRA LEONE SOMALIA
2038 SOMALIA SOUTH SUDAN
2040 SOUTH SUDAN SUDAN
2042 SUDAN SWAZILAND
2044 SWAZILAND TANZANIA
2046 TANZANIA UGANDA
2048 UGANDA ZAMBIA
2050 ZAMBIA ZIMBABWE
2052 ZIMBABWE BOTSWANA
NOTES: 1. Every country is given a turn for Chairmanship in alphabetical order from A to Z 2. Avoids duplication with IMF Rotation - Governors not serving on the IMF constituency Panel are given preference *Since Eritrea elected to pass their turn as Vice Chair of the Constituency in 2012-2014, Ethiopia was advanced in its place.

65
Annex 8: Rotation Schedule for the Constituency Panel
NOTES: 1. Every country is given a turn for Chairmanship in alphabetical order from A to Z 2. Avoids duplication with IMF Rotation - Governors not serving on the IMF constituency Panel are given preference 3. Other panel members reflects regional balance (East, South and West) 4. Schedule revised to include South Sudan following the country’s membership to the Constituency in October 2012 *Since Eritrea elected to pass their turn as Vice Chair of the Constituency in 2012-2014, Ethiopia was advanced in its place. .
FIRST ROUND 2010 – 2052 YEAR CHAIRPERSON VICE CHAIRPERSON OTHER PANEL MEMBERS
2010 BOTSWANA BURUNDI SEYCHELLES KENYA SIERRA LEONE
2012 BURUNDI ERITREA RWANDA SWAZILAND LIBERIA
2014 ERITREA* ETHIOPIA LESOTHO ZAMBIA SOUTH SUDAN
2016 ETHIOPIA GAMBIA, THE NAMIBIA ZIMBABWE SUDAN
2018 GAMBIA, THE KENYA MOZAMBIQUE MALAWI TANZANIA
2020 KENYA LESOTHO SWAZILAND BOTSWANA ETHIOPIA
2022 LESOTHO LIBERIA RWANDA BURUNDI SOUTH SUDAN
2024 LIBERIA MALAWI MOZAMBIQUE ETHIOPIA ZAMBIA
2026 MALAWI MOZAMBIQUE GAMBIA, THE UGANDA KENYA
2028 MOZAMBIQUE NAMIBIA ETHIOPIA SOMALIA ERITREA
2030 NAMIBIA RWANDA BOTSWANA SOUTH SUDAN LIBERIA
2032 RWANDA SEYCHELLES LESOTHO UGANDA TANZANIA
2034 SEYCHELLES SIERRA LEONE SUDAN ZIMBABWE LIBERIA
2036 SIERRA LEONE SOMALIA KENYA BOTSWANA MALAWI
2038 SOMALIA SOUTH SUDAN SWAZILAND ZAMBIA BOTSWANA
2040 SOUTH SUDAN SUDAN LIBERIA MALAWI BURUNDI
2042 SUDAN SWAZILAND SOMALIA SIERRA LEONE LESOTHO
2044 SWAZILAND TANZANIA UGANDA ERITREA NAMIBIA
2046 TANZANIA UGANDA ZAMBIA SEYCHELLES BOTSWANA
2048 UGANDA ZAMBIA ZIMBABWE KENYA GAMBIA,THE
2050 ZAMBIA ZIMBABWE UGANDA BURUNDI LIBERIA
2052 ZIMBABWE BOTSWANA LIBERIA SUDAN RWANDA

66
Annex 9: Rotation Schedule for Constituency Representation on the Development Committee
FIRST ROUND 2010 -2052 YEAR DC REPRESENTATIVE ALTERNATE ASSOCIATES
2010 ZIMBABWE ZAMBIA TANZANIA ERITREA RWANDA GAMBIA,THE
2012 ZAMBIA UGANDA GAMBIA,THE MALAWI LESOTHO KENYA
2014 UGANDA TANZANIA NAMIBIA MOZAMBIQUE ZIMBABWE SIERRA LEONE
2016 TANZANIA SWAZILAND LESOTHO RWANDA BURUNDI LIBERIA
2018 SWAZILAND SOUTH SUDAN SIERRA LEONE SOMALIA LESOTHO UGANDA
2020 SOUTH SUDAN SUDAN NAMIBIA ZIMBABWE GAMBIA,THE BURUNDI
2022 SUDAN SOMALIA KENYA ZAMBIA SWAZILAND SIERRA LEONE
2024 SOMALIA SIERRA LEONE ZIMBABWE LESOTHO NAMIBIA GAMBIA,THE
2026 SIERRA LEONE SEYCHELLES SWAZILAND ETHIOPIA BOTSWANA TANZANIA
2028 SEYCHELLES RWANDA SUDAN TANZANIA ZIMBABWE SWAZILAND
2030 RWANDA NAMIBIA KENYA SUDAN ZAMBIA SIERRA LEONE
2032 NAMIBIA MALAWI BURUNDI KENYA SIERRALEONE SOUTH SUDAN
2034 MALAWI MOZAMBIQUE TANZANIA GAMBIA ETHIOPIA BURUNDI
2036 MOZAMBIQUE LIBERIA LESOTHO ZAMBIA ERITREA SEYCHELLES
2038 LIBERIA LESOTHO GAMBIA,THE MALAWI NAMIBIA RWANDA
2040 LESOTHO KENYA MOZAMBIQUE ZAMBIA ZIMBABWE UGANDA
2042 KENYA GAMBIA, THE BOTSWANA NAMIBIA ETHIOPIA RWANDA
2044 GAMBIA, THE ETHIOPIA ZAMBIA ZIMBABWE LIBERIA MALAWI
2046 ETHIOPIA BURUNDI SIERRA LEONE LIBERIA LESOTHO SOUTH SUDAN
2048 BURUNDI ERITREA LIBERIA SOMALIA SWAZILAND NAMIBIA
2050 ERITREA BOTSWANA KENYA SIERRALEONE SEYCHELLES RWANDA
2052 BOTSWANA GAMBIA, THE SIERRA LEONE KENYA ETHIOPIA MOZAMBIQUE
NOTES: 1. Avoids duplication with the other Panel membership 2. DC Representative and Alternate Members accorded opportunity in descending alphabetical order (Z to A) 3. Associate Members are selected on basis of providing regional balance 4. Schedule revised to include South Sudan following the Country’s membership to the Constituency in October 2012

67
Annex 10: Rotation Schedule for Executive Director and Alternate Executive Director
FIRST ROUND 2010 - 2052
Year Executive Director Alternate ED
2010 SUDAN ZAMBIA
2012 ZAMBIA SEYCHELLES
2014 SEYCHELLES ZIMBABWE
2016 ZIMBABWE BOTSWANA
2018 BOTSWANA UGANDA
2020 UGANDA BURUNDI
2022 BURUNDI TANZANIA
2024 TANZANIA ERITREA
2026 ERITREA SWAZILAND
2028 SWAZILAND ETHIOPIA
2030 ETHIOPIA SOUTH SUDAN
2032 SOUTH SUDAN SOMALIA
2034 SOMALIA GAMBIA, THE
2036 GAMBIA, THE SIERRA LEONE
2038 SIERRA LEONE KENYA
2040 KENYA RWANDA
2042 RWANDA NAMIBIA
2044 NAMIBIA LESOTHO
2046 LESOTHO MOZAMBIQUE
2048 MOZAMBIQUE LIBERIA
2050 LIBERIA MALAWI
2052 MALAWI
NOTES:
1. Sudan and Zambia accorded special dispensation to serve their turn under rotation system of the erstwhile Africa Group I Constituency
2. Seychelles which has never served the Constituency as Executive Director is accorded special dispensation on the rotation system
3. The rest of the countries follow an Alphabetical rotation alternating between Z and A until the first round is completed, taking into account South Sudan’s membership of the Constituency in October 2012
4. This schedule proposed with a view to avoid duplication with IMF Rotation for EDs and AEDs

68
Executive Director and Alternate Executive Director
Mr. Louis Rene Peter Larose
Executive Director SEYCHELLES
Mr. Andrew Ndaamunhu Bvumbe
Alternate Executive Director ZIMBABWE

69
Senior Advisors and Advisors and to Executive Director
Wilson T. Banda Senior Advisor
Malawi
Sheku Bangura Senior Advisor Sierra Leone
Anthony Barclay Senior Advisor
Liberia
Chris Hoveka
Senior Advisor Namibia
Solome Lumala Senior Advisor
Uganda
Felleke Mammo Senior Advisor
Ethiopia
Dismas Baransaka
Advisor Burundi
Antonio Fernando Advisor
Mozambique
Chola Milambo Advisor Zambia
Allan Ncube
Advisor Zimbabwe
Edouard Ngirente Advisor Rwanda

70
Administrative Staff
Mohammed Ahmed Program Assistant
Sudan
Lozi Sapele Program Assistant
Zambia
Wubalech Mekonnen Senior Executive Assistant
Ethiopia


Botswana Burundi Eritrea Ethiopia Gambia, The Kenya
Lesotho Liberia Malawi Mozambique Namibia Rwanda
Seychelles Sierra Leone Somalia South Sudan Sudan Swaziland
Tanzania Uganda Zambia Zimbabwe
AFRICA GROUP I CONSTITUENCY
FY16 Interim Report - April 2016
Office of the Executive Director, EDS14
For electronic or hard copies:
Facsimile: (202) 522–1549
Email: [email protected]
Website: http://www.worldbank.org/eds14
Recommended