i

ii

Affidavit
I, ERI NAGAI, hereby declare
1. that I am the sole author of the present Master’s Thesis, "The Value of Resources", 92 pages, bound, and that I have not used any source or tool other than those referenced or any other illicit aid or tool, and
2. that I have not prior to this date submitted this Master’s Thesis as an examination paper in any form in Austria or abroad.
Vienna, 09.06.2011 Signature

iv

v
Acknowledgements
I send my heartfelt appreciation to my supervisor Dr. Johann Fellner for all his kind
support and attention. I also wish to send my BIG thank you to my family for their
endless love and patience. Special thank you to little Marceau, for his smiles of hope.
To my friends, for their love and encouragements. And to C, for celebrating and
believing in me.

vi

vii
Table of Contents
Table of Contents .....................................................................................................vii
List of Abbreviations................................................................................................. ix
I. INTRODUCTION .................................................................................................. 1
1. Background and Motivation ............................................................................. 1
2. Research Aims and Questions........................................................................... 2
II. CURRENT STATUS AND LEGAL FRAMEWORK CONCERNING THE
TREATMENT OF ELECTRONIC APPLIANCES ............................................... 4
1. Sustainability ...................................................................................................... 4
2. Hazardous Substances and Material Recovery ............................................... 6
3. European Union ................................................................................................. 7
3.1. The Waste Electrical and Electronic Equipment (WEEE) Directive..... 8
3.2. The Restriction on the use of certain Hazardous Substances in
electrical and electronic equipment (RoHS) Directive ................................... 9
3.3. The Ecodesign Directives and the REACH Regulations ....................... 10
4. Japan ................................................................................................................. 11
5. Basel Convention on the Control of Transboundary Movements of
Hazardous Wastes and Their Disposal .............................................................. 13
6. Material Declaration Drivers and Programs................................................. 14
III. RESEARCH METHODOLOGY..................................................................... 17
1. Target Products ................................................................................................ 17
2. Methodology ..................................................................................................... 17
3. Data Collection and Analysis .......................................................................... 18
3.1. Challenges in Data Collection .................................................................. 18
3.2. Material Categorization............................................................................ 19
3.3. Composite Materials and Printed Circuit Board (PCB) ....................... 20
3.4. Price Data................................................................................................... 21
IV. RESULTS ........................................................................................................... 22
1. Refrigerator-Freezers ...................................................................................... 22
2. Washing Machines ........................................................................................... 27
3. Televisions and Monitors................................................................................. 31
3.1. CRT Displays ............................................................................................. 31
3.2. Flat Panel Displays .................................................................................... 35

viii
4. Computers......................................................................................................... 40
4.1. Desktops ..................................................................................................... 40
4.2. Laptops ....................................................................................................... 44
5. Mobile Phones................................................................................................... 47
V. DISCUSSIONS .................................................................................................... 55
VI. CONCLUSION .................................................................................................. 61
Bibliography ............................................................................................................. 63
List of Figures ........................................................................................................... 70
Appendix ................................................................................................................... 72

ix
List of Abbreviations
COP Conference of the Parties
CPU Central Processing Unit
CRT Cathode Ray Tube
EEE Electrical and Electronic Equipment
EuP Energy-Using Products
E-waste Electronic Waste (also WEEE)
FPD Flat Panel Display
LCD Liquid Crystal Display
LDCs Least Developed Countries
PCB Printed Circuit Board
RoHS Restriction of the Use of Certain Hazardous Substances in Electrical
and Electronic Equipment (European Union directive)
WEEE Waste Electrical and Electronic Equipment (also e-waste)

x

xi
Abstract
The electronics industry is a constantly and rapidly evolving industry, and
even the material composition within the same category of appliances is continuously
evolving with new technology, customer preferences, legislative changes, and
nowadays, health and environmental concerns. This paper follows the changes in the
material composition and the relative value of those materials for seven categories of
electronic appliances: refrigerators, washing machines, CRT displays, flat panel
displays, desktop computers, laptop computers, and mobile phones.
The results showed that the relative value of resources contained in an
electronic product, compared to its market price, is very low for all products studied.
This indicates that despite growing concern today, even a large-scale increase in
resource prices, including precious metals, is unlikely to lead to any significant
increase in market prices of electronic products. The study also indicated that the
smaller and more high-tech an appliance becomes, the less valuable and more
difficult it tends to become for resource recovery at the end of its lifecycle.

xii

1
I. INTRODUCTION
1. Background and Motivation
At the backbone of every economy are resources. Over the history of
mankind we have continuously been learning to extract and modify natural resources
to meet our diverse needs. Different resources have been sought after and considered
valuable at different times. Substances like lead and mercury used to be in extensive
use, but their applications have been phasing out since their toxic effects on
organisms have become wide-known. Plastic material, invented in the late 19th
century, is today an absolutely indispensable material in a wide range of industrial
products. Then there are also some resources, such as gold, silver, and copper, which
have always been valuable to men. The application and the associated value of
material resources are constantly evolving and changing along with the development
and the needs of our society.
In earlier times, the manufactured products or tools used by men were not so
complicated in their composition or structure. Perhaps only a few materials were
combined to form one product. Also the assembly process and the research and
design behind the product were not always particularly sophisticated or complicated.
Such simplicity began to change with the ever-progressing knowledge, skills, and
technology, and eventually began the manufacturing of complicated and high-tech
electrical and electronic equipments. These evolved from relatively-basic in structure,
design, and ability to highly-complicated and multi-tasking in just over a few
decades as the society pursued after smaller, lighter, faster, “more able” products.
The fastest changing products are inevitably in the IT-sector, namely phones
(particularly mobile) and computers, but even household appliances have seen
noticeable transformations.
In its earlier days, the electronics industry single-mindedly explored higher
performance. Consumers continuously demanded improved efficiency and
convenience at lower costs. Today’s newest challenge, however, is the need for
reconsideration of material composition and design while maintaining the same level
of performance quality, as the environmental concerns stemming from the electronics
industry heighten and the call for a proper disposal of end-of-life electric and

2
electronic equipments intensifies. As the electronics manufacturing industry adapts
its appliances’ design and composite materials in response to such multidimensional
technical, social, and environmental demands, what happens to the “value” of
resources contained in these products? How exactly has the use of resources and the
relative values of those resources in electric and electrical appliances changed and
developed over time?
2. Research Aims and Questions
The aim of this paper is to conduct an analysis on the development of
“relative value” of materials over time in consumer electrical/electronic equipments
and household electronic appliances. With technological advancements the efficiency
of our products is continuously increasing, combining less resource more efficiently
for higher performance. At the same time, the absolute quantity of resources being
mined and consumed has been expanding at a remarkable rate as well, keeping up
with the increasing speed of economic developments and consequently people’s
pursuit of greater material wealth. This increased demand for resources can have an
influence on their prices, particularly on those supplies that are high in value and/or
relatively limited in supply, which in turn may influence the pricing of manufactured
goods that rely on those materials as ingredients.
What happens to the value of resources, as electronic products evolve from simple
combinations of a few metals to a complex assembly of numerous parts, and the
utility value of the produced appliances become increasingly more dependent on
research and development, i.e. human intelligence and skills, rather than primarily
on the cost of the resources contained?
Do the used resources decrease or increase in relative value within the products over
time?
Does the increased efficiency and fierce market competitions work together to keep
the price under control, thus holding the relative value of resources more or less
constant?

3
As products’ composite materials diversify, are there grounds to be concerned for the
dwindling availability and the price hikes of the so-called “scarce” or “precious”
metals, or are their contribution to the composition minimal enough to not make a
serious impact on the end-pricing?
Are there any materials that are consistently important and irreplaceable?
These are some of the questions that could begin to be addressed by tracking
the changing value of materials within our electrical and electronic appliances.

4
II. CURRENT STATUS AND LEGAL FRAMEWORK CONCERNING THE
TREATMENT OF ELECTRONIC APPLIANCES
The research presented in this paper belongs in the wider investigation of the
development of resource use and the environmental and economic implications of
sustainable resource management. In order to think about these larger questions in
the context of value and importance of resources, it becomes vital to understand the
basic overall trend in the use of resources and how the relative values of these
resources have been evolving through time.
Generally the research on resources focuses on critical materials and
hazardous materials, and so far there has not been a significant amount of studies
being conducted on the general trends and changes on the material composition of
electronic equipments as such and the accompanying investigation into the value of
resources contained in them. Especially driven by growing legislative changes
related to the use of certain substances and the treatment of waste equipments, much
of the studies related to material compositions of electrical and electronic products
have focused on the reduction and treatment of hazardous substances for
environmental reasons and the product design and its recycling potential for high-
value recoverable materials for economic reasons.
1. Sustainability
In recent times there have been growing concerns over the negative impacts
caused by industry and its products on both society and the environment. The
concept of sustainability has therefore gained increasing attention, and with it, our
responsibility to live in a more sustainable manner. It has been understood for a
while now that the current scale of resource use is not well-managed and therefore
unsustainable in the long-term. The society today is faced with a rapid and
accelerating population growth, a general augmentation in wealth, and an incredible
rise in the consumption of energy, materials, and other resources. At the ongoing rate
of consumption, particularly in developed countries and emerging markets, access to
a fair share of resources are endangered for future generations, and the potential for
resource exhaustion may be a realistic concern. Furthermore, with expanding

5
scientific acknowledgement that critical global environmental problems such as
climate change is heavily influenced by human activities, there is a clear and urgent
need to address how our modern society consumes and often wastes valuable
resources.
One of the most discussed areas under the issue of sustainable resource use is
the electronics sector – the way in which we manufacture, use, and dispose of the
electrical and electronic equipments (EEE). The electronics industry has continued to
show a remarkable growth, and many electronic devices have become absolutely
indispensable to the modern way of life. Nevertheless, despite such a close
integration into our lifestyle, a functioning and sustainable operation of material
management has not yet been fully implemented in this sector. In fact, much of the
EEE boast a rather unsustainable cycle of consumption, as they are often replaced
long before the intended lifetime due to increased performance, reduced cost, and
innovative designs for each upcoming generation of product. This unsustainable
pattern of consumption is further underlined by a fierce competition within the
industry and the availability of a wide variety of products.
The electronics companies have been coming under heavy attacks from
environmental organizations, given their unsustainable material consumption due to
increasingly shortening product lifecycles, the use of hazardous materials and
processes, and the generation of waste both during production and at end-of-life. The
industry has also been criticized for their frequent choice of disposal for end-of-life
appliances, effectively dumping them in developing countries where regulations
against toxic substances have not been established yet. The improper dumping and
landfilling of harmful substances may cause serious damages to ecosystems and
compromise the health of living organisms including humans. Wealthy, developed
societies have been enjoying the convenience offered by modern technology without
the willingness to take responsibility for the massive amount of waste generated as
the byproduct of the benefits. These issues are bound to intensify as the developing
nations catch up with developed nations on resource consumption patterns. Faced
with the increased attention on the handling of the waste stream and the emphasis on
producer responsibility, the environmental performance of end-of-life processing has
become important, and appropriate legislative adaptations have been taking place in
order to tackle this issue (Hester and Harrison, 2009).

6
As an example, in the EU, the European Commission proposed a “Strategy
on the Sustainable Use of Natural Resources used in Europe” on 21 December, 2005,
focusing on reducing the environmental impacts stemming from resource use in the
context of growing economy. Reducing the environmental impacts associated with
resource use is believed to be a decisive factor for the EU to achieve its sustainable
development goals. Other initiatives addressing sustainability are also being
implemented on local, regional, and global scales. A strategic, efficient, and well-
controlled use of resources is today understood to be crucial for a strong and sound
development of any economy.
2. Hazardous Substances and Material Recovery
One of the key focuses in the study of material composition is the question of
hazardous materials. The recycling of home appliances and other electronic devices
has become a legal requirement in some countries in an attempt to keep them out of
the waste stream and ultimately the environment. The objective is to avoid damages
on the health of ecosystems by preventing hazardous and toxic substances from
leeching into the environment.
Another important aspect is the concept of resource recovery, or recycling:
the process in which certain materials contained in waste products are collected and
separated for reuse. Resource recovery, if successfully carried out, can not only be
environmentally friendly but also be cost-effective, as it reduces the amount of waste,
saves space in landfills, and conserves natural resources. Reclamation specifically in
metal compounds and elements from products, buildings, and various waste is called
urban mining. The precious metals that are particularly sought after in urban mining
include e.g. gold, silver, platinum, and iridium, which can be found in various
everyday consumer electronics from phones to cameras to televisions. With growing
concerns about metal resource scarcity and recently increasing mineral prices, much
research has been conducted over the effectiveness of the metal recovery processes,
the economic advantages, and the potential benefits reaped by the reuse.
For example, over the years the use of gold has expanded beyond their
traditional role in jewelry and investment. Nowadays gold is also an integral
component in industrial applications, especially in electronic devices. According to

7
Hagelüken and Corti (2010), well over 300 tons of gold are used in electronics
annually, therefore offering an important recycling potential for the secondary supply
of gold from end-of-life electronic equipments. Electronic equipments may also
contain other precious metals, such as silver, palladium, and to smaller extent,
platinum and ruthenium.
Keeping hazardous substances ‘out’ and keeping valuable resources ‘in’:
these are the drivers of the legislative changes concerning resource use and
management in the electronics industry.
3. European Union
Realizing that societies as a whole, and in particular the electronics industry,
must find a lifestyle built on responsible and sustainable way of production and
consumption, the European Commission has introduced a series of legislation based
on Producer Responsibility principle over the last several years. This principle calls
for a creation of link between the production and disposal phase of a product and
addresses all concerned actors, i.e. manufacturers, distributors, consumers, and
operators, in the proper management of the life cycle of EEE. Producer
Responsibility principle stands as an extension of the traditional ‘polluter pays’
principle. Therefore, the responsibility for the proper disposal of end-of-life
equipments is shouldered by the original producer.
The producer responsibility principle calls for:
• Attaining the objectives for a more efficient resource use and reduction of
the amount of waste being sent to landfill
• The redirection of the end-of-life products for reuse and recycling
• The abolishment of the use of certain hazardous materials and minimizing
energy consumption throughout product lifecycle
Therefore, the legislations based on producer responsibility encourage producers to
design, manufacture, and market products that:

8
• Reduce or eliminate the use of hazardous materials
• Incorporate greater amounts of recycled materials
• Makes end-of-life treatment easier
• Minimize waste
• Can be re-used
• Are more resource-efficient throughout their lifecycle
As the presence and essentiality of the electrical and electronic devices grow
in our lives, the manufacturers are faced with a greater responsibility for a
sustainable management of their industry. It is growingly required by legislation and
expected by consumers (Hester and Harrison, 2009).
Of the numerous EU directives and regulations intended to incorporate
producer responsibility principle, the major legislations pertaining to the electrical
and electronics industry include: the WEEE, RoHS and Energy using Products
Directives, and the REACH Regulations.
3.1. The Waste Electrical and Electronic Equipment (WEEE) Directive
The Waste Electrical and Electronic Equipment (WEEE) Directive
(2002/96/EC) came into force on 1 July, 2006. The Directive is an important
cornerstone of the EU’s environmental policy on electronic waste, and it addresses a
highly complex waste flow of obsolete, or end-of-the-life, equipments in terms of:
• The variety of products
• The association of different materials and components
• The contents in hazardous substances
• The growth patterns of this waste stream
The aim of this European Community Directive is to set collection, recycling,
and recovery targets for all types of electrical goods, ultimately aiming to create a
closed loop economy. It also encourages product design modifications that make
WEEE easier to be dismantled, recycled, and recovered (Hagelüken and Corti, 2010;
Hester and Harrison, 2009; Huisman et al., 2007). This is an innovative approach that

9
challenges the widespread style of production by the manufacturers of EEE and its
component, which traditionally regarded performance in use as the highest priority in
design (DEFRA, 2004). The WEEE covered under the Directive are divided into the
following ten categories:
1. Large household appliances
2. Small household appliances
3. IT and telecommunications equipment
4. Consumer equipment
5. Lighting equipment
6. Electrical and electronic tools
7. Toys, leisure, and sports equipment
8. Medical devices
9. Monitoring and control instruments
10. Automatic dispensers
The Directive further seeks to minimize and control toxic substances from
escaping into the environment by placing regulations on both ends of the product’s
lifetime, at manufacturing and disposal phases. A selective treatment of collected
WEEE is mandated in order to remove hazardous materials and components from the
waste stream, with some of the items requiring special treatments. This is further
explained in the closely linked RoHS Directive (Hester and Harrison, 2009; Huisman
et al., 2007).
3.2. The Restriction on the use of certain Hazardous Substances in electrical and
electronic equipment (RoHS) Directive
The Restriction on the use of certain Hazardous Substances in electrical and
electronic equipment (RoHS) (2002/95/EC) is the complementary Directive to the
WEEE Directive. The RoHS Directive seeks to reduce the environmental impact of
electrical and electronic appliances by restricting the use of the following six
hazardous substances during the manufacturing process:

10
• Lead (Pb)
• Mercury (Hg)
• Cadmium (Cd)
• Hexavalent chromium (Cr6+)
• Polybrominated biphenyls (PBB)
• Polybrominated diphenyl ether (PBDE)
Any new electrical and electronic products that contain any of these six
restricted substances are banned from being sold on the EU market. In summary, the
WEEE Directive and the RoHS Directive together regulate not only the application
of hazardous substances within the equipments but also streamline the disposal
process at their end-of-life (Bhuie et al., 2004; Hester and Harrison, 2009). Such a
change will still take some time to show up in the end-of-life waste of products with
a long-lifetime, such as televisions and refrigerators, but for products with a shorter
lifetime, such as computers and mobile phones, the impact on the waste stream
should start appearing shortly (Hester and Harrison, 2009).
3.3. The Ecodesign Directives and the REACH Regulations
The Ecodesign Directive for Energy-using Products (2005/32/EC) became an
EU law in August 2005 and has been transposed by Member States into national law
during the following two years. Ecodesign is a new concept that promotes the
reduction of energy consumption by energy-using products (EuP) such as household
electrical appliance. The Directive establishes a framework whereby manufacturers
of EuP are mandated to improve energy efficiency of their products throughout their
lifecycle and to reduce their overall negative environmental impacts. The framework
directive is intended to apply to all EuP that are placed on the market, and its scope
also includes individual external parts that are intended to be incorporated by end-
users into products placed on the market.
The Ecodesign Directive is intended to instigate significant changes on the
design phase of a wide variety of EEE. The main objective of the legislation is to
enhance energy efficiency throughout a product’s lifecycle, from the extraction of
the raw material through to recycling and disposal. It effectively targets

11
improvements in the initial design phase because this should be the key stage where
the product’s resource need and energy efficiency are determined. Furthermore,
information regarding the product’s environmental performance and energy
efficiency must be made transparent ideally on the product itself, thereby providing
consumers the means to assess the products prior to purchase. Although the Directive
is primarily aimed at the reduction of energy use, it takes into consideration related
environmental parameters such as general resource use, waste, and recyclability. In
2009 the Directive was revised to extend its scope to include energy-related products,
i.e. all goods having an effect on energy consumption during their use, such as
windows and insulation materials (EUROPA, 2011; Hester and Harrison, 2009).
Focusing on the research of hazardous substances is REACH, the Regulation
on Registration, Evaluation, Authorisation and Restriction of Chemicals (EC
1907/2006), that entered into force on 1 June, 2007. The main of goals of REACH
are to ensure an improved protection of human health and the environment through
early and clear identification of the potential risks posed by chemical substances and
to enhance innovation and competitiveness of the EU chemicals industry. It obliges
the chemical industry to perform proper risk management and to provide appropriate
safety information to the users. The regulation also promotes the progressive
substitution of the most harmful substances for which suitable alternatives have been
identified (EUROPA, 2011).
4. Japan
In Japan, the Law for the Recycling of Specified Kinds of Home Appliances1,
more commonly known as Home Appliance Recycling Law (HARL), came into
effect in April 2001. The law is a part of a series of measures put forth by the
government with the aim of establishing a recycle-based society. Its goal is to create
an appropriate waste treatment flow and promote the efficient use of resources in
order to achieve a more closed-loop-material society. The following four target
appliances were designated in the original legislation for their large product volume
and number of sales:
1*%&'+($ #"!)

12
• Air conditioners
• Refrigerators
• Televisions
• Washing machines
The law places responsibility principally on the manufacturers and retailers to
collect and recycle their own appliances, although the actual financial burden of
recycling and transport is placed on the consumers. First, the consumer is to take
back the home appliance to be discarded to the retailer and pay a collection/transfer
fee and a recycling fee. Then the retailer transports the waste home appliance to a
designated collection site, and finally, the collection site transfers the collected
appliances to the recycling facility to be recycled. Before this law was enacted, these
products were either returned to the retailer or simply collected as bulky items, and in
both cases eventually shredded and landfilled with only a minor recovery of reusable
metals. The HARL was a first piece of legislation of its kind in Japan that put into
practice the concept of Extended Producers Responsibility, requiring the producers to
carry full responsibility for their manufactured goods all the way to the very final
stage of their lifecycle (Matsuto et al., 2004; Murakami et al., 2006).
Although at the time of enactment there were concerns for the increase in
illegal dumping of appliances as a possible side effect of the law, so far this take-
back system has been working smoothly overall without any noticeable increase in
illegal dumping. The number of recovered appliances has been steadily increasing
since the implementation of the law (Murakami et al., 2006; Nakamura and Kondo
2006).
Some key differences between the European approach and the Japanese
approach can be observed. In the European legislations the front-end payment
scheme is often employed, which encourages cost-internalization (i.e. recycling costs
are included in the market price of the product and hidden from consumers) or
advance recovery fees (recovery fees are identified on the receipt at the time of
purchase). In contrast under the Japanese HARL, the fees for the collection, transport,
and recycling of the appliances are paid by the consumer at the time of drop-off
(INFORM, 2003; Matsuto et al., 2004). Another noteworthy distinction between the
recycling laws in Japan and the EU is the different emphasis on targets to be

13
achieved. Whereas the EU’s WEEE Directive sets collection targets, the HARL
emphasizes recycling goals, requiring the following recycling rates for each type of
appliance (INFORM, 2003):
• Air conditioners: 60 percent
• Refrigerators: 50 percent
• Televisions: 55 percent
• Washing machines: 50 percent
On 2 December, 2008, an amendment to the HARL was adapted, adding
liquid-crystal/plasma television sets and clothing dryers to target appliances. The
amendment also raised the required recycling rates for three of the four appliances
included in the original law. The new regulation has been in enforcement since 1
April, 2009 (Japan for Sustainability, 2009).
5. Basel Convention on the Control of Transboundary Movements of Hazardous
Wastes and Their Disposal
The international legal framework that includes the treatment of electronic
waste (e-waste) in its scope is the Basel Convention on the Control of Transboundary
Movements of Hazardous Wastes and Their Disposal, adopted on 22 March, 1989
and entered into force on 5 May, 1992. Generally known simply as the Basel
Convention, it is a comprehensive international treaty to control the movements of
hazardous waste between nations and most specifically to prevent its flow from
developed to least developed countries (LDCs). The Basel Convention emphasizes
environmentally sound management of hazardous waste, and its specific objectives
include:
• The reduction of transboundary movements of hazardous and other wastes
• The prevention and minimization of the generation of hazardous wastes
• The promotion of the transfer and use of cleaner technologies

14
The Basel Convention is the only existing global international legal
instrument that addresses the comprehensive dimensions of the issue of hazardous
and other wastes and lays down the grounds for a structured control system for their
proper treatment and disposal (Mobile Phone Working Group, 2008). Recognizing
the increasing significance of e-waste in the global waste stream and the high cost
and toxicity resulting from their disposal, the eighth meeting of the Conference of the
Parties (COP8) to the Convention, held in December 2006, focused on the creation of
progressive solutions for the effective management of e-waste (Davis, 2006).
6. Material Declaration Drivers and Programs
One of the essential factors that determines the product’s overall resource
consumption, safety, environmental performance, and recyclability is its
comprehensive material composition. Knowledge of the composition may be a
prerequisite in selecting the most appropriate technology for recycling and in the
regulation/restriction of the use of hazardous materials in industrial production.
Public calls for improved material content specifications and transparency
have finally started gaining momentum in recent years. Going further than
legislations that were aimed at controlling the use of hazardous substances and
streamlining waste management, regulatory, technical, and market pressures are
pushing the EEE manufacturers to clearly identify and publish the information
regarding the chemical and material content of their manufactured products.
One of the causes of the lack of transparency in the material composition of
electronic appliances is that quite often a product is not completely manufactured in-
house. Different components may be made by different suppliers, and the details of
these external components do not necessarily get communicated throughout the
supply chain. There are growing movements in the electronics industry to implement
a harmonized material declaration system in order to facilitate the flow of
information within and from the industry (O’Connell and Brady, 2002).
A material declaration is a disclosure of the material content of a product. It
could either be a “positive” declaration, listing the types and quantities of substances
that a product contains, or a “negative” declaration, stating the hazardous and
regulated substances that the product does not contain. Currently material declaration

15
is not required by law but only done on a voluntary basis, and no single unified
declaration mechanism exists on a global scale. Each association within the industry
has developed separate standards and declaration programs on its own. Below is a
description of some of the declaration systems in use today:
EIA (Electronic Industries Alliance)2 Material Declaration Guide: developed in
2001, this provides a guideline on sharing material content information between
suppliers and final manufacturers. Its three primary purposes are: to identify
materials that are relevant in electrical and electronic equipments, to determine the
disclosure threshold level for each material, and to establish a set format for
disclosure (O’Connell and Brady, 2002).
IPC (Association Connecting Electronics Industries) Materials Declaration: IPC has
a series of standards, most relevantly IPC-1751A and IPC-1752A, that establishes
and improves a standard reporting format for information exchange between
participants in the supply chain (IPC, 2011).
Joint Industry Guide – Material Composition Declaration for Electrotechnical
Products: Launched together by the Consumer Electronics Association (CEA),
DIGITALEUROPE, and the Japanese Green Procurement Survey Standardization
Initiative (JGPSSI) and revised in 2011, this guide is meant to facilitate the flow of
material content information in electrotechnical products across the global supply
chain. It incorporates the most up-to-date regulatory and market requirements and
also covers the latest substances considered under the EU’s REACH regulation (CEA,
2011).
Having different standards and formats is likely to hinder the promotion of an
industry-wide smooth exchange of data, especially considering the dynamism that
characterizes the electronics industry. Unfortunately, the likelihood of the realization
of a global materials declaration system is very low. Aside from the many different
2 The EIA ceased operations on 28 February, 2011. The former sectors of EIA are the Electronic
Components Association (ECA), JEDEC, Government Electronics and Information Technology
Association (GEIA), now part of TechAmerica, Telecommunications Industry Association (TIA), and
Consumer Electronics Association (CEA).

16
declaration standards currently available, individual companies have their own
proprietary systems, a factor that complicates the situation even further. As material
declaration in the supply chain is not legally mandated or controlled but only
voluntary, it is up to the manufacture and the supplier to agree on which standard
they will employ (Castorina, 2011; O’Connell and Brady, 2002).
The transparency of the products’ material composition has been improving
also at the level accessible by consumers, especially concerning potentially
hazardous substances, increasingly on a voluntary basis. For example, Nokia states
on its website that it has created a full material declaration together with its suppliers
so that it can respond to any concerns that may arise about the substances used in its
products. Nokia also provides the so-called Nokia Substance List online, which
identifies substances whose use has been voluntarily banned or restricted by the
company (Nokia, 2011b). Motorola has also published some data concerning the use
of lead and other toxic substances in their phones (Motorola, 2007).
Even if the outlook of a global materials declaration standard is not promising,
the general movement toward an increased transparency and accessibility of material
composition data of EEE is a favorable development from the perspectives of better
resource management, environmental protection, consumer safety, and researches
concerning technology and materials. In the long-term, even without a global
harmonization of the mechanisms, some form of a verifiable material declaration
may become an industry requirement.

17
III. RESEARCH METHODOLOGY
1. Target Products
The following categories of consumer electrical and electrical appliances
were selected for the purpose of this study, primarily based on their widespread use
and data availability for both material composition and market prices:
• Freezer-Refrigerators
• Washing Machines
• Televisions and Monitors (CRT & Flat Panel Display)
• Personal Computers (Desktop & Laptop)
• Mobile Phones
2. Methodology
First, data was collected on the material composition for each category of
appliances. These were aggregated and used to estimate the average material
composition for the years in which they were manufactured. At the same time, the
historical global market price of each raw material contained in the target appliance,
at the given time of its manufacturing, was obtained.
Then, based on the average material composition, the theoretical “raw
material price” of the appliance, strictly expressed as the sum of the market prices of
the raw materials for the given year or time period, was determined for each
appliance. Meanwhile, the actual historical market prices of the appliances were also
collected, and eventually the average selling price of the appliance was determined
for relevant years.
Additional interest was in finding out about how much the material cost
contributed to the final market price of a product. The relative value of the raw
materials contained was determined as a function of the two prices – in a comparison
between the raw material price and the actual market price. This was repeated for all
five types of appliances through time to see if any significant changes and trends
could be observed.

18
The relative value of the raw materials was expected to decrease over time, as
the composition of the electronic appliances became more complex; the number of
materials used in each appliance increased; and the role of skilled labor, technical
knowledge, and innovation in design and manufacturing became relatively more
important than the ingredient cost from the materials contained.
3. Data Collection and Analysis
3.1. Challenges in Data Collection
Breaking down the manufactured electrical and electronic equipments into
their components and determining the detailed material composition is quite a
complicated task. Some studies comment on the difficulty of doing such an analysis,
primarily highlighting the challenges involved in the analytical process, which
inevitably leads to a lack of enough appropriate data.
First, substantial differences in composition exist between different types of
electric and electrical appliances and even within individual types of appliances. For
example within the personal computer industry, compositions of desktop and laptop
computers are noticeably different, as they are designed for uses in different manners
and settings, despite both performing ultimately the same functions (Chancerel and
Rotter, 2009).
Furthermore, the material composition of appliances is generally not constant
over time, making it extremely difficult to determine the typical composition of an
appliance at any given time (Bhuie et al., 2004; Hester and Harrison, 2009).
Chancerel and Rotter (2009) state that due to the continuous changes in the design
and function, the mechanical and material properties of electronic appliances are
highly variable and difficult to track down. As discussed earlier, these fluctuations in
the raw material content are driven by both technological progress and new
legislative regulations. A good example of technological advancement is a switch
from CRT-based televisions and monitors to flat panel displays in the television and
computer industry (Hester and Harrison, 2009). An example of a change prompted
by legislative regulations is the elimination of lead as a result of the EU’s RoHS
Directive. Traditionally lead-based solder, which is mainly used to attach metallic
19
components to each other and to printed wire assemblies, is now being replaced by
lead-free solder (Bhuie et al., 2004).
In addition, some products such as mobile phones and computers contain a
large number of materials closely interlinked (some substances being vital but
miniscule in amounts), which also poses significant challenges when it comes to
taking them apart. As will be explained later, many studies and recycling facilities
simply categorized some components with complex structures as “composite
materials” and do not break them down any further.
Finally, the choice of a variety of methods that can be employed in the
analysis of material composition means that the results from different studies may
give slightly different figures, making the exact trends in composition unclear. This
is particularly true for the said composite materials, with different studies opting to
treat them differently according to their needs. In sum, the sheer heterogeneity
present within the EEE components makes the data assembly and analysis a highly
complicated process (Chancerel and Rotter, 2009; Doctori Blass et al., 2008).
As an important side note, the competition factor must also be considered.
Doctori Blass et al. (2008) point out that the rapid evolution of material composition
in mobile phones is compelled by fierce competition within the industry, and
therefore the companies are not willing to make the product composition details
readily available for any given year or model. In fact, this attitude is not exclusive to
the mobile phone industry. The companies and manufacturers of any appliances are
generally unwilling to disclose detailed information on the material components and
structure of their products, unless they are obligated to do so under legal
requirements and/or wish to demonstrate their environmental initiatives and to show
their compliance with the safety standards. For this reason, much of the data
concerning the material composition of EEE were obtained not directly from
manufacturers but from waste treatment and recycling centers.
3.2. Material Categorization
In the process of identifying and categorizing the relevant materials found in
the appliances, various similar materials were combined and assigned to the same
20
category, to the extent that it did not have any significant impact on the consideration
of the overall average material composition.
• Iron and steel were combined under “Ferrous Materials.”
• All plastic-materials, e.g. Polypropylene, PS&HIPS 3 , ABS 4 , PVC 5 ,
Polyurethane, and other assorted plastics, were combined under the
category “Plastics.”
• Silicon (Si) and Silica (SiO2) were combined under “Silicon.”
• Brass was calculated as consisting of two-thirds copper and one-third zinc
• Glass and ceramics were combined into one category “Glass/Ceramics,” as
they are generally used interchangeably for the same function6.
• Similarly, for mobiles phones, Platinum (Pt) and Tantalum (Ta) were
combined under “Platinum (Pt) or Tantalum (Ta),” as they can be used
interchangeably from a functional perspective7.
• The category “Other Metals” was used as the umbrella category for metals
that were only contained in trace amounts and did not have a significant
enough presence in the overall consideration of material content analysis
or when a more detailed breakdown was not available.
3.3. Composite Materials and Printed Circuit Board (PCB)
In some studies the material composition was broken down only into parts,
such as electronic components and chipboards, and not further down into the
individual elements of those parts. A relatively high fraction of studies also used the
category “composite materials.” Composite materials can refer to any complex
assemblies containing interconnected metals and plastics, which are not
mechanically separable into homogeneous material fractions. These include electrical
parts with interconnected materials, such as printed circuit board (PCB), motors, and
CD drivers (Chancerel and Rotter, 2009).
3 polystyrene & high-impact polystyrene 4 acrylonitrile butadiene styrene 5 polyvinyl chloride 6 Most studies consulted also considered them in one category “glass or ceramics.” 7 although ideally, from a resource value point of view, they should be separated

21
In cases where sufficient information could not be obtained, these composite
materials were classified as “other” along with minor miscellaneous materials.
However, when the components of the breakdown could be identified as PCB or
other similar electronic parts, the average material content of a PC motherboard,
provided by Brady et al. (2003), was applied for the analysis. According to Brady et
al. (2003), for most compounds, only minor differences were observed between the
material content of one appliance’s circuit board to the other. Therefore, in this study,
the material breakdown from of an average computer PCB from Brady et al. (2003)
was assumed to be constant for all types of circuit boards and applied not only to
computers but to other types of appliances equally. This method was employed
particularly for the reconstruction of data provided by Townsend et al. (2004) and
also for data from several other studies.
3.4. Price Data
Many of the historical price data was obtained from The value of a dollar :
prices and incomes in the United States, 1860-2009 by Derks (2004). For
refrigerators/freezers and washing machines, most of the price data were taken
originally from the ratings reports published in Consumer Reports magazine, as
compiled and reported by Horie (2004) and Bole (2006), respectively. All historical
prices were adjusted for inflation to the 2011 level and converted to USD. Most of
the historical raw material prices were taken from the data provided by the United
States Geological Survey (USGS).
22
IV. RESULTS
1. Refrigerator-Freezers
Various types of refrigerator-freezers were considered for the study. Here, the
results for the typical Japanese refrigerator-freezers and western (primarily based on
American) refrigerator-freezers are presented. These were analyzed separately due to
the consistent differences in their weight and material composition.
Weight and Material Composition
While the main material constituent of the American (and also European)
refrigerator-freezers is ferrous metals, at an average of about 65%, the Japanese
counterparts contain less ferrous metals and about the same amount of plastics, both
around 40-50%. The American appliances were also much larger and heavier,
averaging around 120kg, whereas the Japanese ones averaged around 70kg. The
difference is most likely due to the difference in the size and spaciousness of
households in the US and Japan. The Japanese manufacturers use much more plastic
and less ferrous metals in order to keep their appliances smaller and lighter to fulfill
the Japanese consumers’ preferences and make them suitable for the Japanese
kitchens, typically limited in space.
From the late 1940s to 1970s, especially in the US, the average refrigerator-
freezers overall became more multi-functional and larger in size, keeping up with the
advancing technology and consumer demand for more storage space. However, the
development in the functions and the average size of refrigerator-freezers seems to
have peaked and settled down around the 1980s, and since then, trends show that
both the size/weight and the material composition have remained more or less
constant (Street, 2011). The results from this study, covering the time period 1982-
1998 over the two categories, confirmed this pattern. Figure 1 shows the weight and
material composition of US refrigerator-freezers from 1990 to 1998. Figure 2 shows
the weight and material composition of Japanese refrigerator-freezers from1982-
1998. In neither Japanese nor American refrigerator/freezers, no major differences in
weight or material composition were observed over time during this period.

23
This is also in agreement with the findings and assumptions of Horie (2004),
who states that there have been no major shifts in the material composition of
refrigerator-freezers for decades. The only exception is the change in refrigerant
following the banning of the ozone-depleting substances by the Montreal Protocol,
which entered into force in 1989, but the change in both the material composition
and the total weight was found to be negligible in the comparison of appliances
before and after the implementation of the Protocol.
Figure 1. US Freezer-Refrigerator Weight & Material Composition [kg]
Figure 2. Japanese Freezer-Refrigerator Weight & Material Composition [kg]
[kg]
[kg]

24
Prices and Values
In terms of market prices, Dale et al. (2009) conducted a study on the
changing efficiency levels and price trends of major appliances including
refrigerators and washing machines. It was found that although the analysts of the
Department of Energy had predicted the appliance prices to increase in response to
efficiency gains by the market, the actual trends actually revealed that between 1970
and 2000, refrigerator and washing machine prices in the market declined while
appliance efficiencies increased. The process of technological change is assumed to
be responsible for this contradiction, in which overall production costs, especially for
high-efficiency appliances, are decreasing over time. This trend of the inflation-
adjusted prices decreasing through time was found in all four appliance types tested
in the study8. In the time period covered in this study, the prices did not show any
decreasing trend but rather stayed more or less constant in both categories. The
developments in market price, material price, and weight for both Japanese and
American machines are shown in Figure 9 and Figure 10. In both figures material
prices have been multiplied by a factor of 10 in order to make it visible on the figure
and to make the comparison easier. Hypothetical dashed lines have been used to fill
in the gap where no data were available.
As for material prices, Figure 3 and Figure 4 show that the total value of
materials in both the American and Japanese appliances shows a declining tendency.
This can most likely be explained by the role played by plastics. The American
appliances contain on average about 20% plastics, and the Japanese appliances are up
to 56% made of plastics. The main ingredients of plastics are oil and natural gas, and
consequently their prices are largely influenced by the price movements of oil and
gas. The oil and gas prices were generally on a decreasing trend during the period in
the 80s and 90s, which thus reduced the cost of plastics production. The prices of the
other materials have remained relatively unchanged during this period.
8 The other two appliances were room air conditioners and central air conditioners.

25
Normally, a constant size and material composition coupled with decreasing
market prices would suggest an increasing trend in the relative value of materials –
the percentage that the total value of the raw materials occupy in the overall value, i.e.
the market price, of the appliance. However, in this case, because the total material
prices also decreased along with the market prices, the result seen was a decrease in
the relative value of materials, as shown in Figure 5 and Figure 7.
Figure 3. Material Value [USD] of US Freezer-Refrigerators
Figure 4. Material Value [USD] of Japanese Freezer-Refrigerators

26
When visualized in the context, however, it becomes clear that the changes in
the price of raw materials are quite insignificant. Figure 6 and Figure 8 display the
relative value of materials on a 100% scale. For both the US and Japanese appliances,
the percentage value of raw materials, which fluctuates between about 3% and 6%
(as indicated in Figure 5 and Figure 7), is a mere fraction of the final market value
placed on the appliances.
Figure 5. Material Value of US Freezer-
Refrigerator as a % of Market Price
Figure 6. Material Value of US Freezer-
Refrigerators on a 100% Scale
Figure 7. Material Value of Japanese
Freezer-Refrigerator as a % of Market Price
Figure 8. Material Value of Japanese
Freezer-Refrigerator on a 100% Scale

27
2. Washing Machines
Weight and Material Composition
Washing machine data were collected for the machines manufactured
between 1978 and 2004. Figure 11 shows the weight and the material composition of
washing machines, and the trends shown widely agrees with the observations made
in the study by Bole (2006). In his life-cycle study on washing machines, Bole found
that material composition data for washing machines over time strongly indicates
Figure 10. Development in Market Price, Material Price [USD], and Weight
[kg] of Japanese Freezer-Refrigerators over time
Figure 9. Development in Market Price, Material Price [USD], and Weight [kg]
of US Freezer-Refrigerators over time
[kg]
[kg]

28
that lighter materials, such as aluminum and polymers, are increasingly being
favored over heavier materials, mainly ferrous metals. While an average washing
machine manufactured in the late 1980s weighed about 84kg and contained over
80% steel and cast iron and 6% plastics, average washing machines from the 1990s
and early 2000s contain about 50% ferrous materials and more than twice the amount
of plastics on average. These shifts in material use can also be confirmed in the
material composition changes shown in Figure 11. The use of the other main
materials, i.e. aluminum, copper, and glass/ceramics, remained relatively stable.
In his study Bole (2006) also noted a growing tendency towards lighter-
weight machines. A decreasing trend in the overall weight of the machines over time
can also be seen in this study, however, only on a rather small scale. Comparing the
1978 breakdown data to those of later years, it can be assumed that the weight-factor
provided by ferrous metals in the earlier days was presumably replaced by the use of
concrete. Although the 1978 machine contained no concrete, the later machines
contain up to almost 30% concrete in weight. The average weight of the machine
during this time period remained at around 80kg.
Figure 11. Washing Machine Weight & Material Composition [kg]
[kg]
29
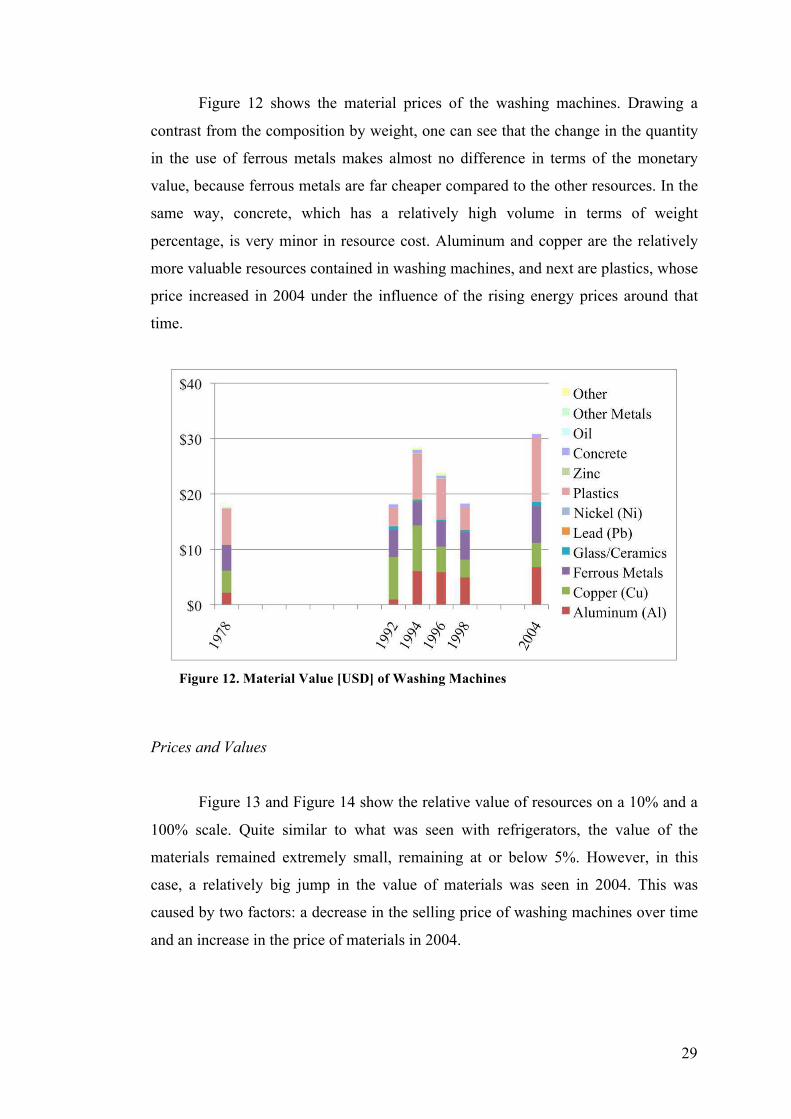
Figure 12 shows the material prices of the washing machines. Drawing a
contrast from the composition by weight, one can see that the change in the quantity
in the use of ferrous metals makes almost no difference in terms of the monetary
value, because ferrous metals are far cheaper compared to the other resources. In the
same way, concrete, which has a relatively high volume in terms of weight
percentage, is very minor in resource cost. Aluminum and copper are the relatively
more valuable resources contained in washing machines, and next are plastics, whose
price increased in 2004 under the influence of the rising energy prices around that
time.
Prices and Values
Figure 13 and Figure 14 show the relative value of resources on a 10% and a
100% scale. Quite similar to what was seen with refrigerators, the value of the
materials remained extremely small, remaining at or below 5%. However, in this
case, a relatively big jump in the value of materials was seen in 2004. This was
caused by two factors: a decrease in the selling price of washing machines over time
and an increase in the price of materials in 2004.
Figure 12. Material Value [USD] of Washing Machines

30
Figure 15 shows the development in market price, material price, and weight
of washing machines. Material prices have been multiplied by a factor of 10, and
hypothetical dashed lines have been used to fill in the gap where no data were
available. It is interesting to see that the market price of the machines continuously
decreased through time and was at the relative lowest in 2004, despite the total cost
of resources being highest that year. A couple possible explanations may exist for
this event. First, in the pursuit of manufacturing lighter machines, the cheaper
materials (i.e. ferrous metals, concrete) are being replaced by materials that are
relative more costly and/or have unstable prices, namely plastics and also aluminums.
Secondly, as discussed earlier in the freezer-refrigerator section, Dale et al. (2009)
has shown that major appliances are decreasing in market prices while increasing in
efficiency. Again, technological advancement and the resulting reduction in
production costs can be considered to be responsible for this trend. Ultimately,
however, even taking into consideration the increase in 2004, Figure 13 and Figure
14 show that the relative overall value of the resources still remains very low.
Figure 14. Material Value of Washing
Machines on a 100% Scale
Figure 13. Material Value of Washing Machines
as a % of Market Price

31
Another point that should be noted in terms of metals used and the material
values contained within for washing machines, as well as possibly for refrigerators,
is the fact that these machines do not require a high processing power and therefore
even today contain only a relatively small amount of complicated electronics. Unlike
computers and mobile phones, which contain high-tech and high-value circuit boards,
washing machines and refrigerators are mostly composed of low-cost laminates
containing fewer valuable materials (Hester and Harrison, 2009). This means that
presumably, what makes up the bulk of the actual market price of these appliances
are not the raw materials themselves but rather the technologies and the
manufacturing processes, and therefore, even relatively large changes in the prices of
resources should not lead to significant changes in the market value.
3. Televisions and Monitors
3.1. CRT Displays
Cathode Ray Tube (CRT) televisions and monitors can obviously vary
largely in sizes. In order to keep the comparison simple, for this study CRT data
collection was controlled to a more or less limited range, between 15 and 21 inches,
with the exception of 1982, for which only data from a 9-inch display could be found.
Figure 15. Development in Market Price, Material Price [USD], and Weight [kg]
of Washing Machines over time
[kg]

32
1986 is 16 inches, 1988 is 15 inches, and all data from the 1990s are for a 21-inch
display.
Weight and Material Composition
Figure 16 shows the weight and material compositions of CRT displays. Even
though the size of the display increased from 1986 to 1998, the total weight of the
product slightly declined. This could be due to a relatively less use of heavier ferrous
metals or perhaps simply a change in the preferred style and design, such as the outer
frame and the addition/removal of leg stands. Even among the CRT monitors and
televisions sold today, some degrees of weight variance can be observed within the
same sized displays, depending on the design.9 As for the material composition, there
seems to be a declining tendency in the amount of ferrous metals, which again may
account for the decline in the overall weight. The amount of tin contained also
showed a declining tendency. The relative share of plastics remained stable with
perhaps a very slight increasing tendency. One observation worth mentioning is that
although these data are from the pre-RoHS Directive days, it appears that the use of
lead was decreasing already.
10
9 The same can be said about the flat panel displays. 10 The small size of the CRT in 1982 is due to the fact that only data from a 9-inch display could be
found, while the others are between 15 and 21 inches.
Figure 16. CRT Displays Weight & Material Composition [kg]
[kg]

33
Prices and Values
Figure 17 shows the value of the materials. Several interesting observations
can be made about the material price data for CRT. First of all, one notices a
relatively large share of tin in the value, especially in 1986. This is partly due to the
CRT from 1986 containing a relatively higher amount of tin at 1.8% compared to
later years (less than 1% after 1994), but also because the price of tin was much
higher in 1986 and then continued to decline throughout the 90s. Although
glass/ceramics and plastics together account for the majority of the percentage
weight in composition, neither are very expensive materials and therefore are much
less important when considering the material value of the products. What gives the
largest price value to CRT monitors is actually a material that is only contained in an
infinitely small amount – averaging at about 0.006% and not even visible in the
material composition graphs of Figure 16: gold. Gold is a precious metal that is
consistently tremendously high in value, and even when it is contained in such a
miniscule amount, it can make up the majority of the monetary resource value of a
product. It can also be said that CRT displays do not contain any other precious
metals very high in value, with the exception of silver, but the price of silver is on
average 50-60 times less than the price of gold.
11
11 Note that for 1982 a 9-inch display has considered (while the others are between 15 and 21 inches).
Figure 17. Material Value [USD] of CRT Displays

34
The total material price shows a much stronger decreasing tendency than the
average weight, especially between 1994 and 1998. This can be attributed to the
generally decreasing trend shown by some of the price-relevant resources, namely
copper, glass/ceramics, and gold, during the latter half of the 90s.
12
As for the total resource value as a percentage of the market price, Figure 18
and Figure 19 show that there is an overall increasing trend from the 80s to the 90s,
then stabilizing, perhaps slightly decreasing, in the 90s. This can be explained by the
fact that along with the overall decrease in the value of resources during that time,
the average market price of CRT displays also went down. The stable decline in the
market price of CRT may be the result of the emerging competition from the new
technology offered in the form of flat-panel displays. Once again, however, although
slightly higher than the figures for washing machines and refrigerators, the overall
value of resource prices for CRT remained quite low, no more than 7% and
averaging at about 6%. The overall development in market price, material price, and
weight of CRT displays is shown in Figure 20.
12 Note that for 1982 a 9-inch display has considered (while the others are between 15 and 21 inches).
Figure 18. Material Value of CRT Displays
as a % of Market Price
Figure 19. Material Value of CRT Displays
on a 100% Scale

35
13
3.2. Flat Panel Displays
In order to keep the comparison consistent, data from 20-inch flat panel
displays were used for all three years 1997, 1999, and 2003. Screens larger than this
size (22 inch and above) did not appear widely on the market until around 2000 and
did not become commercially viable for most people until a few years later.
Weight and Material Composition
First of all, the biggest and the most obvious difference between a CRT
display and a flat panel display in their appearance and structure, as the name of the
latter suggests, is in its horizontal dimension. Its thinness, and consequently the
lightness in weight, is the single biggest advantage of flat panels over CRTs. This
advancement in technology means that although they ultimately serve the same
function – to transmit images – there are substantial differences between flat panel
displays (FPDs) and CRTs in terms of their material composition and therefore,
possibly, implications to the relative value of resources.
Flat panel displays were still relatively new on the market in the late 1990s
and continued to undergo major developments well into the late 2000s. This was
primarily reflected in the rapidly decreasing prices, particularly for the large sized
13 Note that for 1982 a 9-inch display has considered (while the others are between 15 and 21 inches).
Figure 20. Development in Market Price, Material Price [USD], and Weight of CRT
Displays over time
[kg]
36
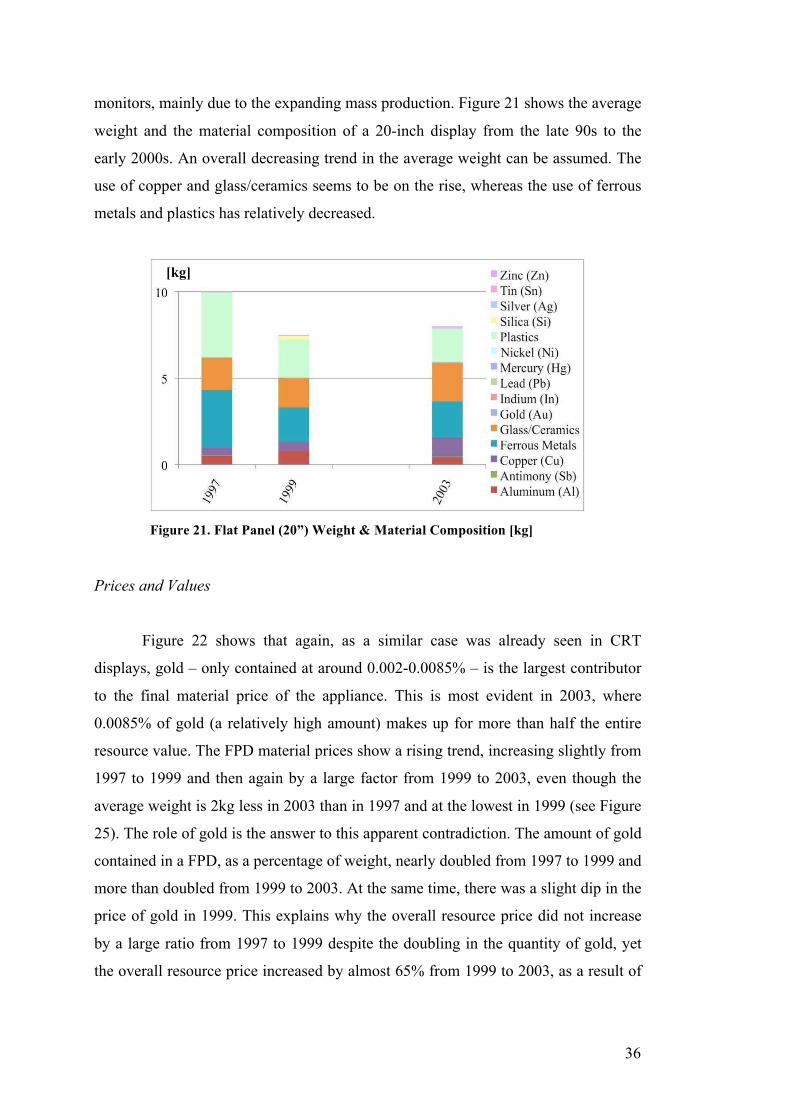
monitors, mainly due to the expanding mass production. Figure 21 shows the average
weight and the material composition of a 20-inch display from the late 90s to the
early 2000s. An overall decreasing trend in the average weight can be assumed. The
use of copper and glass/ceramics seems to be on the rise, whereas the use of ferrous
metals and plastics has relatively decreased.
Prices and Values
Figure 22 shows that again, as a similar case was already seen in CRT
displays, gold – only contained at around 0.002-0.0085% – is the largest contributor
to the final material price of the appliance. This is most evident in 2003, where
0.0085% of gold (a relatively high amount) makes up for more than half the entire
resource value. The FPD material prices show a rising trend, increasing slightly from
1997 to 1999 and then again by a large factor from 1999 to 2003, even though the
average weight is 2kg less in 2003 than in 1997 and at the lowest in 1999 (see Figure
25). The role of gold is the answer to this apparent contradiction. The amount of gold
contained in a FPD, as a percentage of weight, nearly doubled from 1997 to 1999 and
more than doubled from 1999 to 2003. At the same time, there was a slight dip in the
price of gold in 1999. This explains why the overall resource price did not increase
by a large ratio from 1997 to 1999 despite the doubling in the quantity of gold, yet
the overall resource price increased by almost 65% from 1999 to 2003, as a result of
Figure 21. Flat Panel (20”) Weight & Material Composition [kg]
[kg]

37
the increase in both the quantity and price of gold. This again highlights the
importance of gold as a valuable material and illustrates that due to its vastly high
cost, even a small change in the price and/or in the amount of gold used may cause a
visible shift in the material price.
The two other metals that show a similar presence in Figure 22, though on a
smaller scale, are silver and indium. Both of these are considered precious metals,
though not nearly as costly as gold. As it was already mentioned under the discussion
on CRT displays, silver is priced 50-60 times less than gold on average. The price of
indium used to be comparable to that of silver, but its value began rising in the 90s,
spiked in mid 2000s, and still remains high today. This is in direct response to the
rapidly increasing consumption of indium, most intensely in the FPD industry itself
but also in other industries e.g. the photovoltaic sector (Böni and Widmer, 2011).
The other major price constituents are plastics, copper, and aluminum. None of these
are particularly high in value, and especially plastics have a relatively low price, but
its sizable quantity makes a contribution to the overall value. One thing to perhaps
keep in mind, as will be discussed later, is that the price of plastics is not stable and
therefore uncertain how cheap it will remain depending on the movements in the oil
and gas prices.
Figure 22. Material Value [USD] of 20” Flat Panel Displays

38
Figure 23 and Figure 24 show the relative resource values on a 10% and a
100% scale. A relatively big increase in the resource value percentage in 2003 is
caused by a combination of a decrease in the market price (see Figure 25) and an
increase in the price of materials, similar to what was seen in the 2004 data of
washing machines.
What becomes evident in Figure 23 and Figure 24, however, is the
surprisingly miniscule share of the resources in the overall value of FPDs, far lower
than what has been seen with washing machines, refrigerators, or CRTs. This may be
shocking at a first glance, given the technology, presumably more advanced than
CRT displays, involved in the manufacturing of FPDs. However, factors such as the
cost of research & development and the leading manufacturing processes are simply
not reflected in the value strictly based on materials. As far as the resources are
concerned, although there are clear changes in the material composition between
CRT and FPD, the new technology for FPD did not necessarily require the use of
large amounts of expensive materials. From the perspective of resource use, the
technological changes from CRT to FPD primarily required a reshuffling of shares in
the three major materials: ferrous metals, glass/ceramics, and plastics, all of which,
seen from a larger perspective, happen to be quite close in prices and not very costly.
One crucial difference in the composition of CRT and FPD is in the use of the
precious metal indium, but its application appears to be small enough in quantity that
it does not have a significant impact on the overall resource costs.
Figure 23. Material Value of 20” Flat Panel
Displays as a % of Market Price
Figure 24. Material Value of Flat Panel
Displays on a 100% Scale

39
However, given that the flat counterpart is significantly lighter and requires
much less resources in absolute quantity than the traditional CRT displays, this
means that the total absolute value of resources will be far lower for flat panels than
for CRTs, despite the much higher market prices. Even given the rapidly shrinking
market prices of flat panels (see Figure 25), the percentage share of resource cost in
the overall cost still remained less than 2% in 2003. Figure 25 shows the
development in market price, material price, and weight of FPDs over time. Material
prices have been multiplied by a factor of 50, and hypothetical dashed lines have
been used to fill in the gap where no data were available.
Although this study only covers up to 2003, the FPD industry has continued
to develop rapidly, and as of 2011, the prices of FPDs including the largest screens
widely available to consumers (up to 60 inches) have mostly settled down in the
lowest possible price ranges. If an analysis were to be conducted for the relative
material value for these past several years, the percentage share of resource value
will most likely have seen an increase – particularly sharp increases for larger sized
screens – accompanying their rapid decrease in market prices. Larger screens
inevitably use a larger absolute quantity of materials, which should also increase the
relative value of resources. Even then, however, from the current observable trend, it
remains highly doubtful whether the relative value of resources will ever become
significant enough to matter in the consideration of the actual market price.
Figure 25. Development in Market Price, Material Price [USD], and Weight [kg] of
Flat Panel Displays over time
[kg]

40
4. Computers
4.1. Desktops
All desktop computer data used for this study include an average 17-inch
CRT monitor.
Weight and Material Composition
Figure 26 shows that the total weight of desktop computers, including both
the actual computer part and the monitor, declined in the 1990s and seems to have
more or less stabilized in the 2000s. As discussed earlier, the weight of CRT
monitors showed a decreasing tendency in the 1990s, thus the change in the weight
of the monitor part may account for the decrease in the overall weight of desktops. It
is also possible that the computer part itself went through changes in weight and
material composition; however, not enough data could be obtained for the detailed
material composition of the computer part alone.
Figure 26. Desktop Computer Weight & Material Composition [kg]
[kg]

41
Compared to other appliances already discussed, it is evident that computers
are made of a much wider variety of materials, even though most of them are
contained in extremely small amounts and cannot be detected individually in the
figure. Aluminum, ferrous metals, glass/ceramics, and plastics are the consistent four
major building blocks in the composition. Also important are copper and lead,
although the lead content should presumably show a dramatic decrease in the years
following the period in this study, in response to the widening efforts to restrict their
use, e.g. the European RoHS Directive.
Prices and Values
The high variety of the materials contained in a desktop computer becomes
even more evident in Figure 27, which shows that with a higher number of materials
comes also a bigger competition and a larger division of costs among all the
materials. It also shows that computers not only contain a larger number of resources
in general but also a larger number of valuable and expensive resources that are not
found in appliances like refrigerators and televisions (which only contain, if any,
gold and silver as precious metals). These precious metals, such as palladium,
beryllium, and germanium, are not visible in the weight figure because they are only
contained in the range of 0.0003-0.01%, but they make their presence felt in the
evaluation of the value of resources. Gold, and to some extent silver, continue to
show a very strong presence in the total value.

42
Comparing Figure 27 with Figure 26, one sees that the overall resource price
of a desktop is the highest in 2004, despite the product being the lightest that year
(also see Figure 30). This is probably due to the fact that many of the resource prices
showed a sudden sizable increase in 2004 compared to the years before, the increase
percentage ranging anywhere from around 20 % up to 70%, including several of the
major price contributors, namely aluminum, copper, glass/ceramics, gold, lead, silver,
and tin. Compared to 2000, the weight of a desktop remained almost the same but the
total material price increased by almost 15%. Also in 2000 there was a huge spike in
the price of palladium, when it became about 4 to 10 times more expensive than the
other years considered in the study. As a result, palladium, which only makes up less
than 0.0003% by weight of the entire product (about the same percentage as the other
years), accounted for about 7% of the total resource value in 2000. As we have
already seen in the case of gold, with these extremely pricey materials, which are
generally only contained in trace amounts, any change in their price can impact the
resulting overall resource value of a product.
Figure 28 and Figure 29 show the relative material values on a 10% and a
100% scale. Similar to the other appliances, again one sees that the total resource
value is very small, in the range of around 1-5% of the market price. The increase of
the resource percentage share in 2004 is caused by a combination of the increase in
Figure 27. Material Value [USD] of Desktop Computers

43
the absolute value of the resources and the absolute decrease in the market price of
desktops, similar to what was observed for FPDs. Figure 30 shows the development
in market price, material price, and weight of desktop computers. Material prices
have been multiplied by a factor of 20, and hypothetical dashed lines have been used
to fill in the gap where no data were available.
Figure 28. Material Value of Desktop
Computers (with a 17” CRT monitor) as
a % of Market Price
Figure 29. Material Value of Desktop
Computers (with a 17” CRT monitor) on a
100% Scale
Figure 30: Development in Market Price, Material Price [USD], and Weight [kg] of
Desktop Computers (with a 17” CRT monitor) over time
[kg]
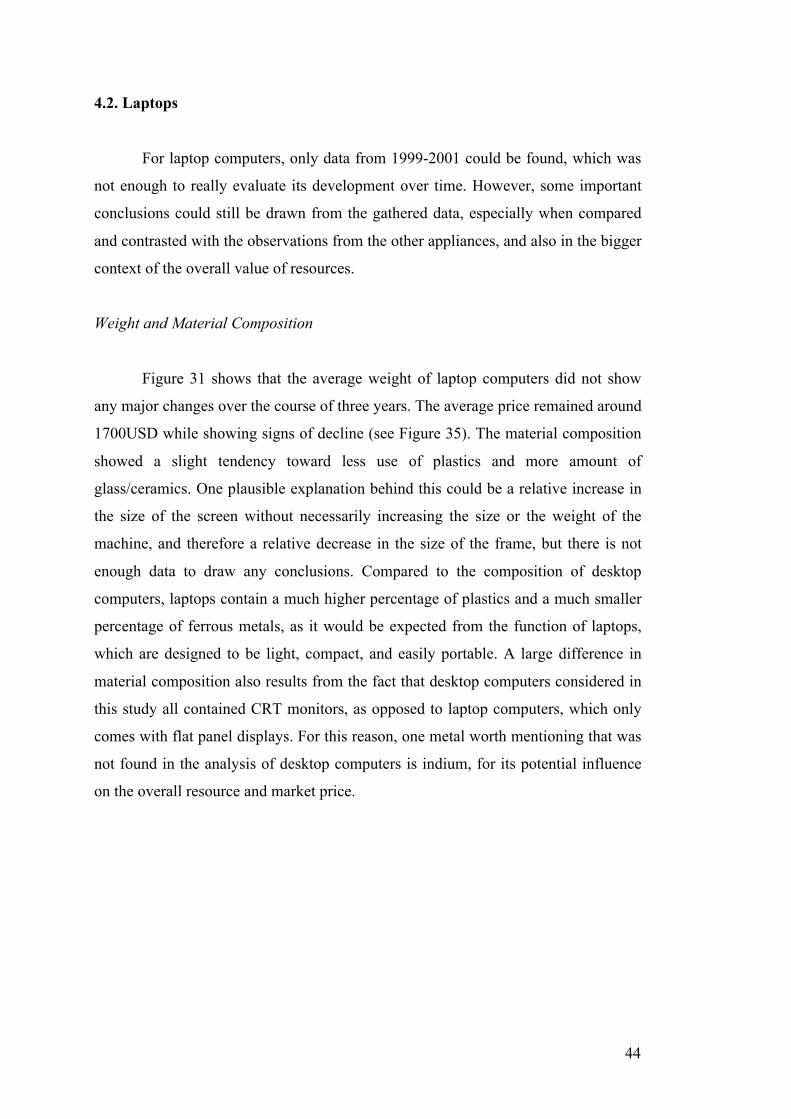
44
4.2. Laptops
For laptop computers, only data from 1999-2001 could be found, which was
not enough to really evaluate its development over time. However, some important
conclusions could still be drawn from the gathered data, especially when compared
and contrasted with the observations from the other appliances, and also in the bigger
context of the overall value of resources.
Weight and Material Composition
Figure 31 shows that the average weight of laptop computers did not show
any major changes over the course of three years. The average price remained around
1700USD while showing signs of decline (see Figure 35). The material composition
showed a slight tendency toward less use of plastics and more amount of
glass/ceramics. One plausible explanation behind this could be a relative increase in
the size of the screen without necessarily increasing the size or the weight of the
machine, and therefore a relative decrease in the size of the frame, but there is not
enough data to draw any conclusions. Compared to the composition of desktop
computers, laptops contain a much higher percentage of plastics and a much smaller
percentage of ferrous metals, as it would be expected from the function of laptops,
which are designed to be light, compact, and easily portable. A large difference in
material composition also results from the fact that desktop computers considered in
this study all contained CRT monitors, as opposed to laptop computers, which only
comes with flat panel displays. For this reason, one metal worth mentioning that was
not found in the analysis of desktop computers is indium, for its potential influence
on the overall resource and market price.

45
Prices and Values
The material price of laptops slightly decreased from 1999 to 2001, as shown
in Figure 32, and once again gold appears to be the determining factor. However, the
time period covered is not long enough to say if this could indicate an actual pattern
or not. Although not significant in absolute terms, the precious metals indium and
palladium did make visible contributions to the overall resource value, again
highlighting the recurring theme of the value of these precious metals.
Figure 31. Laptop Computer Weight & Material Composition [kg]
Figure 32. Material Value [USD] of Laptop Computers

46
A striking finding from the study of laptops, as shown in Figure 33 and
Figure 34, is that the resource value as a percentage of the market price, at around
0.4%, was the lowest of all appliances covered in this research, even lower than that
of FPDs. Given the relatively high purchase price of laptop computers, it may seem
surprising that the total cost of the ingredient materials is so low. However, this is
basically the same situation as FPDs: laptops are much smaller in size and use much
less quantities of materials than desktop computers, without a significant introduction
of any additional expensive materials, which means that the absolute value of the
product based strictly on resources is actually far smaller than that of a desktop
computer.
In general it requires higher knowledge and technology to make a product
smaller in size while maintaining its quality and efficiency. However, strictly
speaking from the resource-value-perspective, regardless of the technology behind its
manufacturing, the less quantity of materials (contained in the same ratio) naturally
equals a smaller total cost. The same scenario will be seen again for mobile phones
in the section below. Figure 35 shows the development in market price, material
price, and weight of laptop computers. Material prices have been multiplied by a
factor of 100, and hypothetical dashed lines have been used to fill in the gap where
no data were available.
Figure 33. Material Value of Laptop
Computers as a % of Market Price
Figure 34. Material Value of Laptop
Computers on a 100% Scale
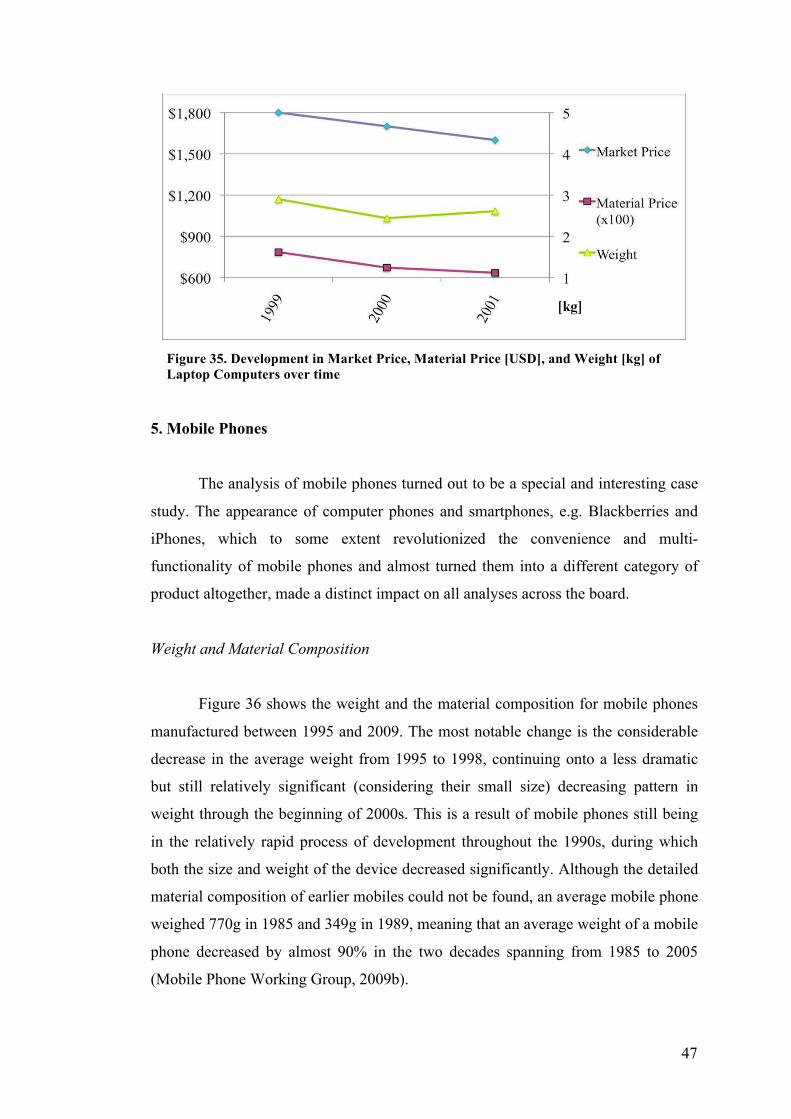
47
5. Mobile Phones
The analysis of mobile phones turned out to be a special and interesting case
study. The appearance of computer phones and smartphones, e.g. Blackberries and
iPhones, which to some extent revolutionized the convenience and multi-
functionality of mobile phones and almost turned them into a different category of
product altogether, made a distinct impact on all analyses across the board.
Weight and Material Composition
Figure 36 shows the weight and the material composition for mobile phones
manufactured between 1995 and 2009. The most notable change is the considerable
decrease in the average weight from 1995 to 1998, continuing onto a less dramatic
but still relatively significant (considering their small size) decreasing pattern in
weight through the beginning of 2000s. This is a result of mobile phones still being
in the relatively rapid process of development throughout the 1990s, during which
both the size and weight of the device decreased significantly. Although the detailed
material composition of earlier mobiles could not be found, an average mobile phone
weighed 770g in 1985 and 349g in 1989, meaning that an average weight of a mobile
phone decreased by almost 90% in the two decades spanning from 1985 to 2005
(Mobile Phone Working Group, 2009b).
Figure 35. Development in Market Price, Material Price [USD], and Weight [kg] of
Laptop Computers over time

48
Excluding the data from 1995, before the mobile phone composition had
more or less fully matured and stabilized, the single most prominent material, both
by weight and volume, in the composition of mobile phones from around the end of
1990s is plastics. This confirms the findings of Doctori Blass et al. (2008) and
Mobile Phone Working Group (2009b). In the composition from 1995, copper held
the largest share at 37%, and plastics was in second place at 28%. The much heavier
earlier devices from the 1980s presumably contained a larger ratio of heavier
materials, such as ferrous metals.
A relatively decreasing tendency was seen in the application of aluminum,
copper, and ferrous metals until the early 2000s, after which it increased again,
which is most likely explained by the emergence of smartphones on the market. The
relative quantity of glass/ceramics shows an increasing tendency almost throughout
the time period, and this can most likely be attributed to the strong preference toward
larger screens, which was realized over the years.
A more or less continuous decrease in the percentage weight application of
lead can also be observed. The 1995 data contained nearly 5% of lead, which went
down to 3% by 1998, and then became less than 1% in 1999. Although too small in
the absolute amount to be detected from the figure, there was a huge downward jump
Figure 36. Mobile Phone Weight & Material Composition [g]
[g]

49
in the lead content between 2003 and 2005, from 0.35% to 0.03%. This
predominantly supports the data published by Motorola (2007) on its website
concerning the environmental performance of their best-selling products from 2001,
2006, and 2007. According to this information, the lead content in the given handsets
decreased from 0.37% in 2001 to 0.013% in 2006 and even further down to 0.004%
in 2007. The average 2009 phone considered in this research contained no detectable
amount of lead. The decrease in lead has been primarily driven by consumer demand
and legislative changes due to lead’s toxicity. Following the implementation of the
RoHS Directive in 2006, no more lead should be detected in any mobiles (or any of
the other EEE covered under the legislation) sold within Europe, and the use of lead
eventually is most likely to be phased out globally.
Motorola (2007) also published the data for the decreasing content of other
RoHS substances in the same years (2001, 2006, 2007), from 0.37g to 0.0106g to
0.0037g, respectively. In almost none of the phones analyzed for this research could
mercury and cadmium (both covered under the RoHS Directive) be detected even
from the early years.
Prices and Values
The market price trend of mobile phones included in Figure 40 shows that the
market price continued to be on the decline throughout the 1990s and into the mid
2000s, as would be expected as the natural result of maturing technology and
increasing market saturation. This decreasing price curve rebounded back to an
upward trend around 2003 and continued up sharply, and although not covered in
this study, the surge in the average price of mobiles becomes even more evident
when looking at the most recent data beyond 2009. The market growth in advanced
multifunctional phones is the driver behind the price surge.
In the early to mid 2000s, smartphones were still very expensive and not
widely used. Even at the beginning of 2007 smartphones only made up about 1.7%
of the US market. Halfway into 2008, however, meaning in just over a year, the share
had grown to 6.3%. As these devices typically cost vastly more than the regular
handset, even with a small market share, they have a big enough impact to boost the
overall average market price. In a survey released by J.D. Power and Associates in

50
May 2008, consumers were paying $10 more on average for their handset compared
to just six months earlier, marking the biggest jump in the average sale price of
mobile phones in the previous two years (Reardon, 2008).
In another survey conducted by J.D. Power and Associates in 2010, the
average price of non-smart, traditional mobile phones were reported to be decreasing.
This was partially attributed to promotional discounts given by providers and
wireless service carriers, but it can also be seen as a result of the competition, in
which consumers place a much higher relative value on the new multifunctional
phones and the manufacturers see the traditional handsets as a shrinking market
(Cassavov, 2010). At the time of the 2008 survey, even the more affordable
smartphones cost about $208, while regular phones cost about $58 (Reardon, 2008).
In reviewing the financial reports from various phone companies, when the share of
smartphones was included, most companies had much higher average prices for their
products in the late 2000s (Mobile and Gadget Review, 2011).
Figure 37 shows the material value of mobile phones and contains several
points to be noted. Compared to 1995, the resource price of mobile phones decreased
by half to one-third in the years between 1998 and 2003. The price in 1995 was
relatively quite high simply because those earlier models of mobile phones were still
rather large and used higher quantities of materials. However, following this rapid
decrease and the subsequent low price years, the material price then soared between
2003 and 2005 and presumably continued to increase, hitting a major high in 2009.
Although the timing correlates very closely, strictly speaking, it is not the arrival of
smartphones per se that is responsible for this transformation in resource costs. In the
context of resources, more precisely, the event responsible for this phenomenon is
the introduction of touchscreen phones.
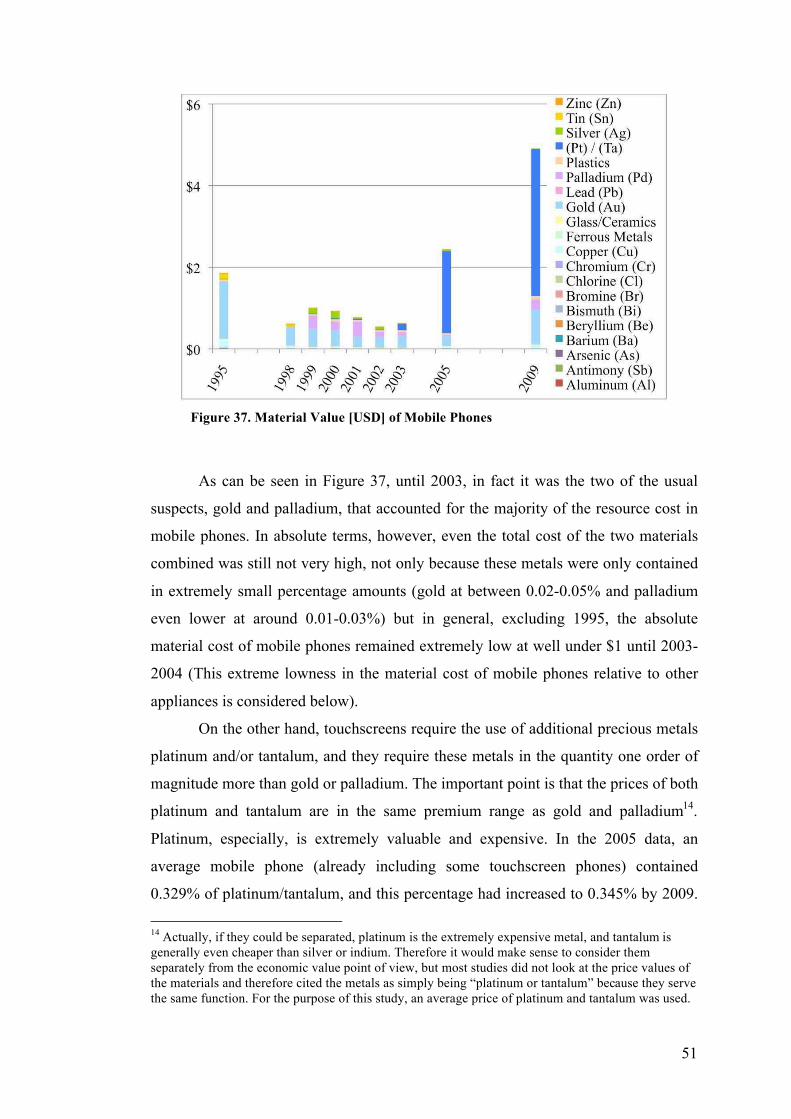
51
As can be seen in Figure 37, until 2003, in fact it was the two of the usual
suspects, gold and palladium, that accounted for the majority of the resource cost in
mobile phones. In absolute terms, however, even the total cost of the two materials
combined was still not very high, not only because these metals were only contained
in extremely small percentage amounts (gold at between 0.02-0.05% and palladium
even lower at around 0.01-0.03%) but in general, excluding 1995, the absolute
material cost of mobile phones remained extremely low at well under $1 until 2003-
2004 (This extreme lowness in the material cost of mobile phones relative to other
appliances is considered below).
On the other hand, touchscreens require the use of additional precious metals
platinum and/or tantalum, and they require these metals in the quantity one order of
magnitude more than gold or palladium. The important point is that the prices of both
platinum and tantalum are in the same premium range as gold and palladium14.
Platinum, especially, is extremely valuable and expensive. In the 2005 data, an
average mobile phone (already including some touchscreen phones) contained
0.329% of platinum/tantalum, and this percentage had increased to 0.345% by 2009.
14 Actually, if they could be separated, platinum is the extremely expensive metal, and tantalum is
generally even cheaper than silver or indium. Therefore it would make sense to consider them
separately from the economic value point of view, but most studies did not look at the price values of
the materials and therefore cited the metals as simply being “platinum or tantalum” because they serve
the same function. For the purpose of this study, an average price of platinum and tantalum was used.
Figure 37. Material Value [USD] of Mobile Phones
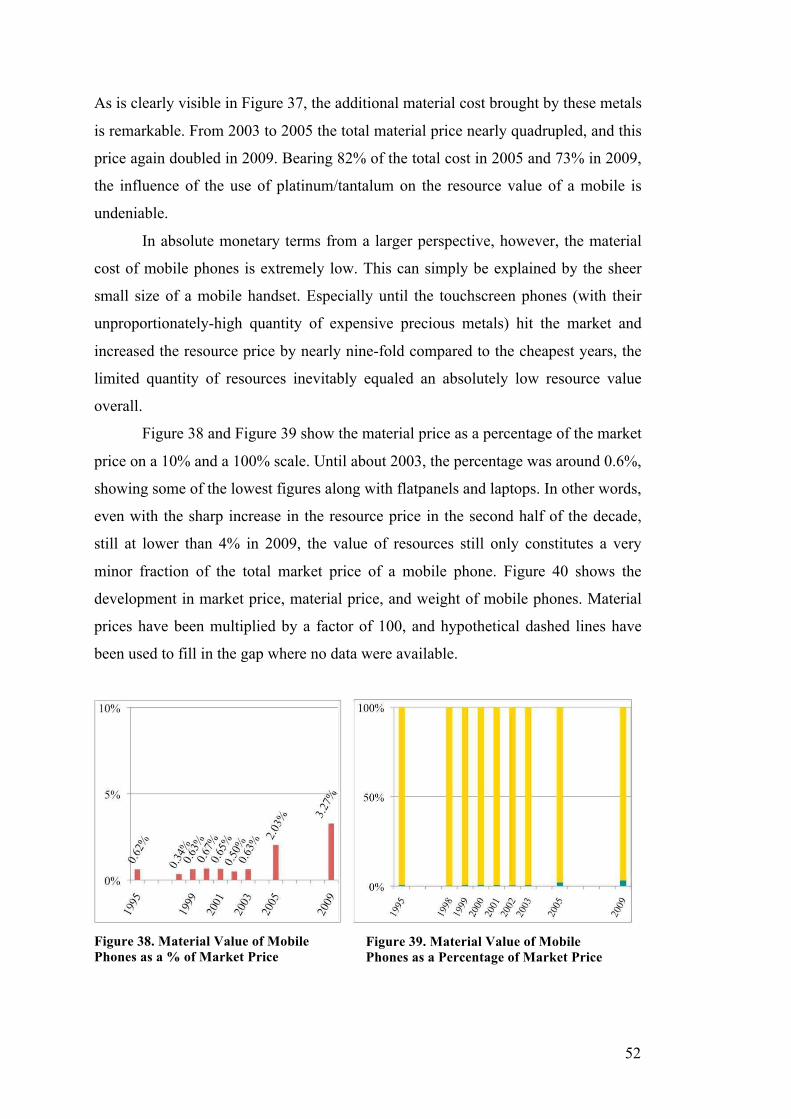
52
As is clearly visible in Figure 37, the additional material cost brought by these metals
is remarkable. From 2003 to 2005 the total material price nearly quadrupled, and this
price again doubled in 2009. Bearing 82% of the total cost in 2005 and 73% in 2009,
the influence of the use of platinum/tantalum on the resource value of a mobile is
undeniable.
In absolute monetary terms from a larger perspective, however, the material
cost of mobile phones is extremely low. This can simply be explained by the sheer
small size of a mobile handset. Especially until the touchscreen phones (with their
unproportionately-high quantity of expensive precious metals) hit the market and
increased the resource price by nearly nine-fold compared to the cheapest years, the
limited quantity of resources inevitably equaled an absolutely low resource value
overall.
Figure 38 and Figure 39 show the material price as a percentage of the market
price on a 10% and a 100% scale. Until about 2003, the percentage was around 0.6%,
showing some of the lowest figures along with flatpanels and laptops. In other words,
even with the sharp increase in the resource price in the second half of the decade,
still at lower than 4% in 2009, the value of resources still only constitutes a very
minor fraction of the total market price of a mobile phone. Figure 40 shows the
development in market price, material price, and weight of mobile phones. Material
prices have been multiplied by a factor of 100, and hypothetical dashed lines have
been used to fill in the gap where no data were available.
Figure 38. Material Value of Mobile
Phones as a % of Market Price
Figure 39. Material Value of Mobile
Phones as a Percentage of Market Price

53
Figure 41, Figure 42, and Figure 43 show the overall average weight and
material composition of all appliances reviewed in the study. They have been
separated for convenience according to the range of their weights.
Figure 41. Overall Average Weight & Material Composition [kg] of JP&US Freezer-
Refrigerator and Washing Machine
Figure 40. Development in Market Price, Material Price [USD], and Weight [kg] of
Mobile Phones over time
[kg]
[kg]

54
Figure 42. Overall Average Weight & Material Composition [kg] of CRT Display, Flat
Panel Display, Desktop Computer, and Laptop Computer
Figure 43. Overall Average Weight & Material
Composition [g] of Mobile Phone
[kg]
[g]

55
V. DISCUSSIONS
Findings from the analysis of these various categories of products provide
some insights into the value of resources in consumer and household electrical and
electronic appliances.
1. The resource value as a percentage of the market price does not necessarily show
a decreasing trend through time.
The original hypothesis expected a declining trend in the relative value of the
resources, as the composition of our electronic appliances became more complex; the
number of materials used increased; and the roles of skilled labor, technical
knowledge, and innovations in design and manufacturing incurred more costs as they
gained more prominent positions in the total creation process of a product. However,
in reality almost all appliances actually showed an increasing trend in the relative
resource value. It can be assumed that this is because the market price in the
electronics industry tends to decrease very rapidly as the production volume
increases, and this effect seems to trump all other factors influencing the relative
value of resources. The falling market price coupled with increasing material value
percentage was seen in washing machines, CRT displays, flat panel displays, desktop
computers, laptop computers15, and mobile phones (see Figure 20, Figure 25, Figure
30, Figure 35, Figure 40).
The other factors – i.e. weight, material composition, and material prices –
have no set patterns in their development and sometimes give opposing influences,
therefore making it difficult to determine any systematic trends in their combined
effects on the value of resources. In the electronics industry, technological
advancement sometimes means higher efficiency offered in smaller sizes, as
exemplified by computers and phones. On the other hand, in some appliances like
flat panel displays, it is the ability to produce larger screens that results from progress.
Material prices both affect and are affected by the developments in the electronics
industry.
15 For laptop computers, actually the material value percentage almost stayed constant, but this is
probably because the time period covered was too short for a real pattern detection. The average
market price, however, did decrease at least over the two years reviewed.

56
2. If the product contains highly precious metals, then these precious metals
generally dominate the overall material price of the product.
In this study, this case was seen for the metals gold, palladium, and
platinum/tantalum 16 . In particular the premium prices of gold, palladium, and
platinum are far beyond the price of most of the materials and could climb up to
$30,000,000/ton, therefore constituting the majority of the total material price even if
they are only contained in the smallest quantities. This dominating effect becomes
stronger the smaller an appliance becomes, as the amount of materials used in
casings, which are relatively cheaper, decrease. However, as discussed further in the
points below, they only play a significant role in relative terms, within the value of
contained resources. These precious metals are contained in almost undetectably
miniscule quantities – generally one hundredths of a percent (by weight) or lower –
keeping in mind that the relative value of resources in a product is already so small to
begin with.
3. The calculated resource price of an electronic appliance is extremely small in
comparison to the market price of the appliance.
This phenomenon was observed in every appliance that was studied. The
actual percentages varied from 7.64% in a 1994 CRT display to 0.34% in a 1998
mobile phone, but this means that in none of the categories did the total material
price reach even one-tenths of the price the appliance is generally given on the
market. The resulting question, then, is: what are the factors that make up the rest of
the bulk of the cost of an appliance? The other elements that bring cost to a product
include e.g. the cost of research and development, manufacturing processes, and
marketing. The next and even more interesting question is: which one of those
factors are the biggest contributors to the final market price of an appliance? The
answer will require an extensive research on its own and most likely vary from
product to product.
16 In reality, if they could be separately analyzed, platinum is extremely expensive while tantalum is comparable or even cheaper than silver or indium.

57
4. In none of the products were the changes in material prices directly reflected in
the final market price.
Regardless of any relatively significant increases or decreases the resource
prices showed over time, the market price did not follow the same trend, indicating
that the market price must be controlled much more strongly by factors other than the
material prices, in agreement with the above point #3 (see Figure 9, Figure 10, Figure
15, Figure 20, Figure 25, Figure 30, Figure 35, Figure 40). In general, a newly
engineered product is very expensive when it first appears on the market, then its
price continues to decrease as improvements in knowledge and technological
efficiencies lead to mass production, then the price more or less settles down and
does not show any more large fluctuations, unless significant technological changes
take place or a completely new product replaces the function of the existing product
and eventually drives it out of the market. This general pattern was observed in the
market price trend of all appliances, and no strong correlation was seen with the
occurrences in the sphere of material prices (or material weights, for that matter).
Again, it would be expected that changes in material prices would not really affect
the final market price, if the share of the materials in the total value of the appliance
is so insignificant.
! The value of resources is insignificant in the final product, and even large-scale
increases in prices would not have any large impact on the final market price of the
manufactured products.
This is the important conclusion that arises out of the above points. Some of
the abundant and relatively cheap materials, such as ferrous metals, aluminum, and
concrete, have so far been reliably affordable through time. However, many of the
raw materials have constant and possibly large price fluctuations. The most
expensive metals tend to show stronger instability, and we have seen that the prices
of these precious metals are the major constituents of the total material prices. In
addition, the prices of some materials are dependent on the price of another material.
Plastics and glass require a lot of oil and gas in their manufacturing, and therefore
their prices are heavily dependent on the energy prices. Although plastics remained

58
relatively cheap and stable in price during much of the 80s and 90s, the price of
plastics has been rising in recent years, keeping up with the increase in the price of
oil and gas. In fact, it is not just oil/gas and the related materials, but the increasing
demand and competition have been placing a heavily upward pressure on the price of
many resources in recent years. These are the reasons why people have grown
acutely aware of the possible rise in market prices of everyday consumer products in
the future, driven by the increase in the price of resources.
However, despite such heightened concerns over the availability and price of
materials, this study refutes the possibility of any large-scale, if at all, market price
hikes as a result of rising material prices. The study consistently found that the total
value of resources contained in an appliance varies from very small to almost
negligible when compared to the actual market price of the appliance, even including
the precious metals like palladium and platinum, which are among the top priority
materials of such concerns. Furthermore, so far no valid correlations have been found
between resource prices and market prices. The results from this study strongly
indicate that the possibility of material price fluctuations leading to major impacts on
the market price of consumer EEE is highly unlikely.
5. Within the same function-category of products, the smaller an appliance is, the
less valuable it tends to be when considered in the material cost-perspective.
This is because the application of the precious and expensive metals tends to
be restricted to a certain central section of an appliance, and the amount used does
not necessarily grow in a direct correlation with the size of the machine. For example,
gold and palladium are only found in the central processing unit (CPU), or the
“brain” section of a computer system, and the size of the CPU is not very different
whether the computer part (i.e. excluding the monitor) weighs 5kg or 10kg. Similarly,
the CPU size does not differ greatly between a desktop computer and a laptop
computer, although the laptop is far smaller and lighter and uses much less quantity
of resources than a desktop. Therefore, as an appliance becomes larger, it simply
gains the extra value from the other materials e.g. plastics and ferrous metals,
therefore becoming more valuable as resources than its smaller versions. This
statement even held true in the comparison of CRT and flat panel displays, even

59
though FPDs do contain an additional precious metal, indium. In this case indium is
a relatively cheaper precious metal, and the amount used is too small to overtake the
added cost from the overall larger amounts of copper, plastics, glass/ceramics, etc. in
CRTs. Within the flat panel display category, of course this statement holds even
stronger, as the amount of indium used in a flat panel actually corresponds to the size
of the screen.
6. The smaller and more high-tech an appliance becomes, the less valuable and more
difficult it becomes for resource recovery at its end-of-life.
Excluding household appliances (refrigerators and washing machines) for
which its space capacity is one of the important factors (and possibly also the FPDs
in the largest size range), usually electric and electronic devices become smaller and
lighter but more complicated in their structure with technological advancement.
Although this increases efficiency of the device and is practical for the users, as
discussed in the above point #5, this also means that each unit will contain less
material value and therefore less potential for resource recovery. In addition, the
more complex the design and structure become, e.g. when a larger variety of
materials, each in small amounts, is intricately assembled together, the more time-
and effort-consuming it becomes to take the product apart for recycling. This
ultimately suggests that the higher the intelligence and skills that are required to
create a product (and therefore presumably the higher the market price is), the less
worth it is likely to have as potential renewable resources.
It must also be considered that compared to the larger appliances, which tend
to have longer lifetimes – on average, 5 years for televisions and 10 years for
refrigerators and washing machines – smaller IT products like computers and mobile
phones have shorter lifetimes of 2-3 years, meaning that they go obsolete and are
replaced much more quickly. This makes the number of units that must be collected
and dismantled very massive, adding even more burden to the recycling flow.
Appliances like computers and mobile phones are highly sought after as waste
products for resource recovery due to their relatively high content of precious and
expensive materials such as gold and palladium. Considered as a whole, these
60
products certainly have a very high potential value of recoverable metals, but it
requires an extensive system and large efforts to actually realize this potential.

61
VI. CONCLUSION
This research into the use and value of resources in consumer electrical and
electronic equipments showed that the relative value of materials in a product is very
low and therefore is unlikely to play a considerable role in determining the final
market price of the product. This is likely to remain to be the case even given the
ongoing widespread increase in material prices. This should give an insight into the
current situation of mass concern over the consequences of rising resource prices in
consumer products. The research also showed that the more intricate and
complicated an electronic equipment gets, the more difficult it becomes to recover its
resources at the end of its lifecycle. As the use of advanced electronic equipments is
only likely to expand, this is an issue that needs to be addressed along with the
banning of hazardous substances and the treatment of WEEE.
In this study, all types of mobile phones, from traditional handsets to
smartphones to touchscreens, were considered and analyzed altogether in the same
category. However, from the market price and resource-use point of view, the newer
phones, in particular those with touchscreens, are almost like a new entity of their
own. With the diversification in the mobile phone industry, it might be useful in the
future to conduct a separate analysis for largely different types of devices. In
particular, considering the results seen in the mobile phone study, the developments
of the value of resources within the touchscreen products might be interesting, given
its rapid growth and with the introduction of much larger products like the iPad.
Although this study focused on the value of resources physically contained in
a product, it is important to keep in mind that there are also materials that play a key
role during the manufacturing process but do not become incorporated into the
finished product. A good example of this is platinum, which was either not present or
only present in trace amounts in the composition of CRT, FPD, computers, and
mobile phones, but which is actually used intensively during the production phase of
these appliances. Therefore, it could be interesting to take a holistic approach and
analyze the value of resources of a particular product including the materials
consumed during the production phase.
Although precious metals are very costly and their prices have been hiking up
even further in recent years, so far industries have simply accepted the given price
and continued to purchase them for their production. This is because these metals

62
tend to be both irreplaceable and only required in infinitesimal amounts. Their use is
both indispensable and small enough for the demand to stay inelastic regardless of
the price augmentation. In the unlikely event that the prices do rise to the point that
they may begin visibly impacting market prices, the most likely outcome is that
technology will simply look for a substitute element or devise a completely new
alternative product altogether, as it has generally been the case in the human
commodity history. Already today, reacting to high palladium prices, technology is
answering by trying to reduce its use in electrical components by replacing it with
base metals. Technological advancement may continue to be the key to overcoming
the limit of resources.
Regarding the future developments in material composition and product
design in the electronics industry, those handling the end-of-life products are
recognizing and raising awareness on the need for simplicity in order to facilitate the
waste treatment and recycling processes. Much effort is now starting to be geared
toward developing “greener” products that use the minimum number of parts and
material type for easier disassembly, have a higher recyclability, and overall have
less impact on the environment throughout their lifecycle. In the future, this concept
of recyclability should become the focus in transforming and determining the
material composition and design of electronic appliances.

63
Bibliography
Text&Data:
Bhuie, A. K., O. A. Ogunseitan, J. D. M. Saphores, and A. A. Shapiro. 2004.
Environmental and economic trade-offs in consumer electronic products recycling: a case study of cell phones and computers. Paper read at Electronics and the Environment, 2004. Conference Record. 2004 IEEE International Symposium on, 10-13 May 2004.
Bole, Richard. 2006. Life Cycle Optimization of Residential Clothes Washer
Replacement. Master’s Thesis, University of Michigan, Ann Arbor. Chancerel, Perrine, and S. Rotter. 2009. Recycling-oriented characterization of small
waste electrical and electronic equipment. Waste Management 29 (8):2336-2352.
Derks, Scott. 2009. The value of a dollar : prices and incomes in the United States,
1860-2009. 4th ed. Amenia, NY: Grey House Pub. Hagelüken, Christian, and C. W. Corti. 2010. Recycling of gold from electronics:
Cost-effective use through ‘Desigh for Recycling’. Gold Bulletin 43 (3):209-220.
Hester, R. E., and R. M. Harrison. 2009. Electronic waste management, Issues in
environmental science and technology. Cambridge, UK: RSC Pub. Horie, Yuhta Alan. 2004. Life Cycle Optimization of Household Refrigerator-
Freezer Replacement. Master’s Thesis, University of Michigan, Ann Arbor. Mobile Phone Working Group. 2008. Mobile Phone Partnership Initiative. Guideline
document on the environmentally sound management of used and end-of-life mobile phones. Basel Convention.
Mobile Phone Working Group. 2009b. Mobile Phone Partnership Initiative (MPPI) -
PROJECT 4.1: Guideline on the Awareness Raising-Design Considerations. Basel Convention.
Nakamura, S., and Y. Kondo. 2006. A waste input-output life-cycle cost analysis of
the recycling of end-of-life electrical home appliances. Ecological Economics 57 (3):494-506.
Reardon, Marguerite. 2008. Smartphones increase average price of handsets. CNET
News. Available from http://news.cnet.com/8301-10784_3-9954996-7.html. Townsend, T. G., K. Vann, S. Mutha, B. Pearson, Y. Jang, S. Musson, and A. Jordan.
2004. “RCRA Toxicity Characterization of Computer CPUs and Other Discarded Electronic Devices.” Department of Environmental Engineering Sciences. University of Florida.

64
Text:
Böni, H., and Widmer, R. 2011. Disposal of Flat Panel Display Monitors in Switzerland: Final Report March 2011. EMPA & Swico Recycling. Available from: http://swicorecycling.ch/downloads/497/344540/swico_schlussbericht_e_2010.pdf
Cassavov, Liane. 2010. Study: We’re Holding On to Our Cell Phones Longer Than
Ever. PCWorld. Available from http://www.pcworld.com/article/206100/study_were_holding_on_to_our_cell_phones_longer_than_ever.html.
Castorina, Stephanie. 2011. Personal communication. IPC - Association Connecting
Electronics Industries. CEA. 2011. Global Industry Releases Supply Chain Communication Guide on
Declarable Substance Content in Electrotechnical Products. Press Release. Available from http://ce.org/Standards/JIG_4.0_Press_Release-20110310.doc.
Dale, Larry, C. Antinori, M. McNeil, J. E. McMahon, and K. S. Fujita. 2009. Retrospective evaluation of appliance price trends. Energy Policy 37 (2):597-605.
Davis, C. 2006. Basel Convention Addresses Growing E-Waste Problem. World
Resources Institute. Available from http://earthtrends.wri.org/updates/node/120.
Doctori Blass, V., M. Fuji, J. Neira, L. Favret, S. Mahdavi, R. Miller, and R. Geyer. 2008. End-of-life management of cell phones in the United States. Paper read at Electronics and the Environment, 2008. ISEE 2008. IEEE International Symposium on, 19-22 May 2008.
Entner, Roger. 2010. Smartphones to Overtake Feature Phones in U.S. by 2011. The
Nielsen Company. Available from: http://blog.nielsen.com/nielsenwire/consumer/smartphones-to-overtake-feature-phones-in-u-s-by-2011/.
EUROPA. 2011. European Commission: Environment. Available from
http://ec.europa.eu/environment/index_en.htm.
Huisman, J., F. Magalini, R. Kuehr, C. Maurer, S. Ogilvie, J. Poll, C. Delgado, E. Artim, J. Szlezak, and A. Stevels. 2007. Review of Directive 2002/96 on Waste Electrical and Electronic Equipment (WEEE) Final Report. United Nations University.
INFORM. 2003. Electric Appliance Recycling in Japan. Available from
http://www.informinc.org/fact_JapanEPR.pdf.

65
IPC. 2011. Materials Declaration. Available from http://www.ipc.org/ContentPage.aspx?pageid=Materials-Declaration.
Japan for Sustainability. 2009. Revised Law Requires Recycling of Additional Home
Appliances. Available from http://www.japanfs.org/en/pages/029030.html.
Matsuto, T., C. H. Jung, and N. Tanaka. 2004. Material and heavy metal balance in a recycling facility for home electrical appliances. Waste Management 24 (5):425-436.
Mobile and Gadget Review. 2011. The cell phone market in 2010 from a financial
P.O.V. Available from http://review4mobile.co.cc/2011/02/the-cell-phone-market-in-2010-from-a-financial-p-o-v/.
Motorola. 2007. Motorola Corporate Responsibility Report 2007. Available from http://responsibility.motorola.com/images/uploads/2007%20CR%20report.pdf.
Murakami, Shinsuke, A. Terazono, N. Abe, Y. Moriguchi, and H. Miyakawa. 2006.
Material flows of end-of-life home appliances in Japan. Journal of Material
Cycles and Waste Management 8 (1):46-55. Nokia. 2011b. Managing our materials and substances. Available from
http://www.nokia.com/environment/strategy-and-reports/substance-and-material-management.
O’Connell, S. and T. A. Brady. 2002. Product material declaration program at Intel.
Electronics and the Environment, 2002 IEEE International Symposium
on:113-116. Rousis, K., K. Moustakas, M. Stylianou, A. Papadopoulos, and M. Loizidou. 2008.
Management of waste from electrical and electronic equipment: The case of television sets and refrigerators. Journal of Environmental Engineering and
Science 7 (2):105-114. Street, Karen. 2011. Does Improving Efficiency Do Any Good? The Energy
Collective. Available from: http://theenergycollective.com/karenstreet/49288/new-yorker-article-jevons-paradox-does-improving-efficiency-do-any-good.
Widmer, R., H. Oswald-Krapf, D. Sinha-Khetriwal, M. Schnellmann, and H. Boni.
2005. Global perspectives on e-waste. Environmental Impact Assessment
Review 25 (5):436-458.
Data:
AEA Technology. 2004. WEEE and Hazardous Waste: A Report for DEFRA. DEFRA. Available from

66
http://archive.defra.gov.uk/environment/waste/producer/electrical/documents/weee-hazwaste.pdf.
AEA Technology. 2006. WEEE and Hazardous Waste, Part 2: A Report Produced
for DEFRA. DEFRA. Available from http://archive.defra.gov.uk/environment/waste/producer/electrical/documents/weee-aeatreport-june06.pdf.
Andy. 2010. Some 1980s Television Sets... 80s Actual. Available from
http://www.80sactual.com/2008/09/some-1980s-television-sets.html. Brady, T. A., S. Connell, P. Tanskanen, R. Bergman, P. Senfield, J. Hoekstra, T.
Mann, and J. Burkitt. 2003. Material composition profiles of select IT components, a design for environment project with the High Density Packaging User Group (HDPUG). Electronics and the Environment, 2003.
IEEE International Symposium on:125-130. California Department of Toxic Substances Control. 2004. E-waste Report:
Determination of regulated elements in seven types of discarded consumer electronic products. Available from http://www.dtsc.ca.gov/HazardousWaste/EWaste/upload/Consumer_Electronic_Products.pdf.
Crowe, M., A. Elser, B. Gopfert, L. Mertins, J. Schmid, A. Spillner, and R. Strobel.
2003. Waste from Electrical and Electronic Equipment (WEEE) - quantities, dangerous substances, and treatment methods. European Environment Agency. Available from http://eea.eionet.europa.eu/Public/irc/eionet-circle/etc_waste/library?l=/working_papers/weeepdf/_EN_1.0_&a=d.
Garcilaso, Luis, K. L. Jordan, V. Kumar, M. J. Hutchins, and J. W. Sutherland. 2007.
A Life-cycle Comparison of Clothes Washing Alternatives. Dept. of Mechanical Engineering-Engineering Mechanics, Sustainable Futures Institute, Michigan Technological University, Houghton, MI.
Handy and Harman Electronic Materials Corp. 1996. Composition of a Personal
Desktop Computer. Available from http://cmase.uark.edu/teacher/Environmental_Ed/2006%20E-Waste%20Info/E-Waste/Composition_of_a_Personal_Desktop_Computer.doc.
Huisman, J. 2004. QWERTY and eco-efficiency analysis on cellphone treatment in
Sweden. TU Delft. Huisman, J., A. L. N. Stevels, and I. Stobbe. 2004. Eco-efficiency considerations on
the end-of-life of consumer electronic products. Electronics Packaging
Manufacturing, IEEE Transactions on 27 (1):9-25.
67
Kang, H. Y., and J. M. Schoenung. 2005. Electronic waste recycling: A review of U.S. infrastructure and technology options. Resources, Conservation and
Recycling 45 (4):368-400. Kelly, D., G. R. Matos, D. A. Buckingham, C. A. DiFrancesco, K. E. Porter, and
USGS mineral commodity specialists. 2010. Historical Statistics for Mineral and Material Commodities in the United States. United States Geological Survey. Available from http://minerals.usgs.gov/ds/2005/140/#data.
Kim, H. C., G. A. Keoleian, and Y. A. Horie. 2006. Optimal household refrigerator
replacement policy for life cycle energy, greenhouse gas emissions, and cost. Energy Policy 34 (15):2310-2323.
Laner, D., and H. Rechberger. 2006. Technisch-naturwissenschaftliche
Entscheidungsgrundlagen für die zielorientierte Behandlung von Alt-Kühlgeräten (TEZLA). Institut für Wassergüte, Ressourcenmanagement und Abfallwirtschaft, Technische Universität Wien.
Laner, D., and H. Rechberger. 2007. Treatment of cooling appliances: Interrelations
between environmental protection, resource conservation, and recovery rates. Resources, Conservation and Recycling 52 (1):136-155.
Ministry of Environment. 2009. WEEE/E-waste Management Report. Phnom Penh
Municipality, Kingdom of Cambodia. Mobile Phone Working Group. 2009a. Mobile Phone Partnership Initiative (MPPI) -
PROJECT 3.1: Guideline on Material Recovery and Recycling of End-of-Life Mobile Phones. Basel Convention.
Moskalyuk, Alex. 2005. Mobile phone sales to reach 800 mln units in 2005, average
price $146. ZDNet Research. Available from http://www.zdnet.com/blog/itfacts/mobile-phone-sales-to-reach-800-mln-units-in-2005-average-price-146/9303.
Musson, S. E., K. N. Vann, Y.-C. Jang, S. Mutha, A. Jordan, B. Pearson, and T. G.
Townsend. 2006. RCRA toxicity characterization of discarded electronic devices. Environmental science technology 40 (8):2721-6.
Nokia. 1994. Annual Report 1994. Available from
http://nds2.ir.nokia.com/aboutnokia/downloads/archive/pdf/eng/Nok1994.pdf. Nokia. 2010. Nokia Interim Report from Q4 2010. Available from
http://www.nokia.com/results/Nokia_results2010Q4e.pdf. Nokia. 2011a. Materials and substances. Available from
http://www.nokia.com/environment/devices-and-services/creating-our-products/materials-and-substances.

68
Panasonic Eco Technology Center: Home Appliance Recycling. 2011. Avialable from http://panasonic.net/eco/petec/material/.
Rüdenauer, I., C. Gensch, and D.Quack. 2005. EcoEfficiency Analysis of Washing
Machines - Life Cycle Assessment and determination of optimal life span. Electrolux-AEG Hausgeräte GmbH and BSH Bosch und Siemens Hausgeräte Gmb. Available from http://www.oeko.de/das_institut/mitarbeiterinnen/dok/630.php?id=40&dokid=270&anzeige=det&ITitel1=&IAutor1=.
Rüdenauer, I., and C. Gensch. 2005. Eco-Efficiency Analysis of Washing machines-
Refinement of Task 4: Further use versus substitution of washing machines in stock. European Committee of Domestic Equipment Manufacturers (CECED). Available from http://www.oeko.de/das_institut/mitarbeiterinnen/dok/630.php?id=40&dokid=270&anzeige=det&ITitel1=&IAutor1=.
Shrivastava, P., H. C. Zhang, Li Jianzhi, and A. Whitely. 2005. Evaluating obsolete
electronic products for disassembly, material recovery and environmental impact through a decision support system. Electronics and the Environment,
2005. Proceedings of the 2005 IEEE International Symposium on:221-225. Smith, D., M. Small, R. Dodds, S. Amagai, and T. Strong. 1995. Computer monitor
recycling: a case study. Clean Electronics Products and Technology, 1995.
(CONCEPT), International Conference on:124-128. Socolof, M. L., J. G. Overly, L. E. Kincaid, J. R. Geibig. 2001. Desktop Computer
Displays: A Life Cycle Assessment. EPA. Available from http://www.epa.gov/dfe/pubs/comp-dic/lca/index.htm.
Statistics Canada. 2009. Material composition of personal computers. Availabe from
http://www41.statcan.gc.ca/2006/1762/htm/ceb1762_003_6-eng.htm. The People History. 2011. 1990’s Appliances including prices. Available from
http://www.thepeoplehistory.com/90selectrical.html. Truttmann, N., O. Cencic, J. Fellner, and H. Rechberger. 2005. Technisch-
naturwissenschaftliche Grundlagen zur Auswahl von Bewirtschaftungsszenarien für Elektroaltgeräte (TABEA). Institut für Wassergüte, Ressourcenmanagement und Abfallwirtschaft, Technische Universität Wien.
TVhistory.TV. 2011. Television History - The First 75 Years: TV Selling Prices.
Available from http://www.tvhistory.tv/tv-prices.htm. Tweney, Dylan. 2011. Infoporn: How Flatscreen TVs Get Cheaper. Wired. Available
from http://www.wired.com/magazine/2011/04/st_infoporn_lcds/.

69
UNEP/GRID-Arendal. 2006. Cell phone composition. UNEP/GRID-Arendal Maps
and Graphics Library. Availabe from http://maps.grida.no/go/graphic/cell_phone_composition.
United States Geological Survey. 2011. Commodity Statistics and Information.
Available from http://minerals.usgs.gov/minerals/pubs/commodity/ Williams, E. 2004. Energy Intensity of Computer Manufacturing: Hybrid
Assessment Combining Process and Economic Input-Output Methods. Environmental Science & Technology. 38 (22):6166-6174.
Yu, J., E. Williams, and M. Ju. 2010. Analysis of material and energy consumption
of mobile phones in China. Energy Policy 38 (8):4135-4141.

70
List of Figures
Figure 1. US Freezer-Refrigerator Weight & Material Composition [kg]................. 23 Figure 2. Japanese Freezer-Refrigerator Weight & Material Composition [kg]........ 23 Figure 3. Material Value [USD] of US Freezer-Refrigerators ................................... 25 Figure 4. Material Value [USD] of Japanese Freezer-Refrigerators.......................... 25 Figure 5. Material Value of US Freezer-Refrigerator as a % of Market Price .......... 26 Figure 6. Material Value of US Freezer-Refrigerators on a 100% Scale................... 26 Figure 7. Material Value of Japanese Freezer-Refrigerator as a % of Market Price .26 Figure 8. Material Value of Japanese Freezer-Refrigerator on a 100% Scale ........... 26 Figure 9. Development in Market Price, Material Price [USD], and Weight [kg] of
US Freezer-Refrigerators over time ................................................................... 27 Figure 10. Development in Market Price, Material Price [USD], and Weight [kg] of
Japanese Freezer-Refrigerators over time .......................................................... 27 Figure 11. Washing Machine Weight & Material Composition [kg] ........................ 28 Figure 12. Material Value [USD] of Washing Machines........................................... 29 Figure 13. Material Value of Washing Machines as a % of Market Price................. 30 Figure 14. Material Value of Washing Machines on a 100% Scale .......................... 30 Figure 15. Development in Market Price, Material Price [USD], and Weight [kg] of
Washing Machines over time............................................................................. 31 Figure 16. CRT Displays Weight & Material Composition [kg] ............................... 32 Figure 17. Material Value [USD] of CRT Displays................................................... 33 Figure 18. Material Value of CRT Displays as a % of Market Price......................... 34 Figure 19. Material Value of CRT Displays on a 100% Scale .................................. 34 Figure 20. Development in Market Price, Material Price [USD], and Weight of CRT
Displays over time.............................................................................................. 35 Figure 21. Flat Panel (20”) Weight & Material Composition [kg] ............................ 36 Figure 22. Material Value [USD] of 20” Flat Panel Displays ................................... 37 Figure 23. Material Value of 20” Flat Panel Displays as a % of Market Price.......... 38 Figure 24. Material Value of Flat Panel Displays on a 100% Scale .......................... 38 Figure 25. Development in Market Price, Material Price [USD], and Weight [kg] of
Flat Panel Displays over time............................................................................. 39 Figure 26. Desktop Computer Weight & Material Composition [kg] ....................... 40 Figure 27. Material Value [USD] of Desktop Computers ......................................... 42 Figure 28. Material Value of Desktop Computers (with a 17” CRT monitor) as a %
of Market Price................................................................................................... 43 Figure 29. Material Value of Desktop Computers (with a 17” CRT monitor) on a
100% Scale ......................................................................................................... 43 Figure 30: Development in Market Price, Material Price [USD], and Weight [kg] of
Desktop Computers (with a 17” CRT monitor) over time ................................. 43 Figure 31. Laptop Computer Weight & Material Composition [kg] ......................... 44 Figure 32. Material Value [USD] of Laptop Computers ........................................... 45 Figure 33. Material Value of Laptop Computers as a % of Market Price.................. 46 Figure 34. Material Value of Laptop Computers on a 100% Scale ........................... 46 Figure 35. Development in Market Price, Material Price [USD], and Weight [kg] of
Laptop Computers over time.............................................................................. 46 Figure 36. Mobile Phone Weight & Material Composition [g] ................................. 47 Figure 37. Material Value [USD] of Mobile Phones ................................................. 50

71
Figure 38. Material Value of Mobile Phones as a % of Market Price ....................... 52
Figure 39. Material Value of Mobile Phones as a Percentage of Market Price ......... 52
Figure 40. Development in Market Price, Material Price [USD], and Weight [kg] of
Mobile Phones over time ................................................................................... 52
Figure 41. Overall Average Weight & Material Composition [kg] of JP&US Freezer-
Refrigerator and Washing Machine ................................................................... 53
Figure 42. Overall Average Weight & Material Composition [kg] of CRT Display,
Flat Panel Display, Desktop Computer, and Laptop Computer......................... 54
Figure 43. Overall Average Weight & Material Composition [g] of Mobile Phone . 54

72
Appendix
APPENDIX

YearAverage Weight
Average Price
Material Price
Aluminum (Al) Copper (Cu)
Ferrous Metals
Glass/Ceramics Plastics Oil
Other Metals Other TOTAL
% weight 2.842 5.780 67.710 1.600 19.650 0.200 2.220 100.0
$/tons 1630 2710 112 394 990 112 112
Value 5.466 18.483 8.949 0.744 22.955 0.026 0.293
% weight 3.000 3.000 64.400 1.500 13.000 15.100 100.00
$/tons 1310 2410 110 325 856 110
Value 4.716 8.676 8.501 0.585 13.354 1.993
% weight 3.000 3.000 61.000 4.000 28.000 1.000 100.0
$/tons 1570 2450 113 226 615 113
Value 5.888 9.188 8.616 1.130 21.525 0.141
% weight 4.776 2.067 59.362 1.994 28.397 0.608 2.796 100.0
$/tons 1570 2400 116 246 722 222 116
Value 8.624 5.706 7.919 0.564 23.578 0.155 0.373
% weight 2.954 2.921 64.000 2.200 26.750 0.327 0.853 100.0
$/tons 1700 2360 116 266 562 229 116
Value 5.172 7.099 7.647 0.603 15.485 0.077 0.102
% weight 3.000 3.000 64.400 1.500 16.000 12.100 100.0
$/tons 1440 1730 114 216 455 114
Value 5.184 6.228 8.810 0.389 8.736 0.826
YearAverage Weight
Average Price
Material Price
Aluminum (Al) Copper (Cu)
Ferrous Metals
Glass/Ceramics Plastics Oil
Other Metals Other TOTAL
% weight 3.000 4.000 50.000 40.000 3.000 100.0
$/tons 1030 1610 100 2000 100
Value 2.163 4.508 3.500 56.000 0.210
% weight 1.010 3.030 49.495 43.434 1.010 2.020 100.0
$/tons 1310 2410 110 856 110 110
Value 0.992 5.477 4.083 27.885 0.083 0.167
% weight 2.000 4.000 47.000 1.000 44.000 2.000 100.0
$/tons 1570 2450 113 226 615 113
Value 2.465 7.694 4.170 0.177 21.245 0.177
% weight 3.000 4.000 50.000 40.000 3.000 100.0
$/tons 1440 1730 114 455 114
Value 3.240 5.190 4.275 13.650 0.257
US & Japanese freezer-refrigerator data. All units in USD, [kg].
1998 75.00
1982 70.00
1990 75.00
1994 78.51
930 38.69
950 26.61
1180 66.38
1130 35.93
1997 103.00
1996 115.00
1998 120.00
1142 46.92
1990 118.00
1991 120.00 990 37.82
1100 56.92
US
JP
1107 30.17
1994 125.00 1144 46.49
1126 36.18

YearAverage Weight
Average Price
Material Price
Aluminum (Al)
Copper (Cu)
Ferrous Metals
Glass/Ceramics
Lead (Pb)
Nickel (Ni) Plastics Zinc Concrete Oil
Other Metals Other TOTAL
% weight 2.505 3.206 84.068 6.112 0.701 0.200 3.206 100.0
$/tons 1050 1470 66 1284 385 66 66
Value 2.211 3.962 4.649 6.596 0.227 0.011 0.177
% weight 1.000 4.600 56.760 2.600 6.360 28.300 0.370 100.0
$/tons 1180 2020 108 266 642 30 108
Value 0.968 7.619 5.027 0.567 3.348 0.696 0.033
% weight 4.680 4.030 45.131 2.060 0.301 0.019 16.024 0.013 24.181 0.616 2.984 100.0
$/tons 1570 2450 113 226 820 6340 615 1090 30 113 113
Value 6.098 8.196 4.233 0.386 0.205 0.102 8.179 0.012 0.602 0.058 0.280
% weight 4.360 2.446 49.950 1.641 15.930 0.029 20.636 0.518 1.468 3.022 100.0
$/tons 1700 2360 116 216 589 1420 30 229 116 116
Value 5.891 4.588 4.605 0.282 7.457 0.032 0.492 0.094 0.135 0.279
% weight 4.300 2.300 54.800 2.600 11.500 24.500 100.0
$/tons 1440 1730 114 177 455 30
Value 4.954 3.183 4.998 0.368 4.186 0.588
% weight 4.560 1.542 56.498 1.647 17.463 18.029 0.173 0.087 100.0
$/tons 2010 3830 160 590 910 45 160 160
Value 6.783 4.369 6.689 0.719 11.760 0.600 0.021 0.010
Washing machine data. All units in USD, [kg].
1992 82.00 790 18.26
1978 84.05 1131 17.83
1996 79.47 700 23.85
1994 83.00 767 28.35
2004 74.00 618 30.95
1998 80.00 679 18.28

YearAverage Weight
Average Price
Material Price
Aluminum (Al)
Antimony (Sb) Barium
Bismuth (Bi)
Copper (Cu)
Ferrous Metals
Glass/Ceramics Gold (Au) Lead (Pb)
Nickel (Ni) Plastics
Silver (Ag) Tin (Sn) Zinc (Zn) Other TOTAL
% weight 2.0000 3.0000 10.0000 57.0000 0.0060 21.0000 7.0000 100.0
$/tons 1,030 1,610 100 787 12,100,000 2,087 100
Value 0.175 0.411 0.085 3.813 6.171 3.725 0.060
% weight 4.6217 13.9156 14.6121 38.5423 0.0060 0.7546 16.2546 1.7936 0.2533 9.2521 100.0
$/tons 1,080 1,480 105 394 10,200,000 421 1,472 13,100 890 105
Value 1.161 4.790 0.357 3.532 14.235 0.074 5.565 5.465 0.052 0.226
% weight 1.0000 0.0197 0.0626 0.0025 10.3799 10.7072 52.5528 0.0055 0.6086 0.0322 17.6111 0.0079 1.0432 0.2043 5.7624 100.0
$/tons 1,940 1,940 48 10,275 2,800 114 384 9,245,000 940 11,080 990 165,900 10,010 1,725 114
Value 0.009 0.009 0.001 0.006 5.719 0.163 5.525 11.798 0.132 0.082 4.010 0.300 2.402 0.081 0.081
% weight 2.9734 4.9734 14.4149 50.8273 0.0060 1.4672 19.6843 1.5000 4.1934 100.0
$/tons 1,310 2,410 110 325 11,700,000 739 856 8,000 110
Value 0.857 2.637 0.349 3.634 15.444 0.239 3.707 2.640 0.101
% weight 1.2538 0.1023 0.0890 0.0036 8.6425 7.2975 58.8562 0.0069 1.2759 0.0458 16.5717 0.0112 1.6060 0.2390 3.9976 100.0
$/tons 1,375 2,810 42 6,340 2,235 111 246 12,000,000 760 5,815 615 154,150 7,925 1,055 111
Value 0.379 0.063 0.001 0.005 4.250 0.178 3.185 18.180 0.213 0.059 2.242 0.379 2.800 0.055 0.098
% weight 1.4493 0.0211 0.0045 4.2887 5.1757 63.9862 0.0056 0.0985 0.0520 19.6748 0.0057 0.0271 0.1004 5.0637 100.0
$/tons 1,570 3,240 8,050 2,400 116 256 12,500,000 1,080 7,500 722 166,900 9,090 1,130 116
Value 0.478 0.014 0.008 2.162 0.126 3.440 14.778 0.022 0.082 2.983 0.199 0.052 0.024 0.123
% weight 2.1597 0.0025 0.0081 0.0003 2.8855 7.5571 59.5919 0.0062 0.0648 0.0042 21.6410 0.0010 0.1112 0.0218 5.9058 100.0
$/tons 1,440 1,580 57 7,940 1,730 114 177 9,490,000 999 4,630 455 178,000 8,230 1,130 114
Value 0.653 0.001 0.000 0.001 1.048 0.181 2.215 12.315 0.014 0.004 2.068 0.038 0.192 0.005 0.141
CRT display data. All units in USD, [kg].
1988 23.00 615 30.32
1982 8.50 750 14.44
770 35.461986 23.26
1992 22.00
1998 21.00
1996 21.00
1994 22.00
280 18.88
425 29.61
350 24.49
420 32.09

YearAverage Weight
Average Price
Material Price
Aluminum (Al)
Antimony (Sb)
Copper (Cu)
Ferrous Metals
Glass/Ceramics Gold (Au)
Indium (In)
Lead (Pb)
Mercury (Hg)
Nickel (Ni) Plastics
% weight 5.4784 0.0028 4.5212 33.3431 18.9048 0.0022 0.0188 0.0445 0.0002 0.0421 37.5180
$/tons 1,700 1,490 2,360 116 266 10,700,000 319,000 1,030 4,630 6,930 562
Value 0.931 0.000 1.067 0.387 0.503 2.321 0.600 0.005 0.000 0.029 2.109
% weight 10.750 6.926 26.547 22.867 0.004 0.0236 29.297
$/tons 1640 1670 108 335 9000000 303000 937
Value 1.322 0.867 0.215 0.575 2.889 0.536 2.059
% weight 5.8000 0.0302 14.1113 25.8911 27.9000 0.0085 0.0229 0.7683 0.3000 0.0494 23.8244
$/tons 1,180 1,700 2,020 108 394 11,600,000 170,000 699 5,410 5,290 883
Value 0.548 0.004 2.280 0.224 0.879 7.888 0.311 0.043 0.130 0.021 1.683
Silica (Si)Silver (Ag) Tin (Sn) Zinc (Zn) TOTAL
0.0521 0.0377 0.0509 100.0157,200 8,410 1,420
0.820 0.032 0.0073.413 0.032 0.090 0.100 100.01360 169000 8,070 1,180
0.348 0.411 0.054 0.0090.0621 0.9317 0.2579 100.0
138,200 7,710 1,0200.687 0.575 0.021
Flat panel display (20") data. All units in USD, [kg].
2003 8.00 850 14.01
1650 8.46
1997 10.00 2100 7.95
1999 7.50

YearAverage Weight
Average Price
Material Price
Aluminum (Al)
Antimony (Sb)
Arsenic (As)
Barium (Ba)
Beryllium (Be)
Bismuth (Bi)
Cadmium (Cd)
Chromium (Cr)
Copper (Cu)
Ferrous Metals
Gallium (Ga)
Germanium (Ge)
% weight 12.173 0.009 0.001 0.032 0.016 0.006 0.009 0.006 6.929 23.472 0.001 0.002
$/tons 1310 1810 728 52 617000 6610 4430 900 2410 110 475000 1060000
Value 4.744 0.005 0.000 0.000 2.882 0.012 0.012 0.002 4.968 0.768 0.184 0.505
% weight 11.200 0.533 0.001 0.170 0.010 0.007 0.001 9.341 26.414 0.001 0.001
$/tons 1450 1380 845 53 849000 8490 709 1670 105 595000 1700000
Value 4.482 0.203 0.000 0.002 2.343 0.016 0.000 4.306 0.765 0.082 0.469
% weight 13.170 0.010 6.930 20.470 0.001 0.001
$/tons 1640 928000 1940 108 640000 1250000
Value 5.754 2.472 3.582 0.589 0.085 0.333
% weight 14.000 0.010 0.001 9.097 20.000 0.001 0.001
$/tons 1850 276000 1200 2950 147 550000 600000
Value 6.708 0.715 0.000 6.951 0.761 0.071 0.155
Glass/Ceramics Gold (Au) Lead (Pb)
Mercury (Hg)
Nickel (Ni)
Palladium (Pd) Plastics
Silver (Ag) Tin (Sn) Zinc (Zn) Other TOTAL
24.882 0.002 6.299 0.002 0.850 0.000 22.092 0.019 1.008 2.205 0.016 100.0325 11700000 739 3550 8160 2864654 803 129900 8000 1160 110
2.406 5.569 1.385 0.002 2.064 0.256 5.278 0.730 2.399 0.761 0.001
19.600 0.002 3.000 0.087 0.000 24.784 0.021 2.325 0.855 1.600 100.0275 9000000 997 6010 9317360 776 169000 8070 1180 105
1.488 3.975 0.826 0.145 0.746 5.308 0.994 5.179 0.279 0.046
24.800 0.002 5.900 0.000 23.000 0.018 0.900 1.000 3.800 100.0335 9010000 961 29063600 937 161000 8160 1230 108
2.213 3.692 1.510 2.230 5.741 0.779 1.956 0.328 0.109
26.000 0.002 4.200 0.002 0.000 23.000 0.019 0.800 1.900 1.000 100.0541 13200000 1220 10200 7488932 910 207000 12100 1160 147
3.643 5.470 1.327 0.005 0.562 5.421 1.013 2.507 0.571 0.038
Desktop computer data. All units in USD, [kg].
29.75
27.60
26.64
25.90
1992
1998
2000
2004
14.08
12.67
12.81
15.36
2400
1500
1100
800

YearAverage Weight
Average Price
Material Price
Aluminum (Al)
Antimony (Sb)
Arsenic (As)
Barium (Ba)
Bismuth (Bi)
Chromium (Cr)
Copper (Cu)
Ferrous Metals
Glass/Ceramics Gold (Au)
Indium (In)
% weight 13.7104 0.0676 0.0016 0.2150 0.0086 0.0012 11.8696 12.0100 9.0000 0.0181 0.0110
$/tons 1,450 1,380 845 53 8,490 709 1,670 105 275 9,000,000 303,000
Value 0.577 0.003 0.000 0.000 0.002 0.000 0.575 0.037 0.072 4.713 0.097
% weight 12.5017 0.0293 0.0600 8.6167 11.4684 18.6154 0.0180 0.0113
$/tons 1,640 1,440 46 1,940 108 335 9,010,000 188,000
Value 0.500 0.001 0.000 0.408 0.030 0.152 3.957 0.052
% weight 9.7893 0.0536 0.0013 0.1706 0.0068 0.0009 13.3833 8.7347 21.7540 0.0161 0.0115
$/tons 1,520 1,430 815 45 8,250 854 1,690 101 325 8,750,000 120,000
Value 0.388 0.002 0.000 0.000 0.001 0.000 0.590 0.023 0.185 3.678 0.036
Lead (Pb)Nickel
(Ni)Palladium
(Pd) PlasticsSilver (Ag) Tin (Sn) Zinc (Zn) TOTAL
1.2198 0.1105 0.0003 49.7138 0.0270 1.4483 0.5773 100.0963 6,010 11,677,243 776 169,000 8,070 1,180
0.034 0.019 0.108 1.119 0.132 0.339 0.0200.5281 0.0995 0.0003 46.7795 0.0242 1.0000 0.2015 100.0
961 8,640 29,063,600 937 149,667 8,160 1,230
0.012 0.021 0.227 1.070 0.088 0.199 0.0061.3644 0.0877 0.0003 42.8198 0.0214 1.3390 0.4581 100.0
962 5,950 19,634,615 803 140,000 6,940 9690.034 0.014 0.164 0.897 0.078 0.243 0.012
Laptop computer data. All units in USD, [kg].
2001 2.61 1600 4.90
1700 5.10
1999 2.90 1800 6.07
2000 2.44

YearAverage Weight
Average Price
Material Price
Aluminum (Al)
Antimony (Sb)
Arsenic (As)
Barium (Ba)
Beryllium (Be)
Bismuth (Bi)
Bromine (Br)
Chlorine (Cl)
Chromium (Cr)
1985 770.00
1989 349.00% weight 8.5368 0.1763 0.0043 0.5610 0.0154 0.0030
$/tons 1,553 3,473 903 43 7,305 882Value 0.030 0.001 0.000 0.000 0.000 0.000
% weight 6.4309 0.1371 0.0034 0.4363 0.0175 0.0024$/tons 1,530 1,483 893 52 8,050 879Value 0.012 0.000 0.000 0.000 0.000 0.000
% weight 4.9910 0.0854 0.0007 0.0033 0.0312 0.9551 0.0064 0.3502$/tons 1,450 1,380 845 849,000 8,490 870 120 709Value 0.008 0.000 0.000 0.003 0.000 0.001 0.000 0.000
% weight 7.6983$/tons 1,640Value 0.014
% weight 3.7798 0.0954 0.0017 0.0032 0.0218 0.9041 0.0060 0.1667$/tons 1,520 1,430 815 165,000 8,250 670 118 854Value 0.005 0.000 0.000 0.000 0.000 0.001 0.000 0.000
% weight 1.6500 0.5747$/tons 1,430 790Value 0.002 0.000
% weight 1.9131 0.0777 0.0007 0.0022 0.0049 0.9493 0.0126 0.6325$/tons 1,500 2,370 990 249,000 6,330 717 114 922Value 0.002 0.000 0.000 0.000 0.000 0.001 0.000 0.000
% weight 6.8509 0.0729 0.6585 0.0032 0.0011 0.5581 1.3678$/tons 1,930 3,205 52 247,000 8,005 800 1,445Value 0.011 0.000 0.000 0.001 0.000 0.000 0.002
% weight 5.5488$/tons 1,750
Value 0.009
Mobile phone data. All units in USD, [kg].
2005 85.00 120 2.44
2009 90.00 150 4.91
300 1.86
2003 80.00 100 0.63
2000 110.00
1999 117.00
1995 230.00
2002 80.00
120 0.78
1998 120.00
110 0.55
2001 95.00
180 0.62
140 0.94
160 1.01

Copper (Cu)
Ferrous Metals
Glass/Ceramics Gold (Au) Lead (Pb)
Palladium (Pd) Plastics
Platinum (Pt) /
Tantalum (Ta)
Silver (Ag) Tin (Sn) Zinc (Zn) TOTAL
36.8676 12.2235 1.0000 0.0497 4.7882 27.3028 0.0705 6.8941 1.5068 100.0
2,480 114 251 12,225,000 883 722 160,200 8,525 1,118
0.210 0.003 0.001 1.397 0.010 0.045 0.026 0.135 0.004
27.2723 9.0980 3.0000 0.0386 3.1905 44.2625 0.0549 4.8838 1.1718 100.0
1,920 112 275 9,730,000 997 455 168,067 8,237 1,243
0.063 0.001 0.001 0.451 0.004 0.024 0.011 0.048 0.002
17.2458 6.5352 9.8735 0.0445 0.3059 0.0153 57.3458 0.0017 0.7021 0.6990 0.8518 100.0
1,670 105 275 9,000,000 963 15,753,500 776 5,195,700 169,000 8,070 1,180
0.034 0.001 0.003 0.469 0.000 0.282 0.052 0.010 0.139 0.007 0.001
19.4741 8.6207 8.3103 0.0420 0.9698 0.0080 50.6790 0.0026 0.9698 1.0776 2.1328 100.0
1,940 108 335 9,010,000 961 22,243,347 937 9,125,772 161,000 8,160 1,230
0.042 0.001 0.003 0.416 0.001 0.196 0.052 0.026 0.172 0.010 0.003
18.3337 7.3913 10.3226 0.0339 1.0442 0.0145 54.1828 0.0035 0.1392 2.7298 0.7779 100.0
1,690 101 325 8,750,000 962 24,948,400 803 9,949,750 140,000 6,940 969
0.029 0.001 0.003 0.281 0.001 0.344 0.041 0.033 0.019 0.018 0.001
17.2414 3.9483 16.2414 0.0347 0.5747 0.0132 57.4713 0.0037 0.5747 1.1494 0.4747 100.0
1,670 105 295 10,000,000 961 10,921,052 803 4,850,250 148,000 6,440 852
0.023 0.000 0.004 0.278 0.000 0.115 0.037 0.015 0.068 0.006 0.000
11.7241 8.3555 11.1891 0.0329 0.3526 0.0119 63.7097 0.0298 0.1428 0.5370 0.3458 100.0
1,880 110 394 11,700,000 965 7,973,200 883 6,540,100 157,000 7,490 896
0.018 0.001 0.004 0.308 0.000 0.076 0.045 0.156 0.018 0.003 0.000
15.0871 7.0036 14.0670 0.0233 0.0137 0.0011 51.8048 0.3288 0.1966 1.0989 0.8572 100.0
3,390 154 492 13,750,000 1,290 8,423,300 910 7,193,500 221,500 10,030 1,320
0.043 0.001 0.006 0.272 0.000 0.008 0.040 2.011 0.037 0.009 0.001
17.8995 9.1975 16.9975 0.0305 0.0305 49.9390 0.3452 0.0305 100.0
5,320 165 620 31,300,000 8,969,850 1,873 11,600,000 472,000
0.086 0.001 0.009 0.860 0.246 0.084 3.604 0.013
Recommended