
ACTUAL ACTUAL ACTUAL BUDGETED ESTIMATED BUDGETED
ACCOUNT RECEIPTS OR RECEIPTS OR RECEIPTS OR RECEIPTS OR RECEIPTS OR RECEIPTS OR
FUNCTION ACCOUNT DESCRIPTION EXPENDITURES EXPENDITURES EXPENDITURES EXPENDITURES EXPENDITURES EXPENDITURES
2013-2014 2014-2015 2015-2016 2016-2017 2016-2017 2017-2018
BEGINNING BALANCE 20,687,989 21,143,944 10,697,757 10,896,522 10,144,408 11,315,635
REVENUE
6000 REVENUE--LOCAL SOURCES 71,082,142 72,378,501 74,395,932 76,400,350 77,117,935 80,132,884
7000 REVENUE--STATE SUBSIDIES 14,131,691 15,678,105 17,301,818 18,098,585 18,413,373 19,386,357
8000 REVENUE--FEDERAL SUBSIDIES 484,202 500,900 533,993 547,694 544,382 547,782
9000 OTHER FUNDING SOURCES 1,901,625 47,994 44,173 40,000 60,873 40,000
Total Revenue 87,599,661 88,605,500 92,275,916 95,086,629 96,136,563 100,107,023
TOTAL FUNDS AVAILABLE 108,287,650 109,749,444 102,973,673 105,983,151 106,280,971 111,422,658
EXPENDITURES
1000 INSTRUCTION
1100 INSTRUCTION--REG.PROGRAMS 38,358,167 40,860,213 43,001,383 44,495,656 44,494,570 48,308,233
1190 INSTRUCTION--FEDERAL PROGRAMS 379,390 412,443 460,519 431,463 493,620 689,527
1100 INSTRUCTION--REG.PROGRAMS 38,737,557 41,272,657 43,461,902 44,927,119 44,988,190 48,997,759
1200 INSTRUCTION--SPECIAL PROGRAMS 14,142,940 15,052,859 16,280,162 16,826,353 16,959,257 18,421,841
1300 VOCATIONAL EDUCATION 460,910 504,422 681,892 641,729 641,729 698,816
1420 SUMMER SCHOOL 95,853 85,879 65,333 73,767 86,130 74,246
1430 HOMEBOUND INSTRUCTION 39,538 14,333 24,461 26,648 18,580 26,534
1440 COURT PLACED/ALTERNATIVE ED 315,742 344,857 223,715 327,853 292,854 339,252
1400 OTHER INSTRUCTIONAL PROG. 451,132 445,069 313,509 428,267 397,564 440,032
1500 NONPUBLIC SCHOOL PROGRAMS 10,000 6,186 5,834 10,000 8,728 10,000
1000 Instruction Totals 53,802,540 57,281,193 60,743,298 62,833,467 62,995,468 68,568,449
2000 SUPPORT SERVICES
2110 SUPERVISION OF PUPIL SVCS 171,960 149,521 234,056 247,139 243,013 259,736
2120 GUIDANCE SERVICES 1,987,039 2,106,805 2,292,405 2,382,077 2,503,517 2,563,669
2140 PSYCHOLOGICAL SERVICES 589,291 640,249 672,051 651,781 674,587 715,944
2160 HOME AND SCHOOL/SOCIAL WORKER 166,848 168,021 184,471 192,323 187,080 196,690
2170 STUDENT ACCOUNTING SVCS 75,027 79,022 83,831 86,782 88,014 92,438
2100 PUPIL PERSONNEL SERVICES 2,990,165 3,143,619 3,466,814 3,560,103 3,696,211 3,828,477
2220 AUDIOVISUAL SERVICES 461,629 524,885 561,261 606,235 594,489 518,228
2250 SCHOOL LIBRARY SERVICES 1,301,500 1,366,919 1,476,939 1,482,061 1,520,648 1,593,039
2270 STAFF DEVELOPMENT SERVICES 494,195 533,704 409,377 612,113 443,111 608,148
2200 INSTRUCTIONAL SUPPORT SVCS 2,257,323 2,425,508 2,447,577 2,700,409 2,558,248 2,719,415
2310 BOARD SERVICES 113,953 124,055 108,111 137,401 121,101 134,112
2320 BOARD TREASURER SERVICES 444 444 444 450 444 450
2330 TAX COLLECTION SERVICES 270,860 200,134 187,519 217,283 215,558 254,627
2340 STAFF RELATIONS 525,730 590,729 586,713 575,184 574,405 585,808
2350 LEGAL SERVICES 391,530 312,757 323,528 342,000 342,000 346,000
2360 SUPERINTENDENT'S OFFICE 666,989 469,656 475,874 527,168 494,157 522,968
2370 COMMUNITY RELATIONS SERVICES 0 57,905 119,815 118,954 128,744
2380 PRINCIPALS' OFFICE SERVICES 3,055,291 3,372,360 3,060,426 3,388,472 3,244,398 3,541,872
2300 ADMINISTRATIVE SUPPORT SVC 5,024,797 5,070,135 4,800,522 5,307,773 5,111,017 5,514,581
2400 PUPIL HEALTH SERVICES 890,133 1,025,688 1,076,621 1,125,634 1,167,263 1,210,532
2500 BUSINESS SERVICES 742,744 786,080 848,161 888,157 868,858 912,405
2600 OPERATION & MAINTENANCE 7,124,634 8,509,780 9,761,190 7,740,202 7,812,492 7,986,290
2700 STUDENT TRANSPORTATION SVCS 5,566,225 5,989,355 5,577,771 5,562,673 5,614,990 5,744,270
2800 DATA PROCESSING SERVICES 818,717 828,181 869,647 897,777 906,773 938,508
2900 OTHER SUPPORT SERVICES 72,410 78,241 75,610 79,051 80,521 80,870
2000 Support Services Totals 25,487,148 27,856,586 28,923,912 27,861,779 27,816,372 28,935,348
3000 NONINSTRUCTIONAL SERVICES
3200 STUDENT ATHLETIC SERVICES 1,471,075 1,569,562 1,844,126 1,799,411 1,883,223 1,811,420
3300 COMMUNITY SERVICES 62,833 105,380 235,694 194,000 193,619 194,000
3000 OPERATION OF NONINSTR. SVCS 1,533,907 1,674,942 2,079,820 1,993,411 2,076,842 2,005,420
3000 Noninstructional Services Totals 1,533,907 1,674,942 2,079,820 1,993,411 2,076,842 2,005,420
5000 OTHER FINANCING USES
5110 DEBT SERVICE 140,444 37,907 82,235 1,251,757 930,439 1,251,757
5130 REFUND OF PRIOR YEAR REVENUE 6,100 1,060 0 5,500 5,500 5,500
5100 OTHER FINANCING USES 146,544 38,967 82,235 1,257,257 935,939 1,257,257
5230 CAPITAL PROJECTS FUND TRANSFER 6,173,567 12,000,000 1,000,000 1,140,714 1,140,714 1,140,714
5250 FOOD SERVICE FUND TRANSFER 0 200,000 0 0 0 0
5200 FUND TRANSFERS 6,173,567 12,200,000 1,000,000 1,140,714 1,140,714 1,140,714
5900 BUDGETARY RESERVE 0 0 0 0 0 0
2017-2018 GENERAL FUND BUDGETWissahickon School District
1/10/2017 10:16 AM \\wsdfile1\business\Business Office\Budget 2017-18\Budget 2017-18 Lead 1 of 2

ACTUAL ACTUAL ACTUAL BUDGETED ESTIMATED BUDGETED
ACCOUNT RECEIPTS OR RECEIPTS OR RECEIPTS OR RECEIPTS OR RECEIPTS OR RECEIPTS OR
FUNCTION ACCOUNT DESCRIPTION EXPENDITURES EXPENDITURES EXPENDITURES EXPENDITURES EXPENDITURES EXPENDITURES
2013-2014 2014-2015 2015-2016 2016-2017 2016-2017 2017-2018
2017-2018 GENERAL FUND BUDGETWissahickon School District
5000 Other Financing Uses Totals 6,320,111 12,238,967 1,082,235 2,397,971 2,076,653 2,397,971
TOTAL DISBURSEMENTS 87,143,706 99,051,687 92,829,265 95,086,629 94,965,336 101,907,188
ENDING BALANCE 21,143,944 10,697,757 10,144,408 10,896,522 11,315,635 9,515,470
1/10/2017 10:16 AM \\wsdfile1\business\Business Office\Budget 2017-18\Budget 2017-18 Lead 2 of 2

Acct Description
2013/14
Actual
2014/15
Actual
2015/16
Actual
2016/17
Budget
Projected
2016/17
2017/18
Budget
Budget
Difference %
LOCAL REVENUE
6111 Current RE Tax $59,148,772 $59,598,341 $61,136,401 $63,933,028 $63,933,028 $64,053,028 120,000 0.19%
Current RE Tax Increase $2,951,195 2,951,195
6112 Interim RE Tax 178,135 416,936 312,385 150,000 204,988 525,000 375,000 250.00%
6113 Public Utility Realty 86,538 87,291 81,016 80,000 79,592 80,000 0 0.00%
6151 Earned Income Tax 8,015,212 8,414,249 8,389,776 8,400,000 8,545,890 8,625,000 225,000 2.68%
6153 RE Transfer Tax 1,331,905 1,421,578 2,079,425 1,425,000 2,012,815 1,525,000 100,000 7.02%
6411 Delinquent RE Tax 951,853 1,013,310 879,790 950,000 920,000 950,000 0 0.00%
6510 Interest on Investments 50,440 51,671 73,805 50,000 105,548 150,000 100,000 200.00%
6710 Admissions 16,841 18,918 17,145 15,000 15,963 15,000 0 0.00%
6740 Student Activity Fees 68,892 64,128 62,815 65,000 60,919 - (65,000) -100.00%
6790 Student Oblig./Lost Bk 7,342 5,957 7,192 7,500 6,868 7,500 0 0.00%
6791 Student Fees 90,912 83,865 105,382 105,000 93,707 95,000 (10,000) -9.52%
6921 Classroom For Future - - - - - 0
6831 IDEA 834,190 899,248 897,665 894,685 853,824 853,824 (40,861) -4.57%
6832 Title III 13,577 31,461 39,813 38,637 35,837 35,837 (2,800) -7.25%
6833 Incls Grant/ARRA IDEA - - - - - 0
6910 Rental Income 122,639 133,911 157,141 150,000 145,000 150,000 0 0.00%
6920 Private Donations/Contrib 75 - - - - 0
6941 Reg. Day School Tuit. 933 22,886 - 4,123 - 0
6942 Summer School Tuit. 46,696 37,455 45,590 50,000 24,150 30,000 (20,000) -40.00%
6944 Other Tuition 108,255 91,574 83,760 75,000 73,450 75,000 0 0.00%
6981 HS WELL Program 1,305 740 1,440 1,500 1,250 1,500 0 0.00%
6990 Miscellaneous Rev. 8,635 6,859 2,506 5,000 983 5,000 0 0.00%
6991 Refund of Prior Yr Exp. - - - 5,000 - 5,000 0 0.00%
Total Local $71,082,142 $72,378,501 $74,395,932 $76,400,350 $77,117,935 $80,132,884 3,732,534 4.89%
% of Total 81.14% 81.69% 80.62% 80.35% 80.22% 80.05%
STATE REVENUE
7110 Basic. Inst. Subsidy $2,355,198 $2,353,126 $2,442,642 $2,402,302 $2,557,422 $2,557,422 155,120 6.46%
7140 Charter School Subsidy - - 0
7160 Tuit. Child. Priv. Home 92,835 76,314 96,776 75,000 74,953 75,000 0 0.00%
7170 School Improvement - - - - - - 0
7210 Homebound Inst. - - - - - - 0
7230 Alternative Education - - - - - - 0
7271 Special Ed. Subsidy 1,973,844 2,091,975 2,062,084 2,013,321 2,029,619 2,029,619 16,298 0.81%
7310 Transportation Sub. 1,157,406 1,168,004 1,266,434 1,190,000 1,291,762 1,291,762 101,762 8.55%
7320 Rent. & Sinking Fund - 15,129 234,093 34,169 37,803 35,000 831 2.43%
7330 Health Svcs. 106,682 105,878 103,443 106,500 104,435 106,500 0 0.00%
7340 Property Tax Relief 2,760,952 2,869,223 3,028,809 3,072,558 3,072,558 3,072,558 0 0.00%
7360 Safe Schools - 59,505 30,000 - - - 0
7500 Ex. Grant & St. Source - - - - - - 0 0.00%
7501 PA Accountability Grant 53,278 120,512 137,010 137,010 177,096 157,053 20,043 14.63%
7504 Dual Enrollment - - - - - - 0
7810 St. Share-S.S. Taxes 1,720,700 1,744,027 1,695,764 1,864,092 1,864,092 1,966,392 102,300 5.49%
7820 St. Share-Retire cont 3,910,798 5,074,413 6,204,764 7,203,633 7,203,633 8,095,051 891,418 12.37%
7920 Technology Grant - - - - - 0
Total State $14,131,691 $15,678,105 $17,301,818 $18,098,585 $18,413,373 $19,386,357 1,287,772 7.12%
% of Total 16.13% 17.69% 18.75% 19.03% 19.15% 19.37%
FEDERAL RESOURCES
8514 Title I $269,782 $284,648 $363,865 $334,178 $375,847 $375,847 41,669 12.47%
8515 Title II Part A 93,584 93,745 93,516 93,516 91,935 91,935 (1,581) -1.69%
8515 Title II Part D - - - - - - 0
8516 Title III 18,301 15,827 - - - - 0
8517 Title IV - - - - - - 0
8518 Title V - - - - - - 0
8690 Other Restricted Grants - - - - - - 0
8708 ARRA SFSF - - - - - - 0
8709 ARRA Ed Jobs - - - - - - 0
8810 Access Funding 72,274 87,834 71,861 100,000 72,000 75,000 (25,000) -25.00%
8820 Access Funding 30,260 18,846 4,752 20,000 4,600 5,000 (15,000) -75.00%
Total Federal $484,202 $500,900 $533,993 $547,694 $544,382 $547,782 88 0.02%
% of Total 0.55% 0.57% 0.58% 0.58% 0.57% 0.55%
OTHER SOURCES
9400 Sale Fixed Assets 1,901,625 47,994 44,173 40,000 60,873 40,000 0 0.00%
Total Other Sources 1,901,625 47,994 44,173 40,000 60,873 40,000 - 0.00%
% of Total 2.17% 0.05% 0.05% 0.04% 0.06% 0.04% 0.00%
Total Revenue $87,599,661 $88,605,500 $92,275,916 $95,086,629 $96,136,563 $100,107,023 5,020,394 5.28%
FINANCIAL INFORMATION
Revenue Sources

Revenue Sources
Local $80,132,884
State $19,386,357
Federal $547,782
Other $40,000
$100,107,023
Expenditure Uses
Instruction $68,568,449
Support Services $28,935,348
Community Services $2,005,420
Debt Service $1,257,257
Transfers $1,140,714
Reserves $0
$101,907,188
Difference Revenue to Expense $1,800,165
Use of Fund Balance $1,800,165
$0
FINANCIAL INFORMATION
Revenue & Expense Analysis
Total Revenue Sources
Last printed 1/10/2017 10:19 AM
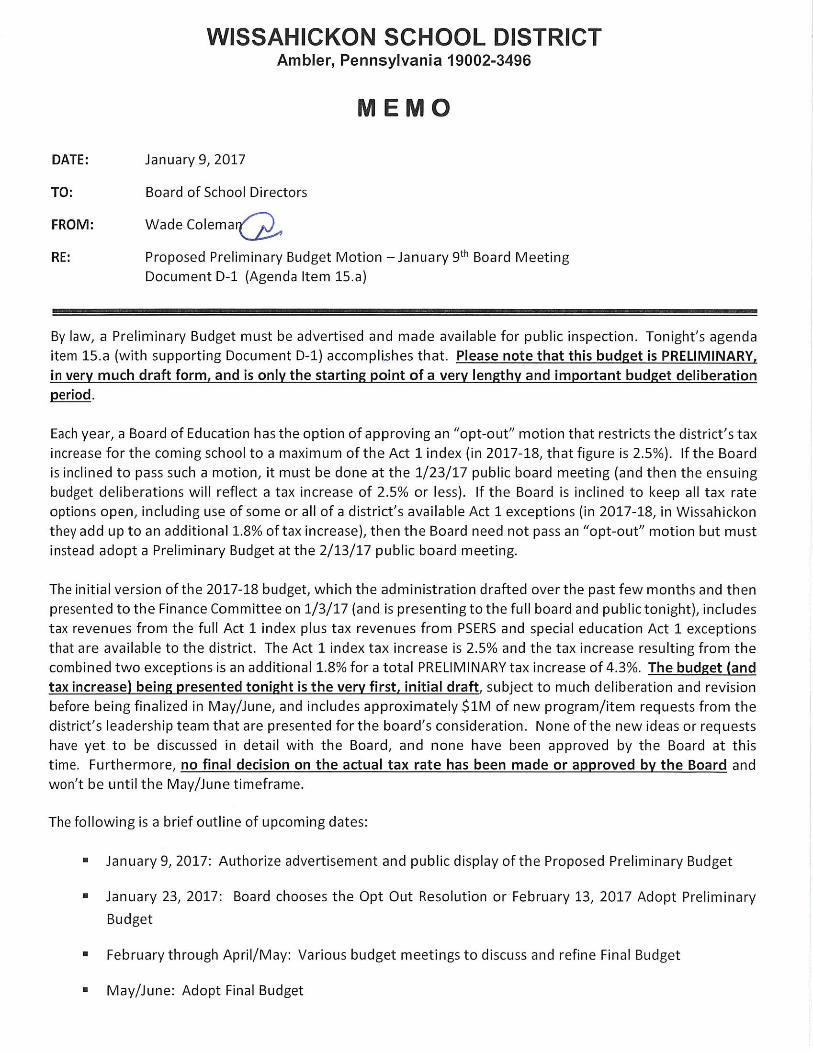
Overview: Regular Education
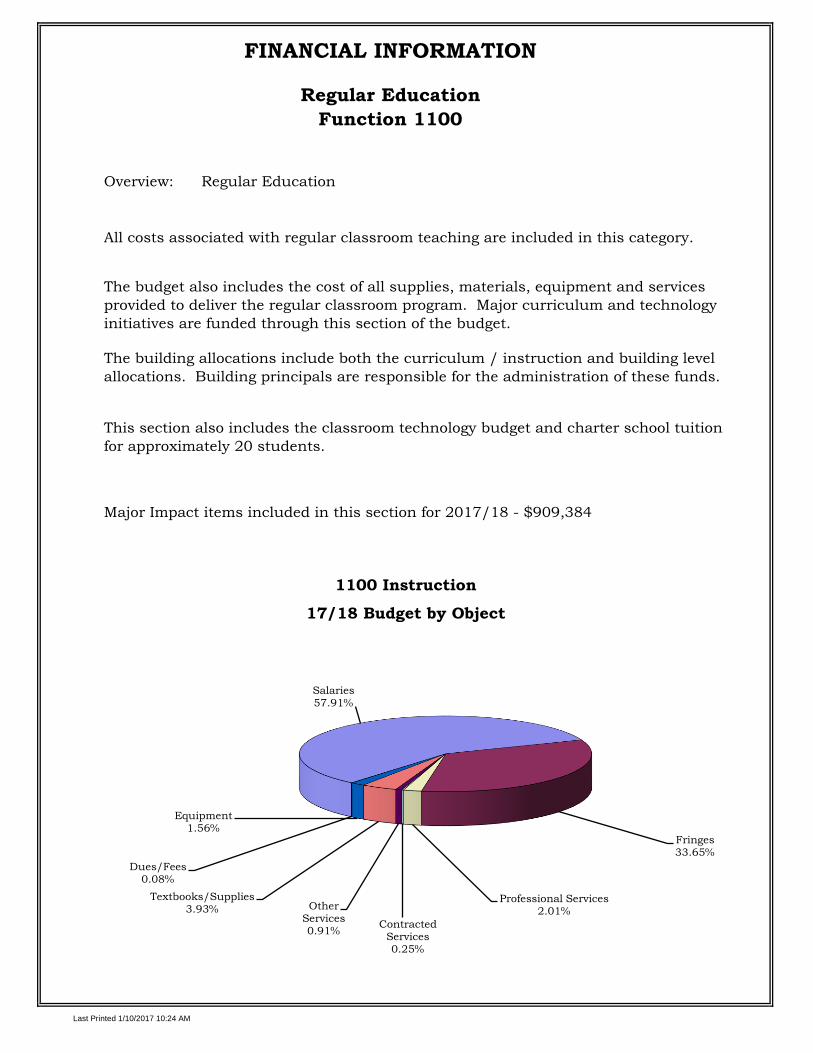
FINANCIAL INFORMATION
Regular Education
Function 1100
All costs associated with regular classroom teaching are included in this category.
17/18 Budget by Object
The budget also includes the cost of all supplies, materials, equipment and services
provided to deliver the regular classroom program. Major curriculum and technology
initiatives are funded through this section of the budget.
The building allocations include both the curriculum / instruction and building level
allocations. Building principals are responsible for the administration of these funds.
This section also includes the classroom technology budget and charter school tuition
for approximately 20 students.
1100 Instruction
Major Impact items included in this section for 2017/18 - $909,384
Salaries57.91%
Fringes33.65%
Professional Services2.01%
Contracted Services0.25%
Other Services0.91%
Textbooks/Supplies3.93%
Equipment1.56%
Dues/Fees0.08%
Last Printed 1/10/2017 10:24 AM
Actual
13/14
Actual
14/15
Actual
15/16
Budget
16/17
Projected
16/17
Budget
17/18
Budget
Difference %
Salaries 25,268,985 25,636,134 26,141,120 26,356,000 25,904,890 27,973,651 1,617,651 6.14%
Fringes
PSERS 4,272,900 5,584,864 6,788,405 7,777,275 7,806,846 8,769,388 992,113 12.76%
All Other 6,444,464 6,518,144 6,844,316 6,641,762 7,135,092 7,485,212 843,450 12.70%
Professional Services
Other - - - - - -
Technical Services 254,499 941,914 932,344 674,442 969,693 970,048 295,606 43.83%
Contracted Services
Repairs 39,545 14,694 14,684 60,425 60,375 70,425 10,000 16.55%
Rentals 11,716 11,671 11,671 12,072 12,072 12,072 - 0.00%
Other Services
Postage 22,525 25,149 18,293 17,100 16,400 15,826 (1,274) -7.45%
Telecommunication 14,444 5,919 12,243 16,290 20,571 23,880 7,590 46.59%
Printing - 335 1,072 1,100 1,100 1,100 - 0.00%
Tuition 215,601 227,583 228,913 255,000 185,300 263,100 8,100 3.18%
Travel 15,312 15,574 11,319 30,350 29,750 35,000 4,650 15.32%
Textbooks/Supplies 1,059,786 1,057,381 1,241,573 1,133,015 842,958 1,197,470 64,455 5.69%
Curriculum Review Cycle - - 700,000 700,000 700,000 - 0.00%
Equipment
New 674,872 754,917 703,690 744,824 740,823 720,864 (23,960) -3.22%
Replacement 42,540 36,318 25,673 39,200 33,900 32,596 (6,604) -16.85%
Dues/Fees 20,978 29,615 26,067 36,800 34,800 37,600 800 2.17%
38,358,167 40,860,213 43,001,383 44,495,656 44,494,570 48,308,233 3,812,576 8.57%
FINANCIAL INFORMATION
Regular Education
Function 1100
Total
$25,000,000
$27,000,000
$29,000,000
$31,000,000
$33,000,000
$35,000,000
$37,000,000
$39,000,000
$41,000,000
$43,000,000
$45,000,000
$47,000,000
$49,000,000
$51,000,000
Actual13/14
Actual14/15
Actual15/16
Budget 16/17 Projected 16/17 Budget 17/18
Tota
l D
oll
ar
Am
ount
1100 Instruction Budget Comparison
Last printed 1/10/2017 10:24 AM

Overview: Federal Instructional Programs
17/18 Budget by Object
1190 Federal Instructional Programs
FINANCIAL INFORMATION
Federal Instructional Programs
Function 1190
Services are provided to selected students under Federal Grants Title I, Title II Part A,
and Title III.
Revenue is received from the federal government in an amount equal to these
expenditures.
Salaries64%
Fringes31%
Textbooks/Supplies5%
Last printed 1/10/2017 10:24 AM

Actual
13/14
Actual
14/15
Actual
15/16
Budget
16/17
Projected
16/17
Budget
17/18
Budget
Difference %
Salaries 239,949 285,959 312,772 258,496 366,935 439,892 181,397 70.17%
Fringes
PSERS 19,318 27,054 41,438 77,626 82,583 143,273 65,647 84.57%
All Other 52,073 55,933 75,003 56,704 8,265 70,525 13,821 24.37%
Professional Services - - 22,918 - - - - #DIV/0!
Other Services
Travel 57 - - - - - - #DIV/0!
Textbooks/Supplies 67,993 43,498 8,388 38,637 35,837 35,837 (2,800) -7.25%
Equipment - - - - - - - #DIV/0!
Dues/Fees - - - - - - - #DIV/0!
379,390 412,443 460,519 431,463 493,620 689,527 258,064 59.81%
FINANCIAL INFORMATION
Federal Instructional Programs
Function 1190
Total
$0
$125,000
$250,000
$375,000
$500,000
$625,000
$750,000
Actual13/14
Actual14/15
Actual15/16
Budget16/17
Projected 16/17 Budget17/18
Tota
l D
oll
ar
Am
oun
t
1190 Federal Instruction Budget Comparison
Last printed 1/10/2017 10:24 AM

Overview: Special Education
Each student defined as special education or gifted must have an Individualized Educational
Program (IEP) or Gifted Individualized Educational Program (GIEP). The IEP/GIEP must list
any specially designed instruction necessary to meet educational needs and any related
services such as Speech and Language Therapy, Occupational Therapy, etc. if necessary.
FINANCIAL INFORMATION
Special Education
Function 1200
Provides service to students with special needs both physically/mentally challenged and gifted.
Programs are held within our facilities and in other schools throughout the area.
Students are also serviced by classes provided by Montgomery County Intermediate Unit. Some
of these classes are held within our school facilities and other classes are held in schools
throughout the county.
Wissahickon School District currently has 853 students classified as specialty designed
instruction and 391 students classified as gifted; 10 students attend Approved Private
Schools; 3 students are served by the Montgomery County Intermediate Unit and 2 students
by Bucks Country Intermediate Unit; 18 students are in Non-Traditional placements as
allowed by IDEA.
1200 Special Education
17/18 Budget by Object
Revenue is generated through a state subsidy of this program. It is estimated that the state
subsidy for Special Education will be $2,029,619 in 2017/18.
Salaries51.60%
Fringes30.86%
Professional Services6.44%
Repairs/Maint.0.01%
Other Services10.88%
Textbooks/Supplies0.20%
Dues/Fees0.03%
Last printed 1/10/2017 10:25 AM

Actual
13/14
Actual
14/15
Actual
15/16
Budget
16/17
Projected
16/17
Budget
17/18
Budget
Difference %
Salaries 7,812,724 8,123,765 8,522,877 8,681,952 8,872,877 9,438,636 756,684 8.72%
Fringes
PSERS 1,310,012 1,719,913 2,191,402 2,574,027 2,664,525 2,995,354 421,328 16.37%
All Other 2,487,593 2,611,707 2,788,673 2,618,375 2,942,276 3,055,852 437,477 16.71%
Professional Services
Elementary 198,360 275,772 355,050 361,388 372,866 440,630 79,241 21.93%
Secondary 444,099 492,644 376,508 448,759 377,058 450,830 2,071 0.46%
IDEA 205,990 264,302 297,246 272,748 265,526 265,526 (7,222) -2.65%
Contracted Services
Repairs/Maint. 463 499 512 1,000 676 750 (250) -25.00%
Other Services
Postage 5,422 6,053 7,084 2,800 1,800 1,800 (1,000) -35.71%
Telecommunication 879 1,437 1,150 3,000 6,103 7,280 4,280 142.67%
Tuition-Apv/Priv/Sch. 1,379,667 1,234,370 1,452,375 1,545,207 1,128,013 1,399,076 (146,131) -9.46%
Travel/Conference 18,932 12,472 10,949 13,700 8,351 13,700 - 0.00%
IDEA 244,839 274,759 237,392 265,648 272,870 272,870 7,222 2.72%
Textbooks/Supplies
Elementary 17,716 17,091 14,706 18,770 11,483 37,309 18,539 98.77%
Secondary 13,196 15,450 21,737 14,629 34,504 40,129 25,500 174.31%
IDEA - - - - - -
Equipment
New - - - - - - - #DIV/0!
Replacement - - - - - - - #DIV/0!
Dues/Fees 3,048 2,625 2,500 4,351 330 2,100 (2,251) -51.73%
14,142,940 15,052,859 16,280,162 16,826,353 16,959,257 18,421,841 1,595,489 9.48%
FINANCIAL INFORMATION
Special Education
Function 1200
Total
Last printed 1/10/2017 10:25 AM

Overview: Vocational Education
17/18 Budget by Object
FINANCIAL INFORMATION
Vocational Education
Function 1390
This budget includes tuition charges for students attending area vocational technical
schools.
This budget estimates that approximately 67 Wissahickon students will attend the
North Montco Vocational Technical School.
1390 Vocational Education
Tuition100%
Last printed 1/10/2017 10:25 AM

Actual
13/14
Actual
14/15
Actual
15/16
Budget
16/17
Projected
16/17
Budget
17/18
Budget
Difference %
Contracted ServicesRepairs/Maint. - 121,080 - - - - 0.00%
Other Services
Tuition 460,910 504,422 560,812 641,729 641,729 698,816 57,087 8.90%
460,910 504,422 681,892 641,729 641,729 698,816 57,087 8.90%
FINANCIAL INFORMATION
Vocational Education
Function 1390
Total
$350,000
$400,000
$450,000
$500,000
$550,000
$600,000
$650,000
$700,000
$750,000
Actual
13/14
Actual
14/15
Actual
15/16
Budget
16/17
Projected
16/17
Budget
17/18
Tota
l D
ollar
Am
ount
1390 Vocational Education Budget Comparison
Last printed 1/10/2017 10:25 AM

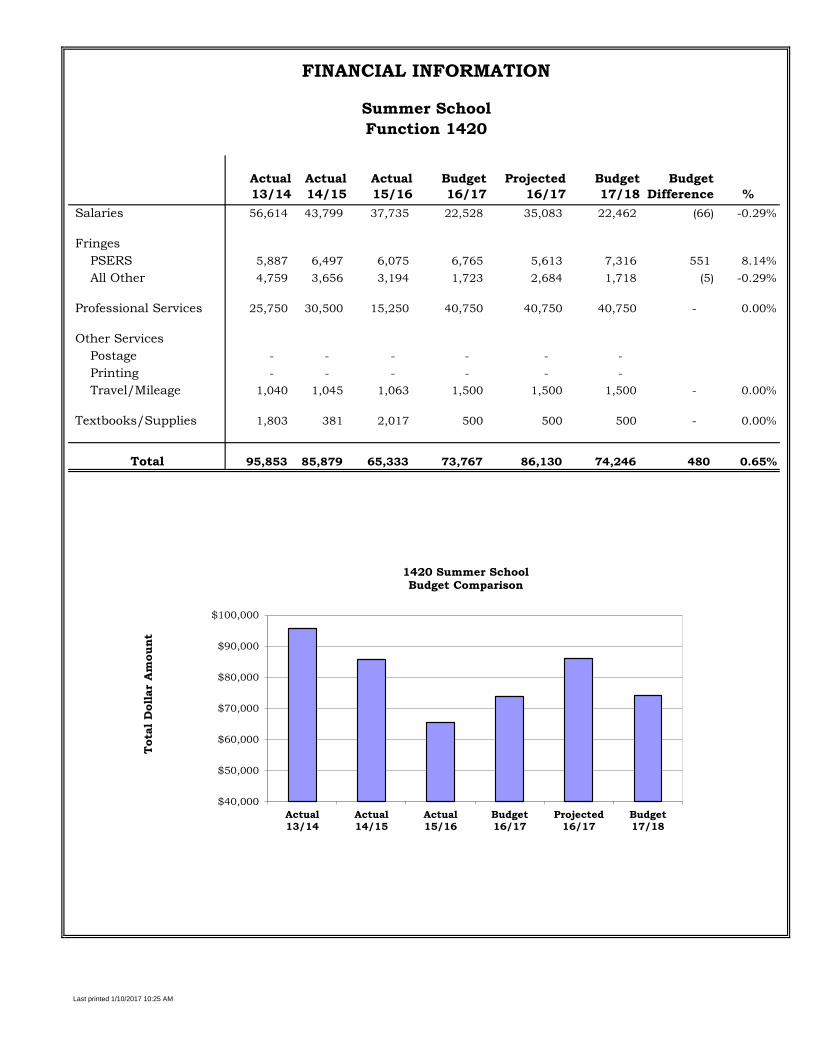
Overview: Summer School
FINANCIAL INFORMATION
Summer School
Function 1420
Costs are to operate remedial and enrichment programs beyond the normal school year.
17/18 Budget by Object
Salaries for the staff are in accordance with the WEA Professional agreement. Staffing
fluctuates based on student enrollment in the various programs.
Revenue is generated from tuition charged to the participants. It is estimated that the
revenue will be $30,000 in 2017/18.
1420 Summer School
Salaries30.25%
Fringes12.17%
Professional Services54.88%
Travel/Mileage2.02%
Textbooks/Supplies0.67%
Last printed 1/10/2017 10:25 AM
Actual
13/14
Actual
14/15
Actual
15/16
Budget
16/17
Projected
16/17
Budget
17/18
Budget
Difference %
Salaries 56,614 43,799 37,735 22,528 35,083 22,462 (66) -0.29%
Fringes
PSERS 5,887 6,497 6,075 6,765 5,613 7,316 551 8.14%
All Other 4,759 3,656 3,194 1,723 2,684 1,718 (5) -0.29%
Professional Services 25,750 30,500 15,250 40,750 40,750 40,750 - 0.00%
Other Services
Postage - - - - - -
Printing - - - - - -
Travel/Mileage 1,040 1,045 1,063 1,500 1,500 1,500 - 0.00%
Textbooks/Supplies 1,803 381 2,017 500 500 500 - 0.00%
95,853 85,879 65,333 73,767 86,130 74,246 480 0.65%
FINANCIAL INFORMATION
Summer School
Function 1420
Total
$40,000
$50,000
$60,000
$70,000
$80,000
$90,000
$100,000
Actual13/14
Actual14/15
Actual15/16
Budget16/17
Projected16/17
Budget17/18
Tota
l D
ollar
Am
ount
1420 Summer School Budget Comparison
Last printed 1/10/2017 10:25 AM

Overview: Homebound Instruction
17/18 Budget by Object
FINANCIAL INFORMATION
Homebound Instruction
Function 1430
Services are provided to students who are unable to attend regular classes for a period
of time during the school year.
This budget includes salaries on an as needed basis, travel and contracted services for
students our homebound staff cannot accommodate.
1430 Homebound Instruction
Salaries56.53%
Fringes22.74%
Professional Services20.73%
Last printed 1/10/2017 10:25 AM

Actual
13/14
Actual
14/15
Actual
15/16
Budget
16/17
Projected
16/17
Budget
17/18
Budget
Difference %
Salaries 28,568 9,604 12,879 15,360 9,500 15,000 (360) -2.34%
Fringes
PSERS 4,811 1,879 3,089 4,613 2,853 4,886 273 5.93%
All Other 2,300 811 1,101 1,175 727 1,148 (28) -2.34%
Professional Services
Other 3,859 2,038 7,392 5,000 5,500 5,500 500 10.00%
Other Services
Travel - - - 500 - - (500) -100.00%
39,538 14,333 24,461 26,648 18,580 26,534 (114) -0.43%
FINANCIAL INFORMATION
Homebound Instruction
Function 1430
Total
$0
$10,000
$20,000
$30,000
$40,000
$50,000
$60,000
Actual
13/14Actual
14/15Actual
15/16Budget
16/17Projected
16/17Budget
17/18
Tota
l D
ollar
Am
ount
1430 Homebound Instruction Budget Comparison
Last printed 1/10/2017 10:25 AM

Overview: Court Placed/Alternative Education
FINANCIAL INFORMATION
Court Placed/Alternative Education
Function 1440
Services are provided and tuition paid for students choosing to attend or placed in
alternative education programs.
17/18 Budget by Object
In 2016/17 there are approximately 21 students at alternative education programs.
1440 Court Placed/Alternative Education Costs
Other Services100%
Last printed 1/10/2017 10:25 AM

Actual
13/14
Actual
14/15
Actual
15/16
Budget
16/17
Projected
16/17
Budget
17/18
Budget
Difference %
Other Services
Tuition 315,742 344,857 223,315 327,853 292,854 339,252 11,399 3.48%
Dues/Fees - 400 - - - - -
315,742 344,857 223,715 327,853 292,854 339,252 11,399 3.48%
FINANCIAL INFORMATION
Court Placed / Alternative Education
Function 1440
Total
$50,000
$100,000
$150,000
$200,000
$250,000
$300,000
$350,000
$400,000
$450,000
$500,000
$550,000
Actual13/14
Actual14/15
Actual15/16
Budget16/17
Projected16/17
Budget17/18
Tota
l D
ollar
Am
ount
Court Placed & Alternative Education Budget Comparison
Last printed 1/10/2017 10:25 AM

Overview: Contracted Title I Remedial Services with MCIU
1500 Nonpublic School Program Costs
17/18 Budget by Object
FINANCIAL INFORMATION
Nonpublic School Programs
Function 1500
The contracted amount with the MCIU is $8,728 for 2016/17 and it represents Title I
services provided to nonpublic students.
Professional Service
100%
Last printed 1/10/2017 10:25 AM

Actual
13/14
Actual
14/15
Actual
15/16
Budget
16/17
Projected
16/17
Budget
17/18
Budget
Differenc
e %
IU Contracted Service
Professional Service 10,000 6,186 5,834 10,000 8,728 10,000 - 0.00%
10,000 6,186 5,834 10,000 8,728 10,000 - 0.00%
FINANCIAL INFORMATION
Nonpublic School Programs
Function 1500
Total
$-
$5,000
$10,000
$15,000
$20,000
Actual
13/14
Actual
14/15
Actual
15/16
Budget
16/17
Projected
16/17
Budget
17/18
Tota
l D
ollar
Am
ount
Nonpublic School Programs Budget Comparison
Last printed 1/10/2017 10:25 AM

Overview: Pupil Personnel Supervision
FINANCIAL INFORMATION
Pupil Personnel Supervision
Function 2110
Responsible for the administration of all student support services.
17/18 Budget by Object
Expenditures include the partial salary of the Assistant Superintendent and a full-time
confidential secretary; 50% is expensed to Pupil Personnel and 50% to special
education (1200). Also included is the partial salary of the District Registrar, 67% is
allocated to Pupil Personnel and 33% to Regular Education (1100).
This budget includes specific services needed for a variety of pupil services functions.
Examples of this include legal workshops necessary to keep staff abreast of any
changes in the law that directly affects students (ex. Custody, The Family Rights and
Privacy Act, etc.)
2110 Pupil Personnel
Salaries61.16%
Fringes32.99%
Professional Services0.39%
Other Services1.08%
Supplies/Books/ Per.0.91%
Dues/Fees0.39%
Last printed 1/10/2017 10:25 AM

Actual
13/14
Actual
14/15
Actual
15/16
Budget
16/17
Projected
16/17
Budget
17/18
Budget
Difference %
Salaries 106,416 91,643 150,601 153,460 153,237 158,857 5,397 3.52%
Fringes
PSERS 16,037 16,092 38,014 45,117 46,017 50,071 4,954 10.98%
All Other 36,182 35,761 32,786 33,862 35,314 35,609 1,747 5.16%
Professional Services - - - - - -
Technical Services 12,504 4,789 8,781 4,500 45 1,000 (3,500) -77.78%
Other Services
Postage 38 - - 1,000 500 500 (500) -50.00%
Telecommunication 29 - 297 1,200 900 1,200 - 0.00%
Travel 113 65 846 5,000 4,000 5,000 - 0.00%
Textbooks/Supplies 303 1,171 2,536 2,000 2,000 6,500 4,500 225.00%
Dues/Fees 340 - 195 1,000 1,000 1,000 - 0.00%
171,960 149,521 234,056 247,139 243,013 259,736 12,598 5.10%
FINANCIAL INFORMATION
Pupil Personnel Supervision
Function 2110
Total
$100,000
$125,000
$150,000
$175,000
$200,000
$225,000
$250,000
$275,000
$300,000
$325,000
Actual13/14
Actual14/15
Actual15/16
Budget16/17
Projected16/17
Budget17/18
Tota
l D
ollar
Am
ount
2110 Pupil Personnel Supervision Budget Comparison
Last printed 1/10/2017 10:25 AM

Overview: Guidance Services
FINANCIAL INFORMATION
Guidance Services
Function 2120
Guidance is an integral part of the school program, consisting of a coordinated plan
involving pupils, parents, and all members of the professional staff, as well as
numerous specialists. The counselor is the key figure in the program, working directly
with students and serving as a resource person for parents, teachers, and
administrators in helping children and youth to meet their developmental needs.
2120 Guidance Services
17/18 Budget by Object
Salaries60.77%
Fringes34.92%
Professional Services3.78%
Other Services0.12%
Textbooks/Supplies0.38%
Dues/Fees0.02%
Last printed 1/10/2017 10:25 AM

Actual
13/14
Actual
14/15
Actual
15/16
Budget
16/17
Projected
16/17
Budget
17/18
Budget
Difference %
Salaries 1,372,070 1,412,314 1,512,734 1,511,753 1,549,040 1,558,040 46,288 3.06%
Fringes
PSERS 231,299 297,902 393,305 453,979 465,177 502,449 48,469 10.68%
All Other 378,513 385,808 378,896 390,296 397,256 392,780 2,485 0.64%
Professional Services - 1,177 500 12,550 79,700 97,000 84,450 672.91%
Technical Services - - - - - -
Contracted Services
Repairs - - - - - -
Other Services
Postage 77 27 17 500 250 250 (250) -50.00%
Printing - - - 1,500 1,500 1,500 - 0.00%
Travel 1,116 200 786 1,300 1,300 1,300 - 0.00%
Textbooks/Supplies 3,685 8,738 5,852 9,700 8,794 9,850 150 1.55%
Dues/Fees 280 640 315 500 500 500 - 0.00%
1,987,039 2,106,805 2,292,405 2,382,077 2,503,517 2,563,669 181,592 7.62%
FINANCIAL INFORMATION
Guidance Services
Function 2120
Total
$1,000,000$1,150,000$1,300,000$1,450,000$1,600,000$1,750,000$1,900,000$2,050,000$2,200,000$2,350,000$2,500,000$2,650,000
Actual
13/14
Actual
14/15
Actual
15/16
Budget
16/17
Projected
16/17
Budget
17/18
Tota
l D
ollar
Am
ount
2120 Guidance Services Budget Comparison
Last printed 1/10/2017 10:25 AM

Overview: Psychological Services
Psychologists in the Wissahickon School District perform:
2140 Psychological Services
17/18 Budget by Object
There are 4 full-time psychologists and 1 secretary
FINANCIAL INFORMATION
Psychological Services
Function 2140
Consultation, counseling and follow-up with parents, school staff, and administrators in
regard to the educational and psychological needs of students who have been referred for
a multidisciplinary team evaluation
Serve as member of Child Study Teams, Instructional Support Teams and Student
Assistance Teams
Provides the psychological testing, evaluation, placement and support services to the students
of the District.
Psychological services are mandated under the Pennsylvania State standards and regulations
for special education.
Psychometric testing for all students thought to be "eligible" for special education services
Complete mandatory three year re-evaluations for all special education students
Salaries59.58%
Fringes36.56%
Professional Services1.84%
Other Services0.24%
Textbooks/Supplies1.77%
Last printed 1/10/2017 10:25 AM

Actual
13/14
Actual
14/15
Actual
15/16
Budget
16/17
Projected
16/17
Budget
17/18
Budget
Difference %
Salaries 364,455 376,558 381,509 391,010 390,665 426,565 35,555 9.09%
Fringes
PSERS 61,702 79,369 98,563 117,420 117,317 136,594 19,173 16.33%
All Other 141,405 134,670 135,236 116,576 142,526 125,182 8,606 7.38%
Professional Services 14,560 31,250 44,500 13,200 12,240 13,200 - 0.00%
Technical Services - - - - - -
Contracted Services - - - - - -
Other Services
Postage 138 - 9 175 - - (175) -100.00%
Travel 535 1,625 1,795 3,400 1,700 1,700 (1,700) -50.00%
Textbooks/Supplies 6,495 16,778 10,439 10,000 10,139 12,703 2,703 27.03%
Equipment - - - - - -
Dues/Fees - - - - - -
589,291 640,249 672,051 651,781 674,587 715,944 64,163 9.84%
FINANCIAL INFORMATION
Psychological Services
Function 2140
Total
$50,000
$150,000
$250,000
$350,000
$450,000
$550,000
$650,000
$750,000
Actual13/14
Actual14/15
Actual15/16
Budget16/17
Projected16/17
Budget17/18
Tota
l D
ollar
Am
ount
2140 Psychological Services Budget Comparison
Last printed 1/10/2017 10:25 AM

Overview: Home and School Visitor
The District began the year with 1 home and school visitor.
FINANCIAL INFORMATION
Home and School Visitor
Function 2160
Provides social services to school and community and assistance in residency requirements of
students.
Home and School Visitor functions include:
2160 Home and School Visitor
17/18 Budget by Object
Tracking the daily attendance of students
Investigation of non-resident students
Coordination with Children and Youth Services
Liaison to alternative schools
Salaries57.36%
Fringes34.83%
Professional Services5.08%
Other Services2.73%
Last printed 1/10/2017 10:25 AM

Actual
13/14
Actual
14/15
Actual
15/16
Budget
16/17
Projected
16/17
Budget
17/18
Budget
Difference %
Salaries 109,362 110,153 111,306 110,170 110,835 112,814 2,645 2.40%
Fringes
PSERS 18,470 23,383 28,690 32,889 33,284 36,532 3,643 11.08%
All Other 29,054 19,160 30,102 30,274 31,421 31,983 1,709 5.64%
Professional Services 7,170 10,025 9,163 15,000 6,400 10,000 (5,000) -33.33%
Technical Services - - - - - -
Other Services
Postage - - - 120 - - (120) -100.00%
Telecommunication 423 606 668 360 340 360 - 0.00%
Travel 2,215 4,447 4,482 3,200 4,800 5,000 1,800 56.25%
Textbooks/Supplies 154 98 60 250 - - (250) -100.00%
Dues/Fees - 150 - 60 - - (60) -100.00%
166,848 168,021 184,471 192,323 187,080 196,690 4,366 2.27%
FINANCIAL INFORMATION
Home and School Visitor
Function 2160
Total
$50,000
$100,000
$150,000
$200,000
$250,000
$300,000
Actual13/14
Actual14/15
Actual15/16
Budget16/17
Projected16/17
Budget17/18
Tota
l D
ollar
Am
ount
2160 Home & School Visitor Budget Comparison
Last printed 1/10/2017 10:25 AM

Overview: Student Accounting
17/18 Budget by Object
FINANCIAL INFORMATION
Student Accounting
Function 2170
Student accounting is responsible for maintaining student registrations, attendance,
withdrawals and census information.
The salary reflects one staff member whose primary function is student accounting.
This budget includes workshops to stay current on state regulations regarding student
and membership reporting, the registration process and census.
2170 Student Accounting
Salaries63.48%
Fringes34.53%
Technical Services0.58%
Other Services1.19%
Textbooks/Supplies0.14%
Last printed 1/10/2017 10:25 AM

Actual
13/14
Actual
14/15
Actual
15/16
Budget
16/17
Projected
16/17
Budget
17/18
Budget
Difference %
Salaries 52,642 53,983 55,502 56,203 56,627 58,682 2,479 4.41%
Fringes
PSERS 8,887 11,449 14,342 16,196 17,005 18,373 2,177 13.44%
All Other 12,424 12,374 12,945 12,883 13,515 13,543 660 5.13%
Technical Services - - - 200 - 540 340 170.00%
Other Services
Postage 117 138 58 150 - 150 - 0.00%
Travel 843 1,018 925 950 807 950 - 0.00%
Textbooks/Supplies - - - 100 - 100 - 0.00%
Equipment - - - - - -
Dues/Fees 114 60 60 100 60 100 - 0.00%
75,027 79,022 83,831 86,782 88,014 92,438 5,656 6.52%
FINANCIAL INFORMATION
Student Accounting
Function 2170
Total
$10,000
$20,000
$30,000
$40,000
$50,000
$60,000
$70,000
$80,000
$90,000
$100,000
Actual13/14
Actual14/15
Actual15/16
Budget16/17
Projected16/17
Budget17/18
Tota
l D
ollar
Am
ount
2170 Student Accounting Budget Comparison
Last printed 1/10/2017 10:25 AM

Overview: Technology Support Services
FINANCIAL INFORMATION
Technology Support Services
Function 2220
Supports the technological operation of the School District.
17/18 Budget by Object
Six staff members support this operation, including four technology assistants and one
communication specialist.
2220 Technology Support Services
Salaries58.29%
Fringes39.97%
Textbooks/Supplies3.83%
Equipment0.66%
Last printed 1/10/2017 10:25 AM

Actual
13/14
Actual
14/15
Actual
15/16
Budget
16/17
Projected
16/17
Budget
17/18
Budget
Difference %
Salaries 300,303 339,858 349,078 352,977 354,314 302,057 (50,920) -14.43%
Fringes
PSERS 50,290 72,089 88,879 104,051 106,400 93,359 (10,692) -10.28%
All Other 108,499 110,344 119,330 140,676 125,244 113,782 (26,895) -19.12%
Contracted Services
Repairs - - - - - -
Textbooks/Supplies
Elementary 291 237 237 2,900 2,900 2,400 (500) -17.24%
Secondary 2,246 2,357 2,541 3,230 3,230 3,230 - 0.00%
Equipment
New
Elementary - - 395 1,500 1,500 1,500 - 0.00%
Secondary - - 801 900 900 900 - 0.00%
Replacement
Elementary - - - - - 500
Secondary - - - - - 500
461,629 524,885 561,261 606,235 594,489 518,228 (88,007) -14.52%
FINANCIAL INFORMATION
Technology Support Services
Function 2220
Total
$50,000$100,000$150,000$200,000$250,000$300,000$350,000$400,000$450,000$500,000$550,000$600,000$650,000
Actual
13/14
Actual
14/15
Actual
15/16
Budget
16/17
Projected
16/17
Budget
17/18
Tota
l D
ollar
Am
ount
2220 Technical Support Budget Comparison
Last printed 1/10/2017 10:25 AM

Overview: Library
17/18 Budget by Object
2250 Library
FINANCIAL INFORMATION
Library
Function 2250
Expenditures include staffing, materials and equipment to operate the school libraries.
Salaries58.02%
Fringes38.35%
Professional Services0.03%
Other Services0.09%Supplies
3.29%
Equipment0.09%
Dues/Fees0.13%
Last printed 1/10/2017 10:25 AM

Actual
13/14
Actual
14/15
Actual
15/16
Budget
16/17
Projected
16/17
Budget
17/18
Budget
Difference %
Salaries 832,227 864,751 881,852 885,773 895,080 924,331 38,559 4.35%
Fringes
PSERS 140,576 184,544 236,446 275,944 268,793 311,369 35,425 12.84%
All Other 273,550 263,445 284,464 262,344 298,575 299,539 37,195 14.18%
Professional Services - - - 500 500 500 - 0.00%
Contracted Services
Repairs - - - - - -
Other Services
Printing - - - - - -
Travel/Conferences 50 339 768 1,600 1,600 1,500 (100) -6.25%
Supplies
Supplies/Software 16,480 15,266 33,046 19,650 19,350 19,650 - 0.00%
Books 35,547 37,013 38,258 32,700 33,200 32,700 - 0.00%
Equipment
New 1,180 397 1,340 1,400 1,400 1,400 - 0.00%
Replacement - - - - - -
Dues/Fees 1,891 1,165 765 2,150 2,150 2,050 (100) -4.65%
1,301,500 1,366,919 1,476,939 1,482,061 1,520,648 1,593,039 110,978 7.49%
FINANCIAL INFORMATION
Library
Function 2250
Total
$200,000
$400,000
$600,000
$800,000
$1,000,000
$1,200,000
$1,400,000
$1,600,000
$1,800,000
Actual13/14
Actual14/15
Actual15/16
Budget16/17
Projected16/17
Budget17/18
Tota
l D
ollar
Am
ount
2250 Library Budget Comparison
Last printed 1/10/2017 10:25 AM

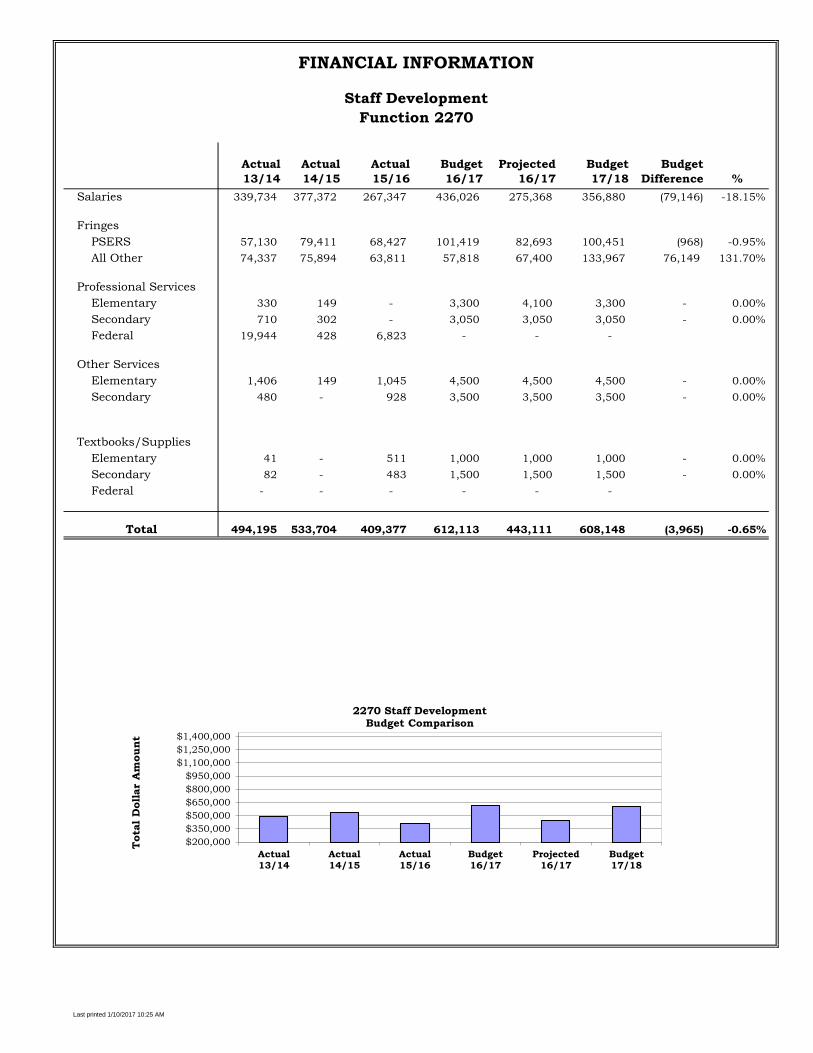
Overview: Staff Development
17/18 Budget by Object
Includes 2 full time staff developers and 1 Teacher on Special Assignment
Building allocations for staff conferences, workshops and travel
District-wide funding for in-service supplies, professional services, conferences and
workshops
FINANCIAL INFORMATION
Staff Development
Function 2270
The budget includes:
2270 Staff Development
Salaries58.68%
Fringes38.55%
Professional Services1.04%
Other Services1.32%
Textbooks/Supplies0.41%
Last printed 1/10/2017 10:25 AM
Actual
13/14
Actual
14/15
Actual
15/16
Budget
16/17
Projected
16/17
Budget
17/18
Budget
Difference %
Salaries 339,734 377,372 267,347 436,026 275,368 356,880 (79,146) -18.15%
Fringes
PSERS 57,130 79,411 68,427 101,419 82,693 100,451 (968) -0.95%
All Other 74,337 75,894 63,811 57,818 67,400 133,967 76,149 131.70%
Professional Services
Elementary 330 149 - 3,300 4,100 3,300 - 0.00%
Secondary 710 302 - 3,050 3,050 3,050 - 0.00%
Federal 19,944 428 6,823 - - -
Other Services
Elementary 1,406 149 1,045 4,500 4,500 4,500 - 0.00%
Secondary 480 - 928 3,500 3,500 3,500 - 0.00%
Textbooks/Supplies
Elementary 41 - 511 1,000 1,000 1,000 - 0.00%
Secondary 82 - 483 1,500 1,500 1,500 - 0.00%
Federal - - - - - -
494,195 533,704 409,377 612,113 443,111 608,148 (3,965) -0.65%
FINANCIAL INFORMATION
Staff Development
Function 2270
Total
$200,000
$350,000
$500,000
$650,000
$800,000
$950,000
$1,100,000
$1,250,000
$1,400,000
Actual13/14
Actual14/15
Actual15/16
Budget16/17
Projected16/17
Budget17/18
Tota
l D
ollar
Am
ount
2270 Staff Development Budget Comparison
Last printed 1/10/2017 10:25 AM

Overview: Board Services
FINANCIAL INFORMATION
Board Services
Function 2310
Services provided to assist the function of the School Board as they carry out their duties
17/18 Budget by Object
This budget includes:
2310 Board Services
The salary and fringe benefits associated with the School Board recording secretary
Professional services requested by the school board such as audit services, school board
liability insurances, board travel, audits and operating expenses are also included.
Annual membership fees for services provided by the Pennsylvania School Board
Association.
Salaries11.85%
Fringes7.44%
Professional Services23.97%
Other Services38.19%
Supplies3.36%
Dues/Fees15.19%
Last printed 1/10/2017 10:25 AM

Actual
13/14
Actual
14/15
Actual
15/16
Budget
16/17
Projected
16/17
Budget
17/18
Budget
Difference %
Salaries 14,909 15,177 15,225 15,590 15,507 15,895 305 1.95%
Fringes
PSERS 2,524 3,178 3,934 4,682 4,657 5,177 495 10.58%
All Other 2,736 3,359 4,490 4,550 4,538 4,801 251 5.52%
Professional Services
Audit 20,500 21,000 21,500 22,000 22,000 22,000 - 0.00%
Other Services 5,839 1,433 - 10,000 - 10,000 - 0.00%
Technical Services - 17,804 - 150 - 150 - 0.00%
Other Services
Advertising 4,616 5,360 4,911 7,000 6,800 7,000 - 0.00%
Insurance 29,551 32,319 30,645 31,957 33,723 33,217 1,260 3.94%
Postage - - - 600 523 - (600) -100.00%
Printing 306 - 1,925 1,000 366 1,000 - 0.00%
Travel 9,200 - 3,973 15,000 8,997 10,000 (5,000) -33.33%
Supplies
Supplies 5,375 6,293 3,356 4,500 4,800 4,200 (300) -6.67%
Publications - - 327 - - 300 300 #DIV/0!
Dues/Fees 18,397 18,132 17,825 20,372 19,190 20,372 - 0.00%
113,953 124,055 108,111 137,401 121,101 134,112 (3,289) -2.39%
FINANCIAL INFORMATION
Board Services
Function 2310
Total
$20,000
$40,000
$60,000
$80,000
$100,000
$120,000
$140,000
$160,000
Actual
13/14
Actual
14/15
Actual
15/16
Budget
16/17
Projected
16/17
Budget
17/18
Tota
l D
ollar
Am
ount
2310 Board Services Budget Comparison
Last printed 1/10/2017 10:25 AM

Overview: Board Treasurer
FINANCIAL INFORMATION
Board Treasurer
Function 2320
The treasurer is appointed by the School Board to review the District's financial
statements and to reconcile the District accounts on a monthly basis. The treasurer
makes this report to the School Board normally at the second regular monthly meeting.
17/18 Budget by Object
2320 Board Treasurer
Other Services100%
Last printed 1/10/2017 10:25 AM

Actual
13/14
Actual
14/15
Actual
15/16
Budget
16/17
Projected
16/17
Budget
17/18
Budget
Difference %
Other Services
Fidelity Bond 444 444 444 450 444 450 - 0.00%
444 444 444 450 444 450 - 0.00%
FINANCIAL INFORMATION
Board Treasurer
Function 2320
Total
$441
$442
$443
$444
$445
$446
$447
$448
$449
$450
$451
Actual
13/14
Actual
14/15
Actual
15/16
Budget
16/17
Projected
16/17
Budget
17/18
Tota
l D
ollar
Am
ount
2320 Board Treasurer Budget Comparison
Last printed 1/10/2017 10:25 AM

Overview: Tax Collection Services
17/18 Budget by Object
FINANCIAL INFORMATION
Tax Collection Services
Function 2330
The district utilizes the elected tax collectors from Ambler Borough, Lower Gwynedd
Township and Whitpain Township to collect the local real estate taxes. These collectors
are paid at a bill rate of $3.75. The tax collectors salary were adjusted for a four year
period effective July 1, 2013. In addition, they are reimbursed for printing, postage and
supplies.
2330 Tax Collection Services
Salaries19.85%
Fringes1.40%
Professional Services58.91%
Other Services19.48%
Publications/Supplies1.27%
Last printed 1/10/2017 10:25 AM

Actual
13/14
Actual
14/15
Actual
15/16
Budget
16/17
Projected
16/17
Budget
17/18
Budget
Difference %
Salaries
Real Estate 48,971 49,616 49,433 48,694 49,716 50,553 1,859 3.82%
Fringes
F.I.C.A. 4,109 4,163 4,147 4,085 4,178 3,570 (515) -12.61%
Professional Services
Commissions, Fees, etc. 167,840 133,651 127,611 150,000 148,650 150,000 - 0.00%
Other Services
Bonds 35,643 - - - - 36,000 36,000
Postage 6,503 6,054 98 6,831 5,184 6,831 - 0.00%
Printing 7,353 5,182 5,830 6,773 5,073 6,773 - 0.00%
Publications/Supplies 442 1,469 400 900 2,757 900 - 0.00%
270,860 200,134 187,519 217,283 215,558 254,627 37,344 17.19%
FINANCIAL INFORMATION
Tax Collection Services
Function 2330
Total
$50,000
$75,000
$100,000
$125,000
$150,000
$175,000
$200,000
$225,000
$250,000
$275,000
Actual13/14
Actual14/15
Actual15/16
Budget16/17
Projected16/17
Budget17/18
Tota
l D
ollar
Am
ount
2330 Tax Collection Services Budget Comparison
Last printed 1/10/2017 10:25 AM

Overview: Human Resources
17/18 Budget by Object
The total cost of personnel and human resources services to the District
including recruitment, placement, contract administration, leave and
benefit management and employee relations.
The salaries of the Director of Personnel, Benefits Administrator, 1
confidential secretary and 1 clerk typist positions.
A variety of items and services needed to maintain and improve the
standards required for the Personnel Department.
Some examples of these items and services include, but are not limited to services for
drug testing, recruitment, staff development, advertising, legal advice regarding
unemployment, workers compensation and other benefits.
FINANCIAL INFORMATION
Human Resources
Function 2340
This budget includes:
2340 Human Resources
Salaries57.29%
Fringes32.50%
Professional Services6.95%
Other Services2.26%
Supplies0.83%
Dues/Fees0.18%
Last printed 1/10/2017 10:25 AM

Actual
13/14
Actual
14/15
Actual
15/16
Budget
16/17
Projected
16/17
Budget
17/18
Budget
Difference %
Salaries 350,496 377,394 354,389 331,866 333,301 335,613 3,747 1.13%
Fringes
PSERS 59,495 78,792 90,954 99,254 100,090 107,624 8,370 8.43%
All Other 74,123 76,077 87,097 82,459 90,664 82,783 324 0.39%
Professional Services 26,623 39,643 41,996 40,686 39,028 40,686 - 0.00%
Technical Services 5,500 - - 1,817 - - (1,817) -100.00%
Other Services
Advertising 1,633 8,252 2,835 7,240 2,500 7,240 - 0.00%
Postage 2,271 2,630 1,305 2,163 2,143 2,163 - 0.00%
Printing - 225 - - - -
Travel/Conference - 968 574 3,399 2,310 3,399 - 0.00%
Telecommunication 376 356 530 420 740 420 - 0.00%
Supplies
Supplies 4,876 5,884 5,352 4,625 2,928 4,625 - 0.00%
Books - - 534 225 11 225 - 0.00%
Dues/Fees 337 510 1,147 1,030 690 1,030 - 0.00%
525,730 590,729 586,713 575,184 574,405 585,808 10,625 1.85%
FINANCIAL INFORMATION
Human Resources
Function 2340
Total
$100,000
$200,000
$300,000
$400,000
$500,000
$600,000
$700,000
Actual13/14
Actual14/15
Actual15/16
Budget16/17
Projected16/17
Budget17/18
Tota
l D
ollar
Am
ount
2340 Human Resources Budget Comparison
Last printed 1/10/2017 10:25 AM

Overview: Legal Services
17/18 Budget by Object
FINANCIAL INFORMATION
Legal Services
Function 2350
Includes the total cost of professional legal services provided to the District.
The budget is detailed to include retainage of the District solicitor and the cost for labor
relations, negotiations, special education, business needs and other services provided
by all law firms working on behalf of the District.
2350 Legal Services
Legal Services100%
Last printed 1/10/2017 10:25 AM

A
c
t
u
a
Actual
13/14
Actual
14/15
Actual
15/16
Budget
16/17
Projected
16/17
Budget
17/18
Budget
Difference %
Legal Services
Retainer 80,248 75,000 75,002 75,000 25,750 26,000 (49,000) -65.33%
Other 311,282 237,757 248,526 267,000 316,250 320,000 53,000 19.85%
391,530 312,757 323,528 342,000 342,000 346,000 4,000 1.17%
FINANCIAL INFORMATION
Legal Services
Function 2350
Total
$50,000
$100,000
$150,000
$200,000
$250,000
$300,000
$350,000
$400,000
$450,000
Actual
13/14
Actual
14/15
Actual
15/16
Budget
16/17
Projected
16/17
Budget
17/18
Tota
l D
ollar
Am
ount
2350 Legal Services
Budget Comparison
Last printed 1/10/2017 10:25 AM

Overview: Office of the Superintendent
2360 Office of the Superintendent
17/18 Budget by Object
FINANCIAL INFORMATION
Office of the Superintendent
Function 2360
Includes the operating costs of the District's executive offices including the salaries of
the Superintendent of Schools, a confidential secretary, travel expenses along with
professional and technical services.
Salaries63.81%
Fringes31.38%
Professional Services0.44%Other Services
3.59%
Supplies0.77%
Last printed 1/10/2017 10:25 AM

Actual
13/14
Actual
14/15
Actual
15/16
Budget
16/17
Projected
16/17
Budget
17/18
Budget
Difference %
Salaries 274,739 306,712 326,257 322,749 326,688 330,538 7,789 2.41%
Fringes
PSERS 46,395 59,689 81,413 93,768 95,101 97,476 3,708 3.95%
All Other 306,761 56,398 55,472 67,265 61,693 65,054 (2,211) -3.29%
Professional Services
Other Services - - - 2,000 181 300 (1,700) -85.00%
Technical Services 275 7,237 47 2,000 - 2,000 - 0.00%
Convocation 21,508 18,740 2,013 - - - - #DIV/0!
Other Services
Postage 682 1,654 3,096 4,000 3,966 4,000 - 0.00%
Telecommunication 1,151 1,013 1,226 2,100 2,170 1,600 (500) -23.81%
Travel 5,428 6,813 1,358 20,000 - 13,000 (7,000) -35.00%
Supplies
Supplies 1,407 3,026 992 4,785 277 3,500 (1,285) -26.85%
Books 854 584 - 500 31 500 - 0.00%
Equipment
New - - - - - -
Replacement - - - - - -
Dues/Fees 7,786 7,791 4,000 8,000 4,050 5,000 (3,000) -37.50%
666,989 469,656 475,874 527,168 494,157 522,968 (4,200) -0.80%
FINANCIAL INFORMATION
Office of the Superintendent
Function 2360
Total
$150,000
$250,000
$350,000
$450,000
$550,000
$650,000
Actual13/14
Actual14/15
Actual15/16
Budget16/17
Projected16/17
Budget17/18
Tota
l D
ollar
Am
ount
2360 Superintendent's Office Budget Comparison
Last printed 1/10/2017 10:25 AM

Overview: Community Relations Services
17/18 Budget by Object
FINANCIAL INFORMATION
Community Relations Services
Function 2370
Includes the operating costs of the District's Community Relations Services including
the salaries of the Coordinator of School and Community Information, travel expenses
along with professional and technical services.
2370 Community Relations Services
Salaries63.20%
Fringes31.08%
Professional Services0.44%Other Services
3.56%
Supplies0.76%
Dues/Fees0.96%
Last printed 1/10/2017 10:25 AM

Actual
13/14
Actual
14/15
Actual
15/16
Budget
16/17
Projected
16/17
Budget
17/18
Budget
Difference %
Salaries - 35,026 66,609 70,414 72,074 5,465 8.20%
Fringes
PSERS - 9,051 20,003 21,145 22,172 2,169 10.84%
All Other - 13,829 27,998 17,273 29,293 1,295 4.62%
Professional Services
Other Services - - - - -
Technical Services - - - - -
- - - - -
Other Services
Postage - - 3,700 2,457 3,700 - 0.00%
Printing - 4,750 - - 0.00%
Telecommunication - - 240 600 240 - 0.00%
Travel - - - - -
Supplies
Supplies - - 500 1,544 500 - 0.00%
Books - - 500 500 500 - 0.00%
Equipment
New - - - - -
Replacement - - - - -
Dues/Fees - - 265 270 265 - 0.00%
- - 57,905 119,815 118,954 128,744 8,929 7.45%
FINANCIAL INFORMATION
Community Relations Services
Function 2370
Total
$0
$20,000
$40,000
$60,000
$80,000
$100,000
$120,000
$140,000
$160,000
$180,000
$200,000
Actual13/14
Actual14/15
Actual15/16
Budget16/17
Projected16/17
Budget17/18
Tota
l D
ollar
Am
ount
2370 Community Relations Budget Comparison
Last printed 1/10/2017 10:25 AM

Overview: Principal's Office
17/18 Budget by Object
FINANCIAL INFORMATION
Principal's Office
Function 2380
This budget includes:
The operational cost of the school office including the principals, assistant principals and
their staff.
The salary of 6 principals, 5 assistant principals and 11 support staff positions.
2380 Principal's Office
Salaries62.25%
Fringes36.59%
Professional Services0.06%
Other Services0.41%
Supplies0.35%
Equipment0.10%
Dues/Fees0.23%
Last printed 1/10/2017 10:25 AM

Actual
13/14
Actual
14/15
Actual
15/16
Budget
16/17
Projected
16/17
Budget
17/18
Budget
Difference %
Salaries 2,176,826 2,181,560 1,980,396 2,153,543 2,027,926 2,204,772 51,230 2.38%
Fringes
PSERS 356,092 452,226 500,012 635,331 608,986 703,383 68,052 10.71%
All Other 497,725 710,521 539,302 559,998 571,036 592,616 32,618 5.82%
Professional Services 123 36 500 2,050 2,050 2,250 200 9.76%
Contracted Services
Repairs/Maintenance - - - - - - -
Other Services
Postage - - - - - -
Printing 179 - - - - - - #DIV/0!
Telecommunication 4,176 4,484 4,875 4,200 3,550 8,050 3,850 91.67%
Travel/Workshops 1,746 1,554 3,242 7,450 6,150 6,550 (900) -12.08%
Supplies
Supplies/Books 9,911 12,262 13,322 13,450 13,450 12,400 (1,050) -7.81%
Equipment
New 1,744 577 11,941 1,300 1,300 1,300 - 0.00%
Replacement 933 1,356 433 2,250 2,250 2,250 - 0.00%
Dues/Fees 5,836 7,785 6,403 8,900 7,700 8,300 (600) -6.74%
3,055,291 3,372,360 3,060,426 3,388,472 3,244,398 3,541,872 153,400 4.53%
FINANCIAL INFORMATION
Principal's Office
Function 2380
Total
$2,800,000
$2,900,000
$3,000,000
$3,100,000
$3,200,000
$3,300,000
$3,400,000
$3,500,000
$3,600,000
Actual13/14
Actual14/15
Actual15/16
Budget16/17
Projected16/17
Budget17/18
Tota
l D
ollar
Am
ount
2380 Principal's Office
Budget Comparison
Last printed 1/10/2017 10:25 AM

Overview: Nursing Services
Scoliosis screening is mandated for all students in grades 6 and 7
St. Helena's enrollment - 552 students
Gwynedd Mercy Academy Elementary enrollment - 393 students
Gwynedd Mercy High School enrollment - 400 students
FINANCIAL INFORMATION
Nursing ServicesFunction 2400
Nursing Services are provided to students attending both public and non-public schools
that lie within the District's geographical boundaries.
The School District anticipates receiving approximately $106,500 from the state to support
nursing, medical and dental services.
2400 Nursing Services
The District currently employs a Coordinator/Certified School Nurse, 4.5 additional
certified nurses and 4.5 staff nurses.
17/18 Budget by Object
Health Services are mandated by the State of Pennsylvania
Dental exams are required for all students in grades K, 3, and 7
Height, weight, vision and body mass index testing mandated for all students in
grades K-12
Physical exams are required for all students in grades K, 6, and 11
School districts are required to provide nursing services to non-public schools within
the geographical boundaries. In Wissahickon these services apply to:
Hearing testing mandated for all students in grades K, 1, 2, 3, 7, and 11
Salaries58.63%
Fringes38.92%
Professional Services0.44%
Contracted Services0.29%
Other Services0.72%
Supplies/Books0.83%
Equipment0.16%
Last printed 1/10/2017 10:25 AM

Actual
13/14
Actual
14/15
Actual
15/16
Budget
16/17
Projected
16/17
Budget
17/18
Budget
Difference %
Salaries 566,681 641,128 658,769 661,745 668,650 703,220 41,474 6.27%
Fringes
PSERS 94,113 136,226 170,097 198,722 200,796 229,039 30,317 15.26%
All Other 207,991 223,157 226,397 224,706 237,590 237,814 13,108 5.83%
Professional Services 4,902 530 3,682 5,300 4,445 5,300 - 0.00%
Contracted Services
Repairs 149 - - 3,535 3,535 3,535 - 0.00%
Rentals - - - - - -
Other Services
Postage 3,880 2,228 719 3,700 3,700 3,700 - 0.00%
Printing - - - 150 150 150 - 0.00%
Travel/Conference 625 1,959 1,465 4,645 4,150 4,645 - 0.00%
Telecommunication 879 838 888 160 555 160 - 0.00%- - - - - -
Supplies/Books 7,228 12,662 11,811 11,165 31,887 11,165 - 0.00%
Equipment
New 1,563 - - 50 50 50 - 0.00%
Replacement 816 5,760 2,793 9,880 9,880 9,880 - 0.00%
Dues/Fees 1,305 1,200 - 1,875 1,875 1,875 - 0.00%
890,133 1,025,688 1,076,621 1,125,634 1,167,263 1,210,532 84,899 7.54%
FINANCIAL INFORMATION
Nursing Services
Function 2400
Total
$200,000
$400,000
$600,000
$800,000
$1,000,000
$1,200,000
$1,400,000
Actual13/14
Actual14/15
Actual15/16
Budget16/17
Projected16/17
Budget17/18
Tota
l D
ollar
Am
ount
2400 Nursing Services Budget Comparison
Last printed 1/10/2017 10:25 AM

Overview: Business Services
17/18 Budget by Object
FINANCIAL INFORMATION
Business Services
Function 2500
Business Services is responsible for the administration of the District's budget, local
and state audits, District-wide bidding and purchasing, accounts payable/receivable,
cash flow, investments, generation of bi-weekly payroll, District insurance coverage and
the supervision of the Transportation, Plant Operation and Food Service Departments.
The operation is maintained by a Business Administrator, Assistant Business
Administrator, Business Administrator's confidential secretary, business office
purchasing secretary, payroll coordinator and accounts payable clerk.
2500 Business Office
Salaries56.41%
Fringes31.88%
Professional Services4.86%
Contracted Services0.48%
Other Services5.06%
Supplies1.10%
Dues/Fees0.21%
Last printed 1/10/2017 10:25 AM

Actual
13/14
Actual
14/15
Actual
15/16
Budget
16/17
Projected
16/17
Budget
17/18
Budget
Difference %
Salaries 477,240 494,939 497,954 506,531 505,564 514,711 8,180 1.61%
Fringes
PSERS 80,122 106,941 139,222 165,428 151,821 179,829 14,401 8.71%
All Other 102,775 106,711 108,097 109,886 116,149 111,052 1,166 1.06%
Professional Services
Copy Center Serv. - - - - - -
Technical Serv. 40,793 41,743 55,818 44,333 42,168 44,333 - 0.00%
Contracted Services
Maintenance 2,429 672 776 4,380 4,244 4,380 - 0.00%
Other Services
Postage/Telephones 3,283 1,284 10,105 7,600 7,597 7,600 - 0.00%
Telecommunication 17,886 19,144 19,397 26,900 25,550 26,900 - 0.00%
Print/Travel/Adver. 7,404 5,681 4,125 11,700 7,833 11,700 - 0.00%
Supplies 9,396 8,125 11,223 10,000 7,112 10,000 - 0.00%
Books and Periodicals - - - - - -
Dues/Fees 1,417 839 1,444 1,400 820 1,900 500 35.71%
742,744 786,080 848,161 888,157 868,858 912,405 24,248 2.73%
FINANCIAL INFORMATION
Business Services
Function 2500
Total
$100,000
$200,000
$300,000
$400,000
$500,000
$600,000
$700,000
$800,000
$900,000
$1,000,000
Actual13/14
Actual14/15
Actual15/16
Budget16/17
Projected16/17
Budget17/18
Tota
l D
ollar
Am
ount
2500 Business Office
Budget Comparison
Last printed 1/10/2017 10:25 AM

Overview: Plant and Maintenance Expenses
FINANCIAL INFORMATION
Plant Operations and Maintenance
Function 2600
Expenditures include costs associated with maintaining 8 buildings; 4 elementary
schools, a middle school, a high school, a bus garage and the administrative office
building. The District maintains 840,000 square feet of building space and 215 acres of
land and playing fields.
17/18 Budget by Object
The operation is staffed by a Director of Buildings and Grounds, Supervisor of
Operations, secretary, 6 building supervisors, 2 crew leaders, 6 maintenance personnel,
2 grounds-crew personnel, 36.5 custodians and a delivery/receiving person.
2600 Plant Operations/Maintenance
Salaries38.53%
Fringes27.51%
Professional Services1.10%
Contracted Services21.83%
Other Services2.76%
Supplies/Publications7.77%
Equipment0.38%
Dues/Fees0.11%
Last printed 1/10/2017 10:25 AM

Actual
13/14
Actual
14/15
Actual
15/16
Budget
16/17
Projected
16/17
Budget
17/18
Budget
Difference %
Salaries 2,836,564 2,898,181 2,960,760 3,033,202 3,031,819 3,077,168 43,966 1.45%
Fringes
PSERS 478,490 610,946 760,157 856,100 910,455 934,138 78,038 9.12%
All Other 1,074,086 1,213,903 1,136,842 1,175,706 1,196,217 1,262,793 87,087 7.41%
Professional Services 168,147 1,271,297 851,334 86,119 164,621 88,192 2,073 2.41%
Contracted Services
Utilities 1,005,830 782,806 870,452 894,300 901,400 936,700 42,400 4.74%
Maintenance 730,498 802,061 2,353,960 804,125 726,525 806,699 2,574 0.32%
Other Services
Insurance 157,075 163,507 175,750 200,000 190,805 200,000 - 0.00%
Operating Expense 15,520 12,086 11,823 11,000 11,000 11,000 - 0.00%
Telecommunications 7,140 6,202 6,460 9,700 9,700 9,700 - 0.00%
Supplies/Publications
Fuel Oil/Gas 340,257 350,159 266,836 280,000 280,000 280,000 - 0.00%
Operating Supplies 297,007 345,178 350,030 340,800 340,800 340,800 - 0.00%
Equipment
New 7,305 37,513 12,007 20,300 20,300 20,300 - 0.00%
Replacement - - - 20,000 20,000 9,800 (10,200) -51.00%
Dues/Fees 6,715 15,942 4,779 8,850 8,850 9,000 150 1.69%
7,124,634 8,509,780 9,761,190 7,740,202 7,812,492 7,986,290 246,087 3.18%
FINANCIAL INFORMATION
Plant Operations/Maintenance
Function 2600
Total
$2,000,000
$4,000,000
$6,000,000
$8,000,000
$10,000,000
$12,000,000
Actual
13/14
Actual
14/15
Actual
15/16
Budget 16/17Projected 16/17Budget 17/18
Tota
l D
oll
ar
Am
oun
t
2600 Plant Operations / Maintenance
Budget Comparison
Last printed 1/10/2017 10:25 AM

Overview: Students Transportation Services
FINANCIAL INFORMATION
Student Transportation Services
Function 2700
The School District anticipates receiving approximately $1,291,762 from the state to
support student transportation. The School District transports students to 6 District
schools and approximately 70 private and non-public schools.
2700 Transportation Services
17/18 Budget by Object
The District maintains a fleet of approximately 37 transportation vehicles.
The Montgomery County Intermediate Unit also provides transportation to several
students; in addition, 2 private contractors provide transportation services to our
students. The District currently contracts approximately 59 bus runs with First
Student Inc. and 1 bus run with Tropiano Transportation.
Costs associated with this operation are split between public and non-public students.
Salaries20.67%
Fringes13.25%
Professional Services0.17%
Contracted Services0.39%
Other Services59.24%
Supplies/Publications6.26%
Dues/Fees0.02%
Last printed 1/10/2017 10:25 AM

Actual
13/14
Actual
14/15
Actual
15/16
Budget
16/17
Projected
16/17
Budget
17/18
Budget
Difference %
Salaries 1,650,437 1,489,935 1,204,237 1,264,419 1,183,139 1,187,534 (76,885) -6.08%
Fringes
PSERS 292,054 328,450 330,123 329,260 370,312 338,252 8,991 2.73%
All Other 762,037 725,223 370,008 362,310 381,854 422,834 60,524 16.71%
Professional Services
Copy Center Serv. - - - - - -
Technical Services 7,055 7,641 8,727 9,544 7,846 9,544 - 0.00%
Contracted Services 18,360 16,013 9,008 22,450 22,244 22,450 - 0.00%
Other Services
MCIU Transportation 137,104 179,958 189,983 100,000 95,760 100,000 - 0.00%
Other Contr. Carriers 2,132,285 2,688,853 3,052,604 3,051,397 3,146,891 3,240,361 188,964 6.19%
Insurance 53,372 50,879 49,980 58,618 47,581 58,618 - 0.00%
Operating Expenses 3,015 2,061 1,835 3,700 10,029 3,700 - 0.00%
Supplies/Publications
Fuel 429,674 404,819 263,345 260,000 258,485 260,001 1 0.00%
Operating Supplies 80,298 95,254 97,310 99,650 90,849 99,650 - 0.00%
Equipment
New - - - - - -
Replacement - - - - - -
Dues/Fees 534 270 610 1,325 - 1,326 1 0.08%
5,566,225 5,989,355 5,577,771 5,562,673 5,614,990 5,744,270 181,596 3.26%
FINANCIAL INFORMATION
Student Transportation Services
Function 2700
Total
$5,300,000
$5,400,000
$5,500,000
$5,600,000
$5,700,000
$5,800,000
$5,900,000
$6,000,000
$6,100,000
Actual
13/14
Actual
14/15
Actual
15/16
Budget
16/17
Projected
16/17
Budget
17/18
Tota
l D
ollar
Am
ount
2700 Transportation Services Budget Comparison
Last printed 1/10/2017 10:25 AM

Overview: Central Support Services
FINANCIAL INFORMATION
Central Support Services
Function 2800
The budget includes expenses to support the District's administrative and
instructional technologies and related services.
17/18 Budget by Object
The salaries and fringe benefits cover the Director of Technology, Network & Systems
Administrator, Assistant Network & Systems Administrator, Supervisor of
Administrative Software and a secretarial position.
The budget function covers the cost of district-wide internet service, software and
hardware maintenance, infrastructure support, virus and filtering detection and
related supplies to support the District's technology.
2800 Central Support Services
Salaries49%
Fringes30%
Professional Services
21%
Other Services0%
Last printed 1/10/2017 10:25 AM

Actual
13/14
Actual
14/15
Actual
15/16
Budget
16/17
Projected
16/17
Budget
17/18
Budget
Difference %
Salaries 424,033 437,216 440,599 448,330 449,411 459,652 11,322 2.53%
Fringes
PSERS 71,145 91,732 112,373 133,668 134,958 147,807 14,139 10.58%
All Other 125,142 130,926 124,094 124,609 131,584 131,341 6,732 5.40%
Professional Services
Software/Technical 197,419 166,452 191,300 188,620 188,620 197,809 9,189 4.87%
Contracted Services - - - - - -
Other Services
Postage - - - - - -
Travel/Conference 827 1,600 1,130 1,900 1,900 1,900 - 0.00%
Telecommunication - - - - - -
Supplies/Software Lic. - 55 - 300 300 - (300) -100.00%
Equipment
New - - - - - -
Replacement - - - - - -
Dues/Fees 150 200 150 350 - - (350) -100.00%
818,717 828,181 869,647 897,777 906,773 938,508 40,732 4.54%
FINANCIAL INFORMATION
Central Support Services
Function 2800
Total
$300,000
$450,000
$600,000
$750,000
$900,000
$1,050,000
Actual13/14
Actual14/15
Actual15/16
Budget16/17
Projected16/17
Budget17/18
Tota
l D
oll
ar
Am
oun
t
2800 Central Support Services
Budget Comparison
Last printed 1/10/2017 10:25 AM

Overview: Other Support Services
Technology
County Wide Transportation Study
FINANCIAL INFORMATION
Other Support Services
Function 2900
Included is the cost of support services utilized by the District that are provided by
the Montgomery County Intermediate Unit.
17/18 Budget by Object
Support is provided for:
2900 Other Support Services
Joint Purchasing Operations
Curriculum Initiatives
Legislative Initiatives
Curriculum4.60%
Legislative6.10%
Technology85.11%
Joint Purchasing4.19%
Last printed 1/10/2017 10:25 AM

Actual
13/14
Actual
14/15
Actual
15/16
Budget
16/17
Projected
16/17
Budget
17/18
Budget
Differenc
e %
Other Services
Curriculum 3,527 3,360 3,633 3,400 3,400 3,721 321 9.44%
Legislative 4,745 4,851 4,807 5,084 5,084 4,933 (151) -2.97%
Technology 61,516 67,169 67,170 67,678 69,148 68,827 1,149 1.70%
Joint Purchasing 2,622 2,861 0 2,889 2,889 3,389 500 17.31%
72,410 78,241 75,610 79,051 80,521 80,870 1,819 2.30%
FINANCIAL INFORMATION
Other Support Services
Function 2900
Total
$10,000
$25,000
$40,000
$55,000
$70,000
$85,000
Actual
13/14Actual
14/15Actual
15/16Budget
16/17Projected
16/17Budget
17/18
Tota
l D
ollar
Am
ount
2900 Other Support Services Budget Comparison
Last printed 1/10/2017 10:25 AM

Overview: Student Activities
17/18 Budget by Object
Salaries include the Coordinator of Activities, 1 secretary, coaches and sponsors of the
various programs and teams, an activities support staff and transportation to and
from activities.
FINANCIAL INFORMATION
Student Activities
Function 3200
Student Activities provide both athletic and non-athletic programs primarily to the
District's secondary schools.
3200 Student Activities
Salaries59.68%
Fringes21.76%
Professional Services5.54%
Contracted Services0.54%
Other Services
2.20%Supplies/Publications
9.02%Equipment0.12%
Dues/Fees1.14%
Last printed 1/10/2017 10:25 AM

Actual
13/14
Actual
14/15
Actual
15/16
Budget
16/17
Projected
16/17
Budget
17/18
Budget
Difference %
Salaries 975,238 993,199 1,104,556 1,106,920 1,121,124 1,081,114 (25,806) -2.33%
Fringes
PSERS 137,067 177,621 231,787 283,729 336,674 255,791 (27,938) -9.85%
All Other 110,258 117,065 151,900 137,763 164,502 138,336 573 0.42%
Professional Services
Middle School 9,144 9,923 10,449 12,377 12,177 12,177 (200) -1.62%
High School 89,750 94,478 96,450 88,200 89,025 88,200 - 0.00%
Contracted Services
Middle School 300 3,700 3,053 4,620 2,120 2,120 (2,500) -54.11%
High School 10,231 5,443 14,842 10,100 7,600 7,600 (2,500) -24.75%
Other Services
Insurance-All Sport 9,025 9,025 9,930 11,000 11,000 11,000 - 0.00%
Middle School 572 483 465 420 420 420 - 0.00%
High School 23,703 27,329 31,007 31,468 28,468 28,468 (3,000) -9.53%
Supplies/Publications
Middle School 21,446 28,043 17,140 10,067 10,067 11,171 1,104 10.97%
High School 69,522 85,632 97,712 80,687 77,987 152,162 71,475 88.58%
Equipment
New
Middle School - - - 1,325 1,325 2,125 800 60.38%
High School - - 60,294 - - -
Replacement
Middle School - - - - - -
High School - - - - - -
Dues/Fees
Middle School - - 225 1,660 1,660 1,660 - 0.00%
High School 14,818 17,621 14,316 19,075 19,075 19,075 - 0.00%
- - - - - -
1,471,075 1,569,562 1,844,126 1,799,411 1,883,223 1,811,420 12,008 0.67%
FINANCIAL INFORMATION
Student Activities
Function 3200
Total
$0
$500,000
$1,000,000
$1,500,000
$2,000,000
Actual13/14
Actual14/15
Actual15/16
Budget 16/17Projected 16/17Budget 17/18
Tota
l D
ollar
Am
ount
3200 Student Activities Budget Comparison
Last printed 1/10/2017 10:25 AM
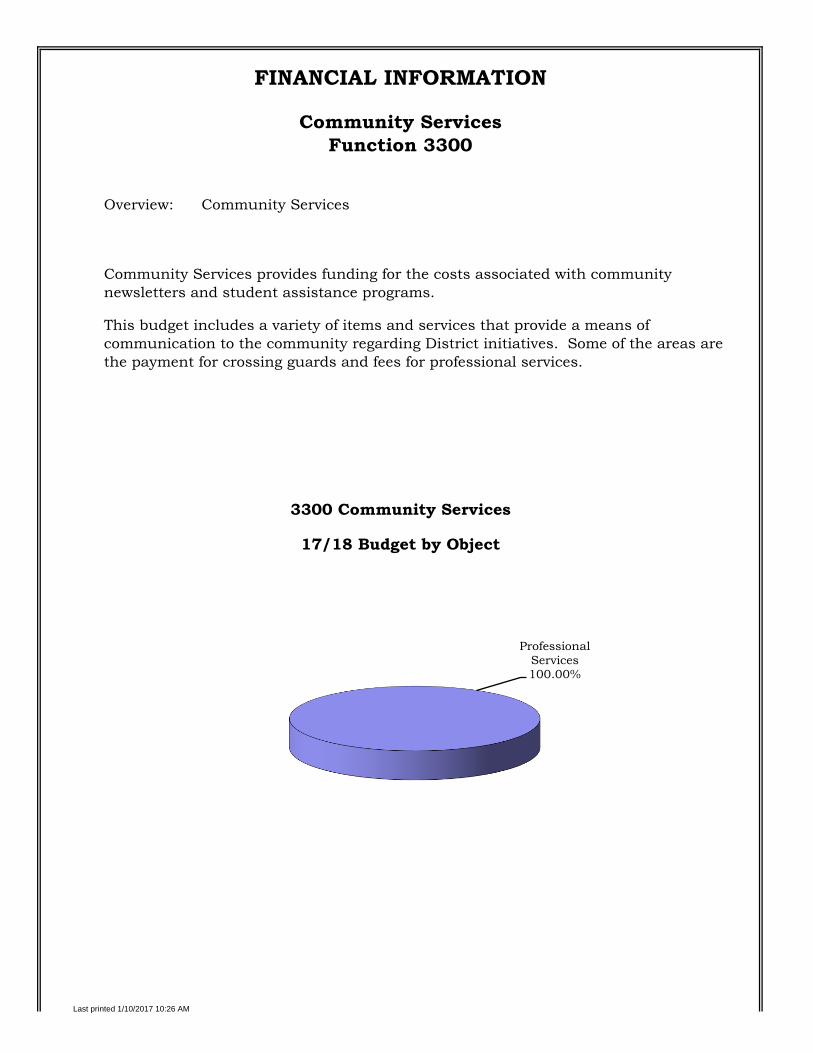
Overview: Community Services
17/18 Budget by Object
This budget includes a variety of items and services that provide a means of
communication to the community regarding District initiatives. Some of the areas are
the payment for crossing guards and fees for professional services.
FINANCIAL INFORMATION
Community Services
Function 3300
Community Services provides funding for the costs associated with community
newsletters and student assistance programs.
3300 Community Services
Professional Services100.00%
Last printed 1/10/2017 10:26 AM

Actual
13/14
Actual
14/15
Actual
15/16
Budget
16/17
Projected
16/17
Budget
17/18
Budget
Difference %
Salaries 30,022 - -
FringesPSERS 7,758 - - All Other 9,913 - -
Professional Services 56,202 105,380 185,606 194,000 193,619 194,000 - 0.00%
Other Services 6,631 - 956 - - -
Supplies/Publications - - 1,004 - - -
Dues/Fees - - 435 - - -
62,833 105,380 235,694 194,000 193,619 194,000 - 0.00%
FINANCIAL INFORMATION
Community Services
Function 3300
Total
$0
$50
$100
$150
$200
$250
$300
$350
Actual
13/14
Actual
14/15
Actual
15/16
Budget
16/17
Projected
16/17
Budget
17/18
Tota
l D
ollar
Am
ount
in T
housands
3300 Community Services Budget Comparison
Last printed 1/10/2017 10:26 AM

Overview: Debt Service
5110 Debt Service
17/18 Budget by Object
The District anticipates the state reimbursing $35,000 towards the District's debt
obligations for 2017/18.
FINANCIAL INFORMATION
Debt Service
Function 5110
Debt Service includes the annual principal and interest payments made on the
outstanding debt of the school district.
Interest/Fee Payments21.15%
Principal Payments29.21%
New Debt49.64%
Last printed 1/10/2017 10:26 AM

Actual
13/14
Actual
14/15
Actual
15/16
Budget
16/17
Projected
16/17
Budget
17/18
Budget
Difference %
Interest/Fee Payments 66,678 37,907 40,804 40,497 227,420 264,787 224,290 553.84%
Principal Payments 73,767 0 41,431 98,019 403,019 365,652 267,633 273.04%
New Debt 0 0 0 1,113,241 300,000 621,318 (491,923) -44.19%
Total 140,444 37,907 82,235 1,251,757 930,439 1,251,757 - 0.00%
FINANCIAL INFORMATION
Debt Service
Function 5110
$0
$200,000
$400,000
$600,000
$800,000
$1,000,000
$1,200,000
$1,400,000
Actual13/14
Actual14/15
Actual15/16
Budget16/17
Projected16/17
Budget17/18
Tota
l D
ollar
Am
ount
5100 Debt Service
Budget Comparison
Last printed 1/10/2017 10:26 AM

Actual
13/14
Actual
14/15
Actual
15/16
Budget
16/17
Projected
16/17
Budget
17/18
Budget
Difference %
Refund Prior Year Revenue 6,100 1,060 0 5,500 5,500 5,500 - 0.00%
6,100 1,060 0 5,500 5,500 5,500 - 0.00%
FINANCIAL INFORMATION
Refund of Prior Year Revenue
Function 5130
Total
$0
$1,000
$2,000
$3,000
$4,000
$5,000
$6,000
$7,000
Actual13/14
Actual14/15
Actual15/16
Budget16/17
Projected16/17
Budget17/18
Tota
l D
ollar
Am
ount
5130 Refund Prior Year Revenue Budget Comparison
Last printed 1/10/2017 10:26 AM

Overview: Fund Transfer to Capital Reserve
Overview: Fund Transfer to Food Services
FINANCIAL INFORMATION
5230 Transfer to Capital Reserve
Transfers made to the district capital reserve fund from excess fund balance to pay for
ongoing capital improvements.
5250 Transfer to Food Services
Transfers made to the district food services fund from excess fund balance to pay for
the food service operations.
Last printed 1/10/2017 10:26 AM
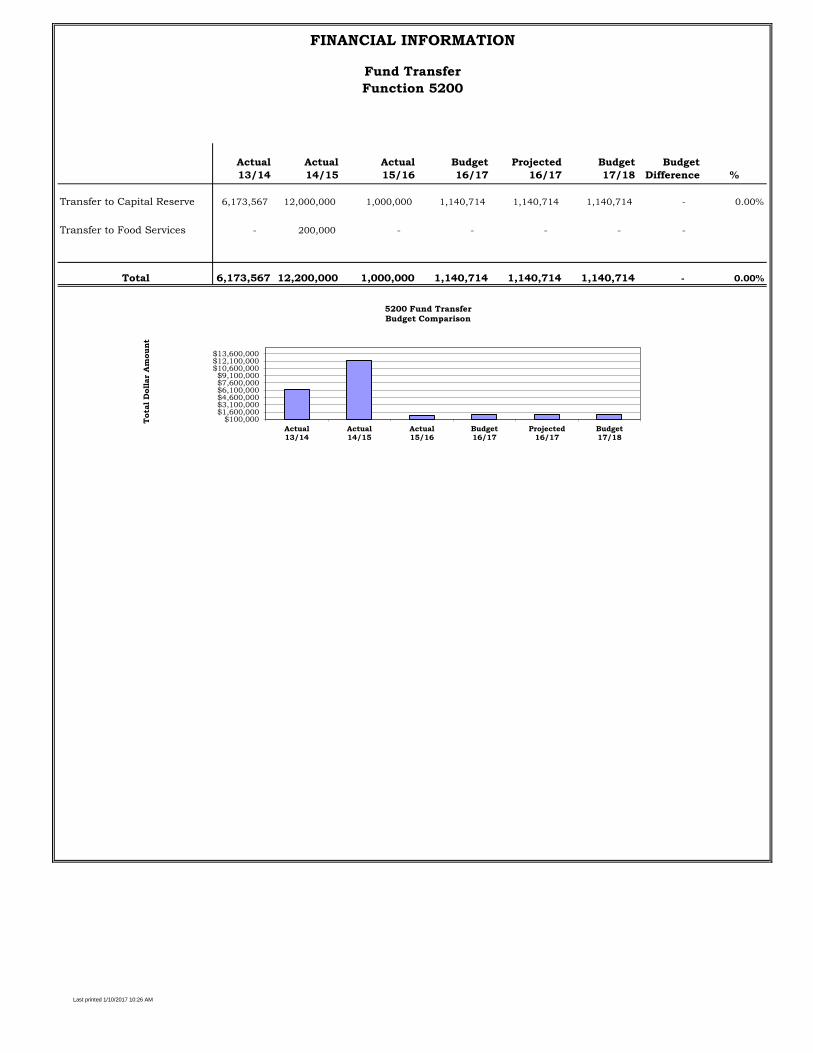
Actual
13/14
Actual
14/15
Actual
15/16
Budget
16/17
Projected
16/17
Budget
17/18
Budget
Difference %
Transfer to Capital Reserve 6,173,567 12,000,000 1,000,000 1,140,714 1,140,714 1,140,714 - 0.00%
Transfer to Food Services - 200,000 - - - - -
6,173,567 12,200,000 1,000,000 1,140,714 1,140,714 1,140,714 - 0.00%
FINANCIAL INFORMATION
Fund Transfer
Function 5200
Total
$100,000$1,600,000$3,100,000$4,600,000$6,100,000$7,600,000$9,100,000
$10,600,000$12,100,000$13,600,000
Actual13/14
Actual14/15
Actual15/16
Budget16/17
Projected16/17
Budget17/18
Tota
l D
ollar
Am
ount
5200 Fund Transfer
Budget Comparison
Last printed 1/10/2017 10:26 AM
Recommended