Achieve Operational Efficiency in Car Manufacturing with Advanced Analytics
Dr. Sebastian Schmerl | Solution Manager Cyber Defense for Production and IoT
Philipp Drieger | Sr. Sales Engineer | SME BA IoT ML
28. September 2017 | Washington, DC

During the course of this presentation, we may make forward-looking statements regarding future events or
the expected performance of the company. We caution you that such statements reflect our current
expectations and estimates based on factors currently known to us and that actual events or results could
differ materially. For important factors that may cause actual results to differ from those contained in our
forward-looking statements, please review our filings with the SEC.
The forward-looking statements made in this presentation are being made as of the time and date of its live
presentation. If reviewed after its live presentation, this presentation may not contain current or accurate
information. We do not assume any obligation to update any forward looking statements we may make. In
addition, any information about our roadmap outlines our general product direction and is subject to change
at any time without notice. It is for informational purposes only and shall not be incorporated into any contract
or other commitment. Splunk undertakes no obligation either to develop the features or functionality
described or to include any such feature or functionality in a future release.
Splunk, Splunk>, Listen to Your Data, The Engine for Machine Data, Splunk Cloud, Splunk Light and SPL are trademarks and registered trademarks of Splunk Inc. in
the United States and other countries. All other brand names, product names, or trademarks belong to their respective owners. © 2017 Splunk Inc. All rights reserved.
Forward-Looking Statements
THIS SLIDE IS REQUIRED FOR ALL 3 PARTY PRESENTATIONS.

Understand challenges in industrial production and data driven approaches
Learn how to collect low layer data from production
environments
Get insights how to gain
operational efficiency with
data analytics
Your 3 key takeaways from this session

Agenda
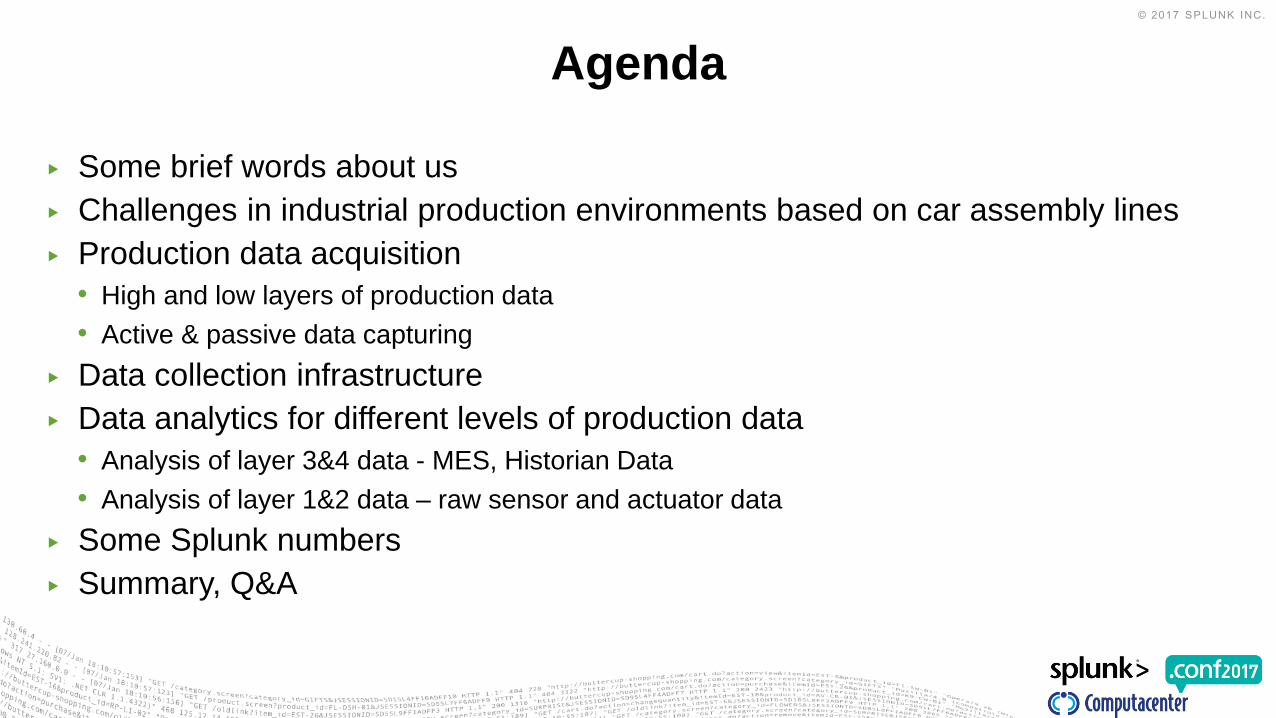
▶ Some brief words about us
▶ Challenges in industrial production environments based on car assembly lines
▶ Production data acquisition
• High and low layers of production data
• Active & passive data capturing
▶ Data collection infrastructure
▶ Data analytics for different levels of production data
• Analysis of layer 3&4 data - MES, Historian Data
• Analysis of layer 1&2 data – raw sensor and actuator data
▶ Some Splunk numbers
▶ Summary, Q&A
Agenda

Computacenter AG & Co.Europe‘s leading independent provider of IT Infrastructure services
Dr. Sebastian SchmerlHead of
Production Data Analytics,
Industrial Security,
Cyber Defense
Subject Matter Expert for:
• SOCs
• ICS & SCADA Security
• Industry 4.0 & Data Science
Contact: [email protected]

▶ Splunker since 2015.
▶ Subject Matter Expert for Business Analytics, IoT and Machine Learning
▶ Before Splunk: lots of software development, data analytics and visualization
▶ Enjoys this year .conf with 2 talks:
• Automating Thread Hunting with Machine Learning (tomorrow 1:10pm!)
• Achieve Operational Efficiency in Car Manufacturing with Advanced Analytics
▶ Good chance to meet me at ML or IoT Booths
▶ Questions? Feedback? Let me know: [email protected]
Bio: Philipp DriegerSr. Sales Engineer

Challenges in industrial production environments based
on car assembly lines

Digitization of ProductionAnalytics as main value drivers
Industrie 4.0 - increase in productivity over 20 percent
Plants and Analytics are in Focus
common sense in all market analysis reports
Source: Industry 4.0 How to navigate digitization of the manufacturing sector
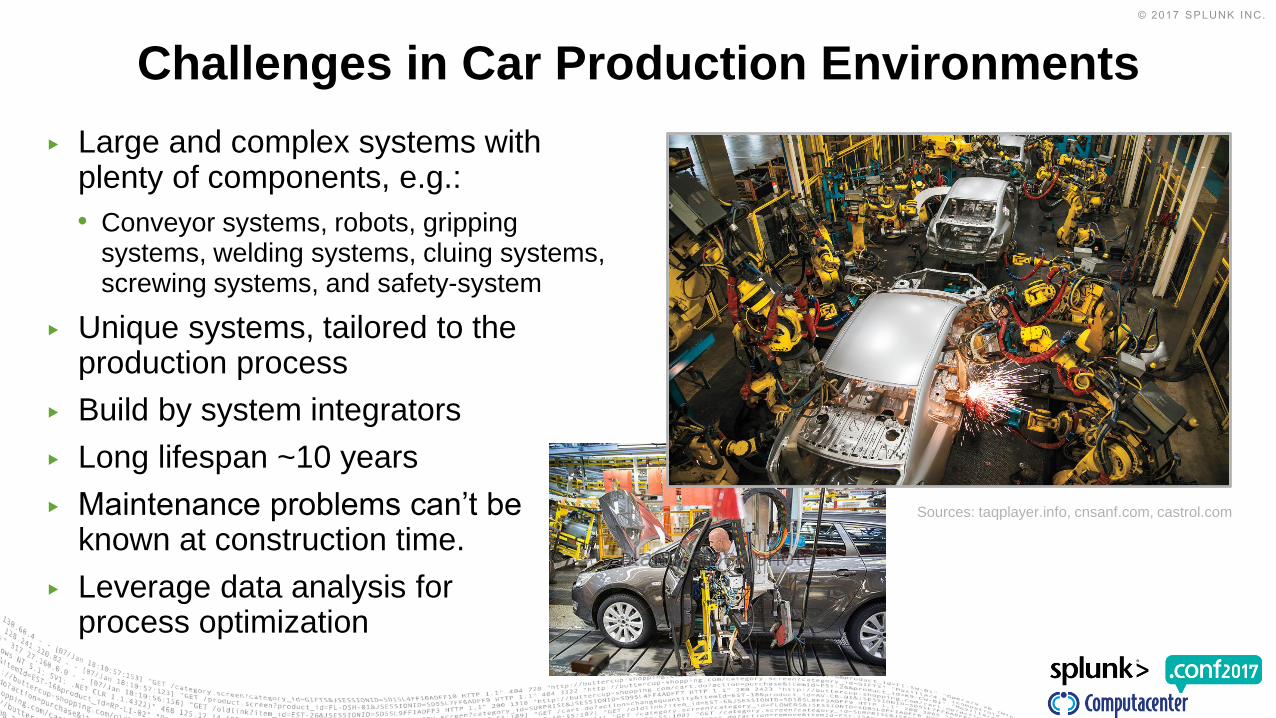
▶ Large and complex systems with plenty of components, e.g.:
• Conveyor systems, robots, gripping systems, welding systems, cluing systems, screwing systems, and safety-system
▶ Unique systems, tailored to the production process
▶ Build by system integrators
▶ Long lifespan ~10 years
▶ Maintenance problems can’t be known at construction time.
▶ Leverage data analysis forprocess optimization
Challenges in Car Production Environments
Sources: taqplayer.info, cnsanf.com, castrol.com

Production Analytics ChallengesNo Data - No Analytics | No Analytics - No Progress
Analytics Infrastructure
Cloud
Data
Integration
onPremise
Analytics SW
Enterprise
Integration
Data Acquisition Data Analytics
Dashboards
Diagrams
Alarming
Analysis
Actions

Production data acquisition
From data layers and non-invasive production data extraction

Production Data LayersExample from the process industry
Data Aggregation Example
La
ye
r 4
< 0,1 Hz
La
ye
r 3
0,1 –
1Hz
La
ye
r 2
5 –
10HzL
aye
r 1
10 -
50Hz++
Plant MGMT
Manufacturing executionMES, Data Historian
Control Layer PLCs
I/O Layer
Production floor and process Layer
90°C 130°C 110°C 70°C
Calculation & Control
Ø Temperature
Product
temperature
100°C
Process status
OKAnalytics
PDEX
Better prediction results
& higher forecast precision
Layer1 2 3
130°C 70°C
100°C
Fine grained temporal & sensor values
of production data
High aggregated data
nearly status information only

Active and Passive Data Acquisition
ACTIVE PASSIVE
PR
O
• no data transformation
• no data dissection
• non invasive
• no changes on automation cells
• no discussions, no re-certifications
• easy rollout
CO
N
• configuration changes
• polling of information
• PLC CPU time & memory
• more complex
PDEX

PDEX – Extraction of Production Data
PLCPROFINET Controller
Frequency converterPROFINET Device
Decentralized PeripheryPROFINET Devices
Electric Motor
Cyclic data exchange
Industrial
Ethernet Switch
Manifestation in the communicated data
Wear, different forces, resistance,
component failures

PDEX – Extraction of Production Data
PLCPROFINET Controller
Frequency converterPROFINET Device
Decentralized PeripheryPROFINET Devices
Electric Motor
Industrial
Ethernet Switch
Wear, different forces, resistance,
component failures
PDEXProduction data extraction
Server in data center
Provisioning
of data
Traffic sniffing via
Port-Mirroring &
Taps
Splunk Spectrum Cloud

Raw network traffic with production data Production data in Splunk
PDEXExtraction of production data from network traffic
PDEX
Communication monitoring
Rolling Traffic Dumps
Packet dissection
Data Extraction
Data Conversion
Data Forwarding

Data collection Infrastructure
From aggregation and dissection of network traffic

Production Data Collection Infrastructurefor layer 1 & 2 data

Splunk Analytics Infrastructure
Hall A
PDEX
PDEX
PDEX
Indexer
Cluster
Search
Head
Cluster
MasterDeployment
Server
License
Server
Dashboards
Report
Alerts
Continuous
Analytics Tasks
Manufacturing
Execution System
Data Historians
Shift books,
Maintenance Logs,
…
Layer
1 &
2L
ayer
3 &
4
Control center
DBX
DBX
DBX

Analysis of working cycles and PLC errors
Analysis of layer 3&4 data production data from automation cells
AC
1
AC
2
AC
3a
AC
3b
AC
4
AC
5
AC
6
AC
7
AC
8
AC
9
AC
10
AC
11
AC
12
AC
13
AC
14
AC
15
AC
16
AC
17
AC
18
AC
19
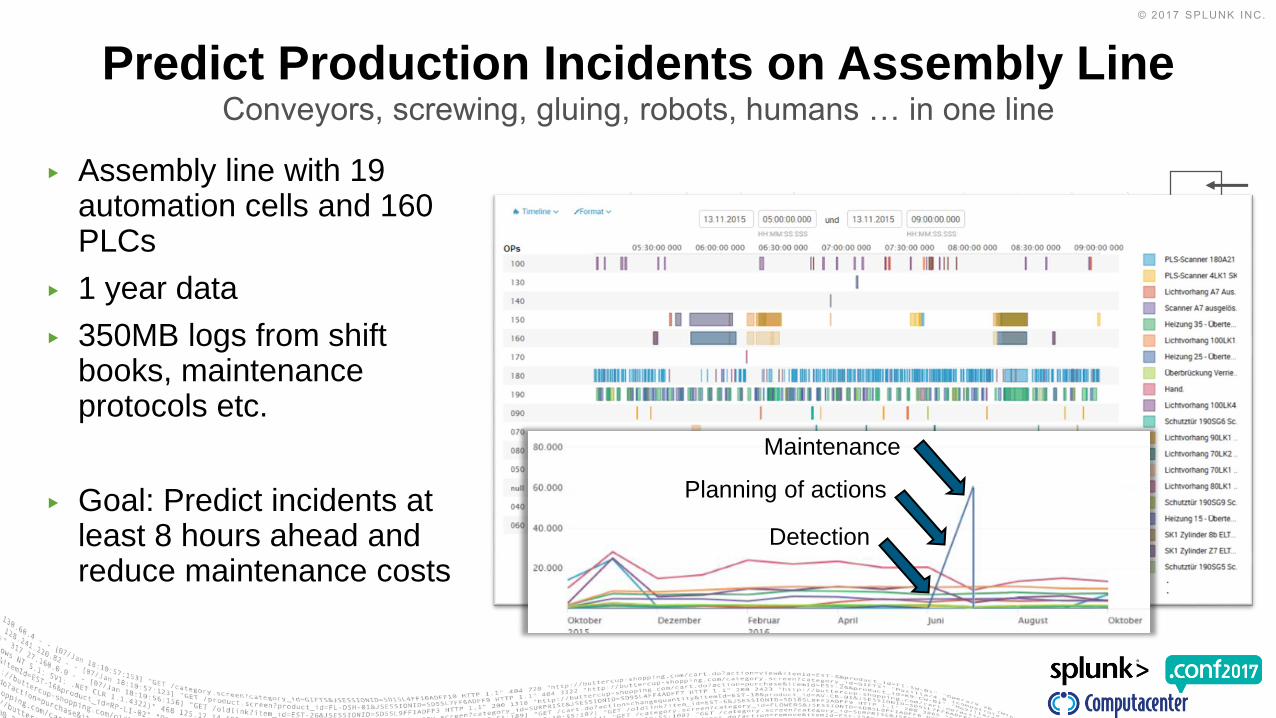
▶ Assembly line with 19 automation cells and 160 PLCs
▶ 1 year data
▶ 350MB logs from shift books, maintenance protocols etc.
▶ Goal: Predict incidents at least 8 hours ahead and reduce maintenance costs
Predict Production Incidents on Assembly LineConveyors, screwing, gluing, robots, humans … in one line
Detection
Planning of actions
Maintenance

▶ Shift in histogram of average working cycles in week by week comparison
Analysis of Working Cycles of an Automation Cell
week 1
week 2
Product 2 remains unchanged
Product 1 is produced slower
AC
3a
AC
3b
Working cycles with
errors or problems
40s 50s 60s 70s

▶ N-gram analyses let us construct combinations of sequential categorical events in a given window in time
▶ Statistics can be applied to count frequencies, detect frequent patterns
▶ Correlate subsequent event patterns to identify more complex root cause
N-gram Analysis to Detect Frequent Error Chains
A
B
C
D
E
F
DC DCEF E BACD time
types of events
AC
3a
AC
3b
Tmax for
N-grams

N-Gram StatisticsWhat happens when and how often

N-gram AnalysisWhich error chains causing production impacts?
N-Gram with huge Impact, but rare
Not that interesting for the customer
N-grams with smaller impact, but very often
Highly interesting for the customer
Ok, now we know the pain,
but we have no data to predict!
Predictive Maintenance for Electro Motors
Analysis of layer 1 production data from automation cells

▶ Lag in mechanic transmission is detected with continuous RPM monitoring
Analysis of Motor ProfilesWear of mechanics detected by RPM monitoring
Effects from
slack & mechanical wear
RPM
Motor status bits
Torque
time
Frequency converterICS Device
Electric Motor
0 1s 2s 3s 4s 5s 6s 7s 8s

▶ 10 Hz frequency raw data from the motor
▶ we have 8 OK & 3 NOK motor runs which look very similar
Analysis of Motor Profiles
0 10s 20s 30s 40s 50s 60s 70s 80s

time
Framing and Slicing Motor Profiles
Fra
me
-Sta
rt
Fra
me
-Sta
rt
Fra
me
-Sta
rt
Fra
me
-Sta
rt
Fra
me
-Sta
rt
Frame start criteria fulfilled
time0 Frames time0 Normal profile
1, 2, 3, 4, 5, 6, 7, 8
Min,
Max,
avg
Normal profile slices
Min,
Max,
avg
Current run slices
1, 2, 3, 4, 5, 6, 7, 8
- =Deviation from
normal profil

▶ 10 Hz frequency raw data from the motor
▶ we have 8 OK & 3 NOK motor runs which look very similar
Analysis of Motor Profiles

Compare frames against the normal profileA non-conform motor run
Motor run:
Not
Conform

Motor run:
Not
Conform
How we can visualize it…… and how we visualize it to the customer mainly

▶ But information reduction is key
How we can visualize it…… and how we visualize it to the customer mainly
Motor run conformity

Wrap up

Data Volume – Business Value
▶ 1 assembly line with 160 PLCs a ~4 electric motors-> 400 ~ 800 GB per day

Summary
▶ Analytics of layer 3&4 data:
• Data often already exist
• This layer is good to identify the pain
• Data often not sufficient for prediction
▶ Analytics of layer 1&2 data:
• Active data collection results often in configuration, service, guarantee discussions
• Passive data collection is complex
• The data volume is challenging
▶ Data analytics
• n-grams, wave transformations, differences, profiles, …
Key takeaways

© 2017 SPLUNK INC.
Don't forget to rate this session in the
.conf2017 mobile app
Thank You!
Recommended