Accounting and Finance
P.V. Viswanath
For use with
Fundamentals of Corporate Finance
Brealey, Myers and Marcus, 4th ed.
P.V. Viswanath 2
Key Concepts and Skills
Know the difference between book value and market value
Know the difference between accounting income and cash flow
Know the difference between average and marginal tax rates
Know how to determine a firm’s cash flow from its financial statements

P.V. Viswanath 3
Chapter Outline
The Balance SheetThe Income StatementTaxesCash Flow

P.V. Viswanath 4
The Balance Sheet
The balance sheet is a snapshot of the firm’s assets and liabilities at a given point in time
Assets are listed in order of liquidity Ease of conversion to cash Without significant loss of value
Balance Sheet Identity Assets = Liabilities + Stockholders’ Equity
P.V. Viswanath 5
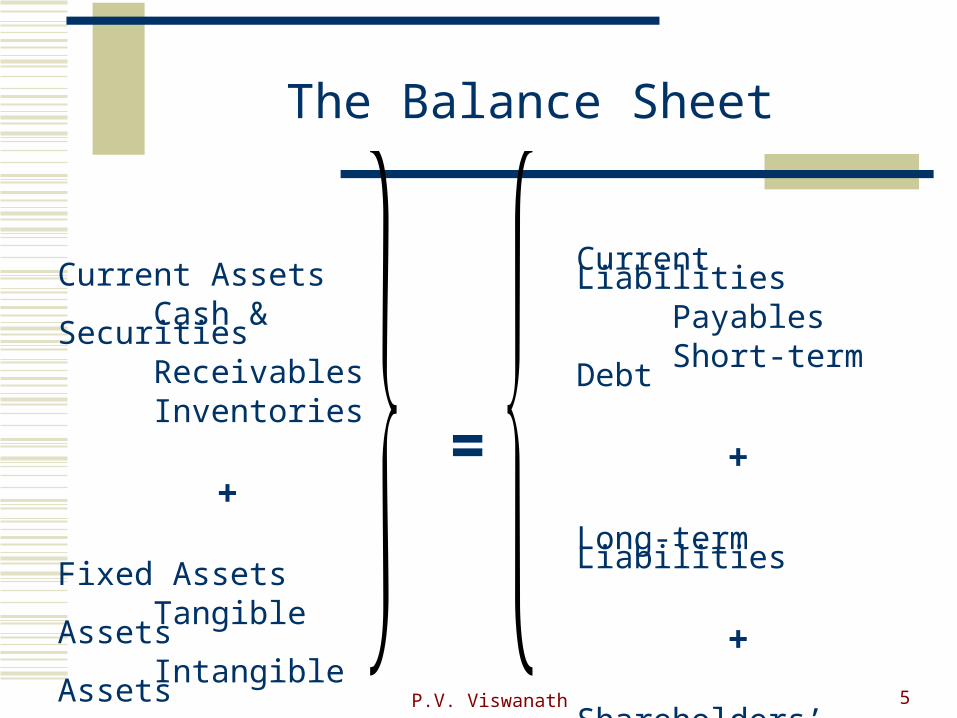
The Balance Sheet
Current AssetsCash & SecuritiesReceivablesInventories
+
Fixed AssetsTangible AssetsIntangible Assets
Current LiabilitiesPayablesShort-term Debt
+
Long-term Liabilities
+
Shareholders’ Equity
=
P.V. Viswanath 6
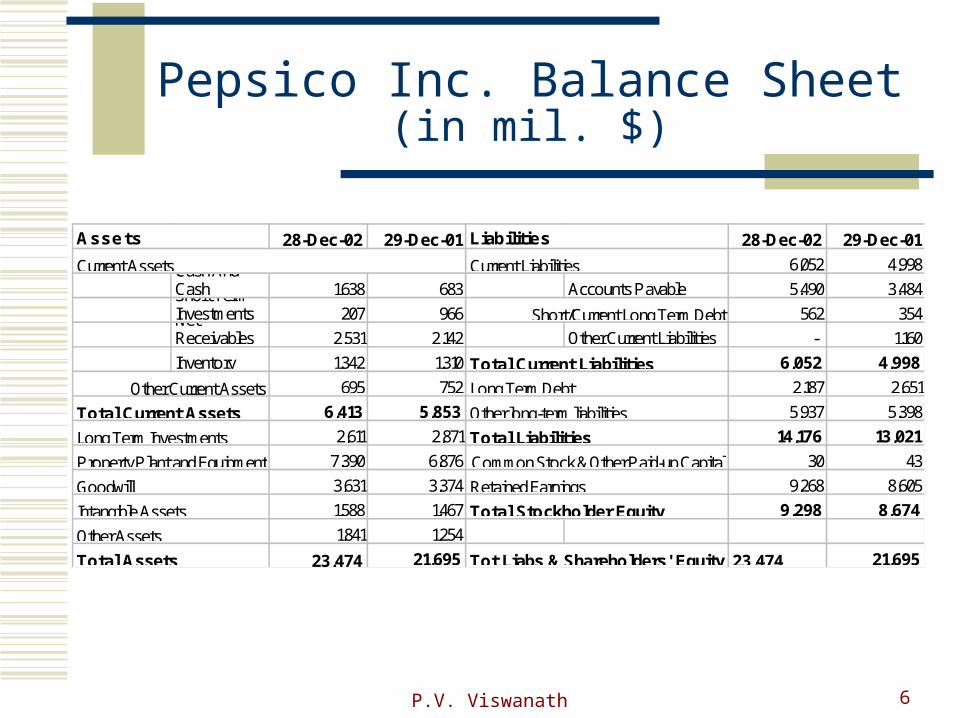
Pepsico Inc. Balance Sheet (in mil. $)
28-Dec-02 29-Dec-01 28-Dec-02 29-Dec-016,052 4,998Cash And
Cash 1,638 683 Accounts Payable 5,490 3,484Short Term Investments 207 966 Short/Current Long Term Debt 562 354Net Receivables 2,531 2,142 Other Current Liabilities - 1,160Inventory 1,342 1,310 6,052 4,998
Other Current Assets 695 752 2,187 2,6516,413 5,853 5,937 5,398
2,611 2,871 14,176 13,0217,390 6,876 30 433,631 3,374 9,268 8,6051,588 1,467 9,298 8,6741,841 1,254
23,474 21,695 Tot Liabs & Shareholders' Equity 23,474 21,695
Total Current AssetsLong Term InvestmentsProperty Plant and Equipment
Assets
Current Assets
Total Assets
GoodwillIntangible AssetsOther Assets
Total Stockholder Equity
Liabilities
Common Stock & Other Paid-up CapitalRetained Earnings
Total Liabilities
Long Term DebtOther long-term liabilities
Current Liabilities
Total Current Liabilities
P.V. Viswanath 7
Market vs. Book Value
The balance sheet provides the book value of the assets, liabilities and equity.
Market value is the price at which the assets, liabilities or equity can actually be bought or sold.
Market value and book value are often very different. Why?
Which is more important to the decision-making process?
P.V. Viswanath 8
Market Value vs. Book Value
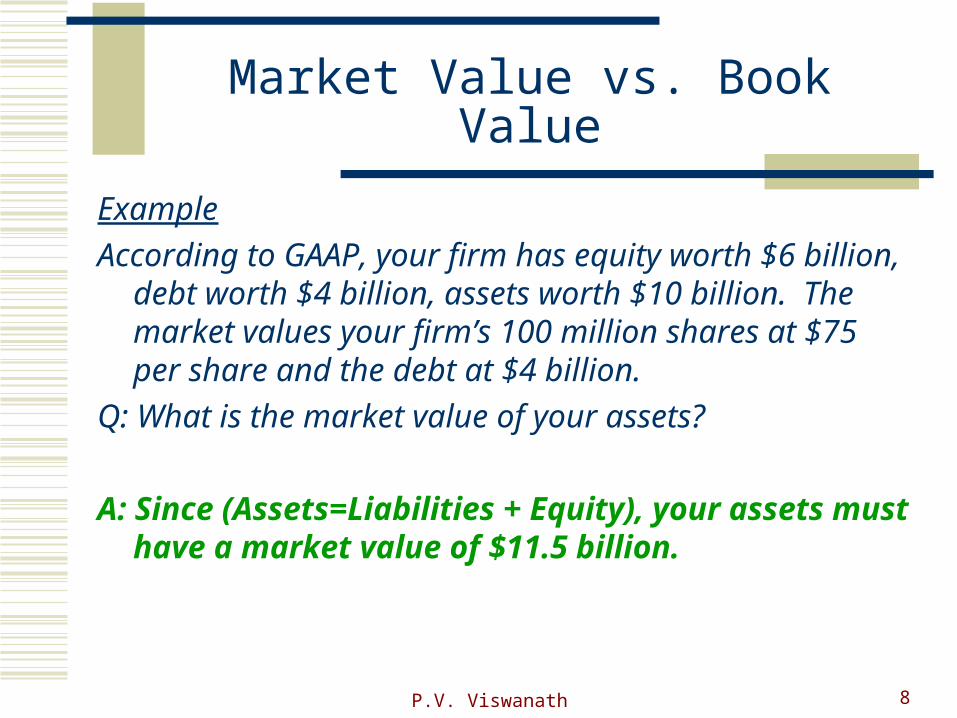
Example
According to GAAP, your firm has equity worth $6 billion, debt worth $4 billion, assets worth $10 billion. The market values your firm’s 100 million shares at $75 per share and the debt at $4 billion.
Q: What is the market value of your assets?
A: Since (Assets=Liabilities + Equity), your assets must have a market value of $11.5 billion.
P.V. Viswanath 9
Market Value vs. Book Value
Example
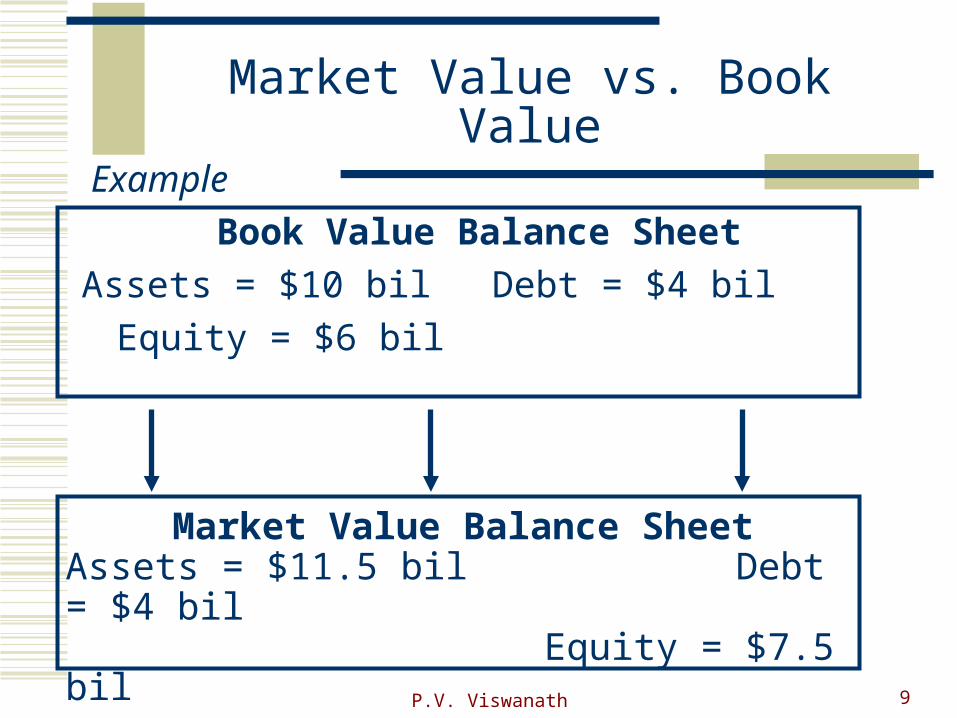
Book Value Balance Sheet
Assets = $10 bil Debt = $4 bil
Equity = $6 bil
Market Value Balance SheetAssets = $11.5 bil Debt = $4 bil
Equity = $7.5 bil
P.V. Viswanath 10
Income Statement
The income statement is more like a video of the firm’s operations for a specified period of time.
You generally report revenues first and then deduct any expenses for the period
Matching principle – GAAP say to show revenue when it accrues and match the expenses required to generate the revenue

P.V. Viswanath 11
Income Statement Pepsico Inc. (in mil. $)
I ncome Statement Dec 02 Dec 01
Revenue 25,112.00 26,935.00
Cost of Goods Sold 10,523.00 9,837.00
Gross Profit 14,589.00 17,098.00
SG&A Expense 8,523.00 11,608.00
Depreciation & Amortization 1,112.00 1,082.00
Operating Income 4,954.00 4,408.00
Nonoperating Income 316 227
Nonoperating Expenses 178 219
I ncome Before Taxes 4,868.00 4,029.00
I ncome Taxes 1,555.00 1,367.00
Net Income After Taxes 3,313.00 2,662.00
P.V. Viswanath 12
Taxes
Marginal vs. average tax rates Marginal – the percentage paid on the next dollar earned Average – the tax bill / taxable income
Income before taxes was $4868 and $4029 and taxes were $1555 and $1367 for 2002 and 2001 resp. (in mil. $)
The average tax rates were 31.94% and 33.93%.
However, the tax paid on an additional dollar of income in either year would have been 35%, considering that in 2002, any income over $18 mil. was taxed at a rate of 35%.
P.V. Viswanath 13
Statement of Cashflows
A firm’s cashflows can be quite different from its net income. For example: The income statement does not recognize capital
expenditures as expenses in the year that the capital goods are paid for. Those expenses are spread over time as a deduction for depreciation.
The income statement recognizes revenues and expenses when sales are made, even though the money may not have been collected (revenues) or paid out (expenses).
P.V. Viswanath 14
The Statement of Cashflows
The statement of cashflows shows the firm’s cash inflows and outflows from Operations Investments and Financing
The form of this statement is determined by accounting standards.
P.V. Viswanath 15
Statement of Cash Flows:Operating Activities
Operating activities are earnings-related activities. Generally these relate to Income Statement activities, and items included in working capital. Included are:
Sales and expenses necessary to obtain sales Related operating activities, such as extending credit to
customers investing in inventories obtaining credit from suppliers payment of taxes insurance payments Other activities that don't easily fit into the other two
categories, such as settlements in lawsuits.

P.V. Viswanath 16
Statement of Cash Flows:Investing and Financing Activities
Investing activities relate to the acquisition and disposal of noncash assets: assets which are expected to generate income for the company over a period of time. These include lending funds and collecting on these loans.
Financing activities relate to the contribution, withdrawing and servicing of funds to support business activities.

P.V. Viswanath 17
Pepsico Inc. (in mil. $)Statement of Cash Flows 2002
3,313
1,112-390-260704-53201
4,627
-1,437757153
-527
-1,041-1,734-404
-3,17934
$955
Net IncomeOperating Activities, Cash Flows Provided By or Used In
Changes In InventoriesChanges In Other Operating ActivitiesTotal Cash Flow From Operating Activities
DepreciationAdjustments To Net IncomeChanges In Accounts ReceivablesChanges In Liabilities
Other Cashflows from Investing ActivitiesTotal Cash Flows From Investing Activities
Investing Activities, Cash Flows Provided By or Used InCapital ExpendituresInvestments
Change In Cash and Cash Equivalents
Total Cash Flows From Financing ActivitiesEffect Of Exchange Rate Changes
Financing Activities, Cash Flows Provided By or Used InDividends PaidSale Purchase of StockNet Borrowings
P.V. Viswanath 18
An alternate way of defining cashflows
Sometimes we are interested in defining cashflows for other purposes, such as project evaluation. Or we may interested in how cash is generated from the use of assets and how it is paid to those that finance the purchase of the assets
For this purpose, we separate cashflows into flows from assets and flows to shareholders and creditors.
We are interested in whether cashflows refer to investments, in the sense that they expand the asset base and are ultimately reflected in the balance sheet; or to operating returns from the use of assets, which are reflected in the income statement.
This differs from the GAAP oriented categorization of cashflows in the Statement of Cashflows.
P.V. Viswanath 19
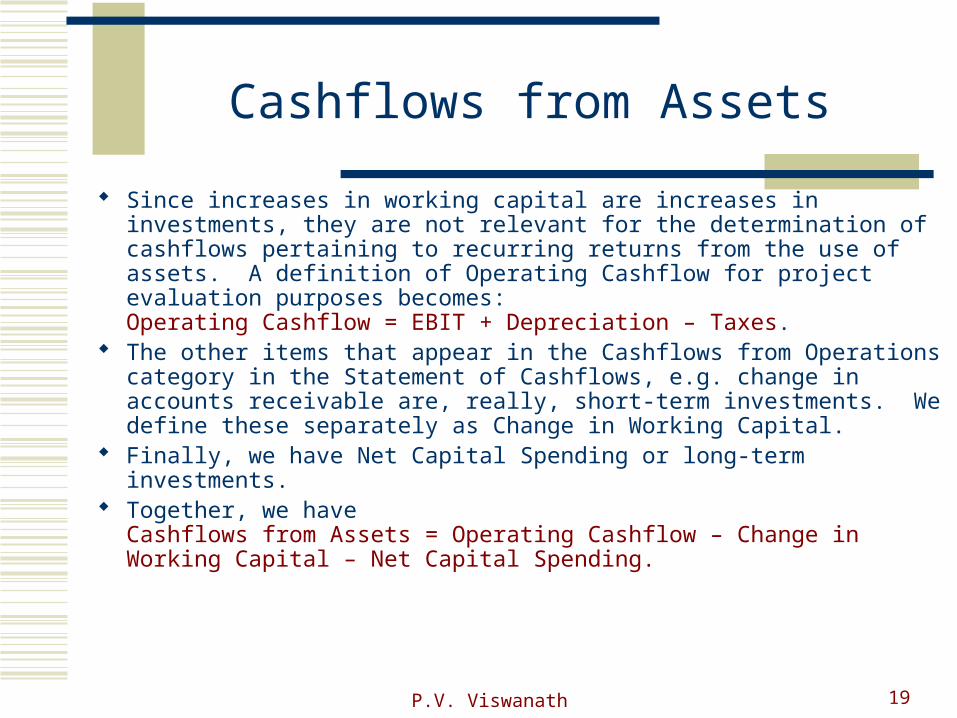
Cashflows from Assets
Since increases in working capital are increases in investments, they are not relevant for the determination of cashflows pertaining to recurring returns from the use of assets. A definition of Operating Cashflow for project evaluation purposes becomes: Operating Cashflow = EBIT + Depreciation – Taxes.
The other items that appear in the Cashflows from Operations category in the Statement of Cashflows, e.g. change in accounts receivable are, really, short-term investments. We define these separately as Change in Working Capital.
Finally, we have Net Capital Spending or long-term investments. Together, we have
Cashflows from Assets = Operating Cashflow – Change in Working Capital – Net Capital Spending.

P.V. Viswanath 20
An alternative definition of cashflows
Interest
Dividends
Operating Cashflow
Assets Liabilities
Current Assets – Current Liabilities
Fixed Assets Equity Paid-in capital
Debt
Retained Earnings
CF to Stockholders
CF to Debtholders
Net Capital Spending
Change in WC
Income Statement
P.V. Viswanath 21
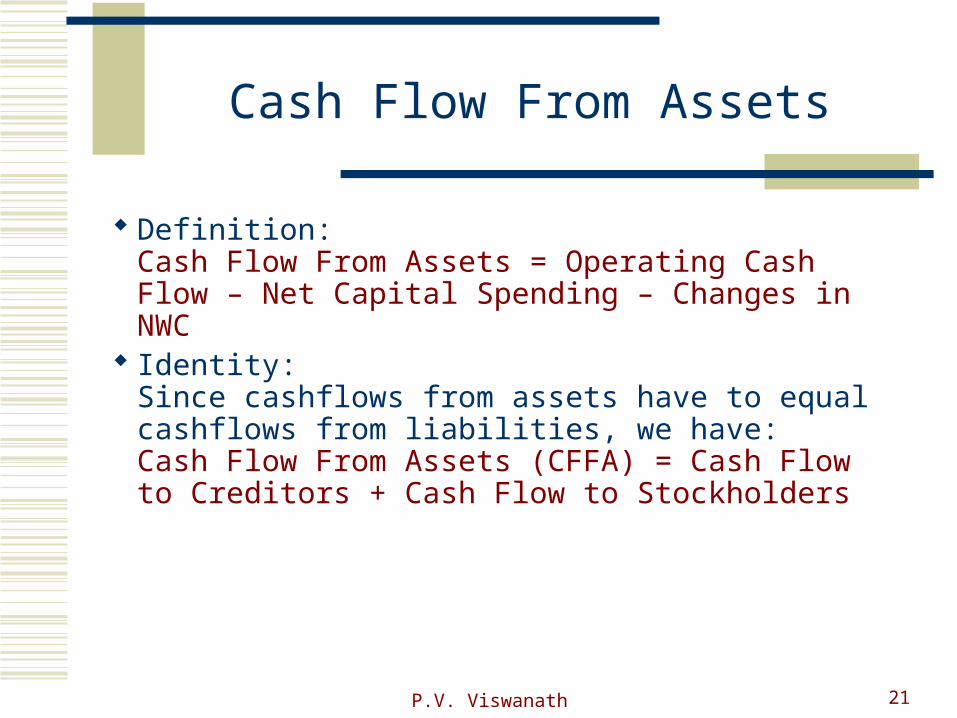
Cash Flow From Assets
Definition:Cash Flow From Assets = Operating Cash Flow – Net Capital Spending – Changes in NWC
Identity:Since cashflows from assets have to equal cashflows from liabilities, we have:Cash Flow From Assets (CFFA) = Cash Flow to Creditors + Cash Flow to Stockholders

P.V. Viswanath 22
An alternative definition of cashflows
Operating Cashflows– recurring cashflows generated by the use of assets
Δ (Net Working Capital) and Net Capital Spending are investment outlays to build up the assets that generate cashflows.
Cashflows to Stockholders and Cashflow to Bondholders are how the investments are funded.
The division of cashflows into operating cashflows and new investments in assets is important in forecasting future cashflows. Investments in assets are the drivers and operating cashflows are the result of this investment.
New investment and forecasted growth in operating cashflows need to be consistent with each other.
P.V. Viswanath 23
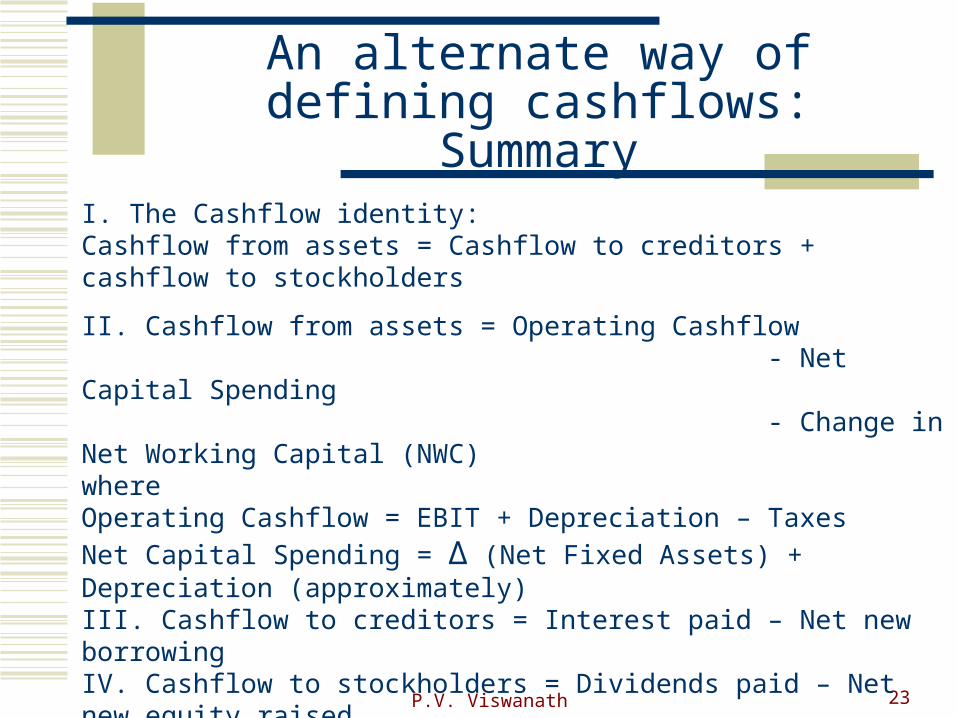
An alternate way of defining cashflows: Summary
I. The Cashflow identity:Cashflow from assets = Cashflow to creditors + cashflow to stockholders
II. Cashflow from assets = Operating Cashflow - Net Capital Spending - Change in Net Working Capital (NWC)whereOperating Cashflow = EBIT + Depreciation – Taxes
Net Capital Spending = Δ (Net Fixed Assets) + Depreciation (approximately)III. Cashflow to creditors = Interest paid – Net new borrowingIV. Cashflow to stockholders = Dividends paid – Net new equity raised
Because data in the firm’s public financial statements are aggregated, it is often difficult to recover the quantities above without access to more detailed firm accounts.
P.V. Viswanath 24
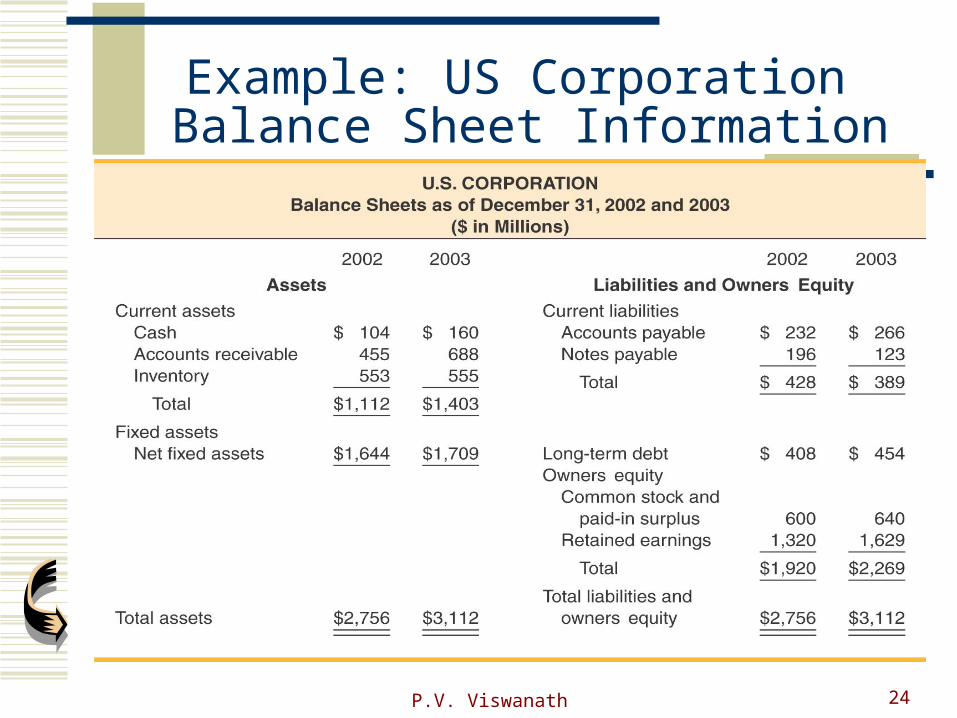
Example: US Corporation Balance Sheet Information
P.V. Viswanath 25
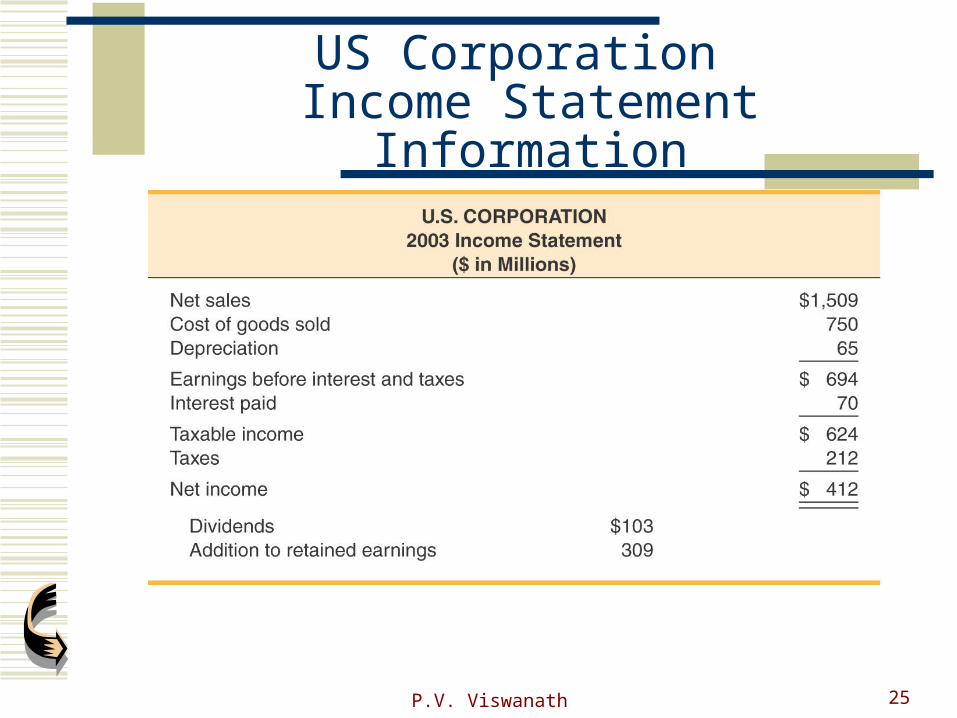
US Corporation Income Statement Information
P.V. Viswanath 26
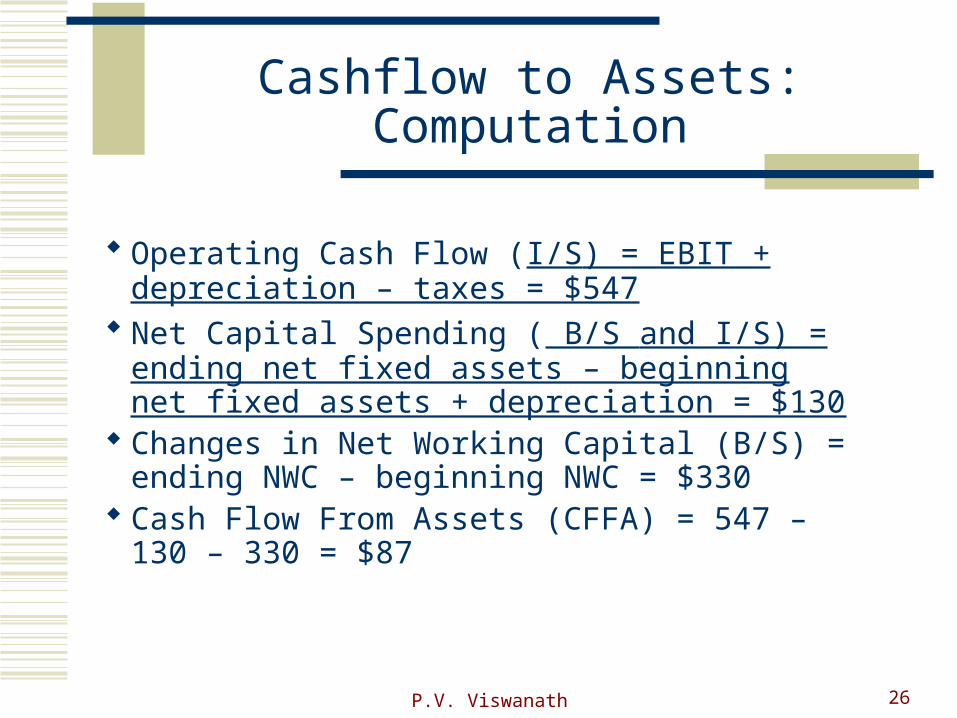
Cashflow to Assets: Computation
Operating Cash Flow (I/S) = EBIT + depreciation – taxes = $547
Net Capital Spending ( B/S and I/S) = ending net fixed assets – beginning net fixed assets + depreciation = $130
Changes in Net Working Capital (B/S) = ending NWC – beginning NWC = $330
Cash Flow From Assets (CFFA) = 547 – 130 – 330 = $87
P.V. Viswanath 27
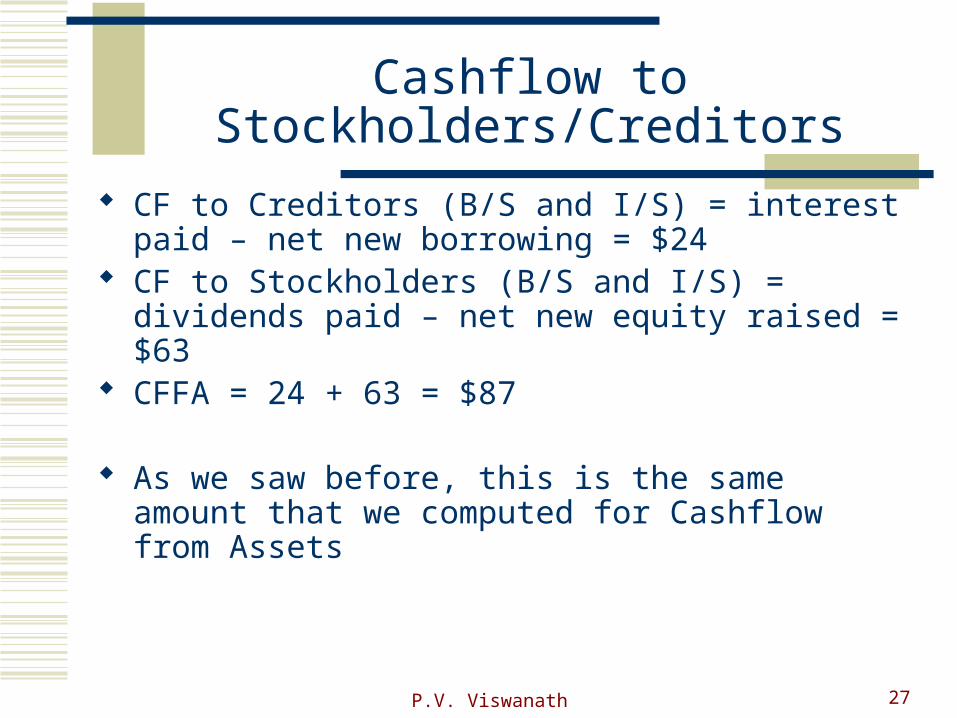
Cashflow to Stockholders/Creditors
CF to Creditors (B/S and I/S) = interest paid – net new borrowing = $24
CF to Stockholders (B/S and I/S) = dividends paid – net new equity raised = $63
CFFA = 24 + 63 = $87
As we saw before, this is the same amount that we computed for Cashflow from Assets
P.V. Viswanath 28
Quick Quiz
What is the difference between book value and market value? Which should we use for decision making purposes?
What is the difference between accounting income and cash flow? Which do we need to use when making decisions?
What is the difference between average and marginal tax rates? Which should we use when making financial decisions?
How do we determine a firm’s cash flows? What are the equations and where do we find the information?
Recommended

![[PPT]Corporate Finance - Pace University Webspacewebpage.pace.edu/pviswanath/notes/corpfin/powerpoint/... · Web viewP.V. Viswanath Based on Damodaran’s Corporate Finance First](https://img.dokumen.tips/doc/110x75/5ac332217f8b9a12608b9ee8/pptcorporate-finance-pace-university-viewpv-viswanath-based-on-damodarans.jpg)