Absorption modelling assessment of the extent and rate of bioavailability
Michael Weiss
Martin Luther University
Halle-Wittenberg

Determinants of Bioavailability
Liver
FA
FH
F=FH FA

Absorption and Bioavailability
Gut Dor
FA
FH
HAFFF
Systemic circulation
Bioavailability F
= Fraction of Dor that
reaches the systemic
circulation

Determinants of Bioavailability
Absorption
Back-transport of Pgp-substrates
Intestinal metabolism
Pgp
Hepatic metabolism
Biliary excretion
FH FA
F

Absorption Rate (1-Compartment)
V
CL ka
Dor
FDor
ka > ka tktk
ea
aor ae eekk
k
V
FDtC )(
C(t)
t V
CLke
Ab
so
rptio
n ra
te
Time
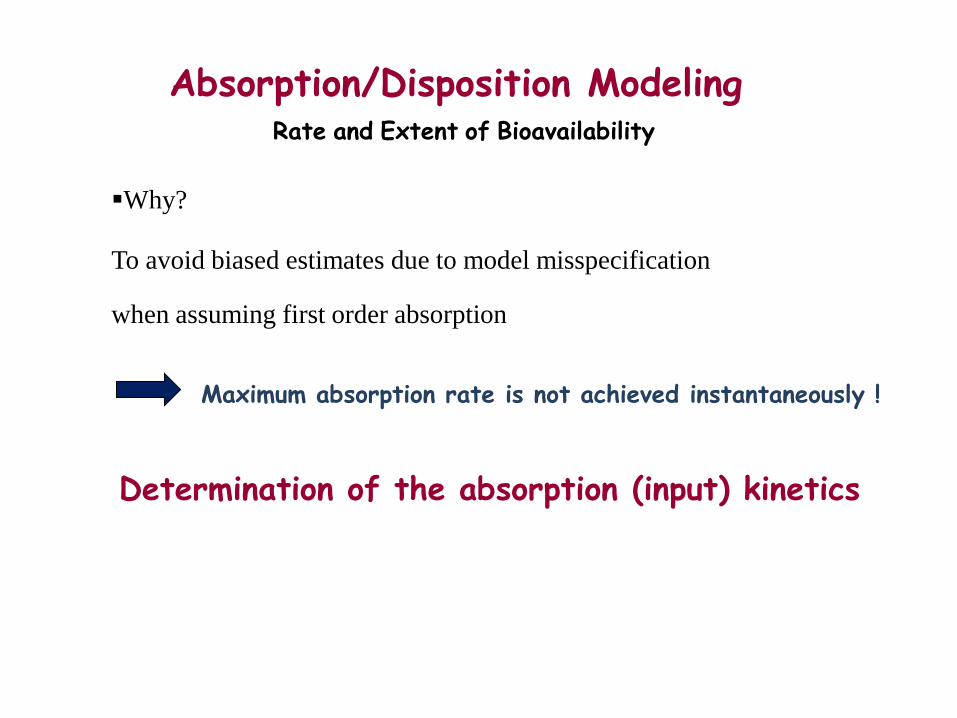
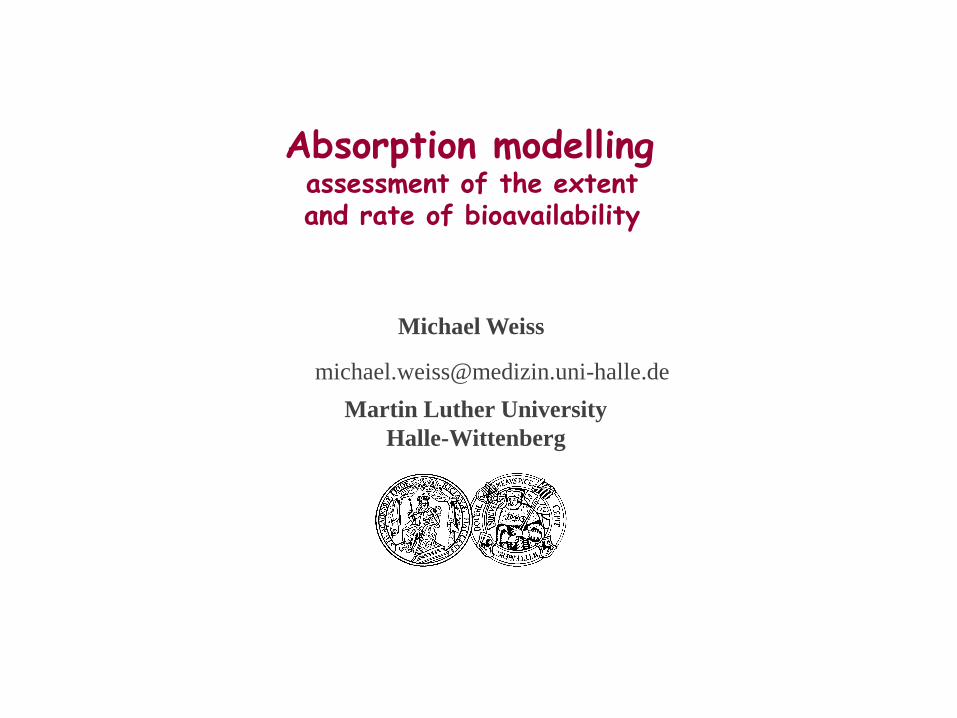
Absorption/Disposition Modeling
Why?
Rate and Extent of Bioavailability
To avoid biased estimates due to model misspecification
when assuming first order absorption
Determination of the absorption (input) kinetics
Maximum absorption rate is not achieved instantaneously !

Div
Cpo(t)
Civ(t)
Bioavailability, F
Rate of absorption
Dosis po, Absorption Disposition
Identifiability
Simplification:
Dor ka
Body
ke Gut
1 Comp 1 Comp
t
iv eCtC 0)(
unrealistic
t
i
iivieBtC
3
1
)(
reality
tkaeItInput 0)(
)()(tkt
oraeeBtC
constant! rate absorption realak
!ek

Cpo(t
)
Deconvolution or
parametric model
Am
ou
nt
ab
so
rbed
Time (h)
oral data
10-1
100
101
102
0.00 0.96 1.92 2.88 3.84 4.800.00 0.96 1.92 2.88 3.84 4.80
10-1
100
101
102
10-1
100
101
102
10-1
100
101
102
0.00 0.96 1.92 2.88 3.84 4.800.00 0.96 1.92 2.88 3.84 4.80
Time (h)
Civ(t
)
iv data
Ab
so
rpti
on
ra
te
0 20 40 60 80 100
0
20
40
60
80
F
dCftC
t
ivApo )()()(0
)(tf A
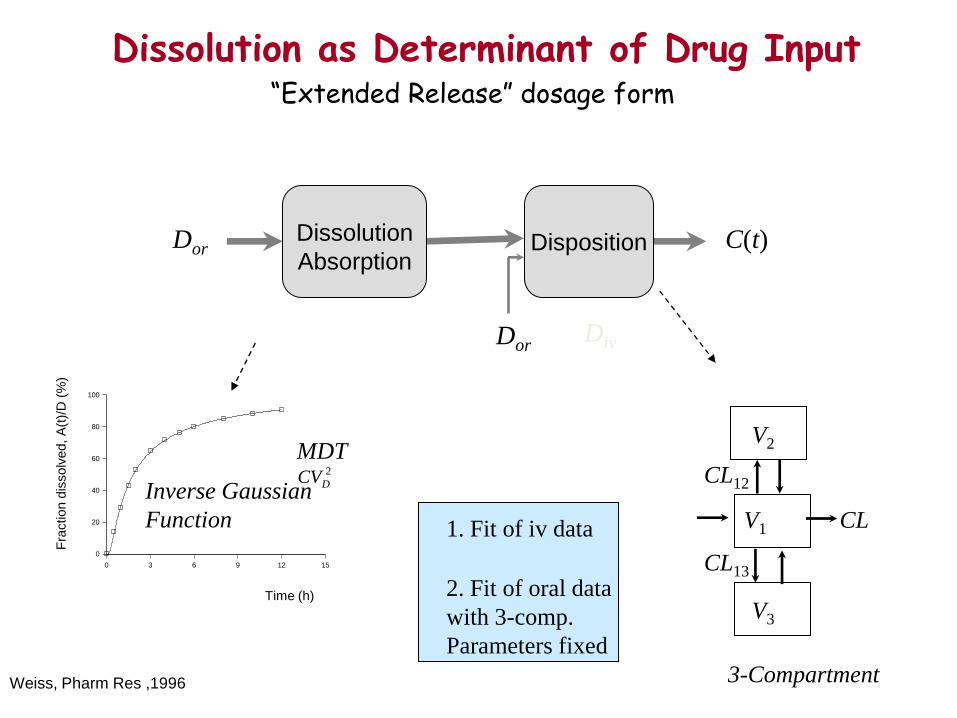
Dissolution as Determinant of Drug Input
Disposition
C(t)
0 3 6 9 12 15
0
20
40
60
80
100
Fra
ction d
issolv
ed,
A(t
)/D
(%
)
Time (h)
Inverse Gaussian
Function
Dissolution
Absorption
CL
CL12
CL13
V1
3-Compartment
MDT 2
DCV
Dor
Div
V2
V3
1. Fit of iv data
2. Fit of oral data
with 3-comp.
Parameters fixed
“Extended Release” dosage form
Weiss, Pharm Res ,1996
Dor

CL
CL12
CL13
V1
V2
V3
tMATCV
MATt
tCV
MATFtf
AA
A 2
2
32 2
)(exp
2)(
fA(t) Absorption
(Input)
Rate
Mean absorption time (MAT)
Dispersion of absorption time
Bioavailability (F)
2
ACV
24
max,2
3
4
91 AAA CVCVMATt
t
AA dftF0
)()(
.)( FFA
Inverse Gaussian density
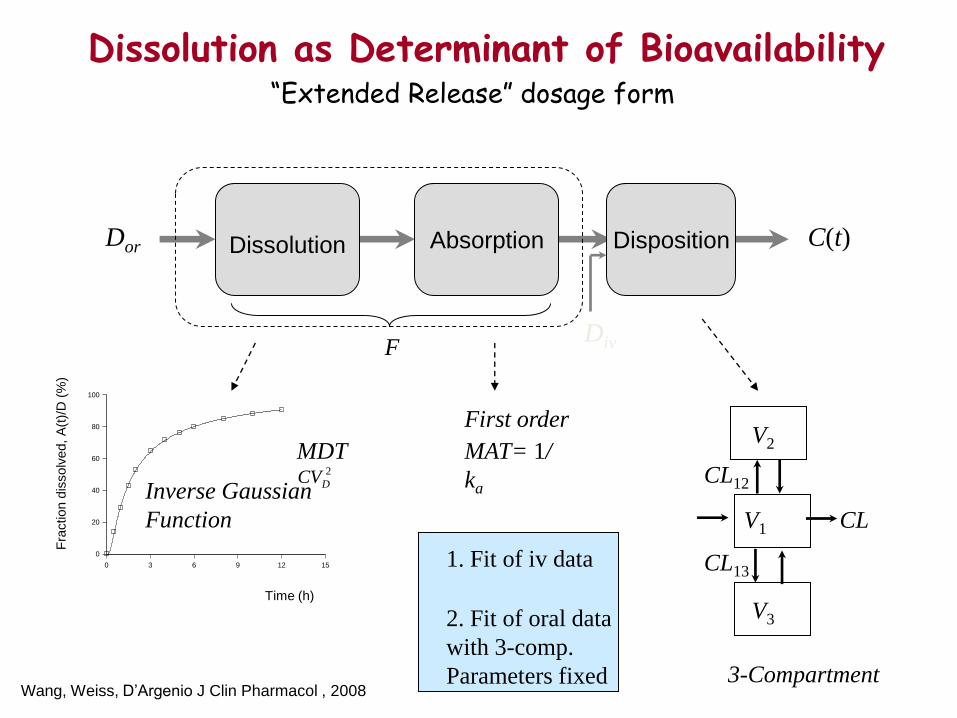
Dissolution as Determinant of Bioavailability
Absorption
Disposition
C(t)
0 3 6 9 12 15
0
20
40
60
80
100
Fra
ction d
issolv
ed,
A(t
)/D
(%
)
Time (h)
Inverse Gaussian
Function
Dissolution
First order
MAT= 1/
ka
CL
CL12
CL13
V1
3-Compartment
MDT 2
DCV
Dor
Div F
V2
V3
1. Fit of iv data
2. Fit of oral data
with 3-comp.
Parameters fixed
“Extended Release” dosage form
Wang, Weiss, D’Argenio J Clin Pharmacol , 2008
Wang, Weiss D’Argenio J Clin Pharmacol , 2008
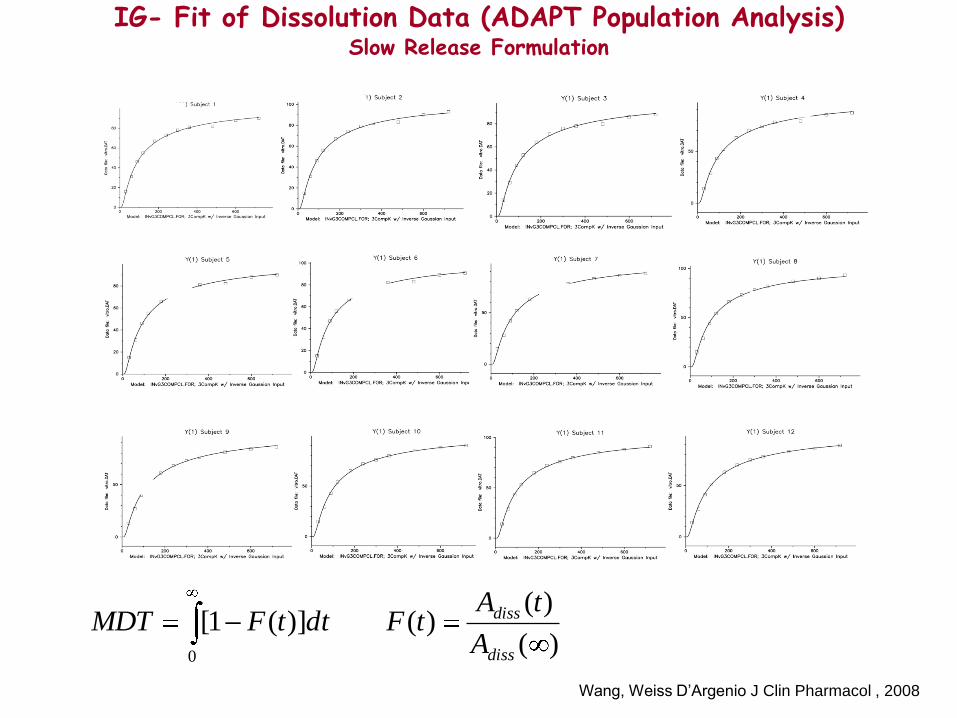
IG- Fit of Dissolution Data (ADAPT Population Analysis) Slow Release Formulation
)(
)()(])(1[
0 diss
diss
A
tAtFdttFMDT

IG-Input Model Fit of Oral Data (ADAPT Population Analysis) Slow Release Formulation
i.v. data were previously fitted using a
3-compartment model
Wang, Weiss D’Argenio J Clin Pharmacol , 2008

Slow release formulation Immediate release (trapidil)
Wang, Weiss D’Argenio J Clin Pharmacol , 2008

F, % 69.9 9.22 F, % 69.8 9.10
MDT, min 318 115 MIT,min 332 77.7
MAT, min 33.9 14.4
CV2D 1.93 0.369 CV2
I 1.22 0.178
tD,max 53.4 19.8 tI,max 84.8 19.7
Comparison of the Population Analysis of Oral Data for the Extended-Release Dosage Form Using the 2 Different Input Models
IG/MAT Model IG Model
Population
Mean Population
Mean Population
SD Population
SD Population
SD
IG, inverse Gaussian; AIC, Akaike information criterion.
MDTinvitro, min 302 39
AIC 1954 1970
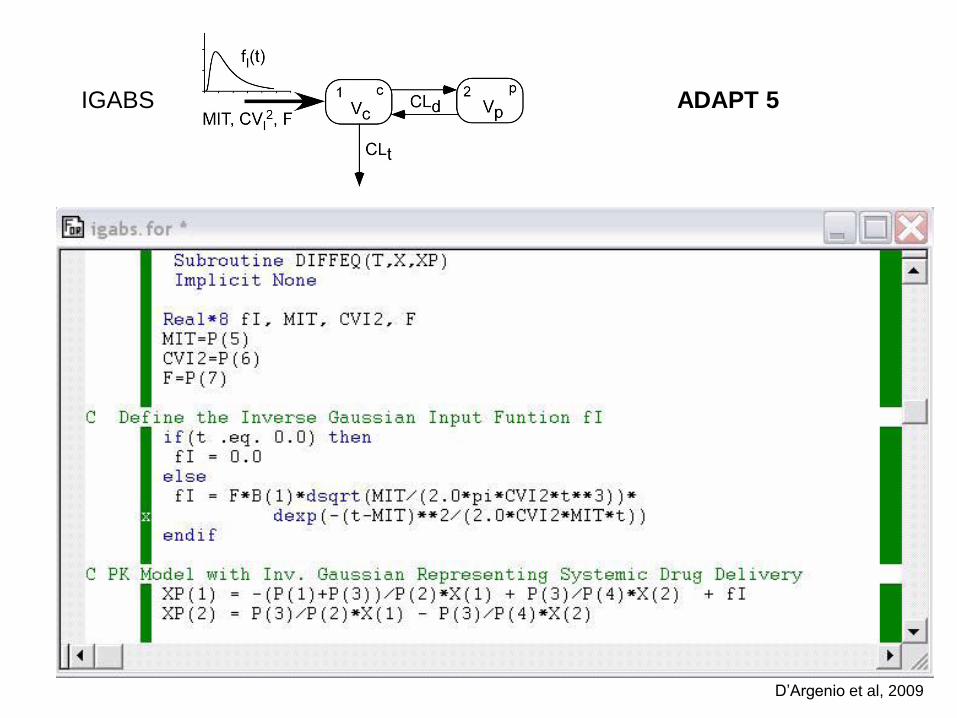
IGABS ADAPT 5
D’Argenio et al, 2009

C(t
)
Fit of oral data
Time (h)
Parametric model of input/absorption rate
10-1
100
101
102
0.00 0.96 1.92 2.88 3.84 4.800.00 0.96 1.92 2.88 3.84 4.80
10-1
100
101
102
10-1
100
101
102
10-1
100
101
102
0.00 0.96 1.92 2.88 3.84 4.800.00 0.96 1.92 2.88 3.84 4.80
Time (h)
C(t
)
iv data
Ab
so
rpti
on
ra
te
0 20 40 60 80 100
0
20
40
60
80
Inverse Gaussian
Sum of inverse Gaussians
Weibull

Csajka C, Drover D, Verotta D. The use of a sum of inverse Gaussian functions to
describe the absorption profile of drugs exhibiting complex absorption. Pharm Res
2005;22:1227–1235.
Sum of IG-Functions Irregular C(t)-Curves
Sum of 2 IGs
Splines

PGP
portal vein blood flow
gut lumen
mucosa cell
Intestinal Absorption (Effect of P-Glycoprotein)

P-Glycoprotein Pump (PGP)
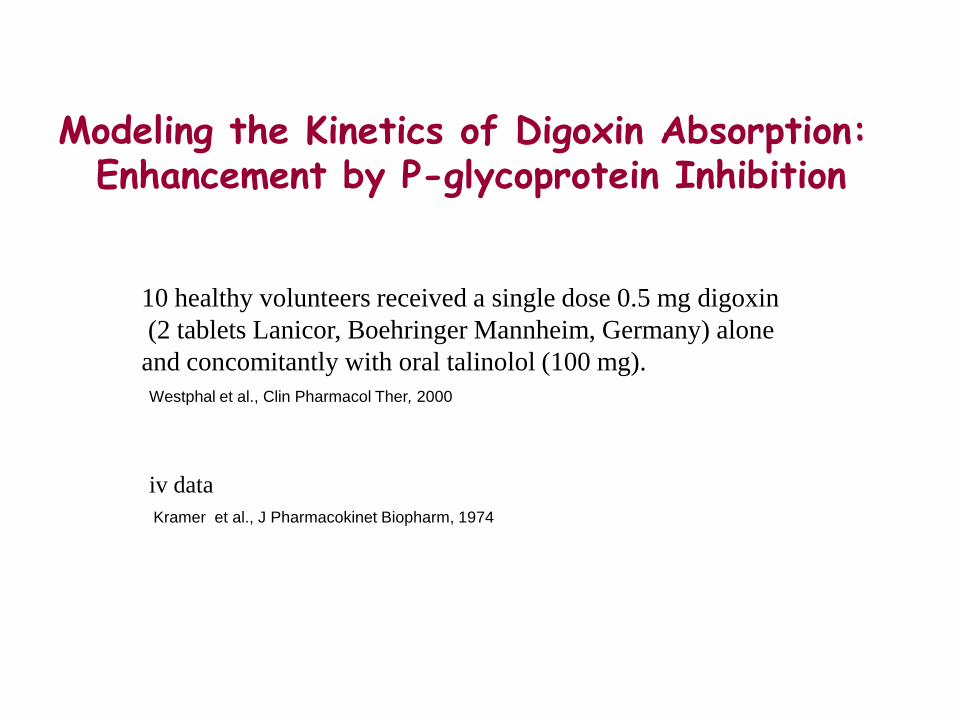
Modeling the Kinetics of Digoxin Absorption: Enhancement by P-glycoprotein Inhibition
10 healthy volunteers received a single dose 0.5 mg digoxin
(2 tablets Lanicor, Boehringer Mannheim, Germany) alone
and concomitantly with oral talinolol (100 mg).
Kramer et al., J Pharmacokinet Biopharm, 1974
Westphal et al., Clin Pharmacol Ther, 2000
iv data

Mea
sure
d C
on
cen
trat
ion
(n
g/m
l)
Predicted Concentration (ng/ml)
Mea
sure
d C
on
cen
trat
ion
(n
g/m
l)
Predicted Concentration (ng/ml)
Dig
oxi
n C
on
cen
trat
ion
(ng
/ml)
0 20 40 60
100
2
3
456
2
3
4
0 20 40 60
100
2
3
456
2
3
4
0 20 40 60
100
2
3
456
2
3
4
0 20 40 60
100
2
3
456
2
3
4
Time (h)
0 20 40 60
100
2
3
456
2
3
4
0 20 40 60
100
2
3
456
2
3
4
inverse Gaussian absorption model
first-order absorption model
Dioxins Tablets (0.5 mg Lanicor®)
Weiss et al, J Clin Pharmacol.,2011

0 1 2 3 4 5
0
20
40
60
80
100
Time (h)
Frac
tio
n A
bso
rbed
(%
)
Talinolol
Control
Increase in F:
21 %
Effect of P-Glycoprotein Inhibition: Bioavailability
Weiss et al, J Clin Pharmacol,2011

0 1 2 3 4 5
0
100
200
300
400
500
Ab
sorp
tio
n R
ate
(μg
/h)
Talinolol
Control
Increase in Absorption Rate:
100 %
Effect of P-Glycoprotein Inhibition Absorption Rate
Weiss et al, J Clin Pharmacol,2011

Digoxin Alone
Digoxin+
Talinolol
Parameters Population Mean
Interpatient %
CV
Population
Mean
(%RSE)
Interpatient %CV
(%RSE)
MAT (h) 1.32 17 0.88 (20)** 31 (50)
0.89 38 0.45 (51)* 63 (92)
F (%) 67.1 14 81.2 (17)* 9 (66)
fA,max (μg/h) a 278 26 499** 34
2
ACV
aMaximum absorption rate
Weiss et al, J Clin Pharmacol,2011

CYP 34A
portal vein blood flow
gut lumen
mucosa cell
Intestinal First Pass Metabolism

F 25% 80% AUCiv 5
AUCor 16
CLint by 84 %
Ketoconacole increases AUC of Midazolam
Inhibition of intestinal and hepatic Cytochrome P450 3A
Tsunoda et al., Clin Pharmacol & Ther, 1999

10 11 12 13 14 15 16 17
V1
0.3
0.4
0.5
0.6
0.7
0.8
V2
Mean dissolution time in vivo (h)
F
r= 0.95
numerical integration IG-absorption model
Bioavailabilty of Propiverine increases with dissolution time
May et al., Eur J Clin Pharmacol, 2008
Re-analyisis of extended release data
using a population approach

MDR1
MRP2
Zimmermann et al., Drug Metab Dispos 2005
The expression of mRNA for CYP3A4,
Pgp, and MRP2 was highest in jejunum and
decreased toward more distal regions.
(Pgp)
Berggren et al.,Mol. Pharm, 2007
Heterogeneity of gastrointestinal CYP and transporter expresssion

Mechanistic modeling based on gastrointestinal tablet transit
a priori information

Simulation models
SymCyp
GastroPlus
Otsuka et al.,J Pharm Pharmacol, 2013
Watanabe et al., J Pharmacol Exp Ther, 2009

Time (h) 0 2 4 6 8
0.00
0.05
0.10
0.15
0.20
V2
Time (h) 0 2 4 6 8
0.0
0.1
0.2
0.3
0.4
0.5
Time (h)
Dissolution Profile Fractional Dissolution Rate
Dis
so
lutio
n r
ate
Dissolution Rate
Fra
cctio
na
l d
isso
lutio
n r
ate
Fra
ctio
n r
ele
ase
d (
%)
Modelling of in vitro dissolution
)(1
)()(
tF
tftk
dt
tdftf
)()(
)(
)()(
A
tAtF
)()1()()( 212 tfqtqftf IGtMDTRD
MDTt
tRD
MDTtf
ii
i
i
ii 2
2
32 2
)(exp
2)(
For example:

0 1 2 3 4 5
0
20
40
60
80
100
0 1 2 3 4 5
0
20
40
60
80
100
0 1 2 3 4 5
0
100
200
300
400
500
observed
C(t
)
0 1 2 3 4 5
0
100
200
300
400
500
predicted
Deconvolution
or
parametric model
C(t
)
In vitro dissolution
In vivo absorption
Am
ou
nt
Am
ou
nt
i.v. data
Validation
Convolution
or
parametric model
i.v. data
IVIVC
0 20 40 60 80 100
0
20
40
60
80
100
% d
iss
olv
ed
in
viv
o
% dissolved in vitro
In vitro–in vivo correlation (IVIVC)
Levy plot
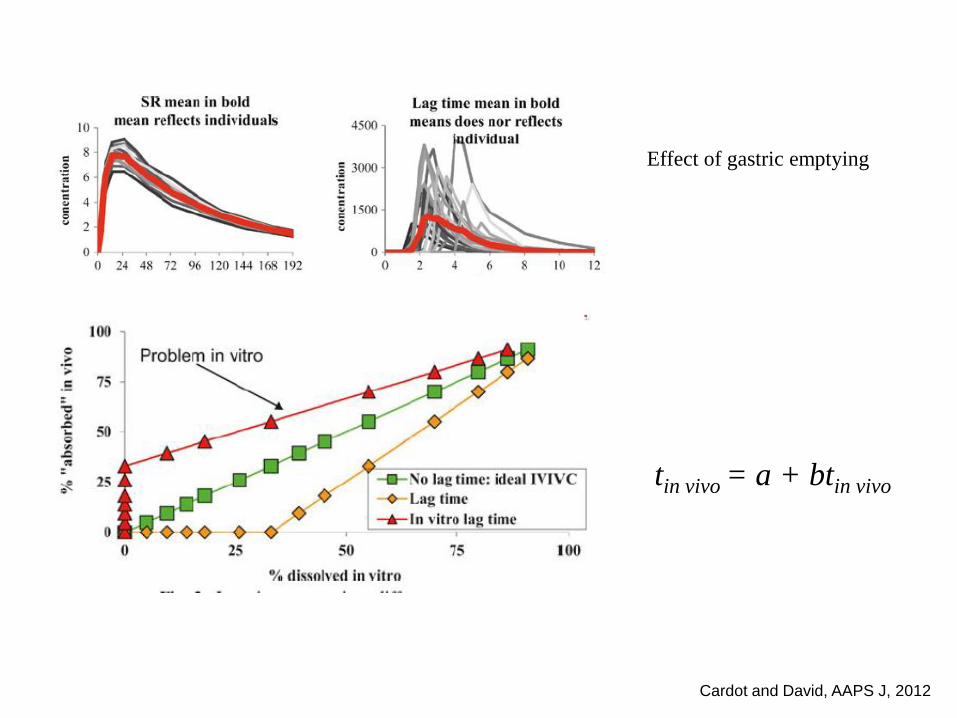
Cardot and David, AAPS J, 2012
tin vivo = a + btin vivo
Effect of gastric emptying
0 20 40 60 80 100
0
20
40
60
0 20 40 60 80 100
0
20
40
60
80
100
% D
isso
lve
d in
viv
o
% Dissolved in vitro Time (h)
Time (h)
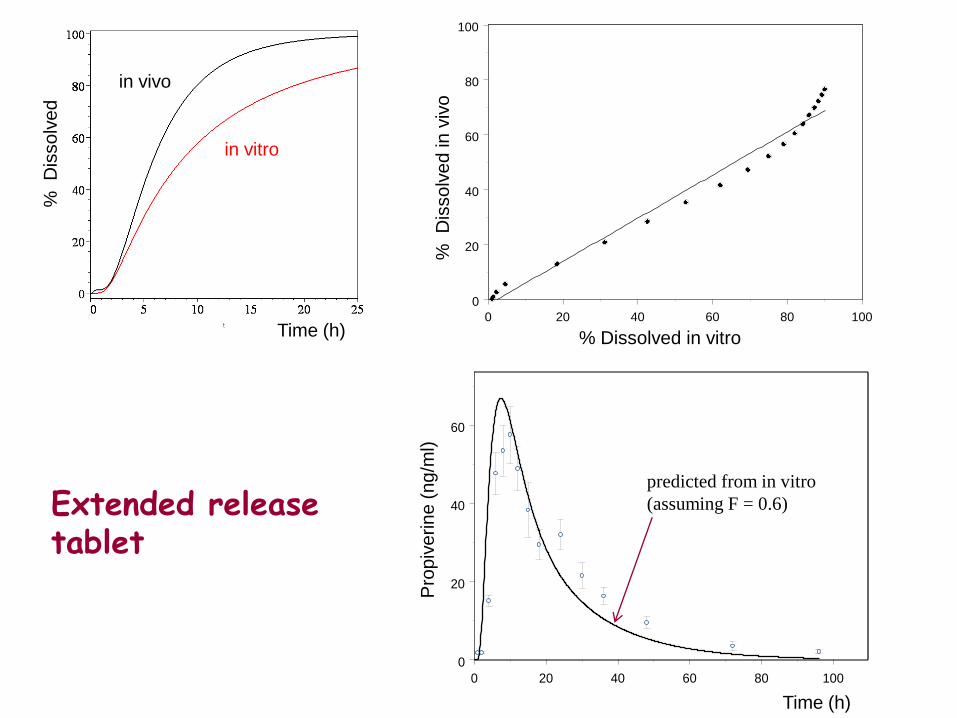
in vitro
in vivo
% D
isso
lve
d
Pro
piv
erin
e (
ng/m
l)
predicted from in vitro
(assuming F = 0.6) Extended release tablet

Metabolite (M) formation after iv administration of parent drug (P)
1P 2P Piv
kPM
k12P
k21P
keP
CP(t)
1M 2M
keM
k12M
k21M
CM(t)
identifiable
only combinations:
keP + kPM kPM /V1M
Metabolite Kinetics
Miv
1. Separate analysis of M disposition
(Miv)
2. M disposition parameters fixed
in fitting P and M formation data

First-pass Metabolite Formation
Pgp
Eh=1-Fh
Fh Parent drug
Formed metabolite

1P 2P
kPM
k12P
k21P
keP
CP(t)
1M 2M
keM
k12M
k21M
CM(t)
Absorption and Metabolite Kinetics
fA(t)
Absorption
(Input)
Rate
Liver

Con
cen
trati
on
[n
mol/
l]
0
50
100
150
Time [h]
0 2 4 6 8 10 12 14
Con
cen
trati
on
[n
mol/
l]
0
200
400
Time [h]
0 2 4 6 8 10 12 14
Modelling Metabolite Kinetics
Morphin 90 mg sustained release tablet (MSTâ)
Morphin M6G
Lötsch, Weiss et al.: Anesthesiology, 1999.
Co
nce
ntr
atio
n [
nm
ol/
l]
0
100
200
300
400
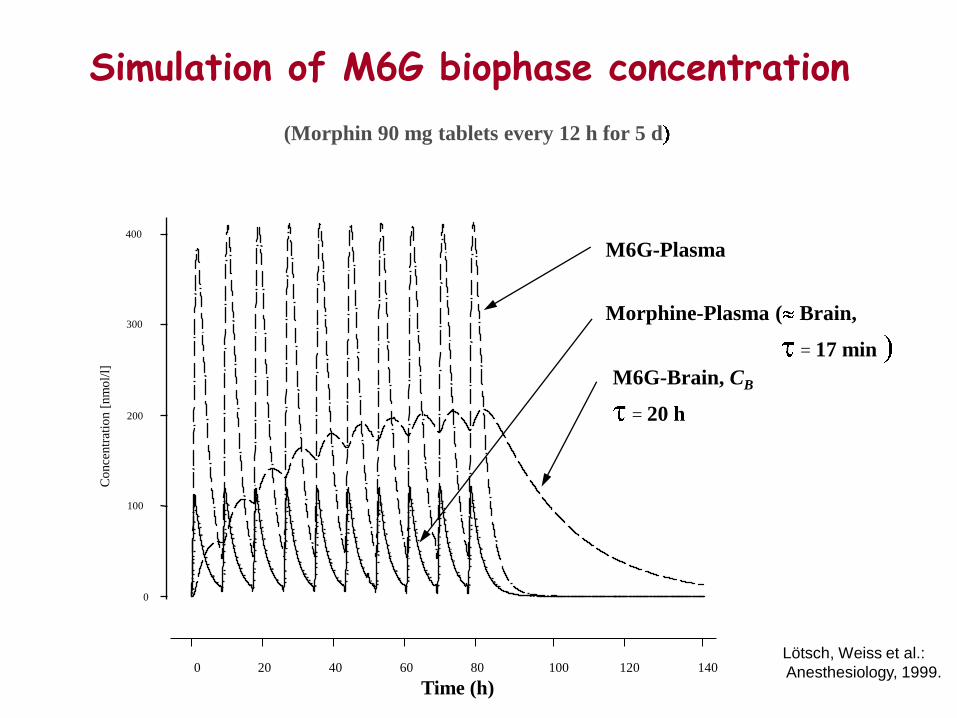
Morphine-Plasma ( Brain,
= 17 min
M6G-Plasma
M6G-Brain, CB
= 20 h
0 20 40 60 80 100 120 140
Time (h)
Simulation of M6G biophase concentration
Lötsch, Weiss et al.:
Anesthesiology, 1999.
(Morphin 90 mg tablets every 12 h for 5 d

M6G-Plasma
Co
nce
ntr
atio
n [
nm
ol/
l]
0
100
200
300
400
Time[h]
0 20 40 60 80 100 120 140
Co
nce
ntr
atio
n [
nm
ol/
l]
0
1000
2000
3000
4000
Morphine-Plasma
M6G-Plasma
M6G-Brain Ceff
Plasma-Brain = 6.5 hr
Simulation: Healthy CLM6G = 162 ml/min
M6G- Brain
Renal failure: CLM6G = 10. ml/min

Weiss, Clin Pharmacokinet, 1990.
Metabolite
Absorption
Drug iv
Liver
Drug
oral
Metabolite AUC after oral and iv Drug Dose: Estimation of Fabs
AUCm,po
AUCm,iv
Fabs Fh
FDAUC
DAUCfFF
ivivm
popom
mabs/
/
,
,
CLCLf Rm /1
Dpo
Div
AUCiv

Berggren, S., C. Gall, et al. (2007). "Gene and protein expression of P-glycoprotein, MRP1, MRP2, and CYP3A4 in the small and
large human intestine." Molecular pharmaceutics 4(2): 252-257.
Bergstrand, M., E. Söderlind, et al. (2009). "Mechanistic modeling of a magnetic marker monitoring study linking gastrointestinal
tablet transit, in vivo drug release, and pharmacokinetics." Clinical Pharmacology & Therapeutics 86(1): 77-83.
Cardot, J.-M. and B. Davit "In vitro-in vivo correlations: tricks and traps." The AAPS journal 14(3): 491-499.
Kramer, W. G., R. P. Lewis, et al. (1974). "Pharmacokinetics of digoxin: Comparison of a two-and a three-compartment model in
man." Journal of pharmacokinetics and biopharmaceutics 2(4): 299-312.
Lotsch, J., M. Weiss, et al. (1999). "Pharmacokinetic modeling of M6G formation after oral administration of morphine in healthy
volunteers." Anesthesiology 90(4): 1026-1038.
May, K., T. Giessmann, et al. (2008). "Oral absorption of propiverine solution and of the immediate and extended release dosage
forms: influence of regioselective intestinal elimination." European journal of clinical pharmacology 64(11): 1085-1092.
Tsunoda, S. M., R. L. Velez, et al. (1999). "Differentiation of intestinal and hepatic cytochrome P450 3A activity with use of
midazolam as an in vivo probe: Effect of ketoconazole*." Clin Pharmaol Ther 66(5): 461-471.
Wang, J., M. Weiss, et al. (2008). "A note on population analysis of dissolution-absorption models using the inverse Gaussian
function." The Journal of Clinical Pharmacology 48(6): 719-725.
Watanabe, T., K. Maeda, et al. "Investigation of the effect of the uneven distribution of CYP3A4 and P―glycoprotein in the
intestine on the barrier function against xenobiotics: A simulation study." Journal of pharmaceutical sciences.
Weiss, M. (1990). "Use of metabolite AUC data in bioavailability studies to discriminate between absorption and first-pass
extraction." Clinical pharmacokinetics 18(5): 419-422.
Weiss, M. (1996). "A novel extravascular input function for the assessment of drug absorption in bioavailability studies."
Pharmaceutical research 13(10): 1547-1553.
Westphal, K., A. Weinbrenner, et al. (2000). "Oral bioavailability of digoxin is enhanced by talinolol: evidence for involvement of
intestinal P-glycoprotein." Clinical Pharmacology & Therapeutics 68(1): 6-12.
Zimmermann, C., H. Gutmann, et al. (2005). "Mapping of multidrug resistance gene 1 and multidrug resistance-associated protein
isoform 1 to 5 mRNA expression along the human intestinal tract." Drug metabolism and disposition 33(2): 219-224.
References
Recommended