
A Sustainable Chesapeake
BETTER MODELS FOR CONSERVATION
Edited by David G. Burke and Joel E. Dunn
THE CONSERVATION FUND
The case study you have downloaded is highlighted below. Other case studies from this Chapter of A Sustainable Chesapeake: Better Models for Conservation can be individually downloaded. The editors
encourage readers to explore the entire Chapter to understand the context and sustainability principles
involved with this and other featured case studies. The full publication contains 6 Chapters in total:
Climate Change Solutions, Stream Restoration, Green Infrastructure, Incentive Driven Conservation,
Watershed Protection and Stewardship.
A Sustainable Chesapeake: Better Models for Conservation | Editors—David G. Burke and Joel E. Dunn | The Conservation Fund, 2010
CHAPTER STREAM RESTORATION
Introduction. . . . . . . . . . . . . . . . . . . . . . . . . . . . . . . . . . . . . . . . . . . . . . . . . . . . . . . . . . . . . . . . . . . . . . . . . . . 32
Converting Drainage Ditches and Nonproductive Farmland into
Functioning Streams and Wetlands. . . . . . . . . . . . . . . . . . . . . . . . . . . . . . . . . . . . . . . . . . . . . . . . . . . . . . 33.
A.Model.for.Improving.Water.Quality.and.Wildlife.Habitat.in.Delaware.
By Maura Browning, David G. Burke, Joel E. Dunn and Thomas G. Barthelmeh
A “Seepage Wetland” Design Approach to Stream Restoration . . . . . . . . . . . . . . . . . . . . . . . . . . . . 43.
A.Better.Model.for.Urban.Stormwater.Management.in.Wilelinor.Stream.Watershed.
By Maura Browning
A “Soft” Design Approach to Stream Restoration. . . . . . . . . . . . . . . . . . . . . . . . . . . . . . . . . . . . . . . . . 53.
Riparian.Buffers.at.Work.in.the.Urban.Watershed.of.Alexandria’s.Kingstowne.Stream.
By Maura Browning
A “Hard” Design Approach to Stream Restoration . . . . . . . . . . . . . . . . . . . . . . . . . . . . . . . . . . . . . . . . .61.
Making.the.Most.of.Confined.Spaces.in.Baltimore’s.Stony.Run.
By Maura Browning
2

A Sustainable Chesapeake: Better Models for Conservation 43
A “S
EE
PA
GE
WE
TL
AN
D” D
ES
IGN
AP
PR
OA
CH
TO
ST
RE
AM
RE
ST
OR
AT
ION
Strea
m R
estoration
2
A “Seepage Wetland” Design Approach to Stream Restoration A Better Model for Urban Stormwater Management in Wilelinor Stream WatershedThe stream restoration work performed on Wilelinor Stream demonstrates how a
historically prevalent native wetland community fits into a promising approach for
improving water quality and managing stormwater, while providing a valued amenity to
adjacent residents.
CASE STUDY SUMMARY
Anne Arundel County, Maryland, has
approximately 1,500 miles of small
streams (first- to third-order streams)
with approximately 300 miles rated
poor to very poor, which are in need
of restoration. These degraded
streams contribute excessive sedi-
ment loads to tidal waters, in addition
to the pollution generated from the
rest of the county’s watersheds.
One of these degraded streams is in
the community of Wilelinor Estates,
located below Maryland Route 2,
just southwest of Annapolis. The
Wilelinor Stream is the primary
headwaters of the southern branch
of Church Creek on the South River.
Typical of urbanizing watersheds,
stormwater velocities and peak flow
volumes have increased as a result of
increased impervious cover.
In 2005, the Maryland State Highway
Administration Environmental
Program, the Maryland Department
of Natural Resources Watershed
Restoration Program, Anne Arundel
County Department of Public Works,
and the Anne Arundel County Public
School’s Chesapeake Connections
collaborated to develop a stream
restoration project designed with
water quality goals in mind. The
partners used a “seepage wetland”
design approach to address erosion
and pollution problems.
For the purposes of this case study, a
“seepage wetland” design approach
offers amenities associated with
“soft” channel design, such as a
connected floodplain and shallow
step-pools, but also employs the use
of permeable berms, seepage res-
ervoirs, and off-line ponds to create
wetland environments that interact
with the main stream channel.
The site analysis and project design
took several months to complete.
Construction began in 2004 and was
completed in April 2005. The project
reestablished a stable stream profile,
created capacity to convey peak dis-
charges, restored aquatic habitat and
ecological function, and reestablished
Comparison of Restoration Features Used in 3 Separate Stream Case Studies Featured in this Publication
“Hard” Design Approach
(Stony Run—see case study)
“Soft” Design Approach
(Kingstowne—see case study)
“Seepage Wetland” Design Approach
(Wilelinor—this case study)
Major
Restoration
Features:
Cross vaneshh
J-hook vaneshh
Imbricated ripraphh
Two-stage channelshh
Step-poolshh
Dry detention pondhh
Plunge poolshh
Soft meandershh
Live stakeshh
Riparian bufferhh
Step-pools (diverse cobble hh
substrate)
Sand bermshh
Seepage reservoirshh
Off-line pondshh
Riffle weirshh
Shallow, aquatic step poolshh

A Sustainable Chesapeake: Better Models for Conservation44
native Atlantic white cedar swamps
to the watershed. The restoration also
satisfied public demand for recreation
amenities in the community.
RESOURCE MANAGEMENT CHALLENGE
Two of the area’s communities, includ-
ing Wilelinor, were originally designed
and constructed with in-stream
architectural/recreational amenities
(ponds) intended to provide fishing,
canoeing, relaxation, etc.1 Over time,
as the watershed became increasingly
developed, the dynamics changed.
Greater runoff with less infiltration/
evaporation, as well as sediment
from upstream development, filled
the ponds. The dams reached the
point of imminent failure, and the
community amenities were lost.
Residents demanded their restoration,
with support from other nearby com-
munities. Together, they mounted a
significant campaign focused at local
government that emphasized their
dissatisfaction with the degradation
of their neighborhood waterways.
There is a substantial body of
research that details the ability
of restored streams and adjacent
riparian buffers to store sediment to
retain and transform nutrients and
other toxic substances, and to create
stable stream ecosystems.2,3,4,5,6,7
Nevertheless, there is a paucity of
post-restoration monitoring, and
many water resource agencies do
not have data indicative of stream
restoration performance as a best
management practice for reducing
nitrogen and sediment export from
urban watersheds.8,9 Subsequently,
there is low confidence in the
ability of stream restoration design
approaches to achieve desired water
quality goals, which is the most
commonly stated goal for stream
restoration projects in the Bay water-
shed.10 Post-restoration monitoring is
needed to determine the effective-
ness of the seepage wetland design
approach to the restoration of water
quality in the Wilelinor Stream.
CONSERVATION VISION
In an effort to address the strong
public interest in restored recreational
resources and improvement of water
quality, the state agencies and local
partners implemented a major res-
toration project on Wilelinor Stream.
Although the community wanted
the ponds returned to their original
condition, current state policies no
longer allow in-stream structures
needed to restore the ponds. After
a year-long process of education,
dialogue and relationship-building,
an agreement was made to restore
the valley into a wetland complex,
“designed to provide community
access and enjoyment of the wildlife,
amphibians, habitat and natural fish
passage throughout the system.”11
Watershed Characteristics
214 acres on the h
Coastal Plain (Church
Creek watershed is
1,217 acres)
37% covered by h
impervious surface
(37% in the Church
Creek watershed)
49% of the land is h
residential; 22%
is wooded; 21%
is commercial/
industrial; 7% is for
transportation; 1% is
open space
h�Wilelinor Stream Watershed – Annapolis, Maryland

A Sustainable Chesapeake: Better Models for Conservation 45
A “S
EE
PA
GE
WE
TL
AN
D” D
ES
IGN
AP
PR
OA
CH
TO
ST
RE
AM
RE
ST
OR
AT
ION
Strea
m R
estoration
2
The partners used a “seepage wetland
approach,” which included off-line
ponds, seepage reservoirs, and step
pools, to create a baseflow discharge
of 0.169 cubic feet per second and a
100 year discharge/design capacity of
873 cubic feet per second.
IMPLEMENTATION RESOURCES
The total cost of the 1,311 foot stream
restoration project was $1.02 million
(adjusted to 2008 dollars), which is
$776/foot. The “seepage wetland”
design approach restores the most
ecosystem services for a reason-
able cost per linear foot, relative
to hard and soft stream restoration
approaches. The project was funded
by Anne Arundel County through the
capital improvement budget; and the
State of Maryland evenly cost-shared
the project with the County.
Keith Underwood & Associates
designed the stream restoration
project, and Baltimore Pile Drivers,
Inc. constructed it. In partnership with
the Anne Arundel County Department
of Public Works, the Wilelinor Com-
Students and staff planted more than 1,500 plants to help restore Wilelinor Stream.
h�Wilelinor Stream Restoration, Generalized Site Plan Annapolis, Maryland
munity Association and the Arlington
Echo Outdoor Education Center
organized a community planting
project in the stream valley post-
restoration. Students and staff from
area schools volunteered their time
and planted more than 1,500 Atlantic
White Cedar and other native plants
in April 2005 to celebrate completion
of the restoration project.
CONSERVATION STRATEGY
Keith Underwood & Associates
developed a regenerative stormwater
conveyance system
(RSCS) to restore the
stream. The RSCS
collects then traverses
stormwater runoff
through a series of
aquatic beds and
riffle weir grading
structures to treat,
detain and infiltrate it
to groundwater. The
stormwater moves
from drain outlets
down a series of
small plunge pools
to the main stem of
the receiving stream,
achieving veloc-
ity reductions and
interactions with the
adjacent riparian buf-
fer. Beyond reducing
flow velocities, plunge

A Sustainable Chesapeake: Better Models for Conservation46
Seepage reservoir
2’ Sand
Main channel
Capillarity
Seepage
A seepage reservoir at Wilelinor Stream. The main stream channel is to the right.
A seepage reservoir engineering schematic.
Seepage Reservoir Photo and Schematic

A Sustainable Chesapeake: Better Models for Conservation 47
A “S
EE
PA
GE
WE
TL
AN
D” D
ES
IGN
AP
PR
OA
CH
TO
ST
RE
AM
RE
ST
OR
AT
ION
Strea
m R
estoration
2
pools create habitats for aquatic
species.
The following section details the five
principle restoration features that
contributed to water quality improve-
ment in the Wilelinor Stream.
Sand Berms: Sand berms, or debris
dams and gravel bars, create seepage
reservoirs that allow infiltration from
the water stored at a higher elevation
to seep through sand and exfiltration
into the stream channel as baseflow.
A study of the denitrification poten-
tial of debris dams and gravel bars
on several streams in the Baltimore
metropolitan area demonstrated
that structures with organic matter
have higher denitrification potential,
particularly structures with high
organic matter content,12 such as
coarse woody debris.
Seepage Reservoirs: Seepage reser-
voirs are containment areas alongside
streams where water is stored tempo-
rarily to dissipate energy from storm
events; water may then exfiltrate from
an area of higher elevation into the
stream channel. Seepage reservoirs
replicate functions occurring in natu-
ral riparian zones, such as dissipation
of water energy and denitrification. A
study of the denitrification potential
in four urban and four rural riparian
zones in the Baltimore metropolitan
area demonstrated “strong positive
relationships between soil moisture
and organic matter content and
denitrification potential.”13
Off-Line Ponds: Off-line ponds
temporarily collect water that has
been diverted from the main stream
channel. The water held in the ponds
seeps through to lower a lower
Su
bm
erg
ed
foo
ter
bo
uld
erP
oo
l3
ft.d
ee
p
50
0–6
,00
0 lb
.B
ou
lde
rs
Co
bb
le D
50
–XX
22
3
3
4
4
44
5
5
3
3
A riffle weir at Wilelinor Stream.
A riffle weir and step-pool engineering schematic.
A sand berm (center) and off-line pond (right) at Wilelinor Stream. The main stream channel is to the left.
Riffle Weir Photo and Schematic

A Sustainable Chesapeake: Better Models for Conservation48
Wilelinor Stream Results
Mean Difference Between
Upstream and Downstream:
-0.16 mg/L nitrate-N
-0.06 mg/L ammonia- N
-4.14 mg/L TSS
+1.33 mg/L DO
-0.93 °C
Statistically Significant Results: Upstream/downstream comparison:
nitrate-N, ammonia-N, TSS, DO, and
temperature
Stream comparison: nitrate-N percent
difference between upstream and down-
stream samples are greater than “hard”
and “soft” designs
Shallow, aquatic step-pools at Wilelinor Stream.
elevation and acts as baseflow to
the receiving stream. Constructing
channels to off-line ponds helps water
move between the main channel
and the landscape, and can provide
a three-fold benefit of dissipating
stormwater energy before it reaches
the stream channel, increasing con-
tact time with bacteria and organic
material, and promoting the removal
of in-stream nitrogen.14 Other studies
have demonstrated that nitrogen
removal was linked to slower waters.15
Off-line ponds are an important tool
for urban stream restoration because
of these multiple benefits.16
Riffle Weirs: A riffle weir is used in a
step-pool sequence to promote shal-
low and turgid conveyance of water.
This promotes stream-subsurface
water interaction and expands the
extent of a relatively aerobic hypor-
heic exchange between the water in
the stream channel and groundwater
entering through the adjacent catch-
ment.17 The top weir at Wilelinor is
specifically sized to control grade, to
reduce velocity of water entering the
main stream channel, and to deliver
water to the main off-line pond for
gradual release to the stream channel.
Shallow, Aquatic Step-Pool
Sequences: These pools are cre-
ated with the placement of a riffle
weir grade control structure in a
watercourse. Nitrogen removal can be
increased by step pools such as these
because they “increase topographic
complexity, surface-to-area-volume
ratio, and hydraulic retention to allow
for greater contact between the water
and the benthos (e.g., introduction of
large, woody debris, construction of
pool-riffle or step-pool sequences).”18
Using step pools to slow and retain
water may even be one of the
best options for urban headwater
streams.19,20
RESULTS
The Anne Arundel County Depart-
ment of Public Works and its partners
made significant improvements to
the Wilelinor stream. In total, they
restored 1,311 feet of the stream
reach. They installed sand berms and
seepage reservoirs, off-line ponds,
riffle weirs and shallow aquatic step
pools. These actions restored some
of the natural function of the stream
and slowed the flow of water running
through the stream in heavy precipita-
tion events, which reduced pollution
and improved other water quality
indicators, and produced some recre-
ation amenities for the community.
Monitoring events conducted by the
author primarily during baseflow con-
ditions between October 2007 and
April 2008 found significant evidence
of in-stream nitrogen processing,
sediment uptake, and improved water
quality at Wilelinor Stream. During
this time period, the restoration
(albeit with maintenance) retained its
structural integrity through a 100-year
flood event, when a water line broke
in December 2007.21 This quieted
some concerns over the durability of
this design during peak storm flows in
the absence of more hardened stream
banks. The water line break occurred
in between sampling events and did
not affect monitoring efforts.
A Sustainable Chesapeake: Better Models for Conservation 49
A “S
EE
PA
GE
WE
TL
AN
D” D
ES
IGN
AP
PR
OA
CH
TO
ST
RE
AM
RE
ST
OR
AT
ION
Strea
m R
estoration
2
Riffle weir
D50-XX Cobble
Submergedaquatic
vegetation
Rootwad
WSE EL 10
Coarsewoodydebris
WSE EL 9
To creek
500–6,000 lb.Sandstone boulders
Ex. substrate
Sand
Existinggrade
Floodplain
Stream
Riffle Weir
D50–6”Cobble
Compost
Rootwad
WSE EL 12min. depth 3 ft.
WSE EL 7min. depth 3 ft.
Geotextile
Bank rungravel
Submergedaquatic
vegetation
500–6,000lb.Sandstoneboulders
Sand (min. 3 ft.)
Ex. substrate
Ex. pipe
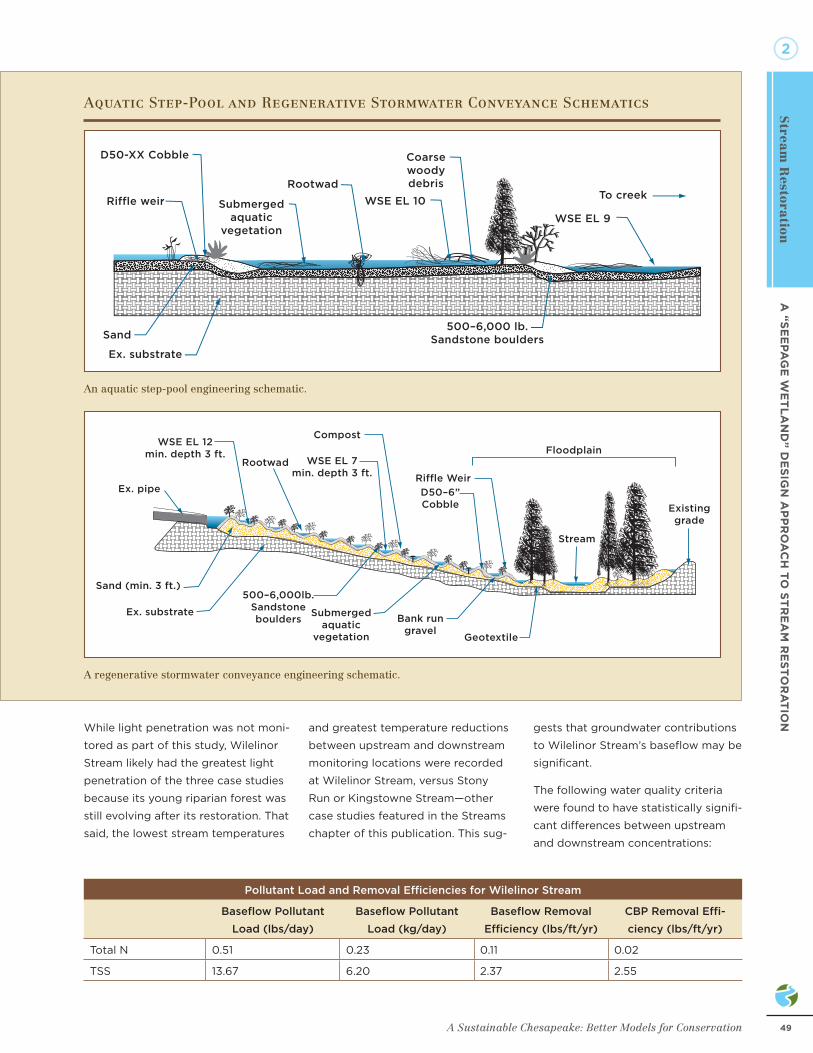
An aquatic step-pool engineering schematic.
A regenerative stormwater conveyance engineering schematic.
While light penetration was not moni-
tored as part of this study, Wilelinor
Stream likely had the greatest light
penetration of the three case studies
because its young riparian forest was
still evolving after its restoration. That
said, the lowest stream temperatures
and greatest temperature reductions
between upstream and downstream
monitoring locations were recorded
at Wilelinor Stream, versus Stony
Run or Kingstowne Stream—other
case studies featured in the Streams
chapter of this publication. This sug-
gests that groundwater contributions
to Wilelinor Stream’s baseflow may be
significant.
The following water quality criteria
were found to have statistically signifi-
cant differences between upstream
and downstream concentrations:
Pollutant Load and Removal Efficiencies for Wilelinor Stream
Baseflow Pollutant
Load (lbs/day)
Baseflow Pollutant
Load (kg/day)
Baseflow Removal
Efficiency (lbs/ft/yr)
CBP Removal Effi-
ciency (lbs/ft/yr)
Total N 0.51 0.23 0.11 0.02
TSS 13.67 6.20 2.37 2.55
Aquatic Step-Pool and Regenerative Stormwater Conveyance Schematics

A Sustainable Chesapeake: Better Models for Conservation50
Wilelinor Stream post-restoration.
Average nitrate-N: 0.48 milligrams
per liter (mg/L) at the upstream
monitoring location; 0.31 mg/L at
the downstream monitoring location.
These concentrations are much
less than typical nitrogen pollutant
concentrations for urban stormwater
of 2.0 mg/L.22 The average difference
between upstream and downstream
concentrations of nitrate-N was 0.17
mg/L (t(14) = 3.821, p = 0.002), result-
ing in a 39% overall removal efficiency
of nitrate-N.
Average ammonia-N: 0.17 mg/L at
the upstream monitoring location; 0.11
mg/L at the downstream monitoring
location (t(14) = 3.521, p = 0.003).
Average total supsended solids
(TSS): 13.49 mg/L at the upstream
monitoring location; 9.35 mg/L at the
downstream monitoring location (t(
7) = 3.845, p = 0.006).
Average dissolved oxygen: 7.37 mg/L
at the upstream monitoring location;
8.70 mg/L at the downstream moni-
toring location, resulting in an average
difference of 0.93 mg/L (t(11) =
-5.938, p = 0.000). Most aquatic fauna
require dissolved oxygen concentra-
tions greater than 5 mg/L for survival.
Low dissolved oxygen also promotes
accelerated release of phosphorus
and toxins from sediments.
Average temperature: 9.67 °C at the
upstream monitoring location; 8.74
°C at the downstream monitoring
location (t(11) = 2.911, p = 0.013).
The following water quality criteria
were not statistically significant but
did demonstrate consistent trends
between upstream and downstream
monitoring points:
Average specific conductivity: 0.51
millisiemens (mS/cm) at the upstream
monitoring location; 0.50 mS/cm at
the downstream monitoring location
(Z = -1.138, p = 0.255).
Average pH: 7.22 at the upstream
monitoring location; 7.17 at the
downstream monitoring location (Z =
-0.392, p = 0.695).
Baseflow pollutant loads were
calculated for the sum of nitrate-N
and ammonia-N concentrations (total
N) and TSS in pounds per day (lbs/
day) and kilograms per day (kgs/day)
for comparison to traditional Total
Maximum Daily Loads (TMDLs).23
Removal efficiencies were calculated
in pounds per foot per year (lbs/ft/
yr) for comparison to Chesapeake
Bay Program removal efficiencies for
urban stream restoration.24
Water Quality Statistical Abbreviations
The statistical abbreviations used in the water quality summary above
have the following meanings:
t = The t-test is the most commonly used method to evaluate the differ-hh
ence in means between two groups. The number in parenthesis is the
number of pairs used in that particular paired t-test e.g. t(14) = 3.821.
p = p-value. The p-value is a statistical measure for the probability hh
that the results observed in a study could have occurred by chance.
Conventionally, a p-value of 0.05 (5%) or below is accepted as being
statistically significant.
z = The z-value used in this summary is the statistic resulting from the hh
nonparametric Wilcoxon test for significance. The Wilcoxon test can
be used as an alternative to the t-test when the population cannot be
assumed to be normally distributed.

A Sustainable Chesapeake: Better Models for Conservation 51
A “S
EE
PA
GE
WE
TL
AN
D” D
ES
IGN
AP
PR
OA
CH
TO
ST
RE
AM
RE
ST
OR
AT
ION
Strea
m R
estoration
2
These pollutant loads and efficiency
claims are rough estimations based
on limited hydraulic monitoring (pri-
marily baseflow conditions) without
consideration of rainfall characteris-
tics, runoff patterns, and total annual
flow volume passing through the
reach.
KEYS TO SUCCESS
System Resilience:hh During the
sampling period, Wilelinor Stream
withstood a 100-year flood
event when a water line broke in
December 2007, demonstrating
that the restoration techniques
used at this site can handle peak
discharge volumes. It is noted,
however, that some maintenance
may be required as the stream
recovers from construction and the
riparian buffer develops.
Slowing Water:hh In-stream features
that slow stormwater, thereby
increasing water residence time
and opportunities for hyporheic
exchanges (i.e. movement of water
between the stream and adjacent
porous subsurface areas), have
potential to increase in-stream
processing of nitrogen.
Storing Water:hh Restoration features
such as seepage reservoirs and
off-line ponds offer opportunities
for groundwater recharge, freshwa-
ter storage, wetland creation, and
valuable aquatic habitat.
Adding Woody Debris:hh Addition of
woody debris and other vegetation,
such as those found along the sand
berms at Wilelinor, may have the
potential to improve soil carbon
levels,25 create benthic habitat,
and enhance nitrogen removal and
stream bank stability.26
Volunteers:hh Several hundred
volunteers, including school
students, teachers, parents, and
neighbors, helped to plant native
vegetation throughout the wetland.
The students propagated the
native plants through the Arlington
Echo Outdoor Education Center,
which is part of the county school
system. The community is thrilled
with their new amenity and named
it “Keith’s Branch” in honor of
the consultant who designed the
restoration features and managed
the construction.
PHOTOS AND FIGURES
Page 43, 46, 48, 50: Photos, David
Burke
Page 44: Figure, Burke Environmental
Associates/The Conservation Fund,
using Google Earth image
Page 45: Photo, Underwood and
Associates; figure, Burke Environ-
mental Associates/The Conservation
Fund, adapted from Underwood and
Associates graphic using Google
Earth image
Page 46: Figure, Underwood and
Associates
Page 47: Photo (top), David Burke;
photo (bottom) and Figure, Under-
wood and Associates
Page 49: Figure, Underwood and
Associates
REFERENCES
1,11Bowen, R. 2008. Personal com-
munication via email on May 21, 2008,
with Mr. Ronald Bowen, Director of
Anne Arundel County’s Department
of Public Works, Annapolis, MD.
2Ensign, S. H. and M. W. Doyle.
2006. Nutrient spiraling in streams
and river networks. Journal of
Geophysical Research. 111, G04009,
doi:10.1029/2005JG000114.
3United States Army Corps of
Engineers and North Carolina Depart-
ment of Environment and Natural
Resources. 2005. Information Regard-
ing Stream Restoration in the Outer
Coastal Plain of North Carolina.
4,14,16,18,19,25Craig, L., M. Palmer, D.
Richardson, S. Filoso, E. Bernhardt,
B. Bledsoe, M. Doyle, P. Groffman,
B. Hassett, S. Kaushal, P. Mayer, S.
Smith, and P. Wilcock. 2008. Stream
restoration strategies for reducing
river nitrogen loads. Frontiers in
Ecology and the Environment, 6,
doi:10.1890/070080.
5Peterson, B. W. Wollheim, P. Mulhol-
land, J. Webster, J. Meyer, J. Tank,
E. Martí, W. Bowden, H. M. Valett, A.
Hershey, W. McDowell, W. Dodds, S.
Hamilton, S. Gregory and D. Morrall.
2001. Control of nitrogen export from
watersheds to headwater streams.
Science. 292:86-90.
6Roberts, B., P. Mulholland and J.
Houser. 2007. Effects of upland
disturbance and instream restoration
on hydrodynamics and ammonium
uptake in headwater streams. Journal
of North American Benthological
Society. 26(1):38-53.
7Riley, A. 2008. Putting a Price on
Riparian Corridors as Water Treatment
Facilities. California Regional Water
Quality Control Board, San Francisco
Bay Region, Oakland, CA, pp. 1-16.
8Stack, W. 2007. Personal communica-
tion via email held on October 25,
2007, with Mr. William Stack, Chief
Water Quality Engineer for Baltimore,
MD.
9Simon, A., M. Doyle, M. Kondolf,
F.D. Shields Jr., B. Rhoads, and M.
McPhillips. 2007. Critical evaluation
of how the Rosgen classification
and associated “natural channel
design” methods fail to integrate and
quantify fluvial processes and channel
response. Journal of the American
Water Resources Association. 43(5):
1-15.
10Hassett, B., M. Palmer, and E.
Bernhardt. 2007. Evaluating stream
restoration in the Chesapeake Bay
watershed through practitioner
interviews. Restoration Ecology.
15(3):563-572.
12Groffman, P., A. Dorsey and
P. Mayer. 2005. N processing
within geomorphic structures in urban

A Sustainable Chesapeake: Better Models for Conservation52
FOR MORE INFORMATION Project Contact: Ronald Bowen Director, Anne Arundel County Department of Public Works Heritage Complex, 2662 Riva Road Annapolis, MD. 21401 Phone: (410) 222-7500 | Email: [email protected]
For water quality questions associated with this profile contact:
Maura Browning Email: [email protected]
i
streams. Journal of North American
Benthological Society. 24(3):613-625.
13Groffman, P. M. and M. K. Crawford.
2003. Denitrification potential in
urban and riparian zones. Journal of
Environmental Quality. 32:1144–1149.
15Kaushal, S., P. Groffman, P. Mayer,
E. Striz and A. Gold. 2008. Effects of
stream restoration on denitrification
in an urbanizing watershed. Ecological
Applications. 18(3):789-804.
17,20Kasahara, T. and A. Hill. 2006.
Effects of riffle–step restoration on
hyporheic zone chemistry in N-rich
lowland streams. Canadian Journal
of Fisheries and Aquatic Sciences.
63:120-133.
21Cox, E. and E. Furguson, III. 2007.
Water Main Break Effects Will Linger,
Nearby Stream Restoration Project
Not Affected by Deluge. The Capital
(December 7, 2007). Annapolis, MD.
22Center for Watershed Protection.
2003. Maryland Chesapeake and
Atlantic Coastal Bays Critical Areas
10% Rule Guidance Manual. Critical
Area Commission for the Chesapeake
and Atlantic Coastal Bays. 98 pp. +
appendices.
23Environmental Protection Agency.
2007. Total Maximum Daily Loads with
Stormwater Sources: A Summary of
17 TMDLs. Environmental Protection
Agency, Washington, D.C. EOA 841-R-
07-002.
24Chesapeake Bay Program. 2006.
Best Management Practices for
Sediment Control and Water Clarity
Enhancement. U.S. Environmental
Protection Agency, Annapolis, MD.
CBP/TRS-282-06.
26Roberts, B., J. Mulholland and J.
Houser. 2007. Effects of upland
disturbance and in-stream restoration
on hydrodynamics and ammonium
uptake in headwater streams. Journal
of North American Benthological
Society. 26(1):38-53.
Recommended


![[11] Seepage [Rev2]](https://img.dokumen.tips/doc/110x75/55cf9210550346f57b932a1e/11-seepage-rev2.jpg)
