Energies 2015, 8, 1487-1504; doi:10.3390/en8021487
energies ISSN 1996-1073
www.mdpi.com/journal/energies
Article
A Study on the Variation of Heating and Cooling Load According to the Use of Horizontal Shading and Venetian Blinds in Office Buildings in Korea
Seok-Hyun Kim 1, Kyung-Ju Shin 1, Bo-Eun Choi 1, Jae-Hun Jo 2, Soo Cho 3 and
Young-Hum Cho 4,*
1 Department of Architectural Engineering, Graduate School of Yeungnam University,
Gyeongsan 712-749, Korea; E-Mails: [email protected] (S.-H.K.);
[email protected] (K.-J.S.); [email protected] (B.-E.C.) 2 Department of Architectural Engineering, Inha University, Incheon 151-402, Korea;
E-Mail: [email protected] 3 Korea Institute of Energy Research, Daejeon 305-343, Korea; E-Mail: [email protected] 4 School of Architecture, Yeungnam University, Gyeongsan 712-749, Korea
* Author to whom correspondence should be addressed; E-Mail: [email protected];
Tel.: +82-54-810-3081; Fax: +82-54-810-4625.
Academic Editor: Vincenzo Dovì
Received: 23 November 2014 / Accepted: 4 February 2015 / Published: 16 February 2015
Abstract: The construction industry has made considerable energy-saving efforts in
buildings, and studies of energy-savings are ongoing. Shading is used to control the solar
radiation transferred through windows. Many studies have examined the position and type
of shading in different countries, but few have investigated the effects of shading
installation in Korea. In this study, the case of the shading installation according to the
standard of Korea, and variations of the heating and cooling load in the unit area on the
performance of the windows were examined. This study compared the variations of the
heating and cooling load in the case of horizontal shading and the changing position of
venetian blinds. This study confirmed that horizontal shading longer than the standard
length in Korea saved a maximum of 13% energy consumption. This study confirmed the
point of change of energy consumption by the Solar Heat Gain Coefficient (SHGC)
variations. The exterior venetian blinds and those between glazing were unaffected by the
SHGC. On the other hand, in the case of a south façade, the interior venetian blinds
OPEN ACCESS

Energies 2015, 8 1488
resulted in 24% higher energy consumption than the installation of horizontal shading in
case of Window to Wall Ratio (WWR): 80%, U-value: 2.1 and SHGC: 0.4.
Keywords: Window to Wall Ratio (WWR); window; horizontal shading; venetian blind;
office buildings
1. Introduction
The Window to Wall Ratio (WWR) of buildings has increased through the modern advances in
architectural design. As the window area increases, the performance of windows becomes more
important. Most efforts to improve this performance have been based on thermal insulation and
air-tightness, when actually the cooling load is affected by the solar radiation transmitted through
windows in buildings.
The thermal insulation performance and air-tightness performance help reduce the energy
consumption in buildings. In addition, energy labeling, which is regulated in Korea, was proposed to
grade the performance of thermal insulation (U-value, W/m2·K) and air-tightness (flow rate, m3/h·m2).
As a result, the performance of windows has been improved by the manufacturers. On the other hand,
solar heat gain increases the cooling load in summer and decreases the heating load in winter.
This must be controlled appropriately. The Solar Heat Gain Coefficient (SHGC) and shading were
used to consider solar control. Studies of the SHGC and shading are ongoing, and shading has been
studied according to the material and method of installation to determine the most efficient shading
effect. Despite this, few studies have examined energy consumption through a comprehensive
examination of the window orientation and climate.
A range of studies have examined energy consumption in terms of windows. The complex
application of window elements was confirmed [1], and the correlation between energy consumption
and the impact of energy consumption was analyzed by simulation. On the other hand, they only
confirmed energy consumption according to the variation of the window performance. Therefore,
the present study confirmed the variation of the heating and cooling load by a similar review and a
simulation of base modeling. In addition, the effects of heating and cooling energy consumption and
lighting were confirmed by simulation of office buildings [2]. This study confirmed the variation of
energy consumption according to the window performance. A study of the energy performance
confirmed the correlation with glazing and windows [3]. The elements of this study were the U-value
and G-value. Another study considered the elements of the windows for energy consumption and
optical comfort [4]. The present study confirmed the importance of the WWR. A study of the change
in energy consumption by the influence of WWR was published [5]. On the other hand, these studies
did not consider the correlation between the elements of window performance and shading. Studies of
a double-skin façade considered various shading factors. The intermediate space of the glass-skin is the
installation position of shading, as the shading device is installed in this space. This study confirmed
the effects of the shading device on the interior environment [6,7]. In addition, a study of the double
skin façade design parameters confirmed that the design process changes according to the variations of
the blind position and reflectance [8]. Studies of the external horizontal shading confirmed the

Energies 2015, 8 1489
variation of solar radiation incidence caused by six types of shading in tropical climates [9]. One study
of the envelope design confirmed the effect of the various sunshields in Taiwan [10]. For sustainable
design guidelines, a design parameter affecting the energy performance of shading was proposed,
and its contribution of shading and reflective surfaces on the cooling load was confirmed [11].
Nevertheless, more studies of the variation of energy consumption according to the shading properties
are needed.
The Korean government has provided guidelines and regulations for window installation. Shading is
also defined by regulations in Korea. The guidelines and regulations for reducing the energy
consumption in buildings are not perfect, and any study related to windows must adhere to the
guidelines and regulations of the Korean government. The Building Energy Conservation in Korea
defined shading as blocking solar radiation, and identified exterior shading, interior shading and
between the glass shading as parameters [12]. In addition, the Energy Performance Indicator (EPI)
checks the exterior shading and admits just the auto controlled interior shading. Green building
certification is the proposed standard for decreasing the level of greenhouse gas emissions [13].
This standard proposes the minimum length of horizontal shading to decrease glare and provide
environmental improvements. The minimum length of horizontal shading was determined using
Equation (1):
A
HP
tan
(1)
where P is the length of horizontal shading, H is the horizontal length to shading from the bottom of
the window and A is the meridian altitude in summer (90-latitude + 23.5). Figure 1 presents the length
of horizontal shading.
Figure 1. Length of horizontal shading.
“The Window Design Guidelines for Energy-saving of Buildings” were published the Ministry of
Land, Transport and Maritime Affairs [14]. The purpose of these guidelines is to allow a variety of
designs to consider the energy performance in building design. These guidelines confirmed the impact
of the window design of office buildings on the energy consumption of buildings and proposed the

Energies 2015, 8 1490
orientation, WWR and types of windows in each region. In addition, these guidelines can be used to
calculate the energy savings. The guidelines proposed the exterior shading for energy saving but it was
just one case of a length of 600 mm. Table 1 lists the regulation and guidelines for windows in Korea.
Table 1. Regulation and guidelines for windows in Korea.
Title Section Contents
Building Energy Conservation Design
Standards
Design performance
WWR/Orientation
Window performance
Heat transmission coefficient (U-Value)/Air-tightness
Shading Position: Exterior/Between Glazing/Interior
Green Building Certification
Design performance
WWR
Window performance
Heat transmission coefficient (U-Value)/Air-tightness
Shading Proposed minimum length (P) of shading
The Window Design Guideline for
Energy-saving of Buildings
Design performance
WWR/Orientation
Window performance
Heat transmission coefficient (U-Value)/Air-tightness/SHGC
Shading Optional Exterior shading (600 mm)
The aim of this study was to confirm the energy saving effect of shading installation. Because the
remodeling or new buildings in Korea needs to install shading using the renewed Korean regulations,
this study confirmed the energy saving effects and proposed basic research guidelines for shading
design. In addition, this study referenced the regulations and guidelines in Korea. This study also
confirmed the horizontal shading installation effect. The variation of heating and cooling load was
confirmed by changing the length of horizontal shading. The results were compared according to the
variation of SHGC. In addition, this study confirmed the correlation between the horizontal shading
and the various venetian blind types through the variations of the heating and cooling load. This study
confirmed the energy saving ratio of the various venetian blinds than the horizontal shading.
2. Standard Building Modeling and Simulation Condition
Standard buildings are needed to confirm the variation of energy consumption of a building
according to the variation of shading. The standard building was not defined in Korea but this study
referenced the standard building in previous research results. The standard building in this study
references “The Window Design Guideline for Energy-saving of Buildings” and uses “unit area”
as defined in the guideline. This method revealed the energy demand and the best way according to the
variation of the window elements at each orientation. The unit space in the standard buildings was
selected; the size of this unit space was 6 m × 4.5 m × 2.7 m. This size is the result of research that
considered the average commercial building by an analysis of various buildings. The gap between the
columns of the building was 6 m, the depth to the considered environment of light was 4.5 m, and the
height of the room was 2.7 m [2]. Figure 2 presents a model of the standard building.

Energies 2015, 8 1491
Figure 2. Schematic diagram of standard building modeling.
This study used the simulation tool, COMFEN 4.1, by the Lawrence Berkeley National Laboratory
(LBNL, Berkeley, CA, USA) and simulated standard modeling. This tool is a façade design tool
based on the Energy Plus engine and provides a systematic evaluation of various elevations.
The Energy Plus engine is normally used to confirm the heating and cooling load in buildings.
Many studies confirmed the accuracy of the algorithm for the daylighting analysis method [15,16].
COMFEN 4.1 can model the fenestration façade according to the number of windows, size, location,
glazing, frame, and outside shading. The façade can select the daylight controls and has the option of
orientating the buildings. The annual energy consumption (heating, cooling, fan, and lighting) and
peak energy were analyzed by comparing the charts [17]. Table 2 lists the simulation conditions and
Figure 3 presents the schedule.
Table 2. Simulation conditions.
Section Contents
Heating, Ventilation, Air Conditioning Packaged Single Zone Temperature Set point Cooling: 24 °C, Heating: 21 °C
Lighting/Equipment Load 16 W/m2/10 W/m2 People 3 people
U-Value of façade wall 0.4 W/m2·K Simulation period Annual
Figure 3. Simulation schedule.

Energies 2015, 8 1492
3. Analysis of the Heating and Cooling Load with Horizontal Shading
3.1. Variation of Heating and Cooling Load with the Installation of Horizontal Shading
This study examined the heating and cooling load of buildings according to the horizontal exterior
shading installation. The annual heating and cooling load of a building with non-shading and
horizontal exterior shading were compared. The performance of the window was the level of
regulation. The SHGC, WWR and shading length were not proposed standards in the regulation,
therefore, this study referenced previous studies [2]. Table 3 lists the simulation parameters. Figure 4
shows the window area and position according to each WWR. This study used the weather data for
Seoul in Korea. Seoul is located in the Northern Hemisphere, altitude 37.3° and longitude 127°. The weather data was provided from the Korean Solar Energy Society [18]. In addition, the data from
previous research was used. The length of horizontal shading was calculated using Equation (1),
which used latitude 37.3° for Seoul.
Table 3. Simulation parameter.
Section Contents
Orientation East/West/South/North
WWR 20%/40%/60%/80%
Window Type – Type 1 Type 2 Type 3 Type 4
U-Value (W/m2·K) 1.8 1.8 2.1 2.1 SHGC 0.4 0.6 0.4 0.6
Shading WWR 20% 40% 60% 80%
P = Length (m) 0.35 0.5 0.55 0.6
Figure 4. Simulation modeling by WWR.
This study confirmed the simulation result of the south façade according to the horizontal shading
installation. In the case of WWR 20%, the energy consumption of non-shading was 79–87 kWh/m2·y
and the energy consumption by horizontal shading installation was 78–80 kWh/m2·y. In the case of
40%, the energy consumption of non-shading was 93–111 kWh/m2·y and the energy consumption by
horizontal shading installation was 86–96 kWh/m2·y. In the case of 60%, the energy consumption of
non-shading was 106–137 kWh/m2·y and the energy consumption by horizontal shading installation

Energies 2015, 8 1493
was 94–112 kWh/m2·y. Finally, in the case of 80%, the energy consumption of non-shading
was 122–165 kWh/m2·y and the energy consumption by horizontal shading installation was
104–129 kWh/m2·y. From the results, this study confirmed an energy saving of 9% by the installation
of horizontal shading in the case of WWR = 40%. The energy saving was 22% by the installation of
horizontal shading in the case of WWR = 80%. Figure 5 shows the variation of the heating and cooling
load by shading installation on the south façade.
Figure 5. Variation of the heating & cooling load according to the shading installation
(south façade).
Figure 6. Energy consumption saving ratio by WWR and orientation.
This study confirmed the saving ratio for all orientation façades using type 4 glazing, and
installation of horizontal shading. The length of horizontal shading was regulation level (0.6 m). In the
case of the south façade, the energy consumption savings increased steadily with increasing WWR.
The maximum saving was 22% at WWR = 80%. In case of the west and east façades, this study
confirmed the maximum 10% energy saving at WWR = 80%. On the other hand, in the case of the
WWR(%)
20 40 60 80
En
erg
y C
on
sum
pti
on
Sav
ing
Rat
io (
%)
-10
0
10
20
30EASTWESTSOUTHNORTH

Energies 2015, 8 1494
north façade, there were no energy consumption savings at WWR < 40%. In addition, in the case of
WWR = 60% and 80%, the energy consumption saving was only 1%. This means that to reduce energy
consumption, the installation of horizontal shading on the south façade is recommended. Figure 6
shows the energy consumption saving ratio according to the WWR and orientation.
3.2. Variation of the Heating and Cooling Load by the Length of Horizontal Shading
The regulations of Korea propose a minimum length (P) of horizontal shading. The length of
horizontal shading in the exterior was calculated using Equation (1). The length was affected by the
window height (H) and the latitude of Seoul, but the regulation does not explain the reference of the
length of shading. This study confirmed the variation of the heating and cooling load by changing the
length of horizontal shading, as listed in Table 4. The length of horizontal shading was changed to 50%
from 200%, WWR = 60%, the performance of window was U-value = 2.1 (W/m2·K) and SHGC = 0.6.
Figure 7 shows the energy consumption ratio variation of the heating and cooling load by the
orientation and length.
Table 4. Simulation parameter and case.
Section Contents
Orientation East/West/South/North
WWR 60%
(W:5 m, H:1.94 m)
Window Performance
U-Value (W/m2·K) 2.1 SHGC 0.6
Shading P (m) H/tanA = 1.94/tan(90 − 37.3 + 23.5) = 0.48 ≈ 0.5
CASE Ratio (%) 50 100 150 200
Length (m) 0.25 0.5 0.75 1
Figure 7. Ratio variation of the heating and cooling load with shading length.

Energies 2015, 8 1495
The results of WWR = 60% and various lengths of shading confirmed the heating and cooling load
dependence on the orientation and length of shading. The energy consumption ratio is all the
orientation façades based on the installation of horizontal shading of 0.5 m. In the case of the east
façade, the energy consumption was 150 kWh/m2·y after the installation of horizontal shading. That
length of shading was 0.5 m, which is the level of the regulation. The energy consumption was
139 kWh/m2·y when the length was 200% (1 m). The energy consumption savings in that case is 7%.
In the case of the west façade, the energy consumption was 142 kWh/m2·y with a length of 100%
(0.5 m). The energy consumption was 154 kWh/m2·y at a length of 200% (1 m). That case saved 8%
energy consumption. In the case of the south façade, the energy consumption was 112 kWh/m2·y at a
length of 100% (0.5 m). The energy consumption was 97 kWh/m2·y for a length of 200% (1 m). That
case saved 13% of energy consumption. In the case of the north façade, the energy consumption was
111 kWh/m2·y at a length of 100% (0.5 m). The energy consumption was 109 kWh/m2·y for a length
of 200% (1 m). That case saved 2% of energy consumption. This means that the length of shading
needs to be longer than the proposed regulation length to improve the energy savings. When the length
of shading was less than 100% (0.5 m), the energy consumption ratio increased in all cases. This study
confirmed that the heating and cooling load decreased with a length longer than the length of the
regulation. The South façade showed the most effective energy savings for an extended shading length.
3.3. Analysis of the Heating and Cooling Load Variation with the SHGC and Shading
From the amount of heat gain from the window, the SHGC of the window affects the heating and
cooling load. This study confirmed the variation of the heating and cooling loads according to various
SHGC values and horizontal shading. In addition, this study found a correlation between the SHGC
and shading. For the analysis, the WWR was fixed at 60%, the U-value of the glazing was 2.1 W/m2·K
and the length of horizontal shading was 0.5 m. Those conditions are the same as those listed in Table 3.
From the results of the simulation, in the case of the east façade, the use of the regulation horizontal
shading length and changing SHGC from 0.2 to 0.75 resulted in an increase in energy consumption
from 109 to 150 kWh/m2·y. In the case of the west façade, the energy consumption was increased from
a 107 to 149 kWh/m2·y after changing the SHGC from 0.2 to 0.75. A 37% (east) 39% (west) increase
in the heating and cooling load was observed by increasing SHGC. Figure 8 shows the variation of
heating and cooling load with SHGC. This means that horizontal shading does not affect the energy
consumption in the case of the east and west façades. In the case of the south façade, however, the
energy consumption was not increased by changing the SHGC from 0.2 to 0.75. From 0.2 to
0.4 SHGC, the energy consumption showed a tendency to increase from 97 to 109 kWh/m2·y, which is
approximately a 12% increase. On the other hand, from 0.4 to 0.75 SHGC, the energy consumption
showed a tendency to decrease from 109 to 105 kWh/m2·y, which is approximately a 3% decrease.
This shows that a high SHGC and horizontal shading resulted in less energy consumption than at a low
SHGC. This study confirmed the correlation between the horizontal shading and SHGC. In the case of
the north façade, energy consumption was increased from 103 to 125 kWh/m2·y by changing the
SHGC from 0.2 to 0.4. On the other hand, from 0.4 to 0.75 SHGC, the energy consumption changed
only slightly, 124–125 kWh/m2·y. At SHGC > 0.4, in the case of the north façade, the horizontal
shading had a slight effect on the energy consumption.

Energies 2015, 8 1496
Figure 8. Variation of heating and cooling load with the SHGC.
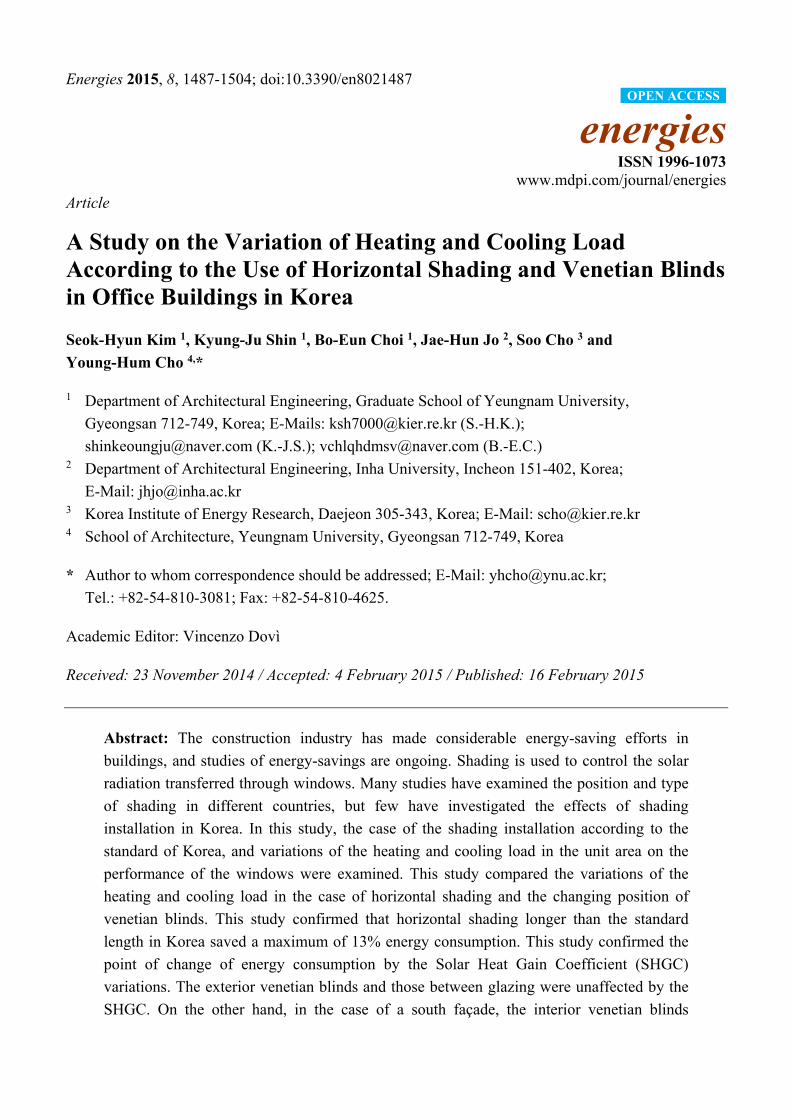
4. Analysis of the Heating and Cooling Load According to the Type of Venetian Blind
The Building Energy Conservation in Korea has proposed the position of shading. The guidelines
for the venetian blind position vary. To confirm the variation of the heating and cooling load with
venetian blinds, this study compared the case of horizontal shading with the case of the various
venetian blind positions. The angle of the venetian blind was 45°. This study used the venetian blind
types of the interior position/between glazing position/exterior position. Table 5 lists the simulation
case and venetian blind type. Figure 9 shows the type of shading. In the case of WWR 60% and 80%,
and SHGC 0.4 and 0.6 of the window, this study confirmed the heating and cooling load of a standard
building. Table 6 lists the results of the simulation.
Table 5. Simulation parameter and details of various shading.
Section Contents
Orientation East/West/South/North
WWR
Window Performance U-Value 2.1 SHGC 0.4/0.6
CASE
Horizontal Shading
WWR (%) 60 80 Length (m) 0.55 0.6
Venetian Blind
Position Angle
(°) Width of slat
(mm) Spacing
(mm) Thickness
(mm)
Exterior 45
76.96 70.1 1.02 Between glazing 4 7.62
Interior 25.4 20.07
SHGC
0.20 0.40 0.60 0.74
Hea
tin
g &
Co
olin
g L
oad
(kW
h/m
2 yr)
90
100
110
120
130
140
150
160EASTWESTSOUTHNORTH
Energies 2015, 8 1497
Figure 9. Type of shading and venetian blinds.
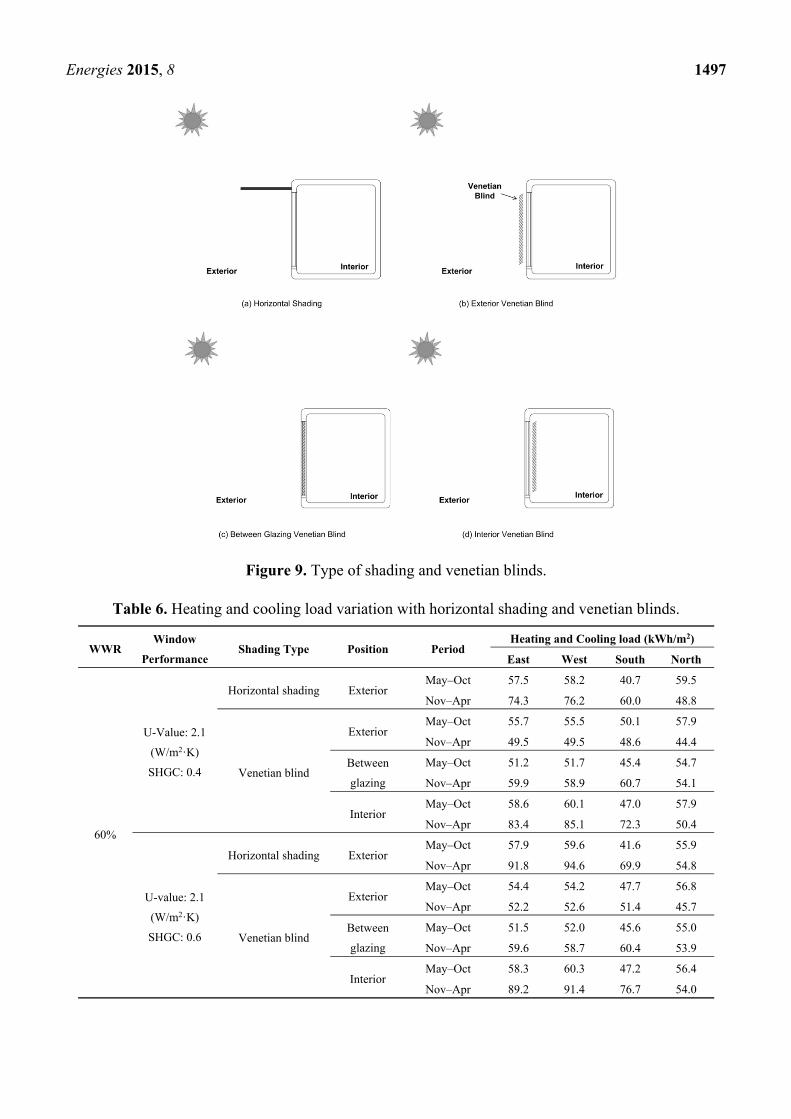
Table 6. Heating and cooling load variation with horizontal shading and venetian blinds.
WWR Window
Performance Shading Type Position Period
Heating and Cooling load (kWh/m2)
East West South North
60%
U-Value: 2.1
(W/m2·K)
SHGC: 0.4
Horizontal shading Exterior May–Oct 57.5 58.2 40.7 59.5
Nov–Apr 74.3 76.2 60.0 48.8
Venetian blind
Exterior May–Oct 55.7 55.5 50.1 57.9
Nov–Apr 49.5 49.5 48.6 44.4
Between
glazing
May–Oct 51.2 51.7 45.4 54.7
Nov–Apr 59.9 58.9 60.7 54.1
Interior May–Oct 58.6 60.1 47.0 57.9
Nov–Apr 83.4 85.1 72.3 50.4
U-value: 2.1
(W/m2·K)
SHGC: 0.6
Horizontal shading Exterior May–Oct 57.9 59.6 41.6 55.9
Nov–Apr 91.8 94.6 69.9 54.8
Venetian blind
Exterior May–Oct 54.4 54.2 47.7 56.8
Nov–Apr 52.2 52.6 51.4 45.7
Between
glazing
May–Oct 51.5 52.0 45.6 55.0
Nov–Apr 59.6 58.7 60.4 53.9
Interior May–Oct 58.3 60.3 47.2 56.4
Nov–Apr 89.2 91.4 76.7 54.0

Energies 2015, 8 1498
Table 6. Cont.
WWR Window
Performance Shading Type Position Period
Heating and Cooling load (kWh/m2)
East West South North
80%
U-value: 2.1
(W/m2·K)
SHGC: 0.4
Horizontal shading Exterior May–Oct 66.1 67.5 46.6 68.8
Nov–Apr 85.7 88.2 66.0 51.7
Venetian blind
Exterior May–Oct 64.0 63.8 57.1 66.9
Nov–Apr 51.7 52.2 50.7 44.4
Between
glazing
May–Oct 58.0 58.9 51.0 62.4
Nov–Apr 65.1 64.4 66.4 58.3
Interior May–Oct 68.6 71.1 56.3 67.1
Nov–Apr 98.2 100.4 82.9 54.3
U-value: 2.1
(W/m2·K)
SHGC: 0.6
Horizontal shading Exterior May–Oct 68.1 70.9 50.3 64.1
Nov–Apr 109.3 113.2 79.1 59.1
Venetian blind
Exterior May–Oct 62.1 62.0 53.9 65.3
Nov–Apr 55.3 56.2 54.4 46.1
Between
glazing
May–Oct 58.4 59.2 51.4 62.8
Nov–Apr 64.7 64.0 66.1 58.0
Interior May–Oct 68.9 72.0 57.7 65.1
Nov–Apr 105.8 109.2 88.8 58.3
In case of WWR = 60% and SHGC = 0.4, the case of south façade, the energy consumption was
decreased by 2% using the exterior venetian blind installation compared to horizontal shading
installation. The energy consumption was increased 5% and 18% by between glazing and interior
venetian blind installation, respectively, compared to horizontal shading installation. In the case of the
east façade, the energy consumption was decreased 20% and 16% by exterior venetian blinds and
between glazing venetian blind installation, respectively, compared to horizontal shading installation.
The energy consumption was increased 8% by interior venetian blind installation compared to horizontal
shading installation. In addition, in the case of the west façade, the energy consumption was decreased
22% and 18% by exterior venetian blinds and between glazing venetian blind installation, respectively,
compared to horizontal shading installation. The energy consumption was increased 8% by interior
venetian blind installation compared to horizontal shading installation. In the case of the north façade,
the energy consumption was decreased 6% by exterior venetian blind installation compared to
horizontal shading installation. The energy consumption was increased 1% by between glazing
venetian blind installation compared to horizontal shading installation. In the case of interior venetian
blind installation, the energy consumption was the same as case of horizontal shading installation.
At WWR = 60% and SHGC = 0.6, in the case of the south façade, the energy consumption was
decreased 11% and 5% by exterior venetian blind and between glazing venetian blind installation
compared to horizontal shading installation. The energy consumption was increased 11% by interior
venetian blind installation compared to horizontal shading installation. In the case of the east façade,
the energy consumption was decreased 29%, 26% and 1% by exterior venetian blind, between glazing
venetian blind and interior venetian blind installation, respectively, compared to horizontal shading
installation. In addition, in the case of the west façade, the energy consumption was decreased 31%,
28% and 2% by exterior venetian blind, between glazing venetian blind and interior venetian blind

Energies 2015, 8 1499
installation, respectively, compared to horizontal shading installation. In the case of the north façade,
the energy consumption was decreased 7% and 2% by exterior venetian blind and between glazing
venetian blind installation, respectively, compared to horizontal shading installation. In the case of
interior venetian blind installation, the energy consumption was the same as that of horizontal
shading installation.
At WWR = 80% and SHGC = 0.4, in the case of the south façade, the energy consumption was
decreased 4% by exterior venetian blind installation compared to the case of horizontal shading
installation. The energy consumption was increased 4% and 24% by between glazing and interior
venetian blind installation, respectively, compared to horizontal shading installation. In the case of the
east façade, the energy consumption was decreased 24% and 19% by exterior venetian blind and
between glazing venetian blind installation, respectively, compared to horizontal shading installation.
The energy consumption was increased 10% by interior venetian blind installation compared to
horizontal shading installation. In the case of the west façade, the energy consumption was decreased
26% and 21% by exterior venetian blind and between glazing venetian blind installation, respectively,
compared to horizontal shading installation. The energy consumption was increased 10% by interior
venetian blind installation compared to horizontal shading installation. In the case of the north façade,
the energy consumption was decreased 8% by exterior venetian blind installation compared to horizontal
shading installation. In the case of between glazing venetian blind installation, the energy consumption
was the same as that of horizontal shading installation. On the other hand, the energy consumption was
increased 1% by interior venetian blind installation compared to horizontal shading installation.
At WWR = 80% and SHGC = 0.6, in the case of the south façade, the energy consumption was
decreased 16% and 9% by exterior venetian blind and between glazing venetian blind installation,
respectively, compared to horizontal shading installation. The energy consumption was increased 13%
by interior venetian blind installation compared to horizontal shading installation. In the case of the
east façade, the energy consumption was decreased 34%, 31% and 2% by exterior venetian blind,
between glazing venetian blind and interior venetian blind installation, respectively, compared to
horizontal shading installation. In the case of the west façade, the energy consumption was decreased
36%, 33% and 2% by exterior venetian blind, between glazing venetian blind and interior venetian
blind installation, respectively, compared to horizontal shading installation. In the case of the north
façade, the energy consumption was decreased 10% and 2% by exterior venetian blind and between
glazing venetian blind installation, respectively compared to horizontal shading installation. In the case
of interior venetian blind installation, the energy consumption was the same as that of horizontal
shading installation. Figures 10–13 shows the saving ratio of heating and cooling energy consumption
according to the type of shading. The result of the simulation showed generally low energy
consumption in the case of the south façade. In the case of the north façade, the simulation showed
little change. At WWR = 80% and SHGC = 0.6, the heating energy consumption was increased
11%–170% by exterior venetian blinds compared to horizontal shading. At WWR = 60% and
SHGC = 0.4, the heating energy consumption was increased 8%–161% by exterior venetian blinds
compared to horizontal shading. That reason for this is that venetian blinds tended to block more solar
radiation in the winter season than horizontal shading.

Energies 2015, 8 1500
Figure 10. Saving ratio of heating and cooling load according to the type of shading
(WWR 60%, U-value: 2.1, SHGC: 0.4).
Figure 11. Saving ratio of heating and cooling load according to the type of shading
(WWR 60%, U-value: 2.1, SHGC: 0.6).

Energies 2015, 8 1501
Figure 12. Saving ratio of the heating and cooling load according to the type of shading
(WWR 80%, U-value: 2.1, SHGC: 0.4).
Figure 13. Saving ratio of the heating and cooling load according to the type of shading
(WWR 80%, U-value: 2.1, SHGC: 0.6).

Energies 2015, 8 1502
In the case of the south façade, the interior venetian blind resulted in higher heating and cooling
energy consumption because the heating load was increased by blocked solar radiation in winter.
At WWR = 80%, the exterior venetian blind saved 4%–36% of the heating and cooling load than the
horizontal shading. This means that the exterior venetian blind was more efficient at saving energy
than horizontal shading in a large WWR. In the case of the east and west façades, the exterior venetian
blinds and between glazing venetian blinds improved energy consumption compared to horizontal
shading. The maximum saving ratio was 36% at WWR = 80%, exterior venetian blind and west
façade. In the case of the east and west façades, the exterior venetian blind and between glazing
venetian blind is more efficient than horizontal shading. Shading the north façade had little or no effect
on heating and cooling load regardless of the type of shading.
5. Conclusions
This study confirmed the annual heating and cooling load of a standard building by simulation
modeling. The results of this study are as follows:
(1) In the case of horizontal shading installation, the heating and cooling load was lower than the
case of no shading. The decrease in the heating and cooling load was most efficient in the south
façade. Horizontal shading installation reduced the heating and cooling load by a maximum of 22% in
the case of type 4 and WWR = 80%.
(2) Extended horizontal shading (1 m) compared to the regulation level (0.5 m) reduced the heating
and cooling load. In the case of extending the length of horizontal shading, the south façade showed a
maximum 13% decrease in heating and cooling load.
(3) This study confirmed the variation of heating and cooling load by the variation of the SHGC.
In case of the south and north façades, the heating and cooling load was decreased at SHGC = 0.4.
This means that the high SHGC and horizontal shading is more efficient in energy savings than the
case of a low SHGC and horizontal shading.
(4) A comparison of horizontal shading with various venetian blind types showed that in the case of
the west façade, the energy consumption was decreased 36% by exterior venetian blind installation
compared to the case of horizontal shading installation.
The exterior venetian blinds and between glazing were unaffected by the SHGC. The exterior
venetian blind was more effective in reducing the heating and cooling load than horizontal shading.
In addition, the heating and cooling load of the interior venetian blind was higher than that of
horizontal shading. From the results of this study, our next study will develop indicators and
guidelines for the shading choice. These indicators or the guidelines for the shading design will be
proposed to a designer.
Acknowledgments
This work was supported by the 2014 Yeungnam University Research Grant (214A380044).

Energies 2015, 8 1503
Author Contributions
All authors contributed to this work. Seok-Hyun Kim performed the result analysis of simulation
and wrote the major part of this article. Kyung-Ju Shin and Bo-Eun Choi conducted the energy
simulation. Jae-Hun Jo proposed the case of the energy simulation and conducted data analysis.
Soo Cho performed the result discussion and gave technical support. Young-Hum Cho was responsible
for this article and gave conceptual advice.
Conflicts of Interest
The authors declare no conflict of interest.
References
1. Kim, S.H.; Kim, S.S.; Kim, K.W.; Cho, Y.H. Analysis of the energy consumption of window
elements through simulation. Korea J. Archit. Instit. Spring Conf. 2013, 33, 261–262. (In Korean)
2. Kim, S.H.; Kim, S.S.; Kim, K.W.; Cho, Y.H. A study on the proposes of energy analysis indicator
by the window elements of office buildings in Korea. Energy Build. 2014, 73, 153–165.
3. Nielsen, T.R.; Duer, K.; Svendsen, S. Energy performance of glazings and windows. Solar Energy
2000, 69, 137–143.
4. Carlos, E.O.; Myriam, B.C.A.; Evert, J.L.; Jan, L.M.H. Considerations on design optimization
criteria for windows providing low energy consumption and high visual comfort. Appl. Energy
2012, 95, 238–245.
5. Perssona, M.L.; Roosa, A.; Wall, M. Influence of window size on the energy balance of low
energy houses. Energy Build. 2006, 38, 181–188.
6. Kim, B.S.; Kim, K.H. A study on thermal environment and the design methods to save energy in
small glass-skin commercial buildings. J. Asian Archit. Build. Eng. 2004, 3, 115–123.
7. Leigh, S.B.; Bae, J.I.; Ryu, Y.H. A study on cooling energy savings potential in high-rise
residential complex using cross ventilated double skin façade. J. Asian Archit. Build. Eng. 2004,
3, 275–282.
8. Seok, H.T.; Jo, J.H.; Kim, K.W. Establishing the design process of double-skin façade elements
through design parameter analysis. J. Asian Archit. Build. Eng. 2009, 8, 251–258.
9. Ossen, D.R.; Hohd, H.A.; Mardros, N.H. Optimum overhang geometry for building energy saving
in tropical climates. J. Asian Archit. Build. Eng. 2005, 4, 563–570.
10. Lai, C.M.; Wang, Y.H. Energy-saving potential of building envelope designs in residential houses
in Taiwan. Energies 2011, 4, 2061–2076.
11. Kang, H.J.; Rhee, E.K. Development of a sustainable design guideline for a school building in the
early design stage. J. Asian Archit. Build. Eng. 2014, 13, 467–474.
12. Ministry of Land, Transport and Maritime Affairs. Building Energy Conservation Design Standard.
Available online: http://www.molit.go.kr/ (accessed on 9 February 2015). (In Korean)
13. Ministry of Land, Transport and Maritime Affairs. Ministry of Environment, Green Building
Certification Criteria. Available online: http://www.molit.go.kr/ (accessed on 9 February 2015).
(In Korean)

Energies 2015, 8 1504
14. Ministry of Land, Transport and Maritime Affairs. The Window Design Guide-line for
Energy-saving of Buildings. Available online: http://www.molit.go.kr/ (accessed on 9 February 2015).
(In Korean)
15. Yoon, Y.B.; Jeong, W.R.; Lee, K.H. Window material daylighting performance assessment
algorithm: Comparing radiosity and split-flux methods. Energies 2014, 7, 2362–2376.
16. Yoon, Y.B.; Manandhar, R.; Lee, K.H. Comparative study of two daylighting analysis methods
with regard to window orientation and interior wall reflectance. Energies 2014, 7, 5825–5846.
17. Lawrence Berkeley National Laboratory, COMFEN. Available online: http://lbl.gov/ (accessed on
9 February 2015).
18. The Korean Solar Energy Solar Energy Society. Available online: http://kses.re.kr/ (accessed on
9 February 2015). (In Korean)
© 2015 by the authors; licensee MDPI, Basel, Switzerland. This article is an open access article
distributed under the terms and conditions of the Creative Commons Attribution license
(http://creativecommons.org/licenses/by/4.0/).
Recommended