A STUDY ON THE SIMULTANEOUS NITRIFICATION AND DENITRIFICATION PROCESS OF A MEMBRANE AERATED BIOREACTOR
AUGMENTED BY BIOWISH® AQUA
A Thesis
presented to
the Faculty of California Polytechnic State University,
San Luis Obispo
In Partial Fulfillment
of the Requirements for the Degree
Master of Science in Civil and Environmental Engineering
by
Gavrielle Orman
December 2019

ii
© 2019
Gavrielle Orman
ALL RIGHTS RESERVED

iii
COMMITTEE MEMBERSHIP
TITLE: A Study on the Simultaneous Nitrification and Denitrification Process of a Membrane Aerated Bioreactor Augmented by BiOWiSH® Aqua
AUTHOR: Gavrielle Orman
DATE SUBMITTED: December 2019
COMMITTEE CHAIR: Nirupam Pal, Ph.D. Professor of Environmental Engineering
COMMITTEE MEMBER: Rebekah Oulton, Ph.D. Professor of Environmental Engineering
COMMITTEE MEMBER: Amr El Badawy, Ph.D. Professor of Environmental Engineering
COMMITTEE MEMBER: Christopher Kitts, Ph.D. Director of Cal Poly Center for Applications in Biotechnology
iv
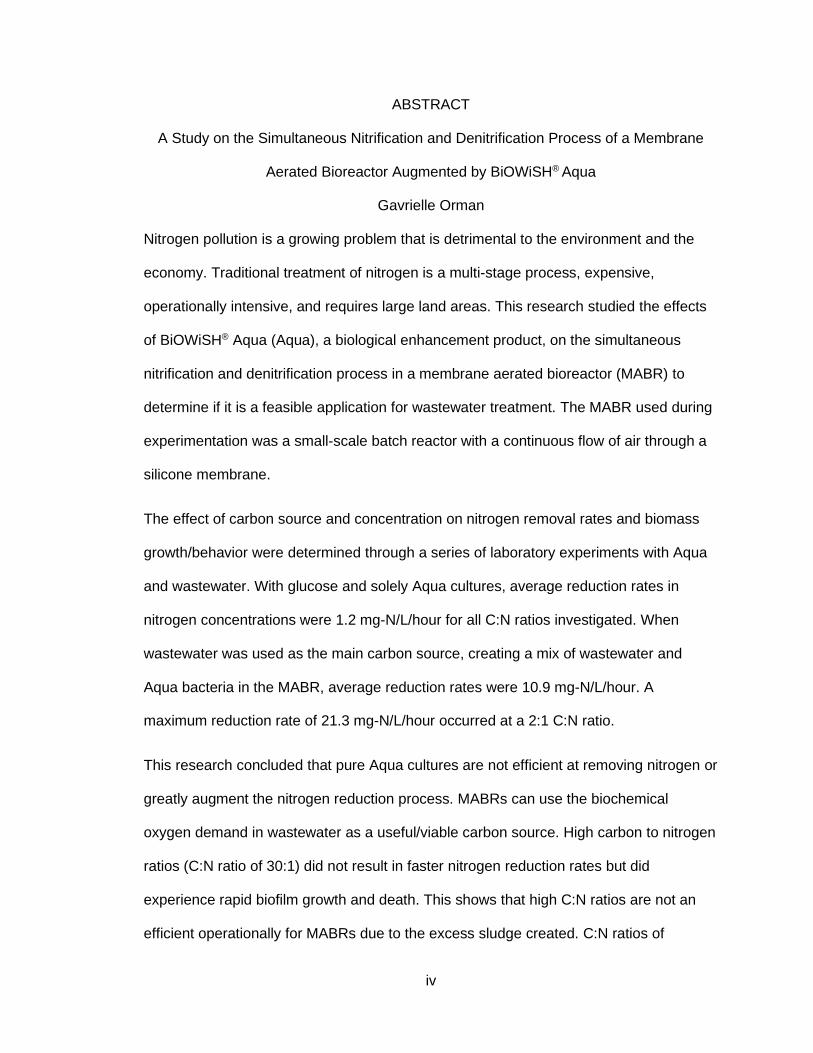
ABSTRACT
A Study on the Simultaneous Nitrification and Denitrification Process of a Membrane
Aerated Bioreactor Augmented by BiOWiSH® Aqua
Gavrielle Orman
Nitrogen pollution is a growing problem that is detrimental to the environment and the
economy. Traditional treatment of nitrogen is a multi-stage process, expensive,
operationally intensive, and requires large land areas. This research studied the effects
of BiOWiSH® Aqua (Aqua), a biological enhancement product, on the simultaneous
nitrification and denitrification process in a membrane aerated bioreactor (MABR) to
determine if it is a feasible application for wastewater treatment. The MABR used during
experimentation was a small-scale batch reactor with a continuous flow of air through a
silicone membrane.
The effect of carbon source and concentration on nitrogen removal rates and biomass
growth/behavior were determined through a series of laboratory experiments with Aqua
and wastewater. With glucose and solely Aqua cultures, average reduction rates in
nitrogen concentrations were 1.2 mg-N/L/hour for all C:N ratios investigated. When
wastewater was used as the main carbon source, creating a mix of wastewater and
Aqua bacteria in the MABR, average reduction rates were 10.9 mg-N/L/hour. A
maximum reduction rate of 21.3 mg-N/L/hour occurred at a 2:1 C:N ratio.
This research concluded that pure Aqua cultures are not efficient at removing nitrogen or
greatly augment the nitrogen reduction process. MABRs can use the biochemical
oxygen demand in wastewater as a useful/viable carbon source. High carbon to nitrogen
ratios (C:N ratio of 30:1) did not result in faster nitrogen reduction rates but did
experience rapid biofilm growth and death. This shows that high C:N ratios are not an
efficient operationally for MABRs due to the excess sludge created. C:N ratios of

v
approximately 3:1 provided the most consistent nitrogen reduction for both glucose and
wastewater. This research concluded that C:N ratios, pH, and oxygen diffusion heavily
affect the MABR’s performance. In addition, MABRs can utilize low C:N ratios during
treatment, particularly during the treatment of high-strength wastewater.
Keywords: Membrane Aerated Bioreactor, Biological Nutrient Removal, Wastewater

vi
ACKNOWLEDGMENTS
There aren’t words to properly explain how thankful I am for every person that has
helped me through this research and process, but I will try. A large thank you to Dr. Pal
for being my advisor. You guided me through how to design experiments, how to run
analytical methods, and never failed to be encouraging when the research or the results
were difficult to process. Another large thank you to BiOWiSH for funding this research
and giving advice on what pathway to follow when I got stuck.
I want to thank the rest of my committee for the moral support and encouragement they
provided me with. Dr. Oulton and Dr. El Badawy always took time to hear my thoughts
and ease my fears or concerns. Thank you to Dr. Kitts who helped me understand the
microbiology side of this research.
Through this process, multiple undergraduates and research assistants from the
environmental engineering department, the biology department, and the microbiology
department assisted me. Thank you for the extra hands, the hours of training, and the
laughter. Your help allowed me to leave the lab every once in awhile, which is very
appreciated.
Finally, thank you to my friends and my parents. Every single one of you brought me
food, kept me company, and listened to my ranting. The late nights in the lab were made
bearable with your company. I would not have been able to finish this research, write this
thesis, or do any of the analysis without the support you all provided. I could never thank
you all enough.
This project would not have been possible without the people I’m surrounded by. Thank
you. I am forever appreciative.

vii
TABLE OF CONTENTS
Page
LIST OF TABLES .......................................................................................................... xii
LIST OF FIGURES ....................................................................................................... xiii
CHAPTER
Chapter 1 – Introduction ................................................................................................. 1
1.1 Nitrogen Pollution .................................................................................................. 1
1.2 Regulations for Nitrogen ....................................................................................... 2
1.3 Current Treatment Methods .................................................................................. 3
1.4 Focus of this Research ......................................................................................... 5
1.5 Objectives of this Research ................................................................................... 6
Chapter 2 - Literature Review ......................................................................................... 7
2.1 The Nitrogen Cycle ............................................................................................... 7
2.1.1 Nitrification ...................................................................................................... 8
2.1.2 Denitrification .................................................................................................. 9
2.1.3 Assimilation ...................................................................................................11
2.2 Conventional Wastewater Treatment ...................................................................11
2.3 Simultaneous Nitrification and Denitrification........................................................15
2.3.1 Simultaneous Nitrification and Denitrification Mechanisms ............................16
2.4 Membrane Aerated Bioreactor .............................................................................18
2.4.1 Biofilms ..........................................................................................................21

viii
2.4.2 Oxygen Diffusivity with a Silicone Membrane ................................................22
2.5 BiOWiSH ..............................................................................................................23
2.5.1 BiOWiSH Case Studies .................................................................................25
2.6 Previous Research ...............................................................................................26
Chapter 3 - System Design ............................................................................................27
3.1 Membrane Aerated Bioreactor Design .................................................................27
3.1.1 MABR A.........................................................................................................28
3.1.2 MABR B.........................................................................................................29
3.1.3 MABR C ........................................................................................................30
3.2 Activated Sludge Bioreactor Design .....................................................................30
3.3 Airline Configuration .............................................................................................31
3.4 Growth Media Constituents ..................................................................................32
3.4.1 Buffer .............................................................................................................32
3.4.2 Micronutrients ................................................................................................33
3.5 Aqua Dosing Methods ..........................................................................................34
3.6 Carbon Sources and Dosing Techniques .............................................................34
Chapter 4 – System Experimentation and Implementation ............................................36
4.1 Experimental Methods .........................................................................................36
4.1.1 Bioreactor Design ..........................................................................................36
4.1.2 Sampling and Storage Methods .....................................................................37
4.1.3 Sample Preparation .......................................................................................38

ix
4.1.4 Quality Assurance and Quality Control ..........................................................38
4.1.5 Ammonia Analysis .........................................................................................40
4.1.6 Nitrate and Nitrite Analysis.............................................................................40
4.1.7 Total Nitrogen Analysis ..................................................................................42
4.1.8 Microbiology methods ....................................................................................42
4.2 Experiments .........................................................................................................43
4.2.1 Experiment 1 – Functionality ..........................................................................44
4.2.2 Experiment 2 – Stabilization ..........................................................................44
4.2.3 Experiment 3 – Stabilization Continued .........................................................45
4.2.4 Experiment 4 – Stabilization Continued .........................................................45
4.2.5 Experiment 5 – No Carbon Source ................................................................45
4.2.6 Experiment 6 – No Carbon Source ................................................................45
4.2.7 Experiment 7 – Low Glucose Concentration ..................................................46
4.2.8 Experiment 8 – Large Glucose Concentration ...............................................46
4.2.9 Experiment 9 – Low Glucose Concentration Replicate ..................................47
4.2.10 Experiment 10 – Further Study on MABR B .................................................47
4.2.11 Experiment 11 – Wastewater as the Carbon Source ....................................48
4.2.12 Agar Plate Series .........................................................................................48
4.2.13 Experiment 12 – Increased Wastewater Ratio .............................................48
4.2.14 Ammonia Assimilation Screening Experiment ..............................................49
Chapter 5 - Evaluation and Discussion ..........................................................................50

x
5.1 Ammonia Assimilation Screening Experiment ......................................................52
5.2 Experiment 1 – Functionality Results ...................................................................54
5.3 Experiment 2 – Stabilization Results ....................................................................55
5.4 Experiment 3 – Stabilization Continued Results ...................................................58
5.5 Experiment 4 – Stabilization Continued Results ...................................................59
5.6 Experiment 5 and 6 – No Carbon Source Results ................................................60
5.7 Experiment 7 – Low Glucose Concentration Results ............................................62
5.8 Experiment 8 – Large Glucose Concentration Results .........................................65
5.9 Experiment 9 – Low Glucose Concentration Replicate Results ............................66
5.10 Experiment 10 – Further Study on MABR B Results ..........................................69
5.11 Experiment 11 – Wastewater as the Carbon Source Results .............................71
5.12 Plating Results ...................................................................................................77
5.13 Experiment 12 – Increased Wastewater Ratio Results .......................................77
5.14 Limiting Factors ..................................................................................................82
5.14.1 pH and Temperature Impacts ......................................................................82
5.14.2 Dissolved Oxygen ........................................................................................85
5.14.3 Carbon Source and Concentration ...............................................................87
5.14.4 Biofilm and Suspended Growth ...................................................................90
5.14.5 Experimental Methods .................................................................................93
Chapter 6 – Conclusion .................................................................................................94
6.1 Final Conclusions .................................................................................................94

xi
6.2 Proposed Improvements to Design ......................................................................97
6.3 Proposed Improvements to Experimental Methods ..............................................98
6.4 Future Work Recommendations ...........................................................................99
Works Cited ................................................................................................................. 101

xii
LIST OF TABLES
Table Page
2-1: Ammonia oxidation rates for isolated Aqua strains .................................................24
2-2: Nitrate reduction rates for isolated Aqua strains .....................................................24
3-1: Phosphorus buffer constituents and concentrations ...............................................33
3-2: Micronutrient concentrations in the growth media ...................................................34
3-3: Carbon source and C:N ratio for each experiment ..................................................35
4-1: Overview of key experiment parameters.................................................................43
5-1: Comparison of pH to nitrogen removal rates ..........................................................84
5-2: Carbon to Nitrogen Ratio Impacts on Nitrogen Removal Rates ..............................88
5-3: Growth Rate Kinetics Used in Calculations (Tchobanoglaus & et.al, 2013) ............91
5-4: Growth Rate Kinetics at Different C:N ratios ...........................................................92

xiii
LIST OF FIGURES
Figure Page
1-1: Aerial view of the SLO WRRF with the biological treatment systems
highlighted in red (Google Maps, 2018). .................................................................. 4
2-1: Typical pathways for natural nitrogen removal for TAN and nitrate. ......................... 8
2-2: The process flow for a pre-anoxic Ludzack-Ettinger biological treatment
system ....................................................................................................................12
2-3: The process flow for the modified Ludzak-Ettinger pre-anoxic process ..................13
2-4: The process flow for a single sludge process, which is post-anoxic ........................13
2-5: The process flow for the Bardenpho process. .........................................................14
2-6: Visualization of aerobic and anoxic zones within one sludge floc ...........................16
2-7: Schematic of the Orbal™ system ...........................................................................17
2-8: Schematic of a dead-end configuration MABR showing the ins and outs for
both air and wastewater. .........................................................................................18
2-9: Oxygen diffusion through the MABR membrane. Creation of aerobic and
anoxic zones within the biofilm with the bulk wastewater providing substrate. ........19
3-1: Schematic showing MABR to experiment connection .............................................27
3-2: Image of the MABR A set-up with thick-walled silicon tubing ..................................28
3-3: MABR B set-up for Experiments 7 through 12. .......................................................29
3-4: Activated sludge bioreactor with suspended growth. This set-up was a
control for the MABR. .............................................................................................30
3-4: Schematic of the airline set-up. ..............................................................................31
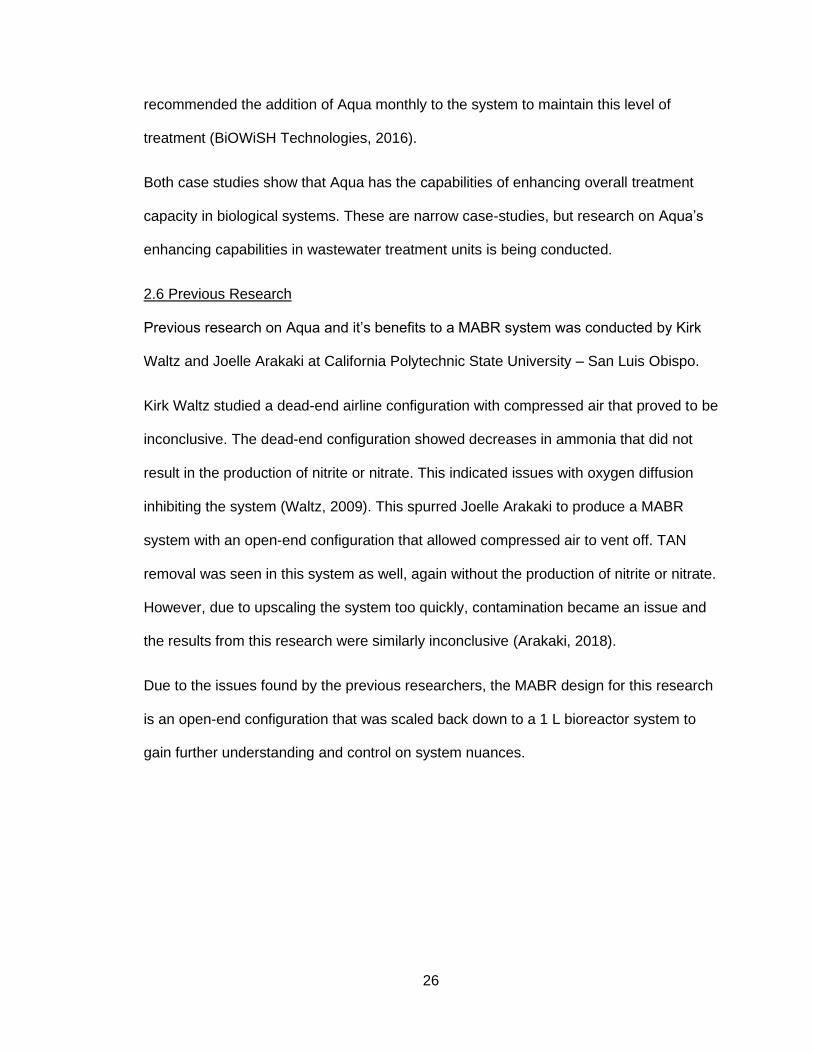
4-1: Steps involved in the IC’s ion analysis (ThermoScientific, 2012) ............................41
5-1(a): Schematic showing which MABR was used during each experiment .................50
5-1(b): Experiment Schematic .......................................................................................51
xiv
5-2: Results from the screening experiment ..................................................................53
5-3: Results from Experiment 1 conducted in MABR A. .................................................55
5-4: Results from Experiment 2. The first stage of stabilizing MABR A. .........................56
5-5: MABR A, showing turbidity and open spaces on the silicon membrane ..................57
5-6: Experiment 3’s results. 2nd stage in stabilizing MABR A .........................................58
5-7: Bubbles in MABR A during Experiment 3 indicating increased diffusion of
oxygen because nitrate was not removed from the system. ....................................59
5-8: MABR B during Experiment 5 showing bubble formation and sloughing of
biofilm. ....................................................................................................................61
5-9: Results for Experiment 7’s activated sludge control. ...............................................63
5-10: MABR B results from Experiment 7 ......................................................................64
5-11: Experiment 8 results using a 30:1 C:N ratio ..........................................................65
5-12: Results from Experiment 9 ...................................................................................67
5-13: Images of MABR B at hour 48 (Left) and hour 55 (right) .......................................68
5-14: Experiment 10 results ...........................................................................................70
5-15: Image of MABR B during Experiment 10 ..............................................................71
5-16: Results from MABR B during Experiment 11 ........................................................72
5-17: MABR C results from Experiment 11 ....................................................................73
5-18: TAN concentration comparison between MABR B and MABR C ..........................74
5-19: Nitrite comparison between MABR B and MABR C ..............................................75
5-20: Nitrate comparison between MABR B and MABR C .............................................76
5-21: MABR B (Left) and MABR C (Right) in Experiment 11 ..........................................77
5-22: MABR B results from Experiment 12 ....................................................................78
5-23: MABR C results from Experiment 12 ....................................................................79
5-24: Comparison of TAN concentrations in MABR B and MABR C ..............................80
5-25: Nitrite comparison for Experiment 12 between MABR B and MABR C .................81

xv
5-26: Nitrate comparison between MABR B and MABR C for Experiment 12 ................82

1
Chapter 1 – Introduction
Nitrogen is an essential nutrient to the growth of plants and other organisms
(Environmental Protection Agency, 2009). However, water quality degrades if excess
nitrogen is introduced. This is often an issue in rural areas when a lot of fertilizer is
applied to add nitrogen to the soil (approximately 0.45 kg of nitrogen per 1,000 square
feet). This balance of agricultural viability to water quality opens the door for public
health and environmental crises. Nitrogen comes in multiple forms, but often enters the
environment in the form of nitrates and ammonia (Environmental Protection Agency,
2019).
1.1 Nitrogen Pollution
Nitrogen is typically introduced to the environment from fertilizer use or high strength
wastewater from agricultural or industrial activities, making it a larger issue in rural areas
and in industrial areas (Summers, 2019). However, most domestic wastewater treatment
plants will discharge effluent to surface water bodies. Domestic wastewater in urban
areas has lower concentrations of nitrogen as the primary contributor is human waste.
Overloading the receiving waters with excess nitrogen (nutrient pollution) can cause
detrimental effects to the public, environment, and economy.
The most common result of nitrate pollution is eutrophication, the presence of large,
algal blooms (often toxic) in surface water bodies. These blooms deplete oxygen
availability in the water creating dead zones where little to no aquatic life can be
sustained (Environmental Protection Agency, 2019). Direct exposure to toxic algae can
result in neurological deficiencies for both fish and humans. Additionally, areas with high
nitrate concentrations in their drinking water have high infancy mortality rates due to
methemoglobin, colloquially known as blue baby syndrome (Environmental Protection
Agency, 2019). Economically, nitrate concentrations cause fishing industries to decline,

2
wastewater treatment to be more expensive, and can cause a loss of tourism due to
aesthetic decreases in public water bodies (Environmental Protection Agency, 2019).
Ammonia enters the environment through the decomposition of organic matter and
animal or human waste. Ammonia can either be found as ammonium (NH4+), which is
abundant, or unionized ammonia (NH3), which is more toxic. High levels of ammonia in
water leads to a toxic buildup in the internal tissues, organs, and the blood stream of fish
and other wildlife, often resulting in death (Hill, 2014). Ammonia pollution depletes food
supplies and can be detrimental to aquatic ecosystems.
1.2 Regulations for Nitrogen
Ammonia concentrations in raw domestic wastewater range from 14 to 40 mg-N/L
(Tchobanoglaus & et.al, 2013). Nitrate concentrations can range from 0 to 30 mg-N/L
depending on the source. Agricultural runoff or industrial wastewater discharges can
contribute to increased nitrate concentrations in the influent (Environmental Protection
Agency, 2019). The Clean Water Act allows the Environmental Protection Agency (EPA)
to approve state-wide programs for nutrient removal techniques and limits. The EPA set
a maximum contaminant limit (MCL) for nitrate of 10 mg-N/L, and most state programs
regulate their wastewater effluent to meet the MCL or lower to prevent surface water or
groundwater contamination (Environmental Protection Agency, 2009).
There is not a current MCL for ammonium, however, the EPA does recognize that
ammonium is toxic to aquatic life and has set an acute exposure limit of 17 mg-N/L and
chronic exposure limit of 1.9 mg-N/L (Environmental Protection Agency, 2013). This is
measured as total ammonia nitrogen (TAN) to capture both ammonium and ammonia
concentrations. Alongside the EPA limits for nitrate and ammonia, there is a push
towards sustainable living practices. This often includes water recycling for irrigation and

3
non-potable uses. As water recycling becomes more common-place, nitrogen limits are
likely to become more stringent to prevent contamination of groundwater tables.
1.3 Current Treatment Methods
Biological wastewater treatment has been the main nitrogen removal method for
decades. Research on biological treatment has grown drastically to try and meet stricter
limits and assuage growing concerns with nutrient pollution. Often, wastewater treatment
plants will use a return activated sludge (RAS) system or a biotower to remove organic
carbon in the form of biochemical oxygen demand (BOD). If operated at longer solids
retention times, these systems can remove nitrogen from the wastewater stream. An
example of this is the San Luis Obispo Water Resource and Recovery Facility (SLO
WRRF) which utilizes a biotower system and an aeration basin to convert TAN into
nitrate. The biotowers themselves remove up to 40% of the TAN, and the additional
aeration basin is required to finish the conversion (City of San Luis Obispo, 2015). Many
RAS systems and pond systems have anoxic zones, where the main source of oxygen
comes from nitrate, allowing for reduction of nitrate into nitrogen gas. However,
conventional systems are often operated to focus on BOD and TAN removal.
Wastewater treatment plants that aim to remove all nitrogen from the waste stream often
need a specific anoxic tank with multiple feed lines to efficiently achieve full nitrogen
removal (McCarty, 2018).
Aeration processes require large footprints and due to the need for redundancy, these
large systems can require acres of land by themselves. The SLO WRRF’s plant layout is
dominated by the biotowers, RAS system, and the secondary clarifiers required (Figure
1-1). While most treatment systems do not use two biological reactors like the SLO
WRRF, one aeration basin is still a large undertaking, and those treatment plants will
often require additional systems (such as filters) if they want to recycle the effluent. In

4
wastewater treatment plants that utilize an anoxic tank, this requires double the footprint
of a conventional aeration system, while potentially requiring further separation
processes as well (McCarty, 2018).
Figure 1-1: Aerial view of the SLO WRRF with the biological treatment systems
highlighted in red (Google Maps, 2018).
The current practice of multiple tank systems puts an undue burden on the municipalities
trying to treat their effluent to a high quality, particularly those aiming for recycled water
usage (Environmental Protection Agency, 2009). The expenses required for multiple
tanks, the maintenance, and the highly trained operators is often too costly to implement
for many cities or communities. The large footprint forces wastewater treatment plants to
be in remote locations, which can cause the sewer lateral connections to grow in price,
on-top of the overall pricing of land. This is especially true for smaller cities that do not
have the proper funding to sustain the large infrastructure or the operation and
maintenance of these conventional systems.

5
1.4 Focus of this Research
A potential solution to improve biological treatment is a membrane aerated bioreactor
(MABR). MABR systems utilize a membrane to diffuse oxygen throughout the system,
with that membrane also providing a growth location for biofilm. The biofilm provides a
significant barrier to oxygen diffusion through the bulk water, allowing for complete
nitrogen removal within the system (Terada & et.al, 2003). This means that an aerobic
zone develops on the biofilm membrane interface, and an anoxic zone develops on the
biofilm bulk water interface. This combined system of aerobic and anoxic treatment
would lower the land footprint by at least two-fold (General Electric Co's, 2017). MABRs
have the potential to lower energy costs by 75% due to the low-pressure requirements
and not needing to bubble oxygen through the whole tank (Williams, 2017). These
benefits mean MABRs are a potential solution to the concerns surrounding conventional
nitrogen removal methods in wastewater treatment.
Another potential way to improve biological treatment is to augment the microbial system
in a treatment unit with a commercially available product known as BiOWiSH® Aqua
(Aqua). Aqua supplements bacterial growth through a blend of bacterium and non-living
organic material. Aqua was designed to facilitate nitrogen removal in biological systems
by promoting growth of bacteria known to interact with the nitrogen cycle (BiOWiSH
Technologies, 2016). Multiple studies were performed on Aqua’s effects on natural water
bodies and proved successful. However, it has not been studied further in domestic
wastewater treatment, meaning Aqua’s implementation and effectiveness need to be
assessed. If Aqua can augment the nitrogen removal process in biological treatment, it
may provide an easier pathway for operators.
Previous research on the augmentation of the MABR with Aqua was performed by Joelle
Arakaki. That research focused on a preliminary understanding of Aqua dosing methods,

6
sampling and testing methods, growth media constituents, the viability of continuous flow
configurations for compressed air usage, and briefly touched on the effects of carbon
concentrations on nitrogen removal rates (Arakaki, 2018). This research produced
testing methods in the form of ion chromatography, TAN analysis with a Timberline, and
Hach total nitrogen kits. It proved that an Aqua dosing method of 1g inoculated outside
the system is most effective. The continuous flow configuration proved beneficial to the
system, proving that compressed air is a viable source of oxygen for the MABR system.
However, the research was inconclusive in terms of the effect of carbon concentrations
and did not prove conclusive on the actual effectiveness of Aqua as a biological
augmentation pathway. The previous research performed a few small-scale experiments
but was then scaled up to try and look at implementation on a larger scale. However,
there were too many unknowns and variables to make conclusive arguments on the
effects of Aqua in domestic wastewater treatment.
1.5 Objectives of this Research
The research discussed in this paper scaled the MABR down to a continuous airflow
configuration in a 1 L bioreactor. This scaled down MABR aims to make conclusions
about the nitrogen removal pathways within the system. The specific objectives of this
research are:
1. Observe the effects of glucose and wastewater as carbon sources at various C:N
ratios on the nitrogen removal processes,
2. Understand biofilm growth and the impact it has on nitrogen removal rates,
3. Model nitrogen removal rates to provide a baseline for MABR success,
4. Confirm Aqua’s ability to augment a biological treatment system,
5. Propose MABR design and testing improvements to promote future MABR
experimentation.

7
Chapter 2 - Literature Review
The literature review for this project details industry information on natural nitrogen
removal pathways, conventional wastewater treatment, simultaneous nitrification and
denitrification, the proposed membrane aerated bioreactor system, and microbial
augmentation with BiOWiSH® Aqua. Previous research on membrane aerated
bioreactors focused on configurations of air flow and membrane material. Research on
BiOWiSH® Aqua is limited but focused on low-level wastewater and surface water
treatment efficiency and preliminary strain testing.
2.1 The Nitrogen Cycle
Municipal wastewater treatment achieves biological nitrogen removal through the
nitrogen cycle. The nitrogen cycle (Figure 2-1) shows the multiple pathways for nitrogen
conversion through various biological and non-biological processes (Tchobanoglaus &
et.al, 2013). The main stages utilized in wastewater treatment plants are nitrification,
denitrification, and assimilation.
Assimilation, nitrification, and denitrification are the typical stages utilized in wastewater
treatment because they are easier to achieve through known treatment techniques.
Varying aeration and a high large mixed liquor suspended solids (MLSS) can result in
any of these stages occurring. These techniques are also used to remove carbonaceous
biochemical oxygen demand (CBOD5), making it an easy transition to nitrogen removal.

8
Figure 2-1: Typical pathways for natural nitrogen removal for TAN and nitrate.
2.1.1 Nitrification
Nitrification is the process of oxidizing a reduced nitrogen compound, primarily TAN, to
nitrite, and sequentially, nitrate. Two known groups of autotrophic nitrifying bacteria
perform nitrification in two-steps. In Step 1, (Equation 1), ammonia is converted to nitrite
through an aerobic, oxidation reaction. Step 2, (Equation 2), converts nitrite to nitrate
through another, subsequent, oxidation reaction.

9
NH3 + O2 → NO2-
+ 3 H++ 2 e- …………………………………...………………………….. (1)
NO2- + H2O→ NO3
- + 2 H
++ 2 e- ……………………………………………………………. (2)
Step 1 involves ammonia-oxidizing bacteria (AOBs) such as Nitrosomonas. While
Nitrosomonas is associated as the primary genus for this step, Nitrosococcus and
Nitrosospira have shown to be capable of this step as well. Step 2 involves nitrite-
oxidizing bacteria (NOBs), with the main genus being Nitrobacter. Nitrospina,
Nitrococcus, and Nitrospira are also capable of performing step 2 of nitrification.
Heterotrophic bacteria and fungi can contribute to nitrification. However, these two
groups of microorganisms perform nitrification at a much slower rate than autotrophic
organisms and are often considered a negligible contributor to the overall process in
wastewater treatment (Environmental Protection Agency, 2009).
Nitrification requires free molecular oxygen to occur. Along with requiring oxygen,
nitrifying bacteria are temperature sensitive and operate best at a temperature of 20 °C,
meaning it is more difficult to maintain consistent nitrogen removal during winter
seasons. Nitrification will occur best at a pH between 7.2 and 8.0. During the summer, if
the wastewater treatment plant is not operated ideally, algal blooms can cause pH to
increase, reducing nitrogen removal. Additionally, due to the slow growing rate of
nitrifying bacteria, the solids retention time needs to be approximately double that of a
carbon removal system to ensure they are not out competed (Tchobanoglaus & et.al,
2013). For a wastewater treatment plant to achieve nitrification, it needs to be operated
with these constraints in mind.
2.1.2 Denitrification
Denitrification is the reduction of nitrate to nitrogen gas through bacteria known as
facultative anaerobes. Denitrification can only occur once dissolved oxygen

10
concentrations have been depleted, forcing the facultative bacteria to consume nitrate as
the electron source. This is known as an anoxic condition where dissolved oxygen
concentrations are less than 0.5 mg/L. Preferably the dissolved oxygen concentrations
are as close to 0 mg/L as possible (Environmental Protection Agency, 2009).
Denitrification is a one step process (Equation 3). As seen in Equation 3, denitrification
does require a carbon source to occur, and methanol (CH3OH) is being used as a
placeholder.
6 NO3- + 5 CH3OH → 3 N2 + 5 CO2 + 7 H2O + 6 OH
- …………………………………. (3)
While facultative anaerobes are considered the main denitrifiers, heterotrophic and
autotrophic bacteria are also capable of this process. Heterotrophic bacteria will readily
use nitrate as the electron acceptor under anoxic/anaerobic conditions for their
metabolization of biodegradables. However, they will use oxygen before nitrate for their
metabolism, so for heterotrophs to be denitrifiers, the oxygen concentration in the bulk
water must be minimized (Tchobanoglaus & et.al, 2013). Autotrophic bacteria will
convert ammonium to nitrogen gas using nitrite as the electron acceptor under a process
known as ANAMMOX (Zhou, Weili, & et.al, 2011). The ANAMMOX process is done by
specific groups of bacteria and is still being researched.
Denitrification is impacted by availability of carbon, type of carbon source, and
temperature. Denitrifiers require carbon sources to reduce nitrate into nitrogen gas.
Without enough carbon in the system, the microbes will not grow sufficiently to denitrify
the water. Additionally, denitrification has been proven to work best with methanol or
acetic acid as the carbon source, although glucose has been shown to work as well.
Denitrifying bacteria work best in temperatures between 5 and 30 °C, but nitrate removal
rates increase with increasing temperature (Tchobanoglaus & et.al, 2013).

11
2.1.3 Assimilation
Nitrogen assimilation is a process in which TAN or nitrate is consumed by microbes
during reproduction. This step in the nitrogen cycle can produce results that appear to be
nitrification or denitrification due to a steep decline in TAN or nitrate concentrations.
However, since microbial cells are approximately 12% nitrogen, they must consume
nitrogen from the wastewater to reproduce. This loss in TAN or nitrate results in an
increase of organic nitrogen or biomass (Tchobanoglaus & et.al, 2013).
2.2 Conventional Wastewater Treatment
Nitrogen removal pathways include chemical oxidation (breakpoint chlorination),
suspended and attached biological systems, air stripping, and ion exchange. While all
these mechanisms can remove nitrogen, most wastewater treatment plants utilize
suspended growth biological systems, and some treatment plants work with fixed-film
systems (Tchobanoglaus & et.al, 2013). While biological systems can be unpredictable,
they recreate the nitrogen cycle more efficiently than many engineered systems.
Whatever treatment system is used, it must be able to meet the EPA nutrient limits of 10
mg-N/L for total nitrogen, and 1.9 mg-N/L for TAN.
Conventional wastewater treatment facilities achieve nitrification and denitrification
through a minimum of two tanks, one being anoxic and the other aerobic. Nitrification
occurs in the aerobic tank where the activated sludge breaks down organic matter and
converts TAN into nitrates. This aerobic zone has a high oxygen content with steady
mixing provided by the aerators. The nitrate rich water then flows into an anoxic tank,
where oxygen is not supplied, and bacteria reduce the nitrates into nitrogen gas, which
is then off-gassed to the atmosphere (Tchobanoglaus & et.al, 2013).

12
Pre-anoxic activated sludge set-ups involve the anoxic tank coming before the aerobic,
with the return activated sludge (RAS) being resupplied to the anoxic tank. Ludzack and
Ettinger developed the first pre-anoxic system in 1962 (Figure 2.2). This relies on the
RAS delivering nitrates formed in the aerobic zone back into the anoxic tank. This
greatly limits the amount of denitrification occurring, as it is fully dependent on the nitrate
concentration in the RAS cycle. Ludzack and Ettinger systems are typically run with high
RAS recycle rates to prevent build-up of sludge in the secondary clarifiers
(Tchobanoglaus & et.al, 2013).
Figure 2-2: The process flow for a pre-anoxic Ludzack-Ettinger biological treatment
system.
The Modified Ludzack-Ettinger (MLE) process was developed by Barnard in 1973 as an
improvement on the existing Ludzack-Ettinger model. This process (Figure 2-3) added
an internal recycle from the aerobic zone to the anoxic zone to provide more nitrate to
the anoxic zone. MLE is more adaptable for existing activated sludge facilities and the
addition of an internal recycle allows the system to meet a typical effluent limit of 10 mg-
N/L for total nitrogen (Tchobanoglaus & et.al, 2013).

13
Figure 2-3: The process flow for the modified Ludzak-Ettinger pre-anoxic process.
The single sludge process is a post-anoxic nutrient removal system (Figure 2-4). This
process, developed by Wuhrmann in 1964, involved the addition of a mixed anoxic tank
after the conventional aerobic TAN removal unit. This system was common for
retrofitting existing activated sludge treatment plants but requires a carbon source to be
added to the anoxic tank for proper denitrification conditions. Additionally, TAN is
produced during normal respiration in the anoxic tank, causing an increase in total
nitrogen in the effluent (Tchobanoglaus & et.al, 2013).
Figure 2-4: The process flow for a single sludge process, which is post-anoxic

14
The Bardenpho process, developed in the 1970s, is a multi-stage post and pre-anoxic
nitrogen removal system. The Bardenpho process (Figure 2-5) is traditionally four
stages, with two anoxic tanks and two aerobic tanks, but can be adapted to have as
many tanks as possible for the desired treatment. Along with nitrogen removal, this
system has proven capable of removing phosphorus as well, leading certain wastewater
treatment plants to adopt the Bardenpho process if both are constituents of concern for
the plant. However, its large footprint, and need to incorporate additional carbon
sources, makes it inefficient for conventional wastewater treatment (Tchobanoglaus &
et.al, 2013).
Figure 2-5: The process flow for the Bardenpho process.
The four nitrogen removal processes described are just a few examples of the many
ways wastewater treatment plants evolved to perform nitrification and denitrification.
Some treatment mechanisms are more complicated than others, but ultimately, they all
involve multiple large tanks with occasional chemical additions that can be burdensome
to operators and municipalities. This is not always feasible for smaller systems or
disadvantaged areas, requiring new ways to perform the nitrogen cycle in a smaller
footprint.

15
2.3 Simultaneous Nitrification and Denitrification
Instead of removing nitrogen in a two-stage process, another removal pathway is
simultaneous nitrification and denitrification (SNdN). SNdN has proven capable of
nitrogen removal efficiencies as high as 98.3% and concentrations of total nitrogen as
low as 3 mg-N/L in the wastewater effluent.
Both heterotrophic and autotrophic bacteria are capable of accomplishing SNdN
(Tchobanoglaus & et.al, 2013). Certain heterotrophic bacteria are capable of denitrifying
in aerobic conditions with limited dissolved oxygen (DO), which is beneficial for existing
wastewater treatment plants that need to meet new nitrate limits. Paracocus pantotropha
is a heterotrophic bacterium capable of SNdN. This bacterium, and others like it, require
high energy producing carbon sources, like methanol, to achieve SNdN (Uemoto &
Saiki, 2000). Unfortunately, methanol and others like it are easily oxidized and,
therefore, are not commonly found in aerobic systems (Novak, Goldsmith, Benoit, &
O'Brien, 2019). This makes heterotrophic bacteria an unlikely source of SNdN in
conventional wastewater treatment, although they may prove capable in other
bioreactors.
ANAMMOX bacteria, from the family Planctomycetales, also perform SNdN. With
temperatures above 20 °C, Planctomycetales will oxidize ammonia through the reduction
of nitrite under anaerobic conditions. ANAMMOX has proven to perform SNdN six to ten
times faster than other autotrophic bacteria such as Nitrosomonas europaea (Zhang &
Narita, 2017). ANAMMOX is up-and-coming but can be costly and demanding for
operators.
Previous studies show that autotrophic bacteria are the most capable at SNdN, but more
reliable systems will involve a mixture of heterotrophic and autotrophic bacteria. This can

16
be difficult to accomplish in small footprints, due to the differing requirements of each
bacteria.
2.3.1 Simultaneous Nitrification and Denitrification Mechanisms
SNdN is primarily achieved through two different mechanisms. The first is achieved
within bacteria flocs inside low DO or minimized DO activated sludge settings (Figure 2-
6). Traditionally for nitrification, air is diffused through the system to achieve DO
concentrations around 4 mg/L (Tchobanoglaus & et.al, 2013). For systems achieving
nitrification, it is possible to lower DO to approximately 1 mg/L to meet new denitrification
requirements. The oxygen will diffuse through the bulk water and contact the sludge floc.
At the surface, there will be enough oxygen to achieve nitrification. The ammonia
oxidizing bacteria (AOBs) will consume this oxygen, leaving the middle of the sludge floc
anoxic.
Figure 2-6: Visualization of aerobic and anoxic zones within one sludge floc
The other main SNdN mechanism is operational changes in mixing patterns, or mixing
patterns purposefully designed, to provide aerobic and anoxic zones within one system.
This is often accomplished with the aeration mechanism itself and causes a macro-
SNdN environment (Daigger & Littleton). Systems like an oxidation ditch can accomplish
N2
NOx-
NH4+
Anoxic
Aerobic O2
N2

17
anoxic zones by lowering the power to the mixing system, causing the channel to be
anoxic with the mixed area aerobic (Tchobanoglaus & et.al, 2013). The Orbal™ is
another SNdN mechanism that involves three channels of varying DO levels (Figure 2-
7). The first channel has zero to low DO (<0.3 mg/L), the second channel has 0.5 to 1.5
mg/L of DO, and the third channel has high DO (2 to 3 mg/L). The influent enters into the
low DO system and loops through, with RAS and internal recycles providing the proper
nitrate and carbon concentrations to the appropriate channels.
Figure 2-7: Schematic of the Orbal™ system
While these are the two primary pathways for SNdN, there are others being researched
to promote the advancement of full nitrogen removal.

18
2.4 Membrane Aerated Bioreactor
The membrane aerated bioreactor (MABR) is a new biological system designed for
SNdN. MABRs are traditionally comprised of a tank with hollow-fibered membranes
along the entire length of the reactor (Figure 2-8). These membranes are often arranged
in a dead-end configuration, forcing oxygen to diffuse through the membrane into the
biofilm. The membranes serve a dual purpose, both as an oxygen distribution pathway,
and as a surface for biofilm adhesion. Multiple materials have been tested and proposed
as an ideal membrane, but silicon has proven the most capable. Nitrifiers have shown to
easily adhere to the silicon’s surface without clogging the pores, allowing for oxygen to
continuously diffuse through (Terada & et.al, 2003).
Figure 2-8: Schematic of a dead-end configuration MABR showing the ins and outs for
both air and wastewater.
19
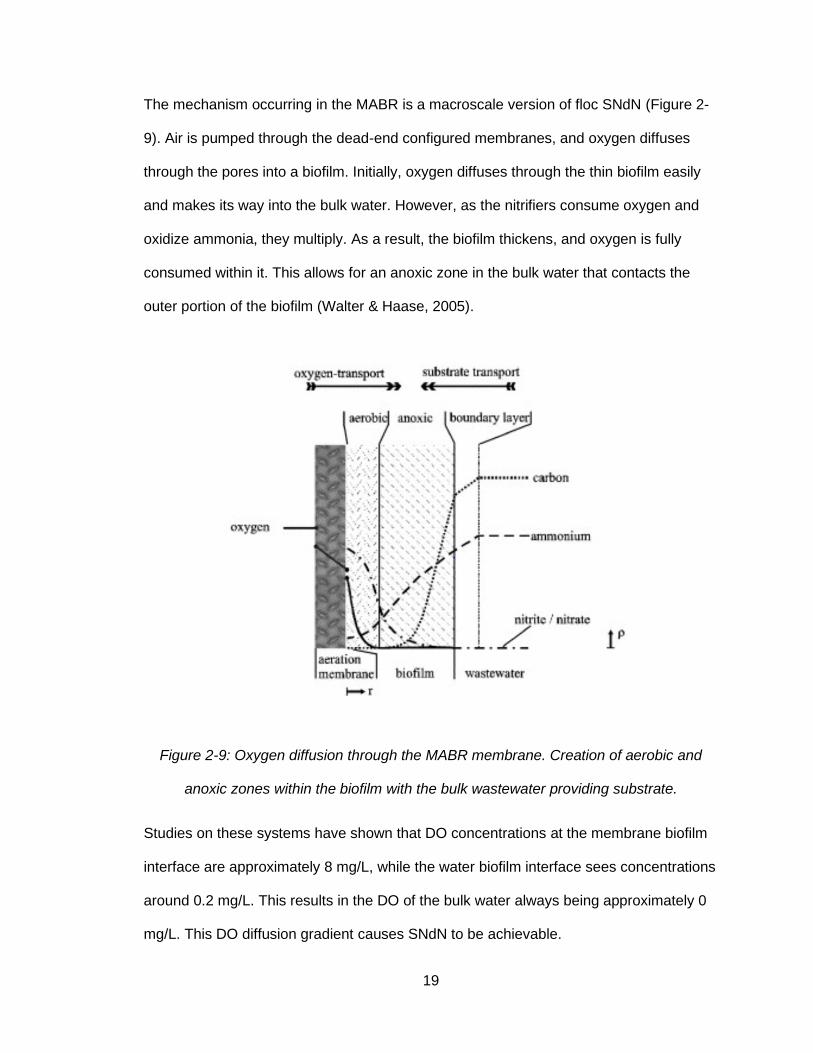
The mechanism occurring in the MABR is a macroscale version of floc SNdN (Figure 2-
9). Air is pumped through the dead-end configured membranes, and oxygen diffuses
through the pores into a biofilm. Initially, oxygen diffuses through the thin biofilm easily
and makes its way into the bulk water. However, as the nitrifiers consume oxygen and
oxidize ammonia, they multiply. As a result, the biofilm thickens, and oxygen is fully
consumed within it. This allows for an anoxic zone in the bulk water that contacts the
outer portion of the biofilm (Walter & Haase, 2005).
Figure 2-9: Oxygen diffusion through the MABR membrane. Creation of aerobic and
anoxic zones within the biofilm with the bulk wastewater providing substrate.
Studies on these systems have shown that DO concentrations at the membrane biofilm
interface are approximately 8 mg/L, while the water biofilm interface sees concentrations
around 0.2 mg/L. This results in the DO of the bulk water always being approximately 0
mg/L. This DO diffusion gradient causes SNdN to be achievable.

20
The biofilm in a MABR is more complex than typical attached growth seen in nitrification-
only treatment units due to it being a multi-layered, multi-culture, and multi-reaction
system. Ideal biofilm formation will have nitrifying bacteria in the aerobic zone with
denitrifying heterotrophs in the anoxic zone. However, there are possibilities for the
biofilm to improperly form due to the slow growth of nitrifiers versus heterotrophs
(Terada & et.al, 2003). Often, nitrifiers are introduced to the system first and allowed
time to grow before heterotrophic bacteria are introduced to the MABR. This prevents
the fast-growing heterotrophic bacteria from out competing the nitrifiers. Systems that
inoculate like this have proven successful in providing the nitrifiers the chance to take
over the aerobic zone. However, this is not always possible for larger scale systems, so
finding new ways to overcome this will be necessary.
MABRs have specific parameters that affect efficiency of the system. Like other
biological systems, oxygen diffusion, carbon to nitrogen (C:N) ratios, pH, and
temperature are vital to the functionality of the system. Oxygen diffusion is integral for
the MABR due to the different zones of reactions. Oxygen needs to be around 3 to 4
mg/L at the surface of the membrane, but reach <0.2 mg/L by the bulk water. C:N ratios
determine the ability of the heterotrophs to reduce nitrate, and if there is not enough
nitrogen in the water, the overall yield will be minimal (Walter & Haase, 2005).
Nitrification and denitrification occur in set pH and temperature ranges, so monitoring
and maintaining a pH of 6.5 to 8.0 and a temperature of around 17 to 20 °C is important.
Unique parameters to consider for the MABR are membrane material, intermembrane
pressure, biofilm thickness, and liquid flow velocity (Terada & et.al, 2003). Membrane
material affects biofilm adhesion and oxygen diffusion. Often, hollow fiber membranes
made of silicon are used due to the balance of allowing adhesion, but not clogging the
pores with microbes. Intermembrane pressure, the pressure the air is exerting on the

21
membranes, can affect the volume of oxygen diffused through the system. For MABRs,
intermembrane pressure was determined to not have a large effect on the system’s
performance. Biofilm thickness affects performance in multiple ways. The first being that
if the biofilm is too thin, it will allow too much oxygen into the bulk water, reducing the
size of the anoxic zone. The second is that if the biofilm is too thick, the biomass will
slough off the membrane, and reduce the active biomass. Finally, liquid flow velocity is
an important consideration to prevent disruption of the biofilm’s structure. If liquid flow
velocity is too high, it can scour the biofilm. If it is too slow, the liquid can become
stagnant, which also reduces performance.
MABRs have proven successful for carbon reduction, nitrification, simultaneous carbon
and TAN removal, and the treatment of high-strength wastewater. To understand the full
potential for SNdN or other nitrogen removal pathways in a MABR, further studies need
to be conducted.
2.4.1 Biofilms
The biofilm formed on the membrane itself is essential to the treatment of wastewater.
Microbes will behave differently in a biofilm formation than they do during suspended
growth. This is due to the interconnectedness and reliance on other bacteria to support
the overall process (Montana State, 2010). Biofilms are often stronger and less
susceptible to shock loadings but can grow thick and slough off.
Nitrifiers tend to grow in thinner biofilm formations, which can increase the kinetics of
TAN oxidation. AOBs and NOBs will form in layers as close to the oxygen source as
possible. These thin layers (10 to 20 μm) are beneficial for a strong attachment to the
membrane itself, and for increased contact with the TAN rich wastewater (Araki,
Akiyoshi, Machdar, & Harada, 1999). Heterotrophic bacteria show similar tendencies but
will form a thicker layer (20 to 30 μm) (Moreau, Liu, & Capdeville, 1994).

22
While the individual microbial groups perform this way in separate biofilms, this is not
how they perform in the MABR. Thinner biofilms are better for more turbulent flows
because it lowers the chance of scouring. However, MABRs have a less turbulent
environment and combines nitrifiers and heterotrophs together into one biofilm. This
causes the biofilm to be thicker, which makes it prone to sloughing off. The complexities
of this multi-layered biofilm are not fully studied yet, but some progress is being made on
the understanding of biofilm behavior (Moreau, Liu, & Capdeville, 1994).
2.4.2 Oxygen Diffusivity with a Silicone Membrane
Studied MABRs used pure oxygen with a dead-end configuration to ensure oxygen
diffuses into the system. Dimethyl silicon membranes have been shown to have a 2:1
diffusivity ratio of oxygen to nitrogen, meaning that oxygen diffuses more readily than
nitrogen (Haibing & Cloud, 2004). Diffusion rates of 6,600 cm2/s*cmHg have been
observed for oxygen, with nitrogen diffusing at a rate of 2,800 cm2/s*cmHg. This high
oxygen diffusivity makes silicon membranes ideal for the MABR’s application.
While MABRs typically use pure oxygen, therefore reducing the need to worry about
diffusivity rates, the 2:1 ratio allows for the use of compressed air as the main oxygen
source. The largest barrier to this is the dead-end configuration that was standard in
previous models. In dead-end configurations, the added pressure gives nitrogen the
chance to diffuse into the system which reduces the concentration of oxygen. Dead-end
configurations also cause condensation to occur within the membrane itself which
reduces the amount of transmissive area available (Haibing & Cloud, 2004). A study
conducted in 2017 at the University of Notre Dame found that having an open-end
configuration, with a steady leakage rate of air, allows oxygen to diffuse through the
membrane, and nitrogen to vent off outside the system (Perez-Calleja, et al., 2016). The

23
ability to use compressed air in an open-ended configuration, allows the system to be
scalable at a lower cost for both technology and energy.
2.5 BiOWiSH
BiOWiSH® Aqua (Aqua), is a proprietary mixed microbial seed intended to enhance
carbon/nitrogen degradation in surface water and wastewater treatment. The idea
behind this product is to provide wastewater systems with a faster growing, sturdier,
bacterial system consisting of heterotrophic bacteria from the Bacillus, Pediococcus, and
Lactobactus genera. Alongside carbon removal, Aqua has been found to achieve
nitrification and denitrification (Gorsuch, Roberts, & Showell, 2012). Aqua contains less
than 1% of active ingredients, with the bulk of the product being dextrose (BiOWiSH
Technologies, 2016). This results in it being a safe way to inoculate a new wastewater
treatment system with the bacteria needed for carbon removal, nitrification, and
denitrification.
Aqua relies on heterotrophic bacteria for nitrogen removal, which does require a carbon
source for energy. Heterotrophic bacteria grow faster than typical nitrifiers, which can be
beneficial for wastewater systems as it allows for lower solids retention times. Some
heterotrophic strains of Bacillus (particularly the phylum Firmicutes) were observed to
perform aerobic nitrification and denitrification at a higher rate than normal denitrifying
heterotrophs (Gorsuch, Roberts, & Showell, 2012).
The bacterial strains in Aqua expected to perform nitrification and denitrification were
isolated and tested in DI water reactors and wastewater reactors. The results from a
BiOWiSH study in Table 2-1 and Table 2-2 show that at high DO concentrations (6 to 7
mg/L), nitrification and denitrification was performed by multiple isolate strains (BiOWiSH
Technologies, 2016).

24
Table 2-1: Ammonia oxidation rates for isolated Aqua strains.
Isolate
DI Water Reactor Wastewater Reactor
Rate
(mM/hour) ΔDO (ppm)
Rate
(mM/hour) ΔDO (ppm)
B. licheniformis (B5) 0.655 2.4 0.56 2.1
B. licheniformis (B11) 0.563 0.9 0.70 0.9
B. licheniformis (B13) 0.530 1.8 0.69 0.6
B. amyloliquefaciens (B6) 0.146 4 0.11 1.4
B. amyloliquefaciens (B10) 0.639 5.5 0.64 0.5
B. subtilis (B9) 0.507 0.4 0.14 0.2
B. subtilis (KLB) 0.141 2.3 0.01 0.5
B. mojavensis (B8) 0.737 0.7 0.06 2.2
B. pumilus (B12) 0.797 0.8 0.60 0.3
P. pentosaceous 0.133 2.8 0.07 0.3
P. acidilactici 0.639 1.1 0.13 1.5
L. plantarum 0.001 0.2 0.00023 0.1
Table 2-2: Nitrate reduction rates for isolated Aqua strains
Isolate
DI Water Reactor Wastewater Reactor
Rate
(mM/hour) ΔDO (ppm)
Rate
(mM/hour) ΔDO (ppm)
B. subtilis (KLB) 0.010 1.3 0.009 1.3
B. mojavensis (B8) -0.010 1.7 -0.011 1.7
B. pumilus (B12) 0.001 1.9 0.110 1.9
B. licheniformis (B13) 0.002 1.9 0.112 1.9
From these preliminary results, it appears that Bacillus strains are capable of both
nitrification and denitrification. This study, conducted by BiOWiSH, was done once and
not repeated, but these results are promising for the use of Aqua as a nitrogen removal

25
mechanism. Aqua has been used in a few case studies and is being researched in
multiple projects, which is beginning to provide more data and results. However, these
are currently in progress and the results are currently unknown.
2.5.1 BiOWiSH Case Studies
Two case studies of Aqua application include surface water clean-up in Tile, Turkey and
a septic tank project in a Chesapeake Bay RV Park. Both involve augmenting existing
biological systems with the bacterial strains found in Aqua.
In Tile, Turkey, the municipality wanted to build a recreation center near a lake.
However, this lake was turbid and had problems with vegetative overgrowth and sludge
accumulation from degrading plant matter. These issues produced odors and unwanted
insects, causing complaints in the area. Aqua was directly applied to this lake by adding
10 kg to an 800 L tank that the lake water was pumped through. The Aqua digested the
excess sludge on the bottom, reduced turbidity, and decreased odor issues. As a result,
wildlife became more active in the area, and the lake was no longer an aesthetic issue.
Aqua is still added every day at 5 kg per 800 L tank (BiOWiSH Technology, 2016).
An RV park in Chesapeake Bay, VA experienced capacity issues in their septic system
and leachfield, along with odors. The objective of this study was to reduce BOD5, total
suspended solids (TSS), and nitrogen in the septic tank to reduce overall odors. Aqua
was mixed with water outside of the system and incubated overnight. Three 18 L
buckets with 100 g of Aqua were prepared. Two were poured directly into the septic
tank, and one entered the system through the toilet. Within 34 days, the Aqua
augmented systems had reduced sludge volume, and reduced odor. BOD5, TSS, and
total nitrogen concentrations were reduced by half. Long-term implication of this will be
larger system capacity, lower odors, and longer system lifetime. BiOWiSH
26
recommended the addition of Aqua monthly to the system to maintain this level of
treatment (BiOWiSH Technologies, 2016).
Both case studies show that Aqua has the capabilities of enhancing overall treatment
capacity in biological systems. These are narrow case-studies, but research on Aqua’s
enhancing capabilities in wastewater treatment units is being conducted.
2.6 Previous Research
Previous research on Aqua and it’s benefits to a MABR system was conducted by Kirk
Waltz and Joelle Arakaki at California Polytechnic State University – San Luis Obispo.
Kirk Waltz studied a dead-end airline configuration with compressed air that proved to be
inconclusive. The dead-end configuration showed decreases in ammonia that did not
result in the production of nitrite or nitrate. This indicated issues with oxygen diffusion
inhibiting the system (Waltz, 2009). This spurred Joelle Arakaki to produce a MABR
system with an open-end configuration that allowed compressed air to vent off. TAN
removal was seen in this system as well, again without the production of nitrite or nitrate.
However, due to upscaling the system too quickly, contamination became an issue and
the results from this research were similarly inconclusive (Arakaki, 2018).
Due to the issues found by the previous researchers, the MABR design for this research
is an open-end configuration that was scaled back down to a 1 L bioreactor system to
gain further understanding and control on system nuances.

27
Chapter 3 - System Design
A small-scale bioreactor of 1 L was set-up for testing to observe operational effects on
the MABR’s functionality and to observe Aqua’s contribution to the system. Silicon tubing
connected to a compressed air line was distributed throughout the system and used as
the oxygen source. Length of tubing, air pressure, control systems, and growth media for
the Aqua were designed based on previous research. Carbon sources and C:N ratios
were altered and analyzed for differing results.
3.1 Membrane Aerated Bioreactor Design
The MABR design and the controls used changed three times. Initially, the MABR
(MABR A) was set-up with 4 feet of thick-walled silicon tubing. MABR A was dismantled
during a lab inspection and reset-up with 7 feet of thinner-walled silicon tubing (MABR
B). The third set-up included another MABR (MABR C), in parallel with MABR B, with 7
feet of the same tubing. The length of tubing was determined by the amount that could fit
inside the bioreactor itself and was measured after removal.
All three set-ups were capped with aluminum foil to prevent oxygen from the atmosphere
from dissolving into the bulk water. The aluminum foil was nonreactive and maintained a
low DO in the system. Figure 3-1 depicts which MABR was used for each experiment.
Figure 3-1: Schematic showing MABR to experiment connection

28
3.1.1 MABR A
Experiments 1 through 6 were done with a Kontes Cytolift bioreactor (catalog number
880600). This is a 1 L glass bioreactor. Growth media was placed in the system with the
airline tubing and ran like a batch reactor (Figure 3-2).
Figure 3-2: Image of the MABR A set-up with thick-walled silicon tubing.
A thick-walled silicon tubing of 4 feet was placed randomly throughout the system to
provide a larger surface area for oxygen diffusion. The airline was connected to a wall air
compressor, with a needle valve to control pressure. For the first 6 experiments, a
pressure of 15 psi was maintained. The end of the airline was clamped, but slightly open
to slightly leak, preventing nitrogen gas buildup in the system.

29
Aqua was introduced to MABR A four days before Experiment 1 by inoculating 1 g of
Aqua outside of the system with growth media. This growth media was then poured into
the bioreactor and 500 mg of glucose was added to promote growth.
3.1.2 MABR B
Experiments 7 through 12 were conducted with the same Kontes Cytolift bioreactor, but
new tubing and inoculate (Figure 3-3). The tubing used was a thin-walled silicon tubing,
with 7 feet inside the bioreactor for oxygen diffusion. Air pressure was maintained at 15
psi.
Figure 3-3: MABR B set-up for Experiments 7 through 12.
Aqua was introduced to the system seven days prior to Experiment 7 by inoculating 1 g
of Aqua outside the bioreactor with growth media. Growth media was poured into the
system with added glucose for growth.

30
3.1.3 MABR C
Experiments 11 and 12 utilized the same bioreactor set-up as Experiments 7 through 12.
MABR C was set-up alongside MABR B with the same tubing length and type. To
connect both MABRs to the airline, a tee-splitter was added to the airline to promote
equal distribution of air between the replicate systems. Pressure from the wall air
compressor was increased to 30 psi prior to the tee-splitter to ensure each MABR’s
membrane was operating at 15 psi.
3.2 Activated Sludge Bioreactor Design
For experiments 7 through 9, a bioreactor was set-up to model an activated sludge
system. A Kontes Cytolift bioreactor was filled with 1 L of the same growth media, and a
fish bubbler was used to diffuse oxygen into the system (Figure 3-4).
Figure 3-4: Activated sludge bioreactor with suspended growth. This set-up was a
control for the MABR.

31
Aqua was inoculated into this system by mixing 1 g with the growth media outside the
system and putting it into the bioreactor. The suspended growth grew for seven days
before experimentation began.
3.3 Airline Configuration
The oxygen source for all experiments was the wall air compressor in Building 13 on the
California Polytechnic State University – San Luis Obispo campus. The airline was
controlled through a series of valves, rotameters, and pressure gauges (Figure 3-4). The
air came from the wall, through the needle valve, rotameter, and pressure gauge. From
there, it connected to the silicon tubing that was wound through the bioreactor and
nitrogen gas vented off through the clamped end of the tubing outside of the MABR.
When MABR C was set-up in parallel with MABR B, the airline was split after the
pressure gauge.
Figure 3-4: Schematic of the airline set-up.
The needle valve was connected directly to the air outlet from the wall to appropriately
control air pressure. This allowed for easier set-up as the wall valve can be fully open,
and the needle valve lowers the pressure to the desired value. Air from the wall comes
out at approximately 100 psi, which could damage the small-scale membranes. The
rotameter in place was there to ensure a consistent flow of air was maintained
throughout the experiment. A vacuum gauge was attached before the tubing entered the

32
system to monitor any buildup of gas within the membrane itself. This eased the process
of determining the level of venting that needed to occur from the airline outlet.
The silicon tubing was randomly distributed throughout the system to achieve an overall
length of 2.1 m (7 ft) for MABR B and C. At 0.32 cm diameter, this provided 0.021 m2 of
surface area for oxygen to permeate through. A peroxide cured tubing was used with a
permeability for oxygen gas of 6,579 x 10-11 cm2/s*cmHg and a nitrogen gas permeability
of 2,763 x 10-11 cm2/s*cmHg (Cole-Parmer, 2018). Nitrogen gas did not build up in the
bulk water due to the twice as high permeability of oxygen alongside allowing the air to
vent off.
3.4 Growth Media Constituents
The growth media used for all experiments was developed and tested in previous
research conducted by Joelle Arakaki. It is a blend of phosphorus buffer and
micronutrients to promote a stable pH and a healthy environment for microbial growth
(Arakaki, 2018).
3.4.1 Buffer
The growth media had a phosphorus buffer to maintain a pH between 6.5 and 7.5.
Previous research showed that it was difficult to maintain the pH range due to excess
hydrogen ions being released during nitrification. This concern was resolved by
increasing the concentration of buffer within the growth media. Table 3-1 details the
concentration of each constituent in the buffer portion of the growth media.

33
Table 3-1: Phosphorus buffer constituents and concentrations
Chemical Name Chemical Formula Concentration (mg/L)
Dipotassium phosphate K2HPO4 1,068
Monopotassium phosphate KH2PO4 526
Sodium bicarbonate NaHCO3 500
Disodium phosphate Na2HPO4 ∙ 7H2O 33
Calcium chloride CaCl2 ∙ 2H2O 28
Magnesium sulfate MgSO4 ∙ 7H2O 23
Ferrous chloride FeCl ∙ 6H2O 0.25
This buffer solution maintains an initial pH of 7.0 to 7.1 and is resistant to large
fluctuations in pH that can occur during nitrification. Concentrations for each chemical
were determined using the Henderson Hasselbach Equation.
3.4.2 Micronutrients
Micronutrients were added to the growth media in accordance with recommendations
from BiOWiSH® and common microbiology practice. Each mineral and micronutrient
either provides vital ions for the bacteria’s growth or promotes the ability to perform
nitrification and denitrification. Table 3-2 details the concentrations of each micronutrient
added to the growth media.

34
Table 3-2: Micronutrient concentrations in the growth media
Chemical Name Chemical Formula Concentration (mg/L)
Magnesium sulfate MgSO4 ∙ 7H2O 3,000
Sodium chloride NaCl 1,000
Manganese sulfate MnSO4 ∙ H2O 500
EDTA EDTA 500
Ferric sulfate FeSO4 ∙ 7H2O 100
Cobalt nitrate Co(NO3)2 ∙ 6H2O 100
Calcium chloride CaCl2 100
Aluminum sulfate Al3(SO4)2 100
Nickel chloride NiCl2 ∙ 6H2O 20
Boric acid H3BO3 10
Sodium molybdate Na2MoO4 ∙ 2H2O 10
Sodium tungstate Na2WO4 ∙ 2H2O 10
Sodium selenite Na2SeO3 1
The micronutrients chosen are designed to promote the growth of heterotrophic bacteria
alongside the nitrifiers (Sigma-Aldrich, 2019). Trace metals help with bacteria’s natural
metabolism and growth rates. The other chemicals in Table 3-2 are added to model the
environment the bacteria would grow in naturally to promote growth within this system.
3.5 Aqua Dosing Methods
Aqua was inoculated by pulling 50 mL of the growth media and mixing 1 g of Aqua in.
This was then reintroduced to the system at room temperature. This method was
developed in previous research and maintained consistent throughout the
experimentation phase.
3.6 Carbon Sources and Dosing Techniques
Glucose and wastewater were used as the carbon source for these experiments. Since
an objective of the project is impact of carbon dosing, this design aspect varied the most

35
from experiment to experiment. Table 3-3 outlines the carbon source, mass added, and
C:N ratio for each experiment.
Table 3-3: Carbon source and C:N ratio for each experiment
Experiment Carbon Source Amount added C:N Ratio
1 Glucose 250 mg 1.5:1
2 Glucose 250 mg 1.5:1
3 Glucose 250 mg 1.5:1
4 Glucose 250 mg 1.5:1
5 None 0 mg 0:1
6 None 0 mg 0:1
7 Glucose,
Wastewater
500 mg,
10 mL
3:1
-
8 Glucose,
Wastewater
5,000 mg,
10 mL
30:1
-
9 Glucose,
Wastewater
500 mg,
10 mL
3:1
-
10 Glucose 500 mg 3:1
11 Wastewater 200 mL 1:1
12 Wastewater 400 mL 2:1
The ability for the MABR to process the available BOD5 in the wastewater is important
for real world applications of this system. Varying the amount of carbon added initially to
the system allows for determination of the limits of the MABR to process carbon and
nitrogen simultaneously. This impacts the eventual placement and application of this
system within wastewater treatment plants.

36
Chapter 4 – System Experimentation and Implementation
Twelve experiments were conducted with the small-scale, 1 L systems described in
Chapter 3. Additionally, one microbiology experiment and one screening experiment
were done. This chapter will detail sample collection and nitrogen concentration testing
methods. Along with methods and procedures, each of the experiments are described
with their objectives.
4.1 Experimental Methods
The methods for the bioreactor set-up, sampling, sample preparation, and nitrogen
concentration analysis were developed prior to the beginning of experimentation.
Sampling procedures varied from the early experiments to the later experiments to gain
a more representative sample.
4.1.1 Bioreactor Design
Despite having different lengths of silicon tubing, the set-up for MABR A, B, and C was
identical. The MABR was set-up three different times, and one activated sludge control
was set-up.
Prior to set-up, the glass bioreactor and silicon tubing were autoclaved to fully sanitize
each system and ensure Aqua was the only contribution to the microbial biomass.
Growth media was prepared in liter batches that were also autoclaved to prevent
contamination of the media prior to use. After all materials cooled to room temperature,
the tubing was attached to the airline and randomly distributed throughout the MABR
until approximately 7 feet of tubing was inside. MABR A used a thicker-walled, 4 foot
tubing. Experiment’s done within the same MABR maintained the same tubing and
biomass throughout.

37
With the silicon tubing inside, the MABR bioreactor can hold approximately 675 mL of
growth media. Initially, 625 mL was poured into the MABR and 50 mL was held back to
inoculate the Aqua in. Once the 1 g of Aqua was inoculated, this was poured back into
the system. MABR A was allowed four days of growth prior to experimentation
beginning. MABR B and C were allowed seven days of growth prior to experimentation.
The activated sludge control did not have silicon tubing inside of it. Instead, after the
bioreactor cooled to room temperature, the fish bubbler was attached to the bottom inlet
of the system with PVC tubing and allowed to bubble air up through the system. While
this system could hold more growth media, the same volume of 675 mL was used for
consistency.
4.1.2 Sampling and Storage Methods
Two sampling methods were used during the research. Initially, samples were taken
from the bottom of the bioreactor using a tubed opening. The first 2 mL were wasted at
each sampling event to ensure the sample was representative of the current time point
and not the previous one. Each sample was at least 15 mL, but if possible, 20 mL was
taken to conduct all the analyses with proper quality control measures. This method
proved to be unrepresentative of the first 30 hours of each experiment due to the slow
mixing within the MABR.
After noticing the inconsistencies with the previous sampling method, samples were
pulled from the top of the bioreactor, where the nitrogen was introduced to the system.
This was done by removing the tinfoil lid and using a 10 mL micropipette to remove 20
mL of sample from the bioreactor. The bulk water was gently stirred prior to extracting
the sample. The lid was never removed longer than it took to take the sample itself. The
pipette was inserted a few inches into the water to get a representative sample of the
bulk water’s nitrogen concentrations.

38
Samples were collected in 50 mL falcon tubes and stored in the freezer. Previous
research found that the addition of sulfuric acid before storage caused degradation of
nitrogen compounds, skewing results. For this reason, samples were not acidified prior
to storage. Samples were stored in the freezer at -4 °C to maintain a temperature low
enough to stop microbial activity until the samples could be tested.
Every time a sampling event occurred pH was taken from the bulk water with an Oakton
Acorn series pH 5 meter. If pH was below 6.5, sodium bicarbonate was added to the
system to stabilize pH to the ideal range of nitrification and denitrification which is 6.5 to
8.5. This mainly occurred during the first 30 hours of experimentation, when most of the
TAN was oxidized. The mass of sodium bicarbonate added to the system was
determined to be insignificant and not cause dilution.
4.1.3 Sample Preparation
Prior to analyzing the samples, each sample was filtered through a glass filter set-up. At
least 15 mL of each sample was filtered. For samples with 20 mL, 5 mL was left
unfiltered for the total nitrogen analysis. Samples were initially filtered through a 1.2
micrometer (µm) glass fiber filter (Millapore Sigma Catalogue Number: RAWP02500) to
prevent clogging the 0.22 µm nitrocellulose filter (Millapore Sigma Catalogue Number:
GSWP04700). The filter set-up was rinsed 3 times between samples to prevent
contamination. The apparatus was also dried between samples to prevent dilution.
4.1.4 Quality Assurance and Quality Control
Quality assurance and quality control measures were taken during each experiment to
ensure all water quality tests reported accurate and precise results. The main quality
assurance techniques came from careful recording of all steps and observations during
research. Each experiment was laid out before beginning, and each analysis was

39
prepared according to standard operating procedures recommended by the
manufacturer.
Quality control techniques included blanks, standards, splits, and spikes. Method blanks
were used to determine any losses or gains from the preparation of the samples. Method
blanks showed little interference from the method preparation except for the Hach total
nitrogen test which showed approximately 16% interference. Standards of ammonium,
nitrite, and nitrate were prepped in bulk and serially diluted from the initial solution. The
bulk solution was prepared to have a concentration of 1,000 mg-N/L. Standards were
used to prove the accuracy of the analyses and to create calibration curves. Calibration
curves ranged from 10 mg-N/L to 100 mg-N/L and needed to have an R2 greater than
99.9% to be considered accurate. Standards were determined to pass if their percent
error was less than 10%.
Splits were performed on random samples for each analysis. The sample was shaken
and then split evenly between two test tubes. A split was considered passing if their
relative percent difference was less than 10%. Matrix spikes were sporadically used
during experimentation. This was done by adding a known volume of a known
concentration of nitrogen to an unknown sample. Matrix spikes were typically performed
on early samples or end of experiment samples for more accurate assumptions on the
sample’s concentration. A matrix spike was considered passing if the percent recovery
was between 85% and 110%. Due to the variable nature of this research, matrix spikes
did not pass consistently.
Additional quality control measures involved control systems and replicate systems. An
activated sludge model was set-up to provide results that could be modeled with existing
design equations. Later experiments had two MABR set-ups running in parallel to see if
results were consistent and repeatable between MABRs.

40
4.1.5 Ammonia Analysis
Samples were analyzed in a TL-2800 Auto Ammonia Sampler from Timberline
Instruments to determine TAN concentrations (Timberline Instruments, 2017). Each
sample was filtered, and 6.5 to 7 mL was put in a 15 mL falcon tube. Sulfuric acid was
added dropwise until the pH of the sample was below 2. Decreasing the pH will cause all
ammonia in the system to reduce into ammonium.
The TL-2800 operates under principles of gas diffusion. The sample is combined with a
caustic solution until the pH is raised between 11 and 13. This converts the ammonium
into ammonia gas. The sample with dissolved ammonia gas is sent through a membrane
that allows the gas to permeate and rejects the liquid. That ammonia gas is absorbed
into a boric acid solution with a pH of 6.5 and passed through a conductivity meter. The
meter reads the change in conductivity which is proportional to the concentration of TAN
(Timberline Instruments, 2017).
Before running the TL-2800, new DI water was provided for the autosampler’s cleaning
cycle to prevent contamination from previous runs. Gain and post-attenuation factors
were set to 10, and each sample was run for 2.5 minutes. A calibration curve was
established in the TL-2800 Data Acquisition software by preparing and testing known
concentrations of TAN. Typical ranges for the calibration curve were 0 mg-N/L to 100
mg-N/L, as those were the boundary conditions for most experiments. The TL-2800 Data
Acquisition software would then relate the area of the unknown sample’s curve to the
calibration curve prepared.
4.1.6 Nitrate and Nitrite Analysis
Nitrate and nitrite were analyzed using a Dionex ICS-1600 ion chromatograph (IC) from
Thermo Scientific. The IC performs this analysis in 6 steps shown visually in Figure 4-1
41
(ThermoScientific, 2012). For a nitrate and nitrite analysis, the eluent was prepared
using 956.5 mg of NaCO3 in 1 L of DI water, or a 955 millimolar solution.
Figure 4-1: Steps involved in the IC’s ion analysis (ThermoScientific, 2012)
First the eluent carries the sample through the series. The sample is injected into the
eluent stream and is pushed through the guard column. The guard column removes any
contaminants that could potentially damage the separator column. The main principle
within the separator column is ion exchange, where different ions will move and exit the
column at different rates. The suppressor enhances the ion’s response allowing for
detection from the conductivity cell. The Chromeleon Chromatography Management
System identifies the ion based on retention time and quantifies the peak area
(ThermoScientific, 2012).
Analysis for nitrate and nitrite can be done with the same 955 mmol eluent solution.
Each sample takes 20 minutes to go through the six-step process. Samples were not

42
acidified prior to IC injection to prevent contamination from the strong hydrogen and
sulfate ions. The results from the IC had 2 peaks, the first being nitrite, the second being
nitrate. Calibration standards were entered into the Chromeleon Chromatography
Management System ranging from 10 mg-N/L to 100 mg-N/L to convert the peak areas
into concentrations. Analysis of method blanks showed that the IC had a detection limit
of 0.25 mg-N/L for nitrite and nitrate.
4.1.7 Total Nitrogen Analysis
A Hach total nitrogen kit was used to determine total nitrogen concentrations in multiple
experiments. Ideally, these concentrations would be used to find organic nitrogen in the
system by subtracting TAN, nitrite, and nitrate concentrations from the total nitrogen
concentration. The Hach kit uses 0.5 mL of an unfiltered sample and multiple reagent
packets to volatilize all nitrogen compounds into a homogenous mixture. Each Hach total
nitrogen tube was then read in a DR-3800 Hach Spectrophotometer at a wavelength of
410 nanometers (nm). The Hach total nitrogen test has a 20% systemic error based on
each step of the process and the accuracy of the DR-3800. Due to the large percent
error in this analysis, concentrations from this test were used for a general visualization
more so than concrete numbers.
4.1.8 Microbiology methods
When MABR C was set-up, a series of plates were run on the system to see if there
were any significant changes in bacterial colonies. The plates were prepared by a
biology undergraduate. Three plates received 100 microliters of the bulk water and were
plated using the bead plating method where glass beads are used to create an even
spread of bacteria throughout the agar plate. Three plates were diluted by a factor of ten
to gain visibility and were plated using the same method.

43
4.2 Experiments
Twelve experiments were performed to determine proper C:N ratios, carbon sourcing,
understand biofilm growth, and confirm Aqua’s ability to augment a biological treatment
system. Table 4-1 gives a broad overview of each experiment, and further details are
provided in the appropriate sections.
Table 4-1: Overview of key experiment parameters
Experiment Carbon
Source
C:N
Ratio
Initial NH4+
Concentration
(mg-N/L)
Initial NO3-
Concentration
(mg-N/L)
Time Run
(hours)
1 Glucose 1.5:1 50 0 48
2 Glucose 1.5:1 100 0 24
3 Glucose 1.5:1 50 0 24
4 Glucose 1.5:1 100 0 24
5 None 0:1 100 0 24
6 None 0:1 100 50 120
7 Glucose
Wastewater 3:1 100 0 120
8 Glucose
Wastewater 30:1 100 0 100
9 Glucose
Wastewater 3:1 100 0 200
10 Glucose 3:1 100 0 130
11 Wastewater 1:1 100 25 100
12 Wastewater 2:1 100 50 75
Additional experiments included a one-hour screening experiment to estimate TAN
assimilation and the agar plates made during Experiment 11.

44
4.2.1 Experiment 1 – Functionality
The purpose of Experiment 1 was to make sure the system was functioning properly. In
particular, the airline and pressure levels. Experiment 1 was done in MABR A. This had
4 feet of thick-walled silicon membrane, operating at 15 psi.
Ammonium Chloride (NH4Cl) was used as the TAN source. To get 50 mg-N/L of nitrogen
in the system, 191 mg of NH4Cl was mixed into 50 mL of growth media and introduced to
the MABR’s bulk water along with 250 mg of glucose. The MABR was run like a batch
reactor without a water flow in and out of the system.
Samples were taken twice a day for 48 hours. While pH was measured at every
sampling event, DO was not measured as literature review proved that oxygen should
be depleted in the bulk water. Samples were analyzed for TAN, nitrite, and nitrate.
4.2.2 Experiment 2 – Stabilization
After proving the system was functioning, it was important to promote bacterial growth
that could perform nitrification and denitrification. This was done with a series of 24-hour
experiments with a consistent C:N ratio. This should promote specific bacteria capable
of performing the nitrogen cycle.
Experiment 2 was performed in MABR A. Before beginning, the system was drained and
filled with a new batch of 650 mL of growth media. For a concentration of 100 mg-N/L,
254 mg of NH4Cl was mixed into 50 mL of growth media and introduced to the MABR’s
bulk water along with 250 mg of glucose. The MABR was set-up to run as a batch
reactor, without water inflow or outflow. Over the 24 hours, five samples were taken, and
pH was monitored. Pictures were taken at the beginning and end to visually observe
biofilm growth. Samples were analyzed for TAN, nitrite, and nitrate after the experiment
ended.

45
4.2.3 Experiment 3 – Stabilization Continued
Continuing the preliminary stabilization of the system, Experiment 3 was another 24-hour
experiment. The system was drained and refilled with 650 mL of new growth media. This
time, only 191 mg of NH4Cl was added to the MABR due to residual TAN in the system
from the previous experiment. Procedurally, this experiment was identical to Experiment
2.
4.2.4 Experiment 4 – Stabilization Continued
Experiment 4 was the final stage of the stabilization phase of the research. The system
was drained, and 650 mL of new growth media was added. It lasted for 24 hours, with
five samples taken throughout. Ammonia was depleted from the system prior to this
experiment, so 254 mg of NH4Cl was added with the growth media along with 250 mg of
glucose. Procedurally, this experiment was identical to Experiment 2.
4.2.5 Experiment 5 – No Carbon Source
After using a 1.5:1 C:N ratio for the first four experiments, Experiment 5 observed the
system’s behavior without an external carbon source. Without a carbon source,
autotrophic bacteria would dominate the system and microbial death should be
observable. The MABR was completely drained and 650 mL of new growth media was
added. Ammonia was added to the system by mixing 254 mg of NH4Cl with the growth
media. No glucose was added. The experiment ran for 24 hours, with five samples taken
throughout. Samples were tested for TAN, nitrite, and nitrate at the end of the
experiment.
4.2.6 Experiment 6 – No Carbon Source
After observing the autotrophic bacteria’s activity in Experiment 5, Experiment 6 was
performed with a 0:1 C:N ratio to further understand the nitrification process within the
MABR. Both ammonia and nitrate were added to the system at 100 mg-N/L and 50 mg-

46
N/L respectively. To achieve these concentrations, 254 mg of NH4Cl and 190 mg of
Sodium Nitrate (NaNO3) were mixed into the new 650 mL of growth media and added to
the MABR. The experiment ran for 120 hours, with two to three samples taken daily in
the morning and evening for representative samples.
Samples were tested for TAN after the experiment was completed. The suppressor on
the IC broke during this experiment, so samples were not tested for nitrite and nitrate
until 1.5 months after experimentation. Samples were filtered and frozen before the IC
became non-functional, so results were considered representative of the experiment.
4.2.7 Experiment 7 – Low Glucose Concentration
Before Experiment 7 began, MABR B had to be set-up along with an activated sludge
control system. MABR A was dismantled during an annual lab cleaning and the tubing
used was displaced. The activated sludge control was used to see if Aqua was capable
of nitrification and denitrification by providing modellable results.
Experiment 7 used a C:N ratio of 3:1 by adding 500 mg of glucose and 254 mg of NH4Cl.
The experiment ran for 120 hours with samples taken twice a day from each bioreactor.
Wastewater was micro dosed (10 mL) at hour 55 to see if the system could adapt to the
wastewater as a new carbon source. Samples were analyzed for TAN, nitrite, nitrate,
and total nitrogen after the experiment was finished.
4.2.8 Experiment 8 – Large Glucose Concentration
Experiment 8 was performed in MABR B. This time, a 30:1 C:N ratio was done by
adding 5,000 mg of glucose to the growth media. This was done to determine if the
carbon dosing was the main limiting factor in the SNdN process. If the C:N ratio was too
low at 3:1, then by using a 30:1, there should be vastly different results in removal rates
and concentrations. This experiment used 100 mg-N/L as a starting concentration by

47
adding 254 mg NH4Cl to the new 650 mL of growth media. The experiment ran for 100
hours, with a 10 mL dose of wastewater at hour 55 for consistency with previous
experiments. Samples were taken twice a day for the duration of the experiment and
analyzed for TAN, nitrite, and nitrate after the experiment ended.
4.2.9 Experiment 9 – Low Glucose Concentration Replicate
Experiment 9 was identical to Experiment 7, although it was run for 200 hours instead of
120 hours. MABR B was drained and refilled with 650 mL of growth media. The starting
concentration of 100 mg-N/L was achieved by adding 254 mg of NH4Cl to the system.
Wastewater was added at hour 55 for consistency with previous experiments. While the
MABR typically operates with aerobic and anoxic zones, an anaerobic zone formed
during this experiment and produced sulfur byproducts. At hour 55, the bulk water
became black and DO measurements showed 0 mg/L of DO. pH measurements showed
elevated pH levels from 7.5 to 8.5. Samples were still taken twice a day despite this
change, and were analyzed for TAN, nitrite, and nitrate at the end of the experiment.
4.2.10 Experiment 10 – Further Study on MABR B
After observing the results from MABR B in Experiment 9, Experiment 10 was run with
similar parameters. A 3:1 C:N ratio was achieved by adding 500 mg of glucose to the
new 650 mL growth media. For a concentration of 100 mg-N/L, 254 mg of NH4Cl was
mixed into the growth media. The experiment ran for 128 hours. The main difference
between Experiments 9 and 10 is that no wastewater was added to MABR B during
Experiment 10. In part, this was to see how the system would react under the new
conditions, with just the Aqua’s bacterial cultures and glucose influencing nitrogen
removal. Samples were taken twice a day and analyzed for TAN, nitrite, and nitrate.

48
4.2.11 Experiment 11 – Wastewater as the Carbon Source
After understanding how the MABR functions with glucose and micro doses of
wastewater, the next experiments observed if Aqua could use the BOD5 in wastewater
as the sole carbon source. The wastewater available for this research came from the
SLO WRRF’s primary clarifier. This primary effluent has a BOD5 concentration of 370
mg/L and TAN concentration of 15 mg/L. Experiment 11 filled 1/3 of MABR B with
wastewater and the other 2/3 with new growth media which is equivalent to 200 mL of
wastewater and 400 mL of the new growth media. This achieved a 1:1 C:N ratio.
Before beginning Experiment 11, MABR C was set-up to run in parallel with the existing
system. MABR C had minimal DO in the bulk water and had not produced black sulfates
like MABR B. This was primarily to observe differences in nitrogen removal between the
two systems operating with different conditions in the bulk water. Like MABR B, MABR C
was set-up with 1/3 wastewater and 2/3 new growth media. Since MABR B was already
observed with TAN removals, 50 mg-N/L was introduced as 191 mg of NaNO3. MABR C
had an additional 100 mg-N/L added through 254 mg of NH4Cl. Samples were taken
from each bioreactor twice a day for 100 hours and analyzed for TAN, nitrite, nitrate, and
total nitrogen.
4.2.12 Agar Plate Series
After MABR C was set-up and allowed to grow for 7 days, 3 samples were taken and
plated for observation of colony growth patterns. Samples were taken at time 0, 24, and
48 hours of Experiment 11. Each sample was plated at full strength and at a 10:1 dilution
using a bead plating technique.
4.2.13 Experiment 12 – Increased Wastewater Ratio
Experiment 12 increased the amount of wastewater in the system to 2/3, which resulted
in a 2:1 C:N ratio in both MABRs. MABR B was still producing sulfur byproducts and

49
MABR C was still turbid, but not black in color. The purpose of this experiment was to
observe the effects of the increased wastewater, but also to see interactions with a mix
of ammonia and nitrate influent. Each bioreactor was filled with 400 mL of wastewater,
250 mL of new growth media, 254 mg of NH4Cl and 191 mg of NaNO3. This experiment
ran for 75 hours, with samples taken twice a day. Samples were analyzed for TAN,
nitrite, nitrate, and total nitrogen.
4.2.14 Ammonia Assimilation Screening Experiment
A one-hour screening experiment was performed to understand the rates of ammonia
assimilation in the biofilm formed by the Aqua. Literature review showed that Aqua is
primarily comprised of Bacillus strain bacteria. The main removal pathway for Bacillus
bacteria is assimilation. Two beakers were set-up for this experiment. One beaker
received 1 mL of MABR B’s bulk water, the other received 10 mL. DI water was then
added at 49 mL and 40 mL respectively. This solution was thoroughly mixed and 20 mg
of NH4Cl was added to each of them to achieve a concentration of 100 mg-N/L. Samples
were taken every 30 minutes for 1 hour and tested for TAN.

50
Chapter 5 - Evaluation and Discussion
Each experiment in the batch MABR reactors provided insight into the conditions under
which SNdN is possible, and if Aqua can enhance removal rates. These experiments
helped narrow down the operational conditions of the system and provided clarification
for future implementation. Figure 5-1(a) and 5-1(b) are provided as experiment
schematics to provide context for each experiment’s results.
Figure 5-1(a): Schematic showing which MABR was used during each experiment
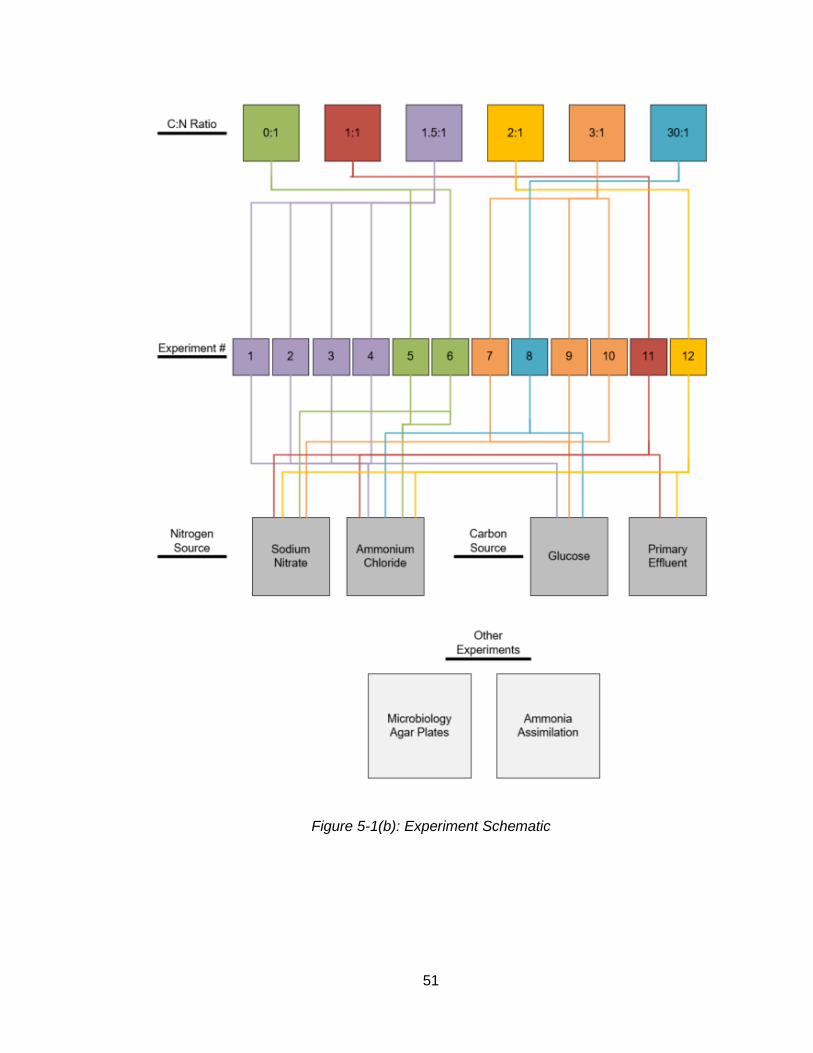
51
Figure 5-1(b): Experiment Schematic

52
5.1 Ammonia Assimilation Screening Experiment
During the twelve experiments, a discrepancy was observed between the concentration
of nitrogen added to the system, and the sample concentration at hour 0, particularly for
TAN. Often, the intended concentration for TAN would be 100 mg-N/L, but the hour 0
sample would show a concentration in the range from 20 mg-N/L to 50 mg-N/L.
The hour 0 sample was taken 5 minutes after introducing nitrogen to the MABR to allow
some time for the added nitrogen to mix into the bulk water. To understand the
discrepancy, a small screening experiment was performed. Two beakers were set-up
with 50 mL each. One beaker contained 2% microbes from MABR B while the other
beaker contained 20% microbes. TAN was introduced at 100 mg-N/L, and 3 samples
were taken at 5 minutes, 30 minutes, and 60 minutes.
From this screening experiment, with TAN fully mixed throughout, the same discrepancy
occurred, although it took the 20% mixture 30 minutes to reach the same concentrations
as the 2% mixture (Figure 5-2). Both started at lower concentrations than intended, and
plateaued at 14 mg-N/L. This indicated that the bacteria within the MABRs (primarily
from Aqua on the biofilm and wastewater in the bulk water) were likely the cause of the
lowered TAN concentrations.

53
Figure 5-2: Results from the screening experiment
Aqua is primarily comprised of heterotrophic Bacillus strain bacteria. Research on
heterotrophic bacteria, particularly those in the Bacillus family was done to determine if
Aqua was the cause of the missing nitrogen. From this, it was found that heterotrophic
bacteria assimilate 70% of nitrogen compounds within the first 5 minutes of exposure
(Meers & Pedersen, 1972). This indicated that if 100 mg-N/L of TAN was introduced to
the system and only 25 mg-N/L shows up in the first sample, this is due to the rapid
assimilation of TAN through heterotrophic respiration.
Conclusions from this finding indicate that Aqua’s main nitrogen removal pathway is
assimilation. While an effective part of the nitrogen cycle, this is not typically the
mechanism desired in wastewater treatment as it leads to a larger production of sludge
that can cause operational issues later.

54
While this experiment showed a likely cause for the discrepancies in TAN
concentrations, it does not explain the occasional discrepancies in initial nitrate
concentrations. This may be due to adsorption capabilities of the microbes in the
system. Bacillus strain bacteria and other microbes have a negatively charged surface
and often behave like a negative particle. This negative surface area may be attracting
the TAN particles (positively charged) leading to increased adsorption rates along with
the potential assimilation. This could explain why nitrate does not seem to assimilate
with the TAN, as it should per the nitrogen cycle.
Each of the twelve experiments show discrepancies in the initial concentrations despite
passing QAQC measures, likely due to one or both of the aforementioned removal
pathways. Further research needs to be done on assimilation as a removal mechanism
before this discrepancy can be fully explained.
5.2 Experiment 1 – Functionality Results
The results of Experiment 1 indicated that the airline was diffusing oxygen through the
system. TAN decreased within the first 15 hours (Figure 5-3). Despite the rapid decrease
in TAN, little movement was seen in nitrite or nitrate indicating that nitrification was not
occurring, but rather assimilation.

55
Figure 5-3: Results from Experiment 1 conducted in MABR A.
Despite not adding any nitrate to the system initially, the concentration of nitrogen from
nitrate at hour 0 was approximately 98 mg-N/L. This discrepancy is attributed to the
presence of nitrate in the growth media itself. The growth media contains approximately
63.7 mg-N/L from nitrate. However, this leaves 34.3 mg-N/L unaccounted for. The cause
of this is unknown, but may be from within the Aqua itself, or from immediate nitrification.
5.3 Experiment 2 – Stabilization Results
The goal of Experiments 2 through 4 was to stabilize the biofilm and promote growth of
nitrifying and denitrifying bacteria. Results from this initial phase showed that TAN
declined rapidly in the first 5 hours before plateauing at 51 mg-N/L (Figure 5-4). The
plateau in concentration is likely due to running out of carbon.

56
Figure 5-4: Results from Experiment 2. The first stage of stabilizing MABR A.
The decrease in TAN corresponded with the doubling in nitrate concentrations.
Nitrification likely occurred causing this correlation. Nitrite remained steady the entire
experiment. Nitrite conversion to nitrate is the fastest step in nitrification, so this was
expected. Nitrate concentrations also plateaued 3.5 hours into the experiment. These
plateaus likely indicate that the bacteria either ran out of carbon or oxygen or that the
conditions within the system were not ideal for nitrification. Experiment 2 was conducted
with a 1.5:1 C:N ratio, much lower than traditional systems, so the bacteria likely did not
have enough carbon to continue the nitrification process.

57
During this experiment, MABR A grew more turbid (Figure 5-5), meaning that suspended
growth was occurring alongside the attached growth. With the low C:N ratio, the biofilm
was not growing consistently, diffusing more oxygen into the bulk water. This might be
another cause of the plateaued nitrate concentrations as too much dissolved oxygen can
limit denitrification.
Figure 5-5: MABR A, showing turbidity and open spaces on the silicon membrane
The open spaces on the membrane where biofilm did not grow allowed for bacteria to
grow in the bulk water. This corresponded with a decreased pH from 7.1 to 4.6. This
decline in pH and the movement of nitrogen from TAN to nitrate indicates that
nitrification was occurring, but that denitrification was not achieved. At low pH, bacteria
cannot complete the entire respiration cycle necessary for nitrification and other natural
cycles and become slower moving. As such, the low pH is likely the cause for decreased
removal rates.

58
5.4 Experiment 3 – Stabilization Continued Results
Experiment 3’s results (Figure 5-6) are relatively consistent with Experiment 2’s
indicating that the MABR can produce replicable results. This experiment produced a
more gradual removal in ammonia after the initial sharp decline. The nitrate
concentrations initially increased, but then decreased very minimally over the course of
24 hours.
Figure 5-6: Experiment 3’s results. 2nd stage in stabilizing MABR A
There was, again, minimal biofilm growth in MABR A and significant growth in the bulk
water (Figure 5-7). The MABR became frothy in the top layer due to some gas bubbling
out of the system. Since nitrate did not decline in a significant way, the bubbles are likely
indicative of excess oxygen bubbling out of the water. Due to the thin biofilm formation
during Experiments 2 and 3, oxygen was able to diffuse through the bulk water in
excess, preventing proper conditions for denitrification.

59
Figure 5-7: Bubbles in MABR A during Experiment 3 indicating increased diffusion of
oxygen because nitrate was not removed from the system.
Similar drops in pH were observed. Overgrowth of heterotrophic bacteria is likely the
cause of the unstable pH. As heterotrophic bacteria grow, they can sour a system if they
do not die quickly enough. This souring causes pH to fall and the acidic nature of the
water will limit the natural cycles of other bacteria.
5.5 Experiment 4 – Stabilization Continued Results
The final step in the stabilization process showed similar values for TAN removal. The IC
malfunctioned during this testing and was unable to read the samples for nitrite and
nitrate.

60
The similarity in TAN removal to Experiment 2 and 3 implies that nitrate and nitrite are
likely similar as well. Experiment 4 saw minimal growth of the biofilm but did have an
increased turbidity.
5.6 Experiment 5 and 6 – No Carbon Source Results
Experiment 5 and 6 looked at how the MABR system behaved when there was no
additional carbon added to the system. Results from these experiments were analyzed
out of curiosity but did not add to the overall conclusions for the research. The results
from Experiment 5 included rapidly declining TAN concentrations with nitrogen
concentrations sharply increasing towards the end of the 24 hours. Experiment 6 saw no
movement in either nitrate or nitrite but did have steadily increasing TAN concentrations.
Both experiments showed that there is a minimum carbon requirement for nitrification
and bacteria growth. The bacteria in the MABR system need a minimum amount of
carbon to support the natural reproduction cycle and without that, they instead begin to
die off more rapidly.
MABR A did produce bubbles during Experiment 5 (Figure 5-8), but there is little
indication that this was due to denitrification. Without a carbon source, the bacteria do
not have the appropriate reduction/oxidation (redox) potential to perform nitrification or
denitrification.

61
Figure 5-8: MABR B during Experiment 5 showing bubble formation and sloughing of
biofilm.
Additionally, without a carbon source, the biofilm from the previous experiments began
to slough off. The bacteria in the attached growth began to die and without a proper
carbon source to reproduce, the adhesion of the biofilm to the membrane began to fail.
Overall, there was a net increase in nitrogen of 0.5 mg-N/L/hour during Experiment 6.
However, little movement was seen in both nitrate and nitrite while TAN frequently
increased and decreased. This indicates that without a carbon source, nitrification is
likely not occurring, but instead nitrogen is converted between organic nitrogen and TAN
to contribute to the bacteria’s natural reproduction cycle.

62
5.7 Experiment 7 – Low Glucose Concentration Results
Experiment 7 was run with both the activated sludge bioreactor and MABR B at a 3:1
C:N ratio. Despite using Aqua in both, different results were produced. At hour 55, 10 mL
of wastewater was added to the system to promote increased removal of TAN.
In the activated sludge model, there was no movement in nitrite or nitrate (Figure 5-9).
However, TAN decreased by 33 mg-N/L in the first 55 hours. The addition of wastewater
promoted a rapid reduction in TAN, removing another 20 mg-N/L. After this initial
reduction, TAN began to increase in the system and ended at hour 120 only 7 mg-N/L
lower than the original concentrations. A potential source of this TAN could be
decomposition of biomass. The extended aeration and low C:N ratio produced less
biomass, but the total nitrogen results showed that there was an initial decrease in
biomass concentrations that levels out. Since the total nitrogen results level out despite
the increase in TAN, this may indicate decomposition of organic nitrogen. Since nitrogen
did not leave the system, total nitrogen did not decrease.

63
Figure 5-9: Results for Experiment 7’s activated sludge control.
In MABR B, there was a steady decrease in TAN from 6 hours to 120 hours (Figure 5-
10). The initial increase in TAN is attributed to a concentration gradient between the bulk
water and the biofilm membrane interface where residual TAN ions moved to the less
concentrated bulk water. Despite the decrease in TAN from 117 mg-N/L to 41 mg-N/L,
there was little movement in nitrite or nitrate showing that nitrification was likely still not
occurring. The lack of movement in nitrite or nitrate corresponds to an increase in total
nitrogen showing that TAN is likely being converted into biomass rather than being
oxidized. In the last 20 hours of the experiment, nitrite and nitrate increased by
approximately 10 mg-N/L. Since total nitrogen also began to decrease at this time, it
likely indicates that nitrification was beginning to occur during these last hours.

64
Figure 5-10: MABR B results from Experiment 7
This experiment showed that a 3:1 C:N ratio is capable of providing the carbon
necessary for TAN removal. This low carbon concentration means that the bacteria were
operating in the stationary zone of growth much like a typical septic system which results
in less biomass produced. Despite promoting a decreased biomass, TAN was still likely
being assimilated rather than nitrified, but further studies would need to be conducted to
confirm this.
Another potential explanation for the minimal movement in nitrate is that denitrification is
occurring but cannot be visually captured. This may be because the growth media has
an initial concentration of nitrate in it, so any additional nitrate production/removal is
masked behind that baseline concentration. Future experimentation should remove that
nitrate from the growth media to try and observe whether denitrification is occurring.

65
5.8 Experiment 8 – Large Glucose Concentration Results
After observing the MABR’s functionality under low carbon concentrations, a 30:1 C:N
ratio was used to observe changes in nitrogen removal and biomass production.
Wastewater was also added to this system at hour 55. TAN concentration decreased
rapidly with 55 mg-N/L being removed in the first 55 hours at a steady rate (Figure 5-11).
In previous experiments, TAN was removed similarly, but with intermittent plateaus and
spikes in concentrations. While TAN was removed at a similar rate, the slope of removal
decreased with the addition of wastewater. This is likely due to the BOD5 in the
wastewater having less redox potential than pure glucose.
Figure 5-11: Experiment 8 results using a 30:1 C:N ratio
Experiment 8 saw minimal movement in nitrite and nitrate concentrations, but a
significant production of sludge at the bottom of MABR B. The high C:N ratio promoted
rapid growth of bacteria as enough carbon was in the system to rapidly reproduce and
replace any dead microbes. The increased sludge indicates heterotrophic bacteria

66
growth since they reproduce quickly and die quickly. If heterotrophic bacteria
outcompeted other strains, it is possible that the bacteria capable of the fast removal
rates seen in the first 55 hours died off, causing a slower removal in the later hours of
this experiment.
There are a few potential explanations for the TAN removal and stable nitrate
concentrations. The first is that TAN may be getting assimilated or adsorbed to the
bacteria in the system. The second is that nitrification and denitrification may be
occurring, but due to the baseline concentration of nitrate in the bulk water, it is not
visibly captured. The third is that as pH drops due to nitrification, the system becomes
stagnant in an acidic phase and cannot move forward with either nitrification or
denitrification.
5.9 Experiment 9 – Low Glucose Concentration Replicate Results
Experiment 9 was a replicate of Experiment 7 to further study the movement in nitrite
and nitrate that occurred in the last 20 hours. This time, a 3:1 C:N ratio was used, and
the experiment ran for 191 hours. At hour 55, 10 mL of wastewater was added.
Experiment 9 produced results that had not been seen before (Figure 5-12). TAN
concentrations jumped from 10 mg-N/L to 35 mg-N/L until plateauing at 10 mg-N/L from
55 hours to 191 hours. When TAN plateaued, nitrite grew exponentially from 0 mg-N/L to
83.6 mg-N/L indicating that TAN was being converted into nitrite. At hour 126, nitrite
began to decline. Despite the movement in nitrite, nitrate stayed steady at 0 mg-N/L,
meaning that the background nitrate concentration of approximately 63 mg-N/L was
either denitrified or assimilated. From this data, one conclusion is that the bacteria in the
system are capable of partial nitrification but cannot convert nitrite into nitrate.

67
Figure 5-12: Results from Experiment 9
Additionally, the TAN removal seen in the first 55 hours stopped from hour 55 to hour
191. This could indicate that the bacteria ran out of carbon and were unable to continue
converting the remaining TAN to nitrite. Previous experiment showed that carbon in the
system was consumed by hour 36, which could explain the decline in TAN
concentrations around that time and the eventual plateau.
The main development of Experiment 9 is that at hour 55, MABR B began producing
what were likely black sulfur byproducts and a DO reading showed the bulk water had 0
mg/L of dissolved oxygen (Figure 5-13). A slight odor was detected that aligned with the
“rotten-egg” smell associated with sulfur. From this, it was determined that MABR B had
likely developed an anaerobic zone alongside the aerobic biofilm membrane interface.
Readings for nitrite and nitrate on the IC showed an ionic spike after the nitrate reading
that had not been seen before. Literature on sulfur IC readings showed a similar

68
retention time to the ones seen in Experiment 9’s samples, indicating that there are likely
sulfur compounds being produced in MABR B (Krol, 2000).
Figure 5-13: Images of MABR B at hour 48 (Left) and hour 55 (right)
Alongside the sulfuric odors, MABR B began to release odors that smelled like acetone.
This indicates that another mechanism may have been developing in MABR B. With the
build-up of sludge at the bottom of the reactor, and the often low pH’s, MABR B may
have begun operating as an aerobic digestor that was stalled in the acidogenesis phase.
The acidogenesis phase produces acetates and volatile fatty acids that could give off the
acetone odors (Tchobanoglaus & et.al, 2013). Both pathways could explain the new
results seen in Experiment 9, but further investigation needs to be done before
concluding the mechanism occurring within MABR B.

69
While it would be possible to set-up a new MABR to reset the system, this was the first
time TAN was converted into nitrite successfully. These results were promising and
MABR B continued to be used in the remaining experiments to further study the
anaerobic zone’s nitrogen removal mechanics.
5.10 Experiment 10 – Further Study on MABR B Results
Experiment 10 was identical to Experiment 9 in that a 3:1 C:N ratio was used, and 100
mg-N/L as TAN was added initially. The main difference is that primary effluent
wastewater was not added to MABR B. It is important to note that MABR B continued to
produce “rotten-egg” and acetone odors during this experiment.
TAN steadily declined throughout the 128-hour experiment, removing a total of 12 mg-
N/L (Figure 5-14). The minimal increases in TAN concentrations are likely attributed to
the concentration gradient between the biofilm and the bulk water. Nitrite and nitrate
concentrations were steady. Nitrite’s initial concentration was 26 mg-N/L, showing that
the system continued removing nitrite after Experiment 9 ended with a nitrite
concentration of 41 mg-N/L. Additionally, nitrate concentrations are 3 mg-N/L higher than
the previous experiment, indicating that some nitrite was converted to nitrate during the
transition process.

70
Figure 5-14: Experiment 10 results
Since all parameters were kept identical between Experiments 9 and 10 except the
addition of wastewater, the conclusion from Experiment 10 is that the primary effluent is
adding bacteria capable of SNdN. In the transition between experiments, those bacteria
were likely outcompeted by heterotrophic bacteria causing a stagnation in nitrite and
nitrate concentrations, while TAN declined as expected. The bacteria capable of
consuming TAN and nitrate have likely evolved in the wastewater. This conclusion
indicates that while Aqua is capable of assimilating TAN, it may not be capable of
performing complete nitrification and denitrification.

71
During Experiment 10, MABR B became very black and light could no longer be seen
through the bulk water (Figure 5-15). This resulted in an accumulation of black sludge at
the bottom of the bioreactor set-up. When this sludge was removed, it was thick and
shiny in nature indicating the precipitation of some compound. Further studies should be
conducted on the sludge production of a MABR under anaerobic conditions to determine
what this byproduct is.
Figure 5-15: Image of MABR B during Experiment 10
5.11 Experiment 11 – Wastewater as the Carbon Source Results
Experiment 11 was run with both MABR B and MABR C at a 1:1 C:N ratio with primary
effluent wastewater. The primary effluent had an average BOD5 concentration of 370
mg/L. MABR B received 50 mg-N/L of nitrate while MABR C received 100 mg-N/L of
TAN. MABR B continued to produce sulfur byproducts and had a 0 mg/L DO

72
concentration. MABR C was newly set-up 7 days prior to experimentation and was not
producing any sulfur byproducts.
MABR B produced results that indicated that nitrification occurred (Figure 5-16). Nitrite
concentrations decreased by 119 mg-N/L corresponding with an 81 mg-N/L increase in
nitrate concentrations. This shows that the primary removal pathway of nitrite within
MABR B is the conversion to nitrate. This is confirmed by the low organic nitrogen
concentrations that did not increase or decrease during this experiment. Additionally,
TAN did not appear in the system which indicates the concentration gradient was
minimized and little to no decomposition of organic biomass occurred.
Figure 5-16: Results from MABR B during Experiment 11
MABR C also indicated that nitrification was occurring (Figure 5-17), although it started
with TAN as opposed to the nitrate in MABR B. TAN removal was complete with the
initial concentration of 48 mg-N/L being reduced to below the detection limit. Additionally,

73
nitrite concentrations declined by 40 mg-N/L. Nitrate concentrations grew steadily,
corresponding to the declining nitrite concentrations. In total, nitrate concentrations
increased by 140 mg-N/L. This indicates that nitrification did occur in MABR C.
Figure 5-17: MABR C results from Experiment 11
To further understand the nuances between the long standing MABR B and the newer
MABR C, each nitrogen compound was taken and compared side by side. TAN
concentrations for MABR C show the gradual decline with a sharp decrease in the last 4
hours (Figure 5-18). MABR B did not have TAN introduced, and as such stayed
relatively close to the detection limit for the entire experiment. This shows that TAN will
not be produced in a system with low carbon concentrations that has adapted to the
conditions of the wastewater being treated.

74
Figure 5-18: TAN concentration comparison between MABR B and MABR C
In terms of nitrite, the two MABRs performed similarly (Figure 5-19). In MABR B, nitrite
was removed at a rate of 1.19 mg-N/L/hour while MABR C saw nitrite removal rates of
0.393 mg-N/L/hour. This indicates that the longer a MABR is operating, the faster
nitrogen is removed from the system. This is a common phenomenon where the bacteria
within a system gradually adapt to the conditions. This evolution allows the bacteria
capable of converting nitrite to nitrate to grow more readily, resulting in more efficient
treatment.

75
Figure 5-19: Nitrite comparison between MABR B and MABR C
Both MABRs saw an increase in nitrate concentrations (Figure 5-20). MABR B had a
more consistent, steady increase in nitrate concentrations of approximately 0.808 mg-
N/L/hour. MABR C had a 1.39 mg-N/L/hour increase in nitrate. While MABR C had a
much faster rate than MABR B, it was a less stable increase and indicates a stop-and-go
transition of nitrite to nitrate.

76
Figure 5-20: Nitrate comparison between MABR B and MABR C
During Experiment 11, MABR B and MABR C were set-up next to each other with a split
airline (Figure 5-21). This visualized the difference between MABR B which continued to
produce odors and black by-products and MABR C which is newer and had not yet
undergone this change.

77
Figure 5-21: MABR B (Left) and MABR C (Right) in Experiment 11
5.12 Plating Results
Results from the plating experiments were inconclusive. MABR C’s bulk water was
extremely concentrated in microbes and even diluting the solutions by a factor of 100 did
not produce significant results. From the plates, it was seen that a white colony is
forming, but with the background interference, there is no way to conclude what
microbes are forming in this colony.
5.13 Experiment 12 – Increased Wastewater Ratio Results
Experiment 12 added 100 mg-N/L as TAN and 50 mg-N/L as nitrate to both MABR B
and MABR C with a 2:1 C:N ratio from the wastewater. The primary effluent had an
average BOD5 concentration of 370 mg/L. MABR B continued to produce black
byproducts and odors while MABR C was still the typical brownish color seen in earlier
experiments.

78
In MABR B, TAN concentration initially declined, but after a slight increase in the middle
of the experiment, the final concentration of 22 mg-N/L was identical to the initial
concentrations (Figure 5-22). This is likely the concentration gradient causing TAN to
increase in the bulk water. Due to the MABR being operated as a batch reactor, the lack
of mixing causes pockets of higher TAN concentrations, which can lead to concentration
gradients forming. Nitrite increased by 38 mg-N/L likely from the initial TAN conversions.
Additionally, nitrate was completely removed from the system in the first 6 hours,
indicating that either denitrification or assimilation occurred. However, minimal sludge
was produced in MABR B during Experiment 12 and small bubbles left the system
indicating that denitrification was occurring with some residual nitrite produced.
Figure 5-22: MABR B results from Experiment 12
MABR C experienced the opposite results of MABR B. TAN gradually grew throughout
the experiment, resulting in a net gain of 15 mg-N/L (Figure 5-23). This is likely attributed
to TAN concentrations building up in the biofilm. MABR B experienced similar problems

79
when it was a newer reactor, indicating that MABR C is likely undergoing the same
developments. Nitrite decreased consistently throughout Experiment 12 and reached the
detection limit at hour 70. This correlated with an increase in nitrate. This indicated nitrite
conversion into nitrate, meaning partial nitrification was occurring. Nitrite was lost at a
rate of 0.494 mg-N/L/hour while nitrate increased at a rate of 0.266 mg-N/L/hour,
showing some delay in the conversion process. Nitrate increased by 22 mg-N/L which
does correlate with the decrease in nitrite, making this transition stoichiometrically
sound.
Figure 5-23: MABR C results from Experiment 12
Both MABR B and MABR C experienced some growth in TAN during Experiment 12
(Figure 5-24). The concentration gradient found in both MABRs indicates that there is an
uneven distribution of TAN in the influent wastewater causing there to be less
concentrated zones. In the small, laboratory-scale bioreactor, this concentration gradient

80
results in diffusion that is noticeable and impactful. This incomplete mixing is inhibiting
the reduction of TAN, which can cause issues for effluent total nitrogen concentrations.
Figure 5-24: Comparison of TAN concentrations in MABR B and MABR C
Nitrite behaved differently in MABR B and MABR C (Figure 5-25). In MABR B, nitrite
increased significantly throughout the 74 hours while MABR C saw complete removal
over the same time period. Interestingly, MABR B gained nitrite at a rate of 0.511 mg-
N/L/hour while MABR C lost nitrite at a rate of 0.494 mg-N/L/hour. This indicates that the
nitrite is coming from nitrate in MABR B. Nitrite is converting into nitrate in MABR C. This
shows that the conversion rate of nitrite to nitrate for the bacteria inside these MABR’s is
consistent at approximately 0.5 mg-N/L/hour.

81
Figure 5-25: Nitrite comparison for Experiment 12 between MABR B and MABR C
Nitrate also behaved differently between MABR B and MABR C (Figure 5-26). MABR B
removed all the nitrate within the first 6 hours and maintained a concentration below the
detection limit (0.25 mg-N/L) for the rest of the experiment. MABR C experienced a 22
mg-N/L increase in nitrate. The only difference between the two MABRs is the black
byproducts in MABR B indicating that the removal mechanisms are different between the
two MABRs.

82
Figure 5-26: Nitrate comparison between MABR B and MABR C for Experiment 12
5.14 Limiting Factors
Multiple factors limit nitrogen removal in a MABR including pH and temperature, DO
concentrations, C:N ratios, and general growth kinetics and behavior of the attached and
suspended growth. Additional complications were experienced during this research with
experimental methods such as the IC and the Hach total nitrogen kits.
5.14.1 pH and Temperature Impacts
Limiting factors such as pH and temperature primarily affect the behavior of bacteria in
the system. In general, nitrification and denitrification can occur in a pH range from 6.5 to
8.0 and temperatures from 17 °C to 25 °C (Environmental Protection Agency, 2009).
While this is a good guideline to follow, each biological system will form different
colonies that behave ideally under certain pH and temperature ranges.

83
The MABR was set-up with the goal of maintaining a pH between 6.5 and 8.0 and each
experiment had a different pH during it. When a new MABR was set-up, there were initial
issues with pH dropping too rapidly (from 7.0 to 4.3) and that was alleviated by the
addition of sodium bicarbonate to prevent souring the system. Through the twelve
experiments and the total of 3 different MABRs, a correlation between nitrogen removal
rates and pH levels was seen. In general, the MABRs were unable to effectively remove
nitrogen (often gaining more nitrogen) at the lower and upper extremes of the typical pH
ranges. Table 5-1 compares the average pH of each experiment to the nitrogen removal
rates. Positive rates indicate nitrogen gained, while negative rates indicated nitrogen
removed.

84
Table 5-1: Comparison of pH to nitrogen removal rates
Experiment pH
TAN
Removal
(mg-N/L/hr)
Nitrite
Removal
(mg-N/L/hr)
Nitrate
Removal
(mg-N/L/hr)
Net Nitrogen
Removal
(mg-N/L/hr)
Experiment 1
MABR A
6.5 1.001 0 0 1.001
Experiment 2
MABR A
6.5 -2.4 0.31 10.89 8.8
Experiment 3
MABR A
6.2 -2.93 0.31 -0.03 -2.6
Experiment 4
MABR A
5.9 0 0 0 0
Experiment 5
MABR A
6.51 -1.62 -7.61 0.02 -9.21
Experiment 6
MABR A
7.1 0.0022 0.0022 -0.015 -0.011
Experiment 7
MABR B
7.2 -0.17 0.07 0.04 -0.06
Experiment 8
MABR B
7.3 -0.45 -0.0013 0 -0.45
Experiment 9
MABR B
6.9 -0.081 0.14 0 0.059
Experiment 10
MABR B
7.3 -0.061 0 0 -0.061
Experiment 11
MABR B
MABR C
7.4
6.7
0
-0.29
-0.766
-0.26
0.53
0.9
-0.239
0.35
Experiment 12
MABR B
MABR C
7.2
7.55
0.0055
0.14
0.33
-0.32
-1.15
0.17
-0.82
0
In general, the MABR removed nitrogen the most consistently at a pH range of 7.0 to
7.4. While Experiment 3 and 5 showed the fastest removal rates, this is likely due to the

85
rapid growth of bacteria leading to increased assimilation rates. Additionally, the MABRs
had unstable pH levels during initial startup, but once experimentation continued, all
three MABRs evened out at a pH between 7.0 and 7.4 indicating this is the ideal
operational range for a MABR system. This shows that future applications of this system
will not require alkalinity additions after the initial startup phase.
In terms of temperature, the MABR seemed to operate within the typical range from 17
°C to 25 °C. Temperatures in the lab never rose above 20 °C, but there was one
instance where temperature fell to 15 °C, which did result in microbial death. Future
applications of this technology should require the MABR to be set in the ground to
prevent freezing temperatures from interfering with nitrogen removal.
5.14.2 Dissolved Oxygen
Another concern with the MABR is whether oxygen will properly diffuse through the
membrane. Nitrification requires oxygen to occur, and without enough DO, TAN
oxidation will be inhibited. Additionally, to achieve a proper anoxic and or anaerobic zone
in the bulk water, there cannot be excess dissolved oxygen. Ensuring the oxygen
diffusing through the membrane is enough for nitrification, but not too much to inhibit
denitrification is a careful balance.
To properly measure the DO inside the biofilm, a microDO probe is required. However, a
microDO probe was not available during this research. Theoretical design calculations
were done to understand the mass transfer of oxygen required for nitrification and the
theoretical mass transfer of oxygen occurring from the membrane.
First, Equation 4 was used to determine the mass of oxygen diffusing through the
membrane per unit of area (Tchobanoglaus & et.al, 2013). Permeability was assumed to

86
be 6,579 x 10-11 cm2
s cmHg from the literature review. Area of the silicone membrane was 210
cm2 using MABR B as a reference point.
Volume = Permeability*A*t*(P2-P1)
thickness ………………………………………………………… (4)
This showed that the membrane could produce a volume of 9,525 cm3 over 5 days.
Converting this to a mass using density showed that the membrane was capable of
diffusing 1,429 grams of O2 per m3. Using Equation 5, the rate of diffusion was found
(Tchobanoglaus & et.al, 2013).
Rate of Diffusion = Mass of gas per area
Time ………………………………….……….…… (5)
Equation 5 showed the silicone membrane can diffuse 152 grams of O2 per day. To fully
understand if this was enough for nitrification, theoretical design equations for oxygen
requirements in a biological treatment system were used to determine the bacteria’s
requirement for nitrification (Tchobanoglaus & et.al, 2013). Equation 6 and Equation 7
were used with Experiment 12’s data.
Ro=Q*(So-S)-1.42Pxbio+ 4.57Q(NOx) …..……………………………………………… (6)
Where: Ro = oxygen requirement for nitrification
Q = flowrate
So = initial carbon concentration
S = final carbon concentration
Pxbio = active biomass concentration
NOx = concentration of TAN converted into nitrate

87
PX,bio=QY(So-S)
1+(kd)SRT+
(fd)(kd)QY(So-S)SRT
1+(kd)SRT+
QYn(NOx)
1+(kdn)SRT …………………………………….. (7)
Where: Y = yield of heterotrophic bacteria
Kd = decay rate of heterotrophic bacteria
SRT = solids retention time
Fd = fraction of biomass that is non-volatile
Yn = yield of nitrifying bacteria
Kdn = decay rate of nitrifying bacteria
Flow rate (or volume displaced from the batch reactor per day) was estimated as 325
L/day, initial carbon concentration was 300 mg/L, final substrate concentration was 0.7
mg/L, and concentration of TAN converted into nitrate was 34.4 mg/L after accounting
for the portion of TAN assimilated into biomass. Using these values in Equations 6 and 7
showed that the biofilm requires 150 grams of O2 per day.
Theoretically, the silicone membrane is diffusing just enough oxygen for the nitrification
process to occur, with approximately 2 grams of O2 in excess. This is supported by the
consistent removal of TAN within the MABR systems. However, theoretical design
equations for biological treatment are often imprecise due to the variable nature of
bacteria and environmental factors. To completely confirm proper DO diffusion through
the MABR, a microDO probe will need to be purchased and an oxygen profile will need
to be created.
5.14.3 Carbon Source and Concentration
Another limiting factor for biological treatment is the C:N ratio and where the carbon is
coming from. This is due to nitrification and denitrification being driven by redox

88
potentials. Using a purer form of carbon, such as glucose, has a higher redox potential
than typical BOD5 found in wastewater. Experiments 11 and 12 looked at using
wastewater as the carbon source (BOD5 concentration of approximately 370 mg/L) to
determine if the bacteria in the MABRs could utilize BOD5 as the main carbon source.
Experiments 8 and 9 also used wastewater, although not as a carbon source, but as a
way to introduce wastewater bacteria to the system. Table 5-2 shows the average
nitrogen removal rates for each C:N ratio and carbon source.
Table 5-2: Carbon to Nitrogen Ratio Impacts on Nitrogen Removal Rates
C:N Ratio Carbon
Source
TAN
Removal
(mg-N/L/hr)
Nitrite
Removal
(mg-N/L/hr)
Nitrate
Removal
(mg-N/L/hr)
Net
Removal
(mg-N/L/hr)
1:1 Wastewater -1.96 -0.790 1.10 0.114
1:1.5 Glucose -9.96 1.04 39.1 30.2
2:1 Wastewater 0.109 0.008 -10.8 -10.7
3:1 Glucose -0.400 0.056 0.037 -0.306
3:1 Wastewater -0.329 1.052 0 0.724
30:1 Glucose -1.02 0 0.002 -1.02
The rates shown in Table 5-2 indicate that the best removal of nitrogen occurred at a
30:1 C:N ratio with glucose and then at a 2:1 C:N ratio with wastewater. Overall, the
wastewater removal rates are more promising because they consistently involve the
removal of TAN with minimal increases in nitrite. The 3:1 C:N ratio with wastewater
experienced an overall growth in nitrogen, but this was the first instance of TAN
conversion to nitrite and is indicative of a healthy system, just one that is undergoing a
change.

89
Ultimately, the MABR performed more ideally in experiments that had wastewater as
either a micro dose or as the main source of carbon showing that the wastewater was
introducing other constituents or bacteria that allowed nitrification and denitrification to
occur more readily. Experiment 9 had the first instance where TAN readily transferred
into nitrite. Experiment 11 and 12 both showed the fastest nitrogen removal rates for
MABR B at a low C:N ratio. While MABR C performed differently under the same
conditions, this is attributed to the newer bacteria in this system adjusting to the
operational conditions.
The increased nitrogen removal with wastewater was likely due to the more diverse
bacterial cultures formed. When a pure form of carbon like glucose is used,
heterotrophic bacteria can overgrow and sour a system leading to nitrifying bacteria
being outcompeted. This is due to heterotrophic bacteria being quick growing and
utilizing the carbon to reproduce. When wastewater is used, with a lower redox potential,
heterotrophic bacteria are less likely to overgrow due to the ability of other bacteria to
process the BOD5 in a more productive way. The wastewater promoted a more diverse
biofilm culture and suspended growth, leading to increased nitrogen removal.
In conventional wastewater treatment, C:N ratios are typically between 10:1 to 20:1. This
is typical in activated sludge basins where heterotrophic bacterial growth is promoted to
increase BOD5 oxidation. However, in the MABR, the closed environment makes it more
difficult to remove sludge, and overgrowth of bacteria could damage the integrity of the
biofilm, making a lower C:N ratio more desirable. Low C:N ratios would promote growth
in the stationary phase where the growth rate of bacteria will equal the death rate. This
creates a more stable biofilm.
Most of the experiments used a C:N ratio from 1:1 to 3:1, except for Experiment 8 that
used a 30:1 ratio. While Experiment 8 did have the fastest removal rates, it primarily
90
removed TAN through assimilation which is not the ideal removal pathway. Additionally,
significant sloughing of the biofilm was observed. When glucose was used as a carbon
source, a 3:1 ratio was the most consistent in removing nitrogen without causing
overgrowth of the biofilm. Minimum sludge production was seen and the MABR had a
more stable pH. When wastewater was used as the carbon source at a 1:1 and 2:1 ratio,
nitrogen removal occurred in MABR B. This indicates that when wastewater is the main
carbon source, the C:N ratio can be low in well-established MABR systems. These
experiments were conducted with high-strength wastewater (nitrogen concentrations of
approximately 100 mg-N/L), but this will likely hold true for medium-strength wastewater
as well.
5.14.4 Biofilm and Suspended Growth
The type of bacteria growing in the biofilm and bulk water is vital to the treatment
process. While the microbiology experiments proved inconclusive, theoretical growth
and removal equations were used to estimate heterotrophic and nitrifying bacterial
growth in MABR B. Aqua is primarily composed of heterotrophic bacteria which is why
this growth was also modeled.
Using Experiment 7’s nitrogen data, the time for carbon depletion and nitrogen removal
was estimated using batch reactor design equations (Equation 8 and 9). Table 5-3
shows the conventional growth rate kinetics used for calculations.
Ks ln (So
S) + (So-St) = X (
μm
Y) t ………………………………….………….……...……. (8)
Where: Ks = half saturation constant
X = concentration of biomass
μ m = maximum growth rate

91
t = time of consumption
KN ln (No
Nt) + (No-Nt) = XN (
μnm
YN) t ………………………………………………..……. (9)
Where: KN = half saturation constant
No = initial nitrogen concentration
Nt = nitrogen concentration at time t
XN = concentration of nitrifying biomass
μ nm = maximum growth rate of nitrifiers
Yn = yield of nitrifiers
Table 5-3: Growth Rate Kinetics Used in Calculations (Tchobanoglaus & et.al, 2013)
Parameter Heterotrophic
Bacteria Units
Nitrifying
Bacteria Units
K 8 gbCOD/m3 0.5 gNH4-N/m3
μ 6 gVSS/gVSS*day 0.75 gVSS/gVSS*day
Y 0.45 gVSS/gbCOD 0.15 gVSS/gNH4-N
These calculations indicated that the carbon was fully removed from MABR B in
Experiment 7 at hour 8.6, while the nitrogen removal seen should have occurred in 2.84
hours. In actuality, the nitrogen removed during Experiment 7 occurred over 120 hours.
While theoretical equations have some inaccuracy within them, the actual removal rate
should be closer to the calculated 2.84 hours. Since the discrepancy between the design
equation and the actual removal rate is so large, this indicates the bacteria promoted in
Aqua are not capable of nitrification.

92
Next, the biomass growth rate for different C:N ratios was found for MABR B to see
whether operating at a low C:N ratio was inhibiting growth significantly or not. Equation
10 models heterotrophic growth and Equation 11 models nitrifier growth (Tchobanoglaus
& et.al, 2013).
μ = e(T-15)Y (S
Ks+S) - kd ……………….……….……………………….…………..……. (10)
μN = e(T-15)Y (
N
KsN+N) - kdN …………………………………………...…..…………..… (11)
Experiment 8, 9, 11, and 12 were all modeled using Equations 10 and 11 to see growth
rate kinetics at a 30:1, 3:1, 1:1, and 2:1 C:N ratio. Table 5-4 shows the results of these
calculations.
Table 5-4: Growth Rate Kinetics at Different C:N ratios
Experiment C:N Ratio Growth Rate (d-1)
8 30:1 1.89
9 3:1 1.8
11 1:1 1.75
12 2:1 1.82
These calculations show that a C:N ratio of 1:1 result in a much lower growth rate than
other C:N ratios. However, a C:N ratio of 30:1 is not significantly higher than a C:N ratio
of 2:1, indicating that MABRs and the biofilm’s growth are not inhibited at low C:N ratios.
This means the MABR can treat high strength wastewater, or medium strength
wastewater, both with relatively low sludge production.
However, growth rate kinetics of nitrifying bacteria were calculated to be 0.431 days 1.
This is less than half the growth rate of heterotrophic bacteria. While the MABRs were
operated with a 7 to 10 day solids retention time, long enough for nitrifier growth, Aqua is

93
primarily heterotrophic bacteria. These heterotrophic bacteria were promoted within the
system, allowing them to outcompete the nitrifiers. This explains the inconsistent results
seen in the MABR in the first experiments after set-up. Likely, the newer the MABR was,
the more unstable the biofilm was due to the fast-dying heterotrophic bacteria. After the
first few experiments, the biofilm stabilized with the slower growing nitrifying bacteria,
allowing for more consistent nitrogen removal.
5.14.5 Experimental Methods
During experimentation, the IC’s suppressor broke multiple times. The first instance
occurred prior to testing Experiment 6’s data. Luckily, those samples were already
filtered and frozen, allowing for minimum decay in nitrate and nitrite. The suppressor was
replaced, and analysis continued like normal. However, after testing Experiment 7, the
suppressor began to leak, indicating the membranes were broken and the eluent was
flooding the suppressor. The suppressor was once again replaced, and the IC
functioned ideally for the rest of the research. After each suppressor was replaced, a trial
sample set was run that included blanks and standards to ensure the IC was reading
concentrations properly and new calibration curves were created.
Additional issues include the systemic errors seen in the Hach total nitrogen test. The
Hach test itself has an approximately 16% error due to the multiple reagent packets and
inconsistent heating of samples. The spectrophotometer used to analyze the absorbency
added an additional 4% error. This meant that the total nitrogen data often did not pass
quality assurance and quality control procedures, including those for blanks and
standards. Total nitrogen concentrations were included for visualization of data, but the
actual total nitrogen concentration is unknown, and therefore no conclusions can be
drawn about the mass of nitrogen lost to the atmosphere.

94
Chapter 6 – Conclusion
The objectives of this research included observing the effects of carbon source and
concentration on nitrogen removal rates, understanding attached and suspended growth
rates and behaviors, using theoretical equations to see if the MABR is behaving in an
expected way, and confirming Aqua’s ability to augment a biological treatment system.
The research done answered some questions, created some questions, and left some
questions unanswered. This chapter will detail the conclusions drawn, potential
improvements to the design and experimental methods, and future work
recommendations.
6.1 Final Conclusions
C:N ratio and carbon source were concluded to have large impacts on the operational
capabilities of a MABR. The two carbon sources compared were glucose and
wastewater with C:N ratios ranging from 0:1 to 30:1. From the data analysis, low C:N
ratios of around 3:1 for glucose and 2:1 for wastewater resulted in consistent nitrogen
removal of approximately 0.306 mg-N/L/hour and 10.5 mg-N/L/hour respectively. This
indicates that the MABR removes nitrogen at a faster rate with wastewater than glucose.
This aligns with theory because glucose has a higher redox potential than wastewater
which would result in heterotrophic bacteria overgrowth. Heterotrophic bacteria can
remove nitrogen, but at much slower rates than bacteria that are genetically designed to.
Additionally, while the 30:1 C:N ratio (using glucose as the carbon source) removed TAN
at a faster rate than other experiments, it averaged at a 1.02 mg-N/L/hour removal rate.
This is approximately ten times less than that of the 2:1 wastewater system. From this, it
was concluded that the MABR can handle lower C:N ratios effectively. This means that
MABRs are capable of treating high strength or low strength wastewater alongside

95
traditional medium strength, giving this system versatility not often seen in other
biological treatment systems.
Another conclusion from the C:N ratio experiments was that the biofilm was much more
stable at lower C:N ratios. Experiment 8 (30:1 C:N ratio) was the only time the biofilm
sloughed off, and a large accumulation of sludge occurred at the bottom of the
bioreactor. Since the MABR can remove nitrogen at low C:N ratios, it is operationally
ideal to keep that ratio low in future operations. This prevents the build-up of sludge
which can be complicated to remove in a membrane system like a MABR.
Traditionally, carbon concentration has a relatively significant impact on the growth rate
of bacteria. However, theoretical calculations showed that there was not a significant
difference in growth rate between a 3:1 and a 30:1 C:N ratio. This further promotes the
conclusion that a MABR is better suited to lower C:N ratios as this will be easier to
operate and opens the door to more applications than just traditional domestic
wastewater treatment.
During initial experimentation with a new MABR, pH would rapidly decline without the
production of nitrite/nitrate. This indicates that the pH drop was not due to nitrification,
but rather overproduction of heterotrophic bacteria. After approximately 3 experiments
(estimated 3 to 4 weeks), the MABR stabilized and began to perform nitrification and
denitrification like intended. While pH was used as an indicator of performance, it was
not concluded to have a significant impact on the MABR as long as it was monitored
effectively. Similarly, this shows that the MABR requires a longer start-up phase than
conventional activated sludge systems. The MABR operated best when allowed a week-
long inoculation period and did not treat nitrogen efficiently until an average of 3.5 weeks
of operation. The start-up period should be further assessed prior to implementation.

96
The last aspect of this research focuses in on the bacteria introduced to the system.
Aqua is primarily formed of heterotrophic bacteria, while wastewater will promote a large,
biologically diverse environment. Experiments 1 through 8 were done using pure Aqua
cultures (no wastewater introduced to the system). These experiments experienced
variable removal rates, a lack of nitrification and denitrification, and averaged a removal
rate of 1.30 mg-N/L/hour.
Mixed cultures of Aqua and wastewater (Experiments 9 through 10 where only small
volumes of wastewater were introduced) resulted in the production of sulfur, indicating
that some facultative anaerobes were introduced to the system. While this was not seen
in previous research endeavors, this resulted in the first ideal conversion of TAN into
nitrite, and later into nitrate indicating that the new bacteria were able to process
nitrogen in a way that Aqua could not. These experiments resulted in nitrogen removal
rates averaging 10.5 mg-N/L/hour. Full wastewater systems (where the main source is
wastewater, with contributions from Aqua in the biofilm) had the most success in
converting nitrogen to different forms and ultimately removing nitrogen at the fastest
rates. While Experiments 11 and 12 still averaged around 10.5 mg-N/L/hour removed,
these experiments saw the fastest removal rate, at a low C:N ratio, of 21.3 mg-N/L/hour.
Additionally, using theoretical batch reactor equations and activated sludge equations,
the nitrogen removal seen in various experiments was expected to occur within 3 to 10
hours. However, in systems where Aqua was the sole contributor to the biomass, the
time of removal was 120 hours. This indicates that Aqua is not capable of removing
nitrogen at the rate necessary for traditional wastewater treatment systems. However,
when wastewater was introduced to the system, the nitrogen removal rates and the time
to achieve low concentrations did align more closely with theoretical equations. From

97
this, it was concluded that Aqua does not increase nitrogen removal rates significantly
past that of typical wastewater bacteria.
6.2 Proposed Improvements to Design
The main problems experienced with the small-scale MABR design included sludge
removal, incomplete mixing, and airline control. Additionally, the background
concentration of nitrate in the growth media caused confusing results and should be
replaced with a salt-based micronutrient. In future iterations of the MABR’s design, it is
recommended to design an effective method for sludge removal that will not disrupt the
system and biofilm. Currently, to remove all the sludge produced, the bioreactor needs
to be unscrewed from the base which can cause jostling of the membrane. This can
result in biofilm losses that may put back the experimentation a week or so to stabilize.
Alongside removal, leaving the sludge at the bottom during the entirety of the experiment
resulted in anaerobic gas production that lead to odors.
This research was conducted using the bioreactor as a batch treatment unit. This made
it difficult to clean out between experiments and there was approximately 10 to 20 mL
left of the bulk water from the previous experiment when the next experiment began.
This was due to the way the bioreactor was attached to the base. Excess water not
sampled was drained from the bottom, as dumping it out of the top would result in
biomass loss. The exit valve for the bioreactor does not reach the full bottom of the
system, resulting in some leftover water in the bottom. This can lead to unexpected
nitrogen concentrations that cause a discrepancy in the nitrogen balances. In future
iterations, it is recommended to operate it at a low flow rate to promote constant
movement of water. This should also prevent the formation of the concentration gradient
seen during this research.

98
The airline should be reconfigured to have a pressure gauge on the exit of the airline to
observe head losses through the silicone membrane. This can lead to further analysis on
oxygen diffusion and oxygen flow rates that is more precise and less estimated based on
pressure. Additionally, the wall air compressor is efficient, but is occasionally shut off for
department maintenance. It is recommended to find a more reliable source of
compressed air for future experiments.
Next, the MABR should be scaled up in a controlled way to observe macroscale
reactions. Many issues experienced with pH and DO were detrimental to the biomass in
the small-scale MABR due to the microscale setting. If a larger system was used,
changes would be less impactful to the overall constitution of the biomass and real-world
situations could be tested.
6.3 Proposed Improvements to Experimental Methods
Experimental methods throughout this research were relatively consistent. However,
microbiology experiments were inconclusive and total nitrogen analyses were rife with
errors. For future work, it is recommended to collaborate with a microbiology researcher
to accomplish and create a profile for the bacteria creating the biofilm versus those in the
bulk water. This will lead to a deeper understanding of the mechanics for nitrogen
removal in the MABR.
The Hach total nitrogen analysis has a 20% systemic error that drastically affects the
viability of the results. Future researchers should consider running total suspended
solids, volatile suspended solids tests, and carbonaceous oxygen demand (COD) tests
to track biomass production. If biomass production rates were known, the organic
nitrogen loading could be estimated from there. Additionally, it may be possible to test
for total kjeldahl nitrogen, which can provide organic nitrogen concentrations when

99
tested alongside TAN. This should be investigated as a new experimental method for
future research to complete a nitrogen balance on the MABR.
6.4 Future Work Recommendations
For future researchers looking into a MABR system, there are a few facets this research
was unable to get to: oxygen diffusion and DO concentrations, effects of temperature on
the system, and sludge production. Future work should also include scaling-up the
MABR and experimenting with flow rates, along with exploring the removal pathways of
assimilation, and the causes for why MABR B became either anaerobic or began
experiencing aerobic digestion.
Oxygen diffusion and DO concentrations through the biofilm and bulk water cannot be
properly analyzed without a microDO probe. While theoretical equations showed that
enough oxygen is diffusing for nitrification, this is just an assumption, and future work
should include a DO profile from the membrane to the center of the bulk water to
develop a diffusion curve.
Temperature was largely ignored as a factor during this research. However, temperature
can affect DO concentrations, oxygen diffusivity rates, and biological activity. Future
work should include analysis of the MABRs performance under cold and hot
temperatures to understand the full limitations of the system. This may indicate that a
MABR needs external heating and or cooling during the winter and summer seasons.
Sludge production in the MABR will vary from other systems due to the combined nature
of attached and suspended growth. The volume of sludge, characterization of sludge,
and the moisture content should be determined in future studies. This will allow for
understanding of how to integrate a MABR into a centralized wastewater treatment
system where the operators will need to handle the sludge produced. Additionally,

100
analysis of the sludge’s constituents may yield potential byproducts that can be
recovered.
Future researchers should consider scaling up the MABR system to analyze nitrogen
removal under different flowrates. Finding optimal flowrates through the MABR system
will increase its ability to treat nitrogen and other constituents. Additionally, the right
flowrate will minimize the number of dead zones where no mixing occurs and should
result in the concentration gradient seen during this research disappearing. Scaling up
the MABR will present unique challenges that operators will experience upon
implementation of a MABR. These will likely include finding a way to seal the system to
prevent passive air diffusion, while allowing nitrogen gas to vent off from the system,
securing the membranes in a larger tank, and general maintenance requirements for
optimal functionality. Research should include membrane spacing, sizing, and piping
required to accomplish treating nitrogen with a MABR in a full-scale setting.
The main questions developed during this research was whether assimilation was
occurring, and the cause of and implications of MABR B becoming either anaerobic with
sulfur compounds or stalled in the acidogenesis phase of aerobic digestion. These are
two missing pieces that could increase understanding of the MABR’s removal pathways
if studied further.
The MABR is a viable way to perform SNdN. It can treat high strength wastewater at low
C:N ratios. This makes it a promising option for implementation in all settings,
particularly domestic and industrial wastewater treatment or agricultural runoff treatment.
Future research can scale this design up to conclude whether a MABR will be able to
offset wastewater treatment land requirements and costs for communities needing to
treat nitrogen.

101
Works Cited
Arakaki, J. (2018). Study of the Effect of BiOWiSH Aqua on Simultaneous Nitrification
and Denitrification in a Membrane Aerated Bioreactor. San Luis Obispo:
California Polytechnic State University.
Araki, N., Akiyoshi, O., Machdar, I., & Harada, H. (1999). Behaviors of nitrifiers in a novel
biofilm reactor employing hanging sponge-cubes as attachment site. Water
Science & Technology.
BiOWiSH Technologies. (2016, May 18). Safety Data Sheet. Cincinnati, Ohio.
BiOWiSH Technologies. (2016). Thousand Trails - Chesapeak Bay, USA. BiOWiSH
Technologies.
BiOWiSH Technology. (2016). Surface Water Tire Lake, Turkey. BiOWiSH.
City of San Luis Obispo. (2015). Water Resource Recovery Facility. San Luis Obispo:
City of San Luis Obispo.
Daigger, G., & Littleton, H. (n.d.). Mechanism for Simultaneous
Nitrification/Denitrification and Biological Phosphorus Removal in Orbal Oxidation
Ditches and Their Full-Scale Application. ResearchGate.
Environmental Protection Agency. (2009). Nutrient Control Design Manual State of
Technology Review Report. Office of Research and Development.
Environmental Protection Agency. (2013, August 22). Final Aquatic Life Ambient Water
Quality Criteria For Ammonia - Freshwater 2013. Retrieved from Federal
Register - The Daily Journal of the United States Government:
https://www.federalregister.gov/documents/2013/08/22/2013-20307/final-aquatic-
life-ambient-water-quality-criteria-for-ammonia-freshwater-2013

102
Environmental Protection Agency. (2019). Nutrient Pollution. Retrieved from United
States Environmental Protection Agency: https://www.epa.gov/nutrientpollution/
General Electric Co's. (2017). MABR increases treatment capacity within existing plant
footprint. Membrane Technology.
George Tchobanoglaus, e. (2013). Wastewater Engineering: Treatment and Resource
Recovery. McGraw-Hill Education.
Gorsuch, Roberts, & Showell. (2012). Aerobic nitrification and denitrification among
heterotrophic bacterial isolates. BiOWiSH Technologies.
Haibing, S., & Cloud, A. (2004). Macroscale and Microscale Analyses of Nitrification and
Denitrification in Biofilms Attached on Membrane Aerated Biofilm Reactors.
Water Research.
Hill, P. (2014, July 17). Sources & Treatment of Lagoon Ammonnia. Retrieved from
TriplePoint Water Technologies: http://www.triplepointwater.com/sources-
treatment-lagoon-ammonia/#.XCloDfZFzZs
Krol, J. (2000, February). Ion Chromatography Analysis Methods and Issues. Waters
Corporation.
McCarty, P. (2018). What is the Best Biological Process for Nitrogen Removal: When
and Why? Stanford: Environmental Science & Technology.
Meers, & Pedersen. (1972). Nitrogen Assimilation by Bacillus licheniformis Organisms
Growing in Chemostat Cultures. Microbiology.
Montana State. (2010). Bacteria in a Biofilm Have Different Characteristics than the
Same Bacteria in Isolation. Retrieved from Biofilms:

103
https://www.cs.montana.edu/webworks/projects/stevesbook/contents/chapters/ch
apter001/section006/green/page002.html
Moreau, M., Liu, Y., & Capdeville, B. (1994). Kinetic behaviorr of heterotrophic and
autotrophic biofilms in wastewater treatment processes. Water Science &
Technology.
Novak, J., Goldsmith, C., Benoit, R., & O'Brien, J. (2019). Methanol in Wastewater
Systems. Retrieved from Environmental Business Specialists, LLC:
https://www.ebsbiowizard.com/methanol-usage-in-wastewater-systems-2-2-
3561/
Perez-Calleja, Aybar, Picioreanu, Esteban-Garcia, Martin, & Nerenberg. (2016). Periodic
venting of MABR lumen allows high removal rates and high gas-transfer
efficiencies. Water Research.
Sigma-Aldrich. (2019). Microbiology Introduction. Retrieved from Sigma-Aldrich:
https://www.sigmaaldrich.com/technical-
documents/articles/microbiology/microbiology-introduction.html
Summers, V. (2019). What Are the Causes of High Nitrates & Nitrites in Wastewater?
Retrieved from Seattlepi: https://education.seattlepi.com/causes-high-nitrates-
nitrites-wastewater-3344.html
Tchobanoglaus, & et.al. (2013). Wastewater Engineering: Treatment and Resource
Recovery. McGraw-Hill Education.
Terada, A., & et.al. (2003). Nitrogen removal characteristics and biofilm analysis of a
membrane-aerated biofilm reactor applicable to high-strength nitrogenous
wastewater treatment. Tokyo: Journal of Bioscience and Bioengineering.

104
ThermoScientific. (2012). Dionex ICS-1600 Ion Chromatography System Operator's
Manual. ThermoScientific.
Timberline Instruments. (2017). TL-2800 Ammonia/Nitrate Analyzer System Instruction
Manual. Timberline Instruments.
Uemoto, H., & Saiki, H. (2000). Distribution of Nitrosomonas europaea and Paracoccus
denitrificans Immobilized in Tublar Polymeric Gel for Nitrogen Removal. Applied
and Environmental Microbiology.
Walter, B., & Haase, C. (2005). Combined nitrification/denitrification in a membrane
reactor. Water Research.
Waltz, K. (2009). Simultaneous Nitrification and Denitrification of Wastewater Using a
Silicone Membrane Aerated Bioreactor. San Luis Obispo: California Polytechnic
State University.
Williams, A. (2017, September). The Rise of MABR Technology: Is the Future
Bubbleless? Retrieved from WaterWorld:
https://www.waterworld.com/articles/wwi/print/volume-32/issue-5/technology-
case-studies/the-rise-of-mabr-technology-is-the-future-bubbleless.html
Zhang, L., & Narita, Y. (2017). Maximum specific growth rate of anammox bacteria
revisted. Water Research\.
Zhou, Weili, & et.al. (2011). Autotrophic Denitrification for Nitrate and Nitrite Removal
Using Sulfur-Limestone. Egyptian Journal of Medical Human Genetics.
Recommended