© 2015 Honeywell International
0
A Real-time & Predictive
Process Safety DashboardDr.ir. Bert Knegtering, Honeywell SMS
Process Safety congress – Dordrecht, 30 May 2018
© 2015 Honeywell International
Vision / Business case
• Offering a ‘safety dashboard’ for the process industry
• Real-time information wrt the actual, previous and upcoming (predictive)
safety ‘level’
• Combine data / information sources beyond the ‘DCS/SIS’
• Deterministic as well as probabilistic
• How to make use of IoT and BIG data?
HOW SAFE IT IS AT A CERTAIN PLACE AT A CERTAIN MOMENT IN
TIME?
1
© 2015 Honeywell International
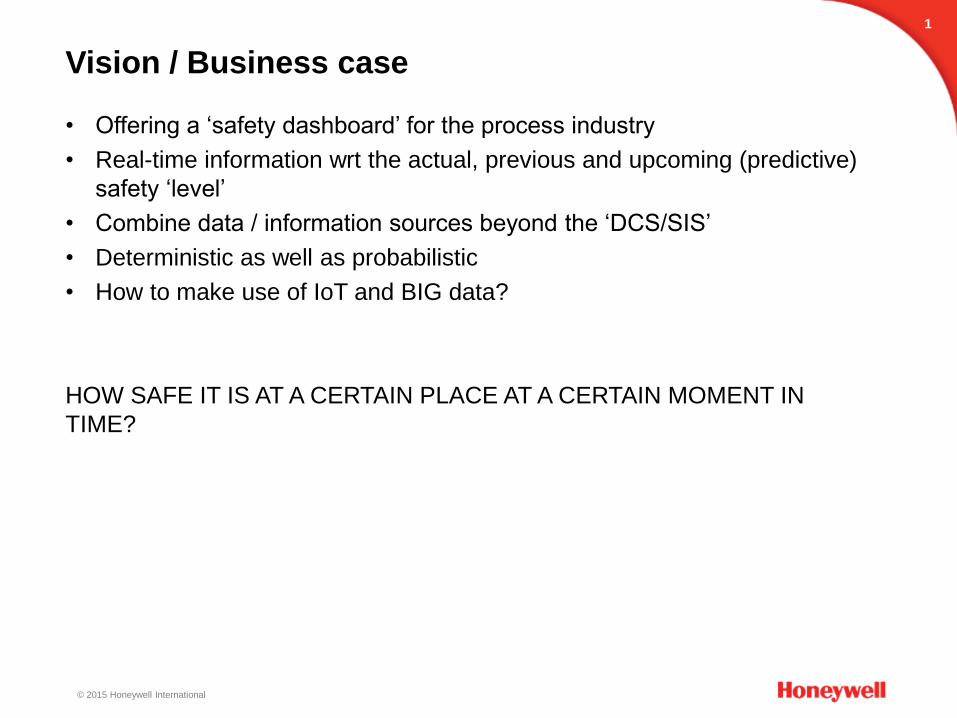
BP Texas, March 2005
© 2015 Honeywell International
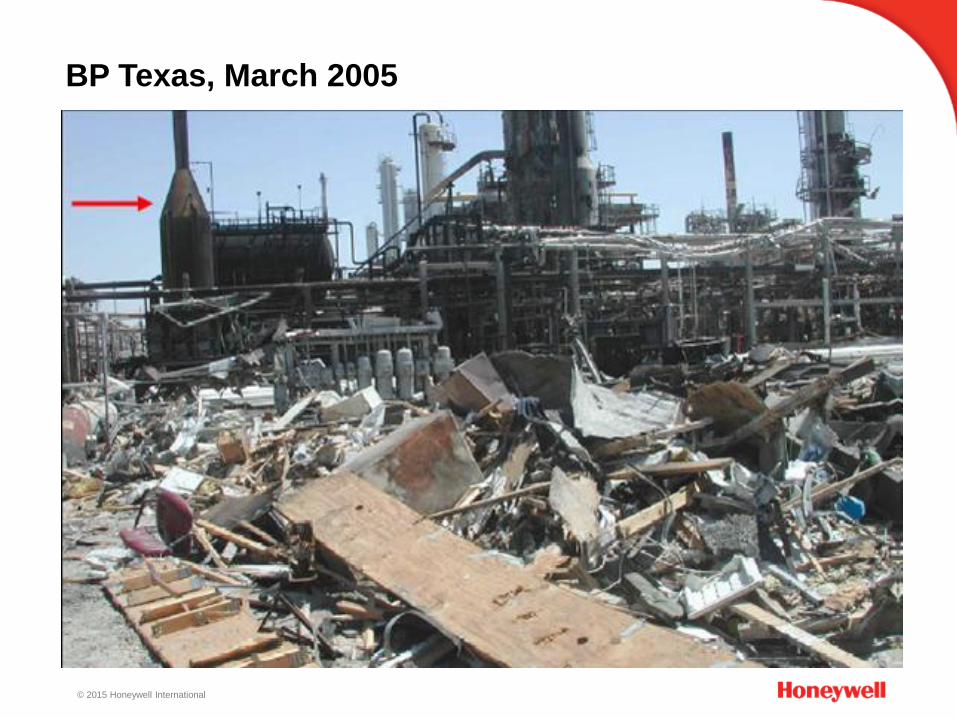
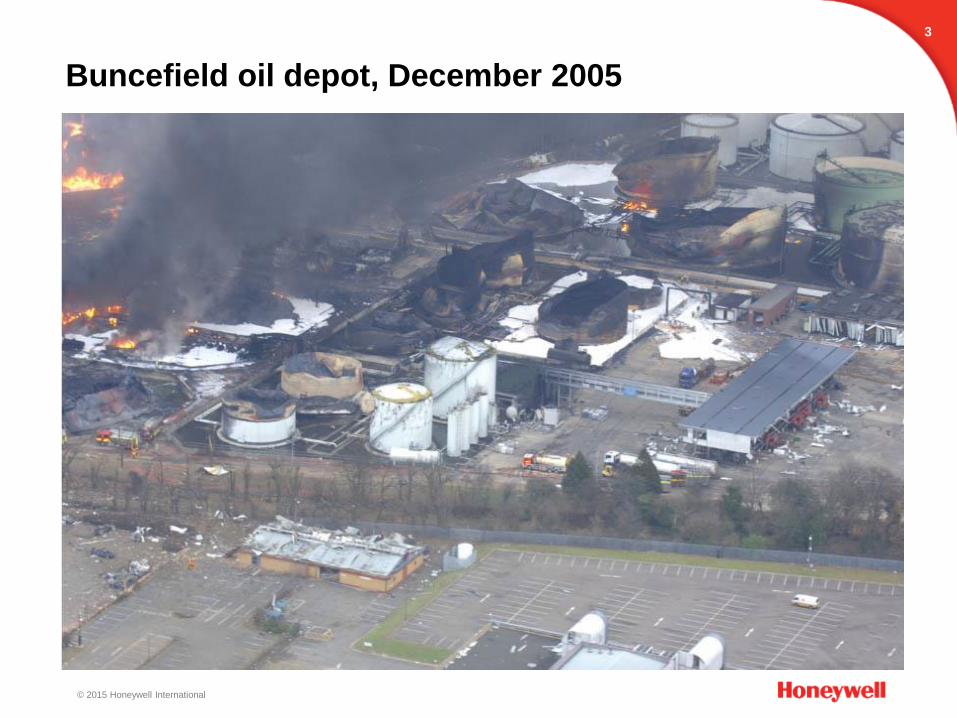
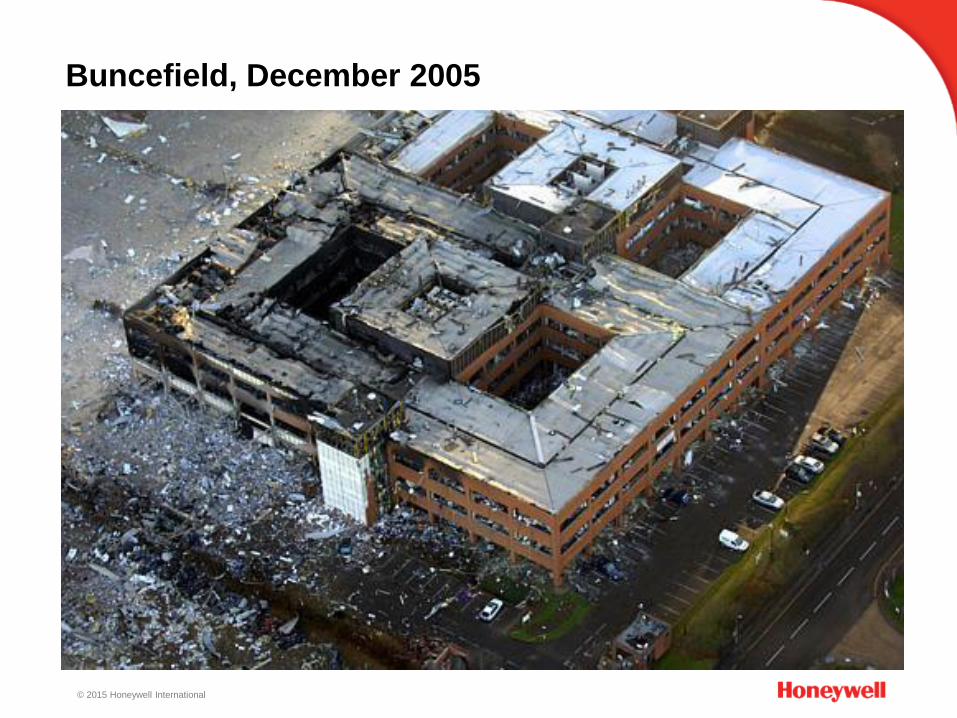
Buncefield oil depot, December 2005
3
© 2015 Honeywell International
Buncefield, December 2005
© 2015 Honeywell International
5
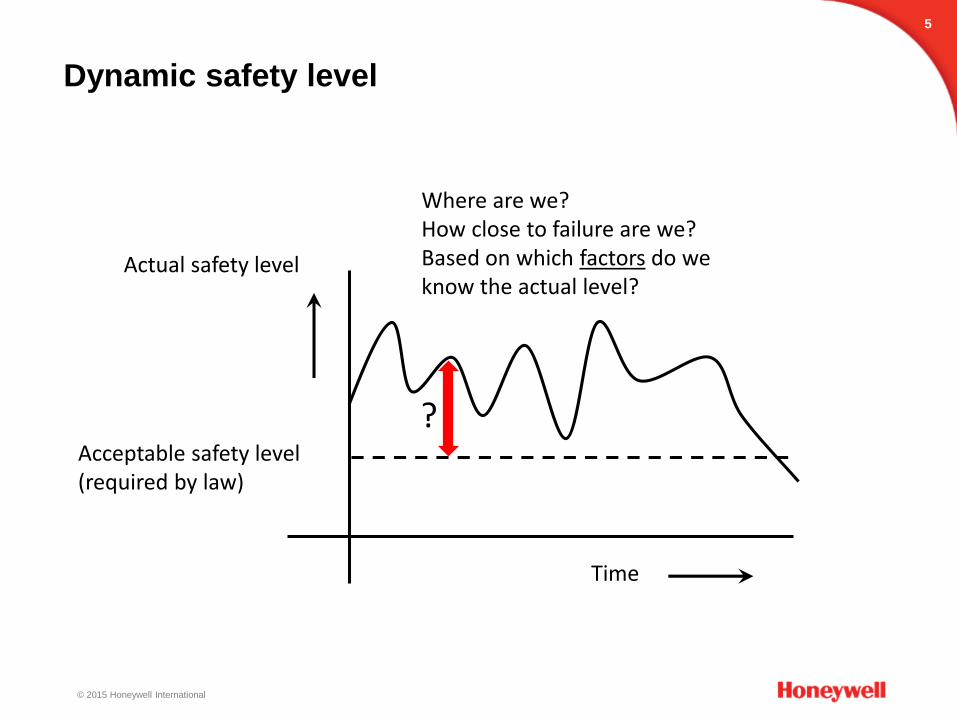
Dynamic safety level
Actual safety level
Time
Acceptable safety level(required by law)
Where are we?How close to failure are we?Based on which factors do we know the actual level?
?
© 2015 Honeywell International
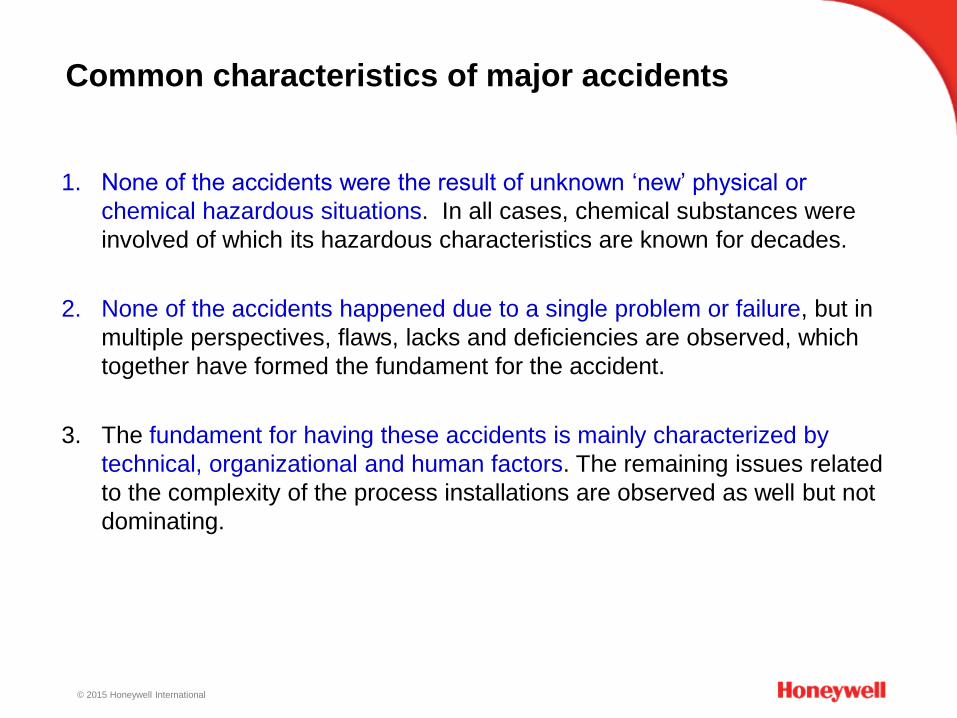
Common characteristics of major accidents
1. None of the accidents were the result of unknown ‘new’ physical or
chemical hazardous situations. In all cases, chemical substances were
involved of which its hazardous characteristics are known for decades.
2. None of the accidents happened due to a single problem or failure, but in
multiple perspectives, flaws, lacks and deficiencies are observed, which
together have formed the fundament for the accident.
3. The fundament for having these accidents is mainly characterized by
technical, organizational and human factors. The remaining issues related
to the complexity of the process installations are observed as well but not
dominating.
© 2015 Honeywell International
7
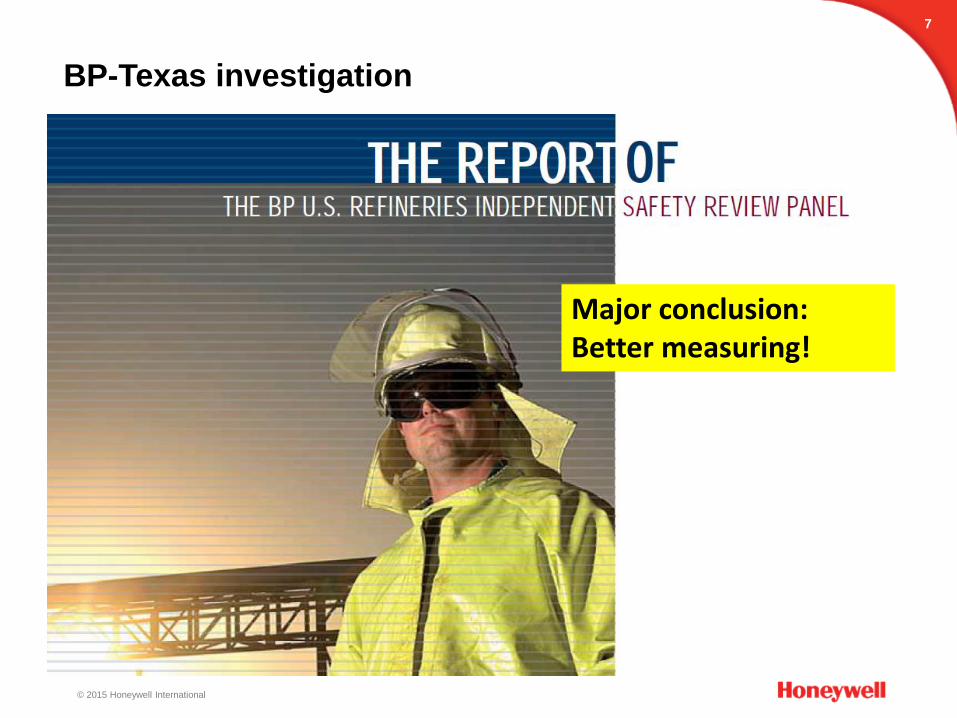
BP-Texas investigation
Major conclusion:Better measuring!
© 2015 Honeywell International
8
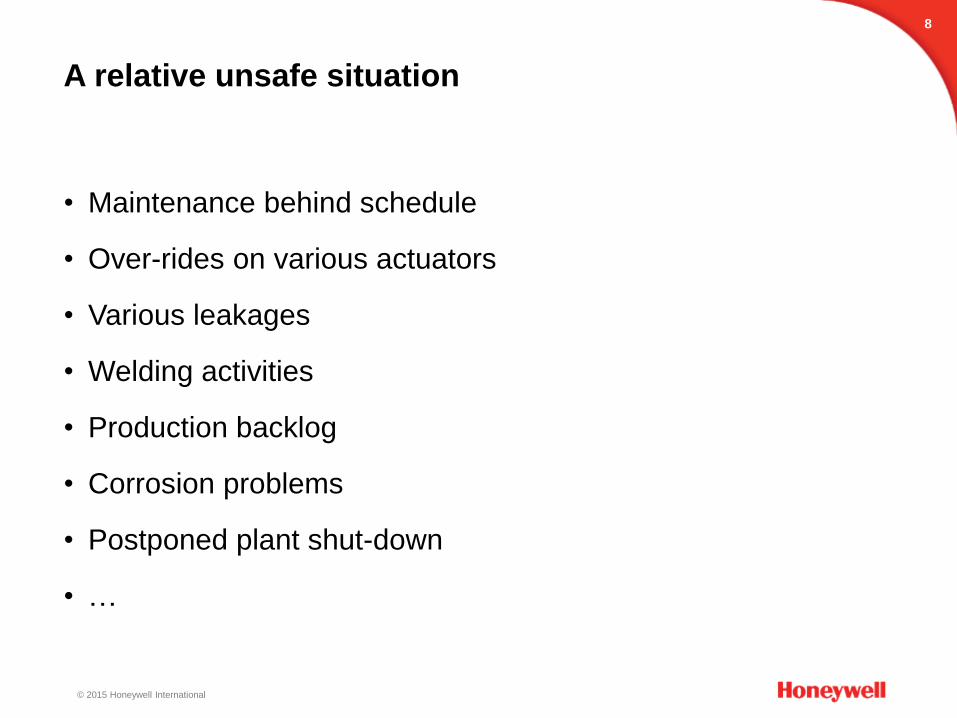
A relative unsafe situation
• Maintenance behind schedule
• Over-rides on various actuators
• Various leakages
• Welding activities
• Production backlog
• Corrosion problems
• Postponed plant shut-down
• …
© 2015 Honeywell International
9
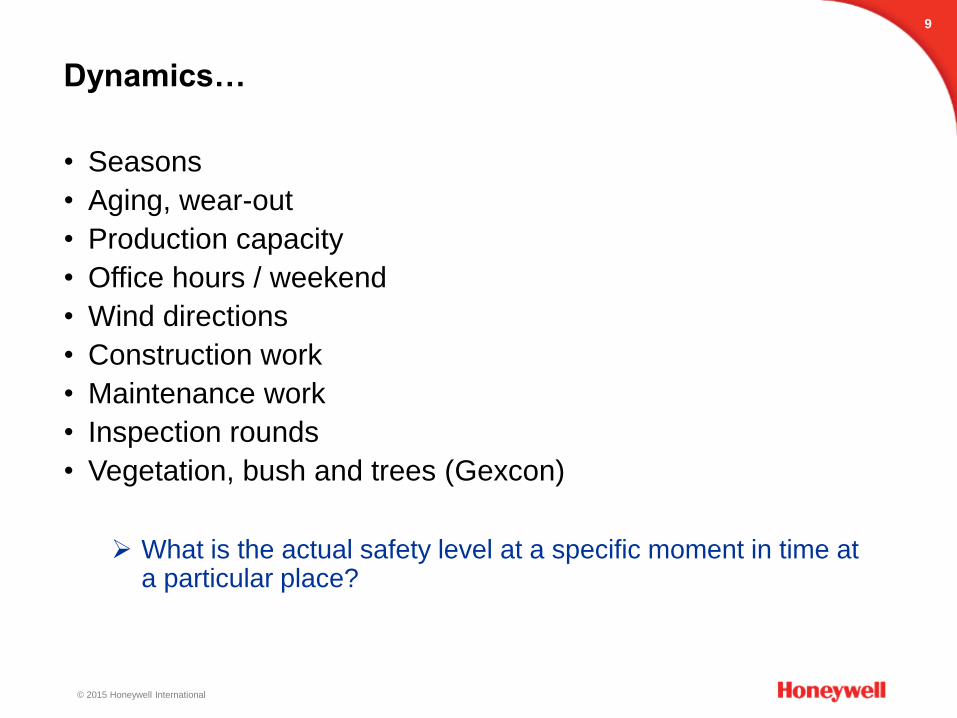
Dynamics…
• Seasons
• Aging, wear-out
• Production capacity
• Office hours / weekend
• Wind directions
• Construction work
• Maintenance work
• Inspection rounds
• Vegetation, bush and trees (Gexcon)
What is the actual safety level at a specific moment in time at a particular place?
© 2015 Honeywell International
10
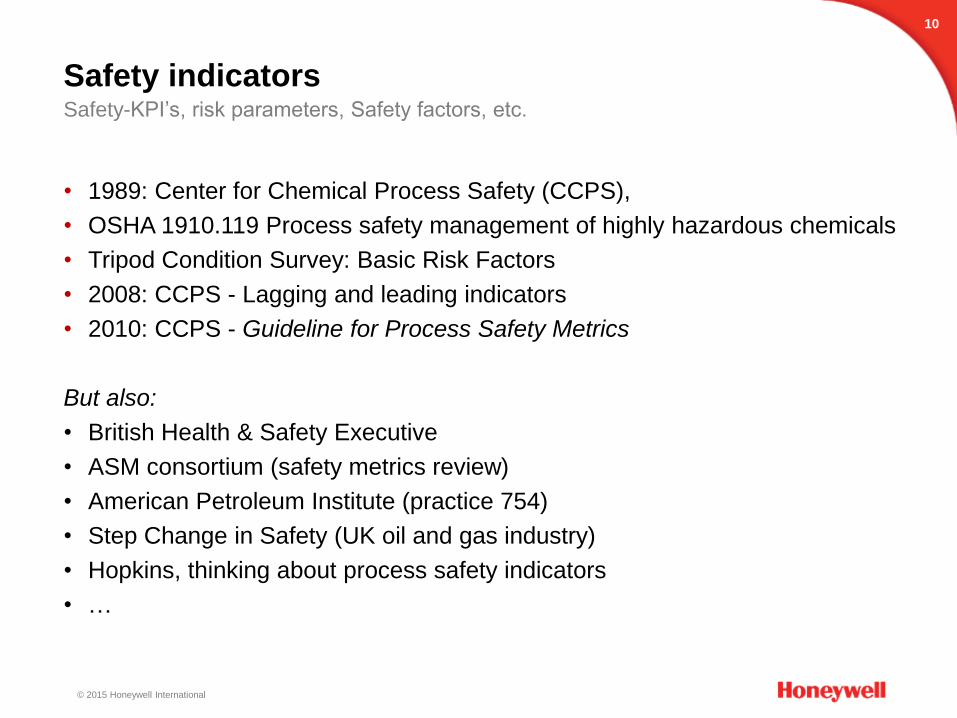
Safety indicatorsSafety-KPI’s, risk parameters, Safety factors, etc.
• 1989: Center for Chemical Process Safety (CCPS),
• OSHA 1910.119 Process safety management of highly hazardous chemicals
• Tripod Condition Survey: Basic Risk Factors
• 2008: CCPS - Lagging and leading indicators
• 2010: CCPS - Guideline for Process Safety Metrics
But also:
• British Health & Safety Executive
• ASM consortium (safety metrics review)
• American Petroleum Institute (practice 754)
• Step Change in Safety (UK oil and gas industry)
• Hopkins, thinking about process safety indicators
• …
© 2015 Honeywell International
11
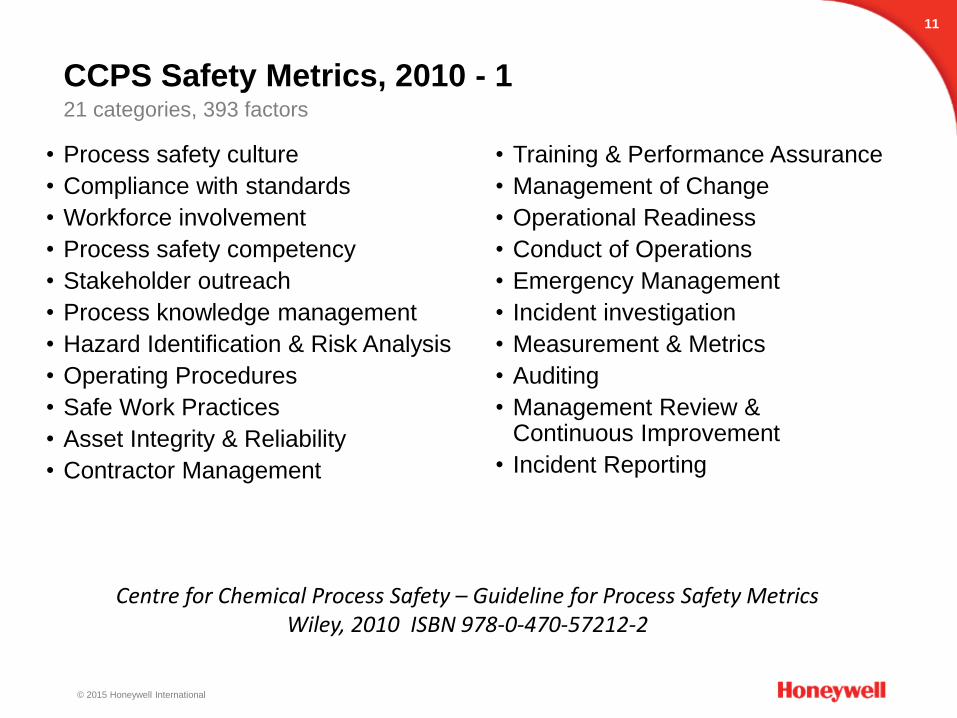
CCPS Safety Metrics, 2010 - 121 categories, 393 factors
• Process safety culture
• Compliance with standards
• Workforce involvement
• Process safety competency
• Stakeholder outreach
• Process knowledge management
• Hazard Identification & Risk Analysis
• Operating Procedures
• Safe Work Practices
• Asset Integrity & Reliability
• Contractor Management
• Training & Performance Assurance
• Management of Change
• Operational Readiness
• Conduct of Operations
• Emergency Management
• Incident investigation
• Measurement & Metrics
• Auditing
• Management Review & Continuous Improvement
• Incident Reporting
Centre for Chemical Process Safety – Guideline for Process Safety MetricsWiley, 2010 ISBN 978-0-470-57212-2
© 2015 Honeywell International
12
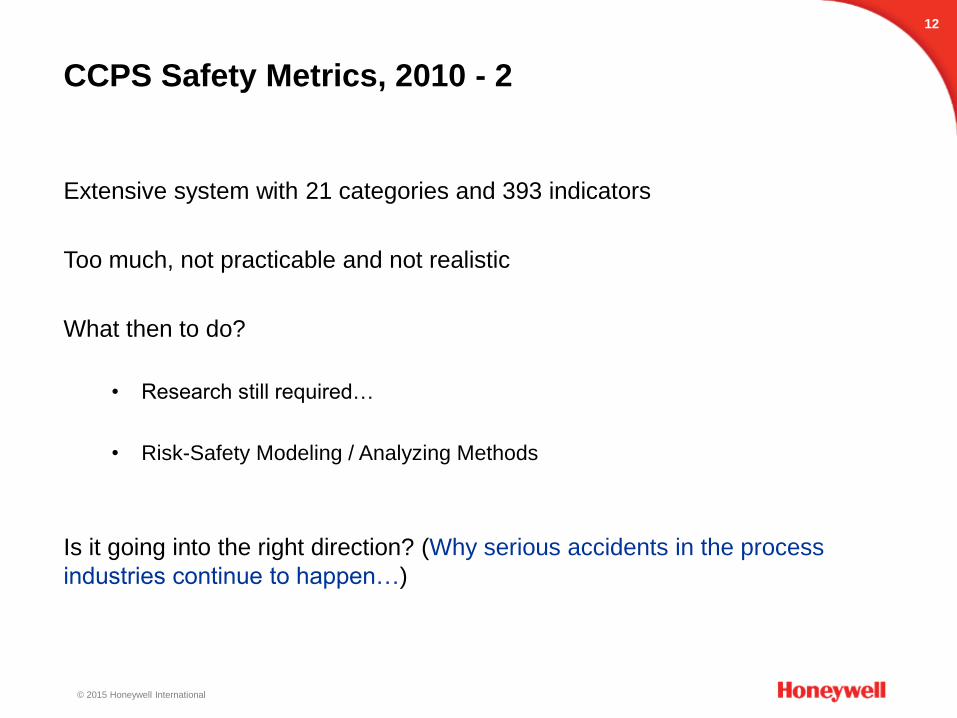
CCPS Safety Metrics, 2010 - 2
Extensive system with 21 categories and 393 indicators
Too much, not practicable and not realistic
What then to do?
• Research still required…
• Risk-Safety Modeling / Analyzing Methods
Is it going into the right direction? (Why serious accidents in the process
industries continue to happen…)
© 2015 Honeywell International
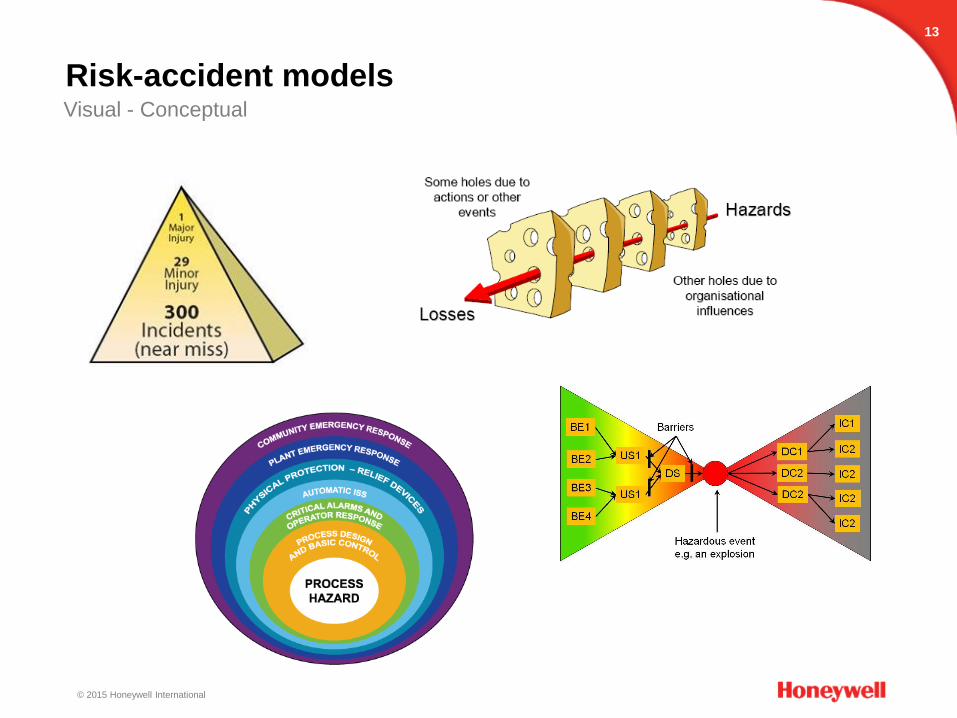
Risk-accident models
13
Visual - Conceptual
© 2015 Honeywell International
14
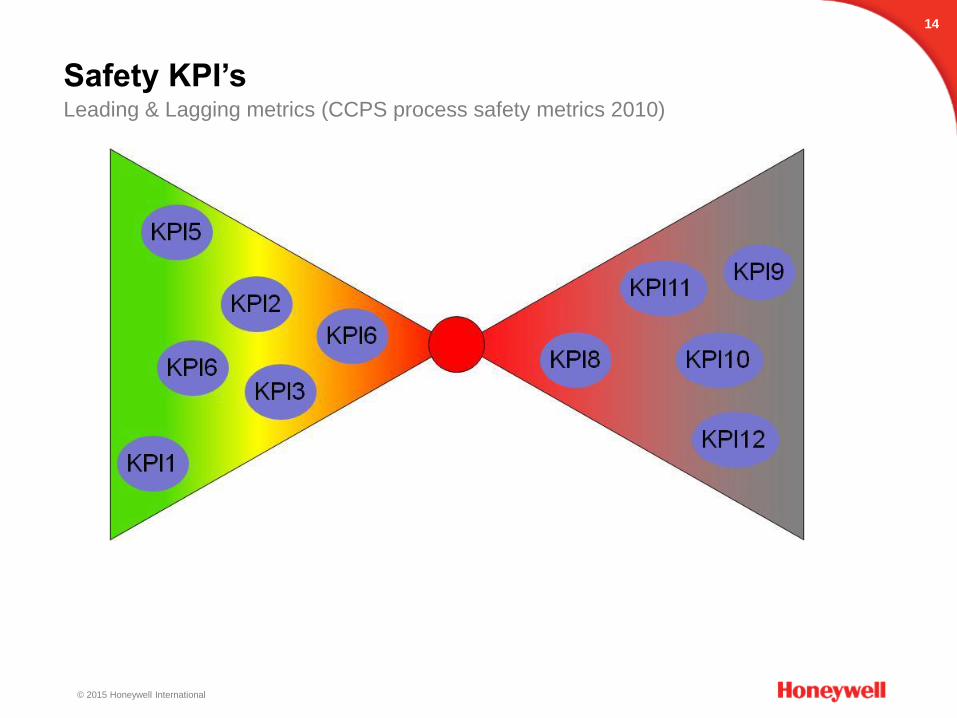
Safety KPI’sLeading & Lagging metrics (CCPS process safety metrics 2010)
© 2015 Honeywell International
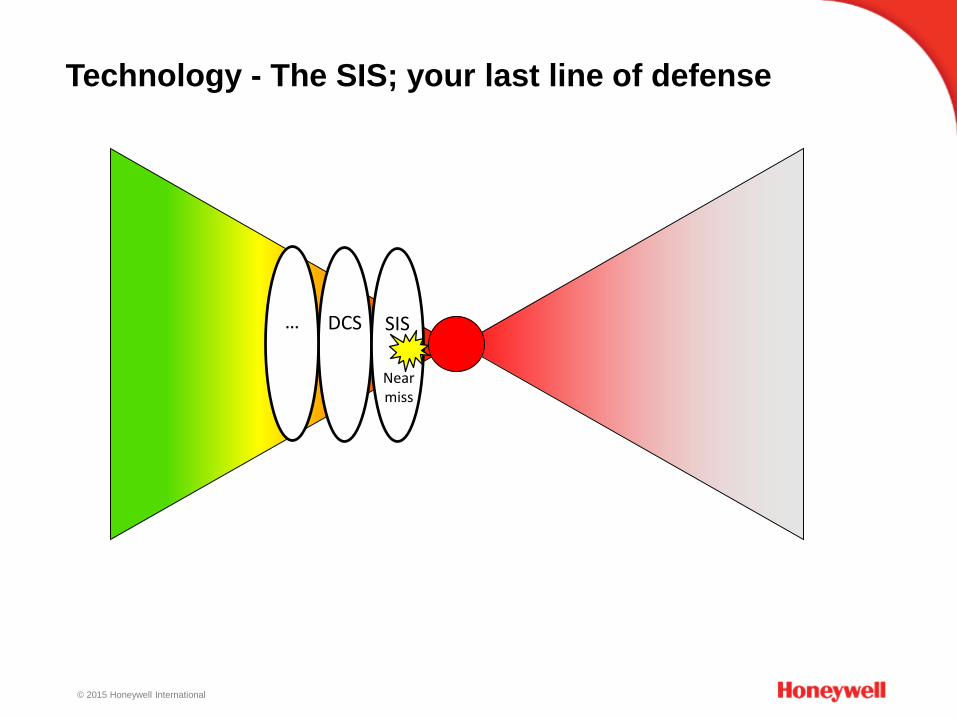
DCS SIS…
Nearmiss
Technology - The SIS; your last line of defense
© 2015 Honeywell International
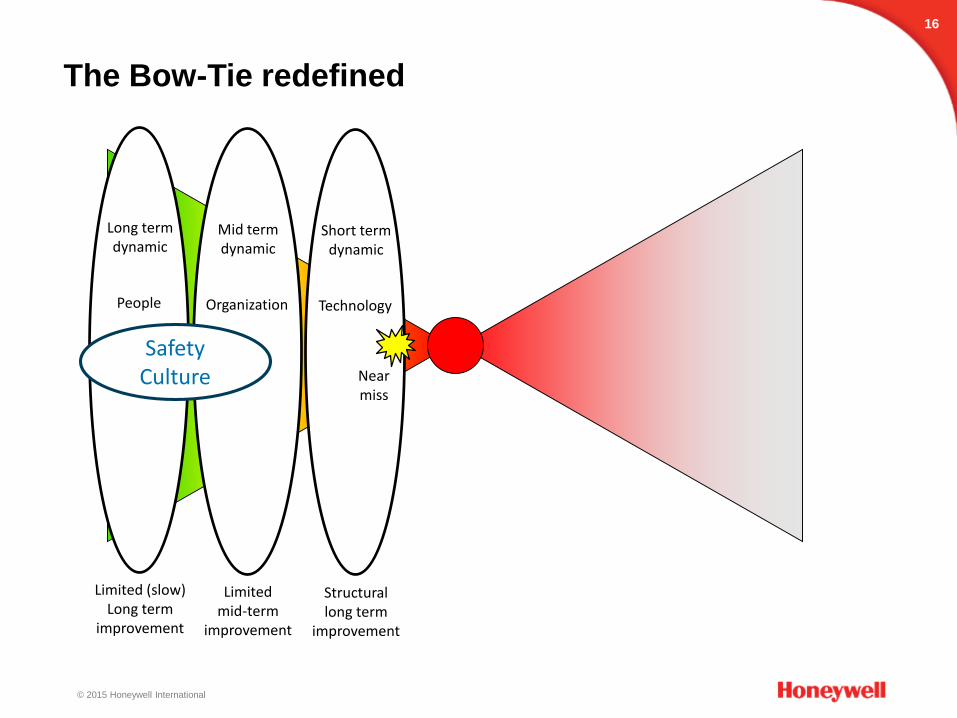
16
The Bow-Tie redefined
People Organization Technology
Short termdynamic
Long termdynamic
Mid termdynamic
Structurallong term
improvement
Limited (slow)Long term
improvement
Limitedmid-term
improvement
SafetyCulture Near
miss
© 2015 Honeywell International
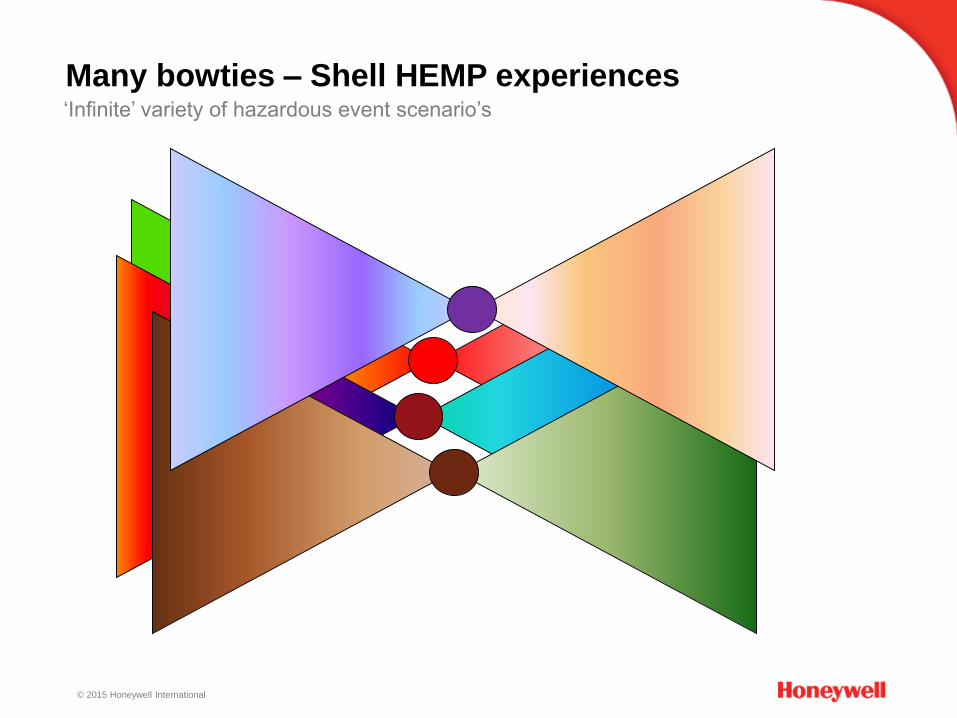
Many bowties – Shell HEMP experiences‘Infinite’ variety of hazardous event scenario’s
© 2015 Honeywell International
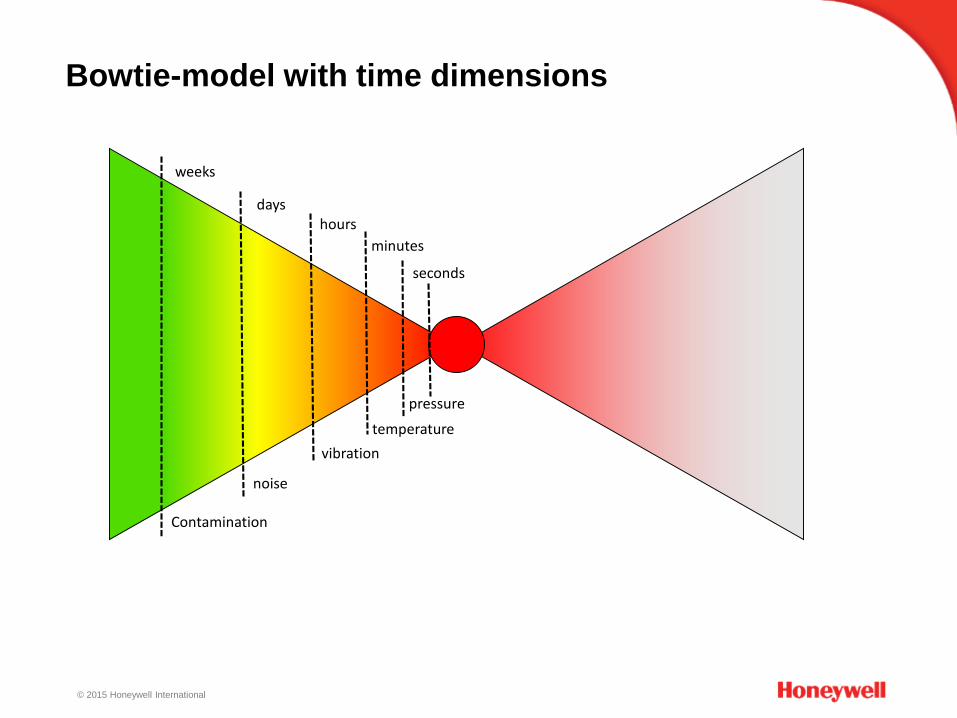
Bowtie-model with time dimensions
seconds
minutes
hoursdays
weeks
pressure
temperature
vibration
noise
Contamination
© 2015 Honeywell International
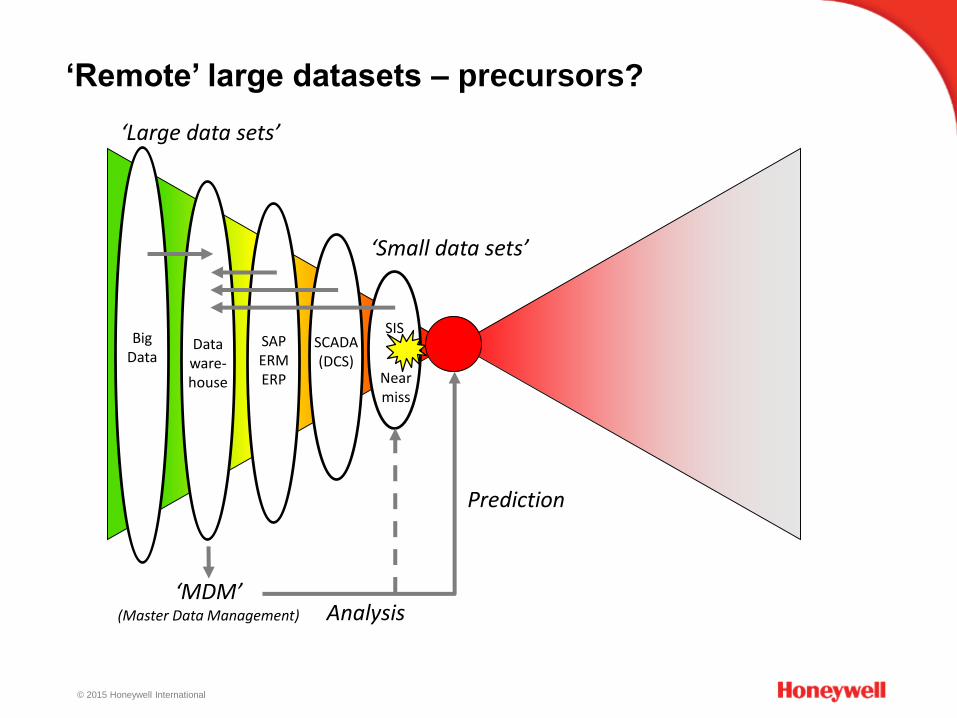
‘Remote’ large datasets – precursors?
SCADA(DCS)
SISBig
Data
Nearmiss
Dataware-house
SAPERMERP
‘Large data sets’
‘Small data sets’
‘MDM’(Master Data Management)
Prediction
Analysis
© 2015 Honeywell International
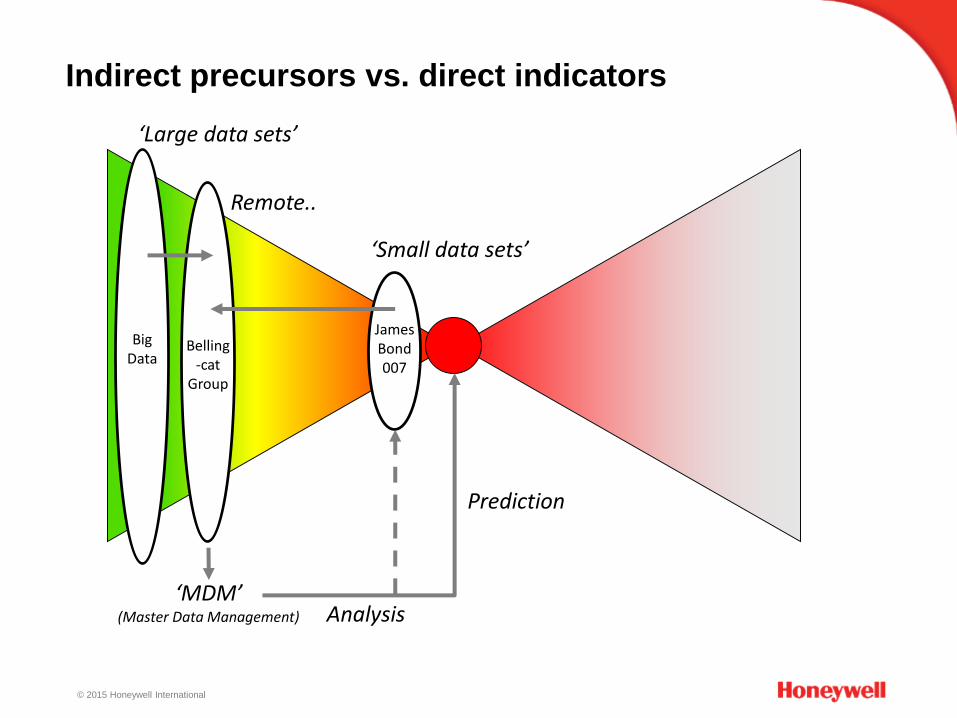
Indirect precursors vs. direct indicators
JamesBond007
BigData
Belling-cat
Group
‘Large data sets’
‘Small data sets’
‘MDM’(Master Data Management)
Prediction
Analysis
Remote..
© 2015 Honeywell International
21
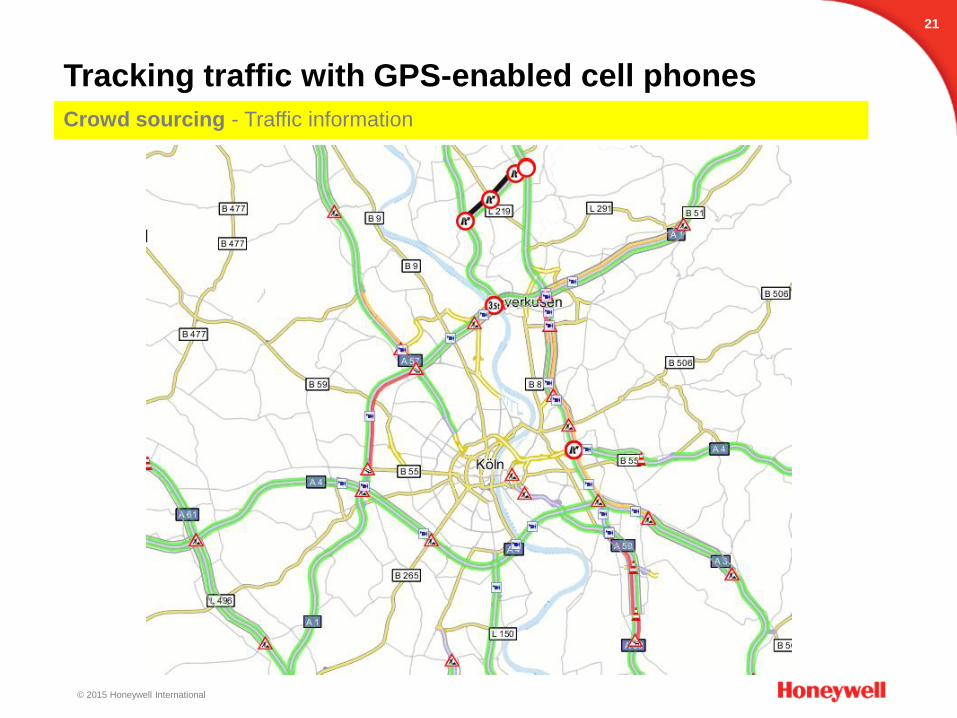
Tracking traffic with GPS-enabled cell phones
Crowd sourcing - Traffic information
© 2015 Honeywell International
22
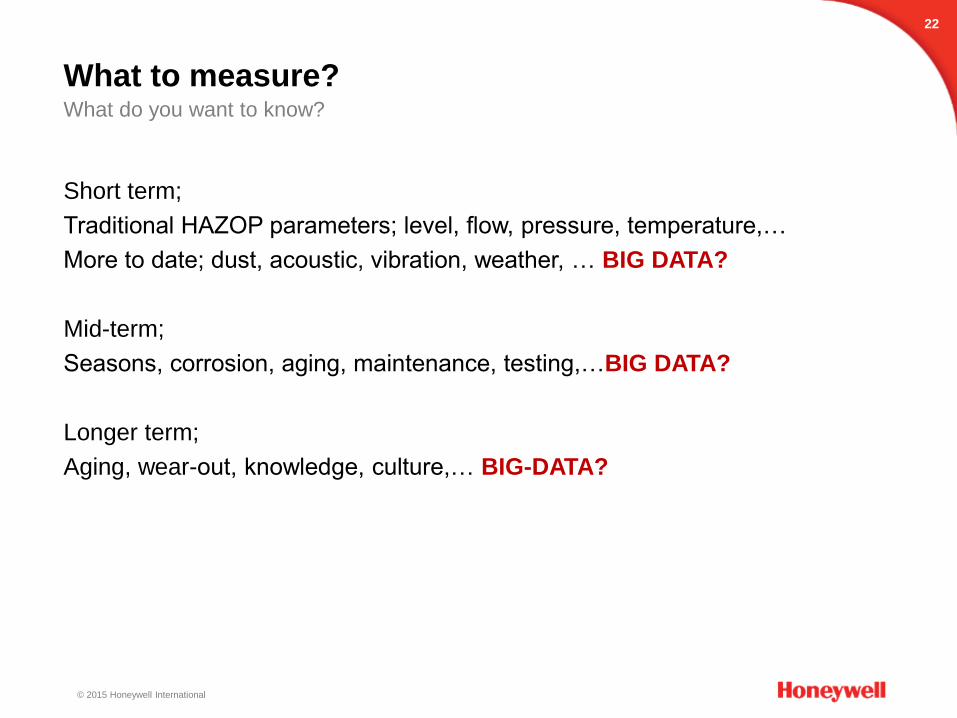
What to measure?What do you want to know?
Short term;
Traditional HAZOP parameters; level, flow, pressure, temperature,…
More to date; dust, acoustic, vibration, weather, … BIG DATA?
Mid-term;
Seasons, corrosion, aging, maintenance, testing,…BIG DATA?
Longer term;
Aging, wear-out, knowledge, culture,… BIG-DATA?
© 2015 Honeywell International
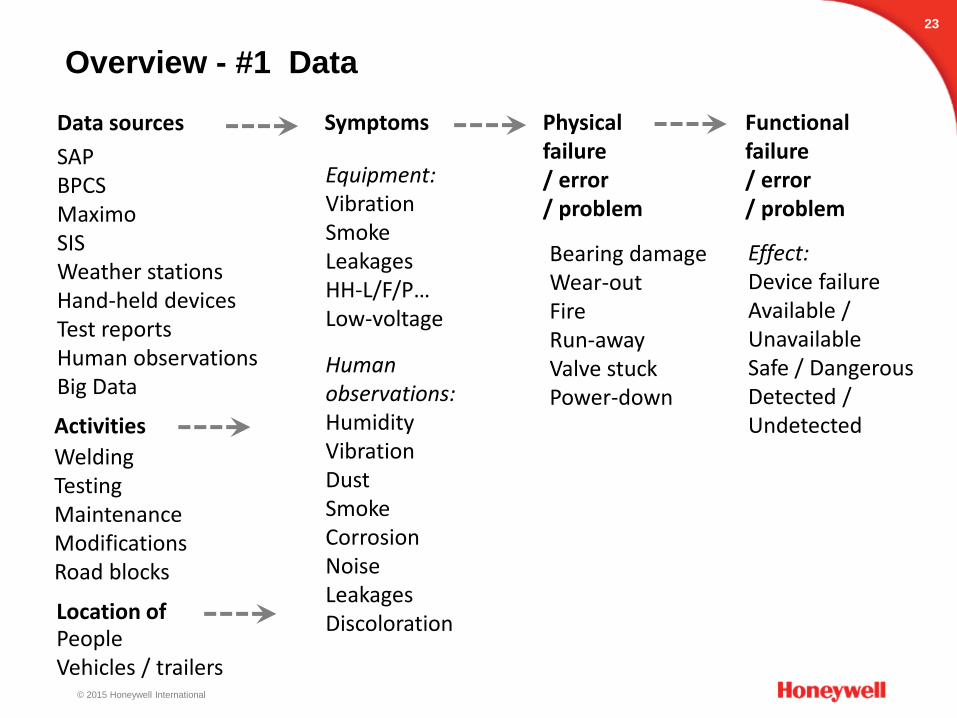
Overview - #1 Data
23
Data sources Symptoms Physicalfailure/ error/ problem
Functionalfailure/ error/ problem
SAPBPCSMaximoSISWeather stationsHand-held devicesTest reportsHuman observationsBig Data
Humanobservations:HumidityVibrationDustSmokeCorrosionNoiseLeakagesDiscoloration
Equipment:VibrationSmokeLeakagesHH-L/F/P…Low-voltage
Bearing damageWear-outFireRun-awayValve stuckPower-down
Effect:Device failureAvailable /UnavailableSafe / DangerousDetected /UndetectedActivities
WeldingTestingMaintenanceModificationsRoad blocks
Location ofPeopleVehicles / trailers
© 2015 Honeywell International
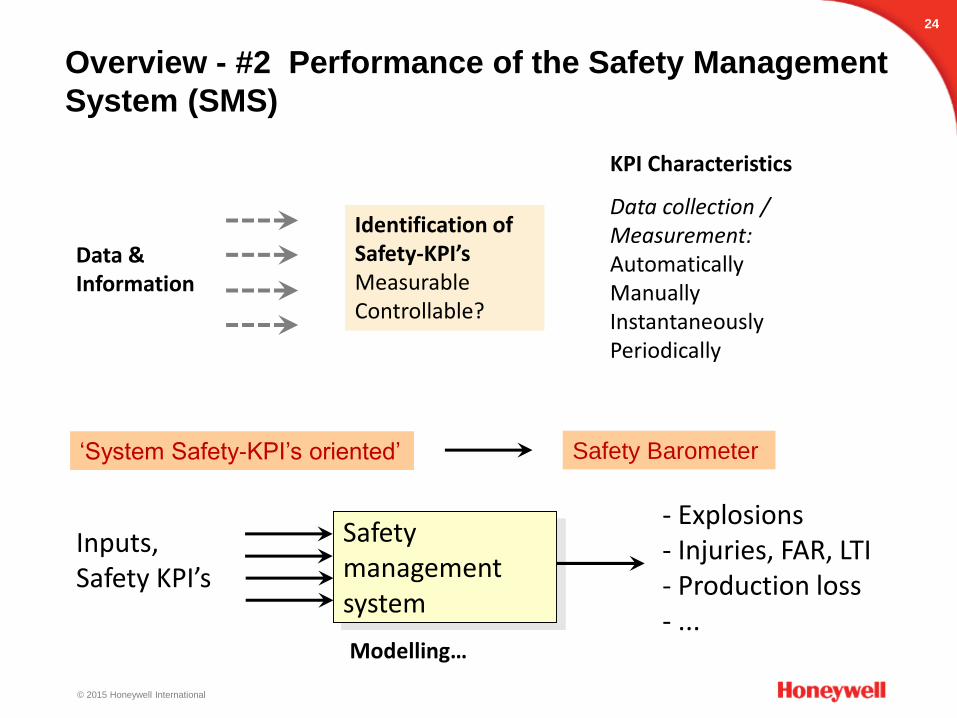
Overview - #2 Performance of the Safety Management
System (SMS)
24
KPI Characteristics
Data collection /Measurement:AutomaticallyManuallyInstantaneouslyPeriodically
Identification ofSafety-KPI’sMeasurableControllable?
Data &Information
Safetymanagementsystem
Inputs,Safety KPI’s
- Explosions- Injuries, FAR, LTI- Production loss- ...
‘System Safety-KPI’s oriented’ Safety Barometer
Modelling…
© 2015 Honeywell International
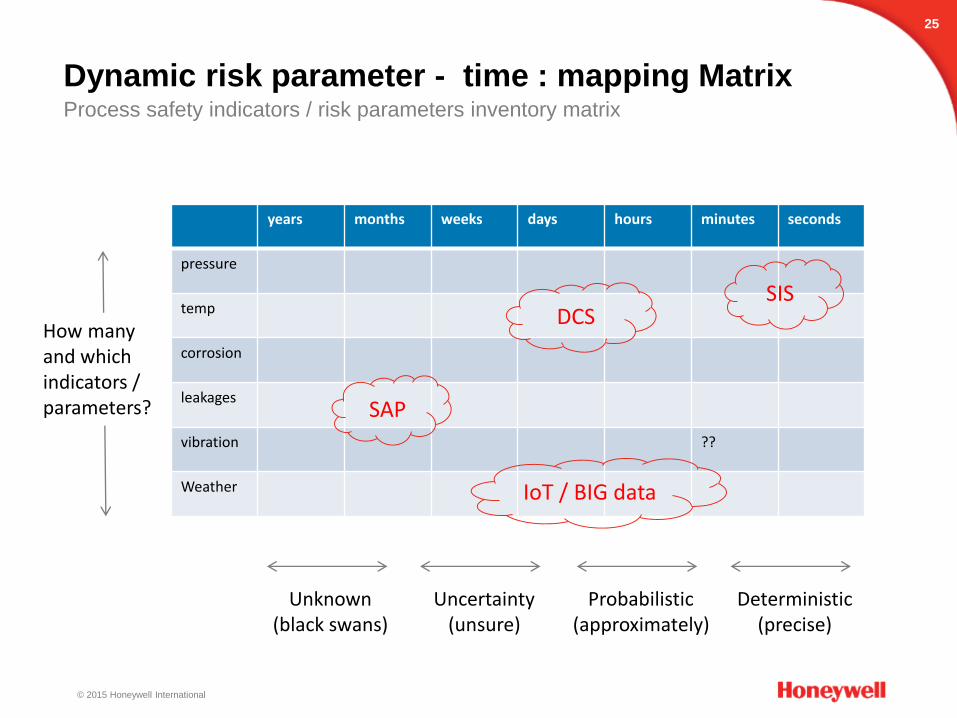
How many and which indicators / parameters?
25
Dynamic risk parameter - time : mapping MatrixProcess safety indicators / risk parameters inventory matrix
years months weeks days hours minutes seconds
pressure
temp
corrosion
leakages
vibration ??
Weather
SAP
IoT / BIG data
DCS
Deterministic(precise)
Probabilistic(approximately)
Uncertainty(unsure)
Unknown(black swans)
SIS
© 2015 Honeywell International
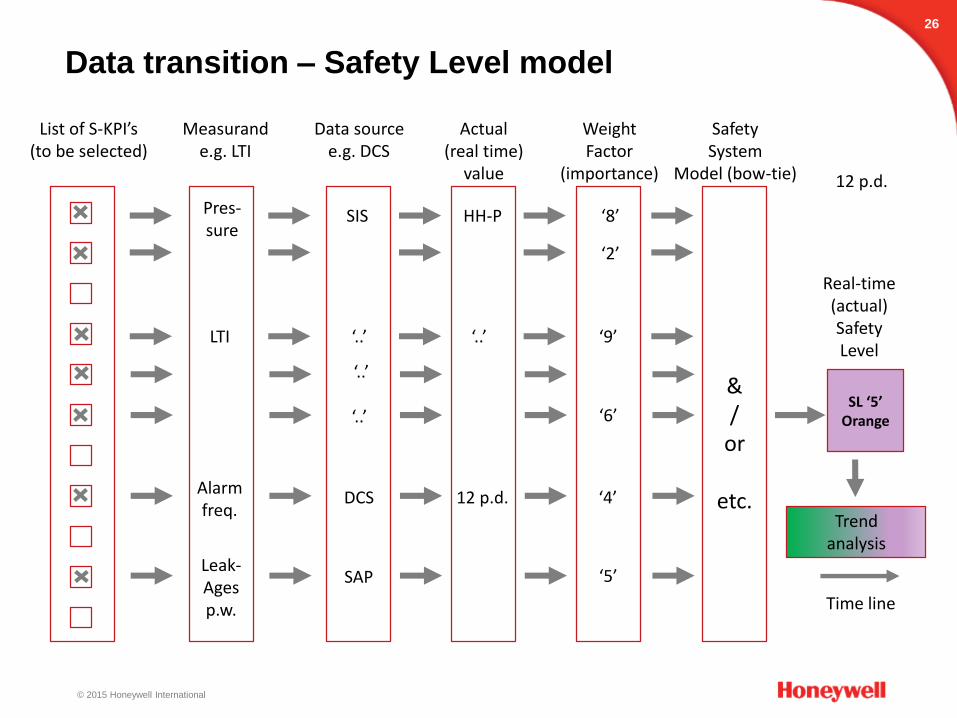
Data transition – Safety Level model
26
List of S-KPI’s(to be selected)
Measurande.g. LTI
Data sourcee.g. DCS
Actual(real time)
value
WeightFactor
(importance)
&/
or
etc.
SafetySystem
Model (bow-tie)
SL ‘5’Orange
Real-time(actual)SafetyLevel
Trendanalysis
Time line
12 p.d.
LTI
Alarmfreq.
Leak-Agesp.w.
DCS
SIS
SAP
Pres-sure
HH-P ‘8’
‘2’
‘9’
‘6’
‘5’
‘4’
‘..’‘..’
‘..’
‘..’
12 p.d.
© 2015 Honeywell International
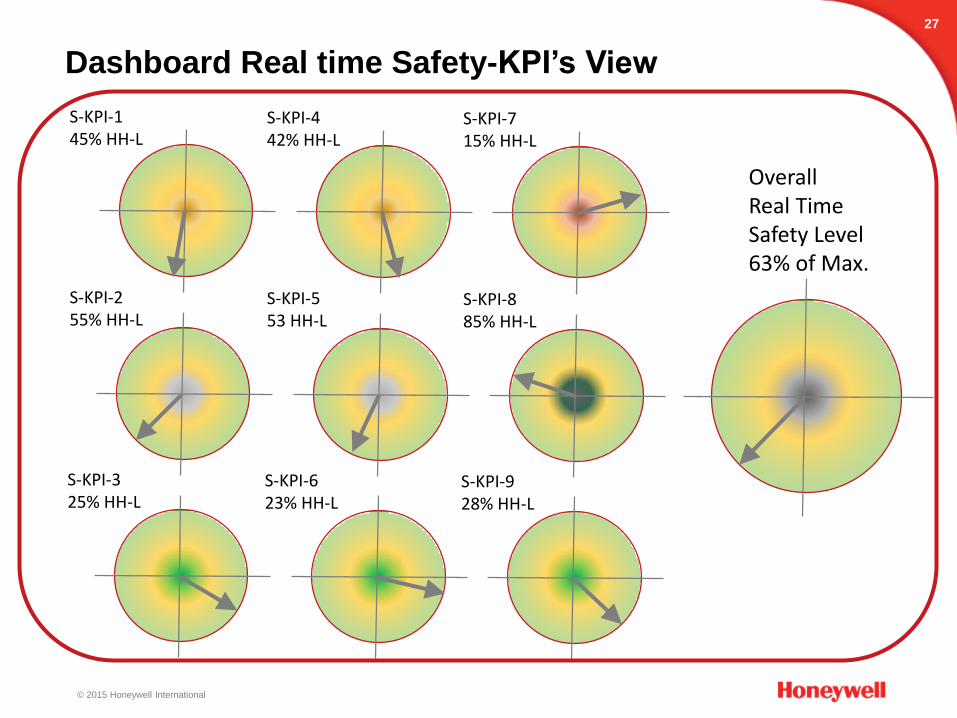
Dashboard Real time Safety-KPI’s View
27
S-KPI-145% HH-L
S-KPI-255% HH-L
S-KPI-325% HH-L
S-KPI-442% HH-L
S-KPI-553 HH-L
S-KPI-623% HH-L
S-KPI-715% HH-L
S-KPI-885% HH-L
S-KPI-928% HH-L
OverallReal TimeSafety Level63% of Max.
© 2015 Honeywell International
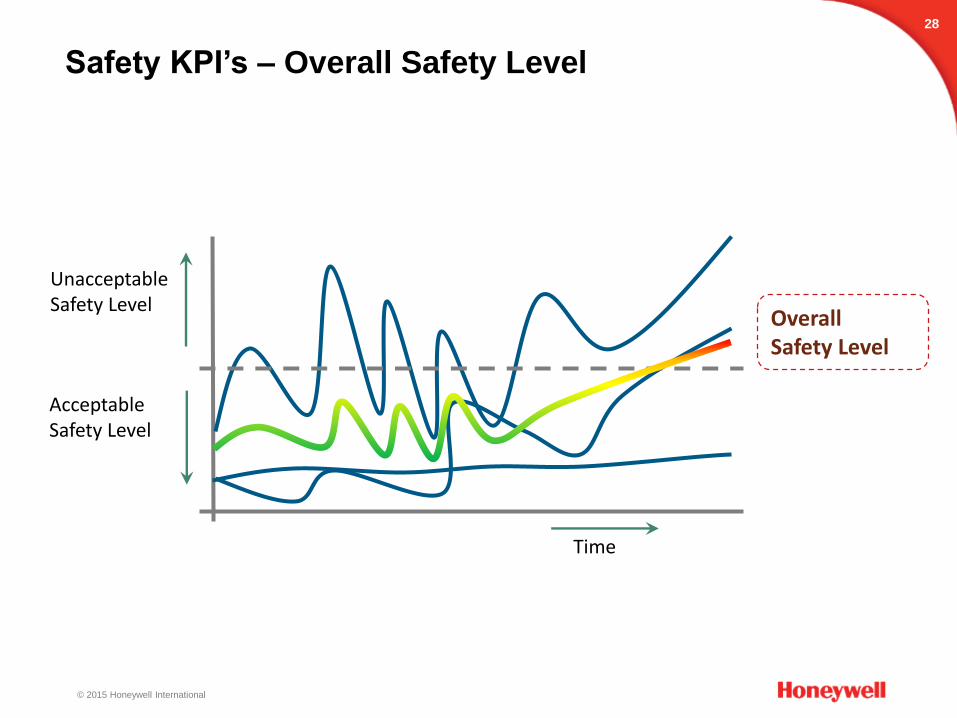
Safety KPI’s – Overall Safety Level
28
Time
UnacceptableSafety Level
AcceptableSafety Level
OverallSafety Level
© 2015 Honeywell International
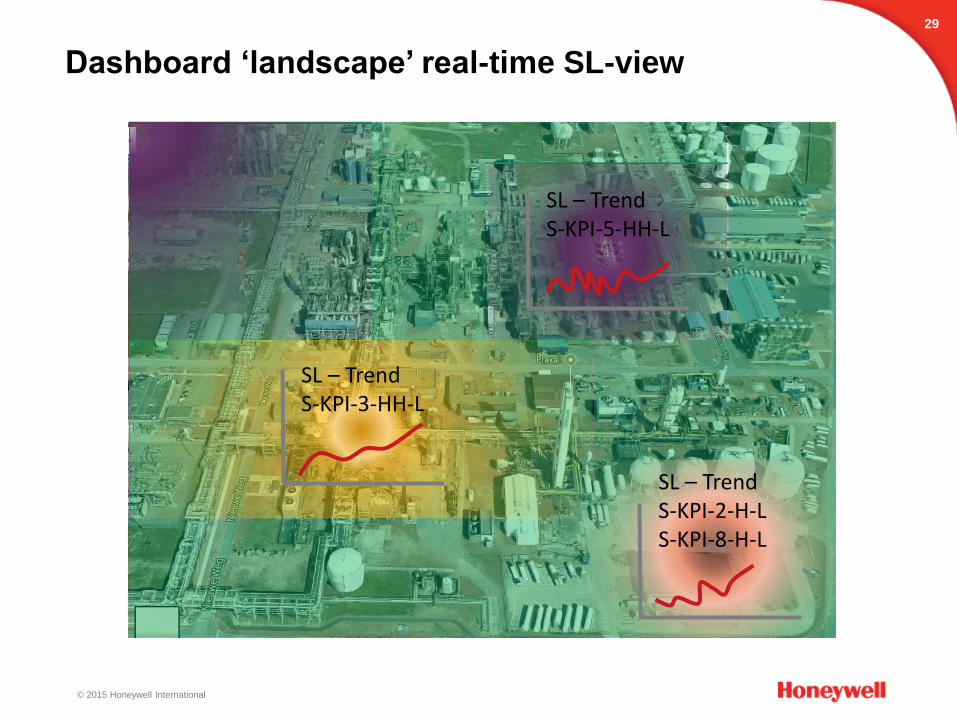
Dashboard ‘landscape’ real-time SL-view
29
SL – TrendS-KPI-3-HH-L
SL – TrendS-KPI-5-HH-L
SL – TrendS-KPI-2-H-LS-KPI-8-H-L
© 2015 Honeywell International
30
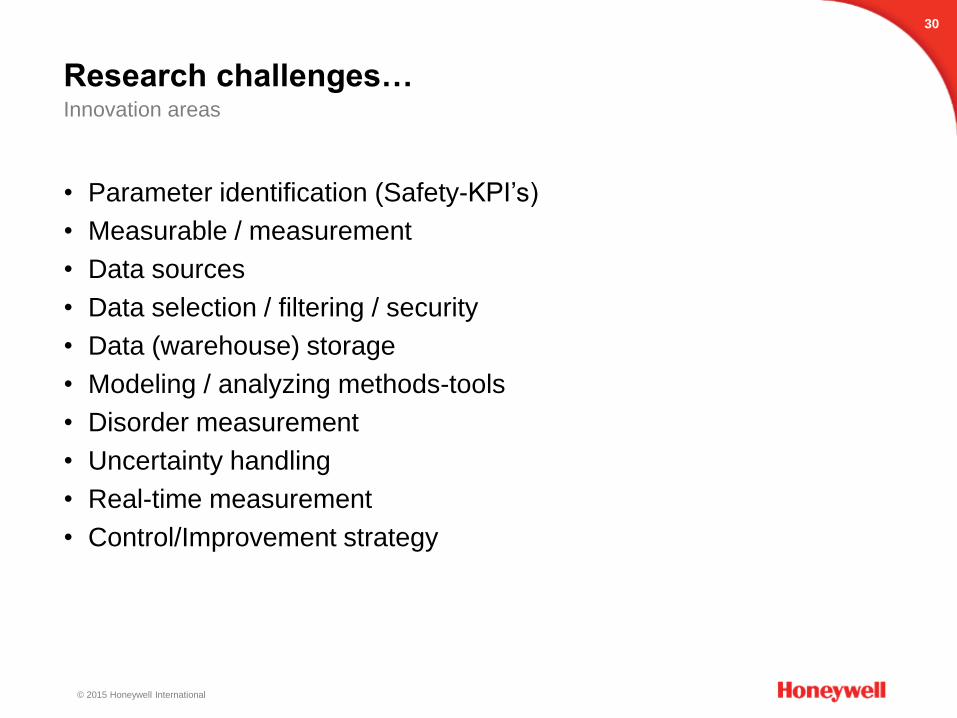
Research challenges…Innovation areas
• Parameter identification (Safety-KPI’s)
• Measurable / measurement
• Data sources
• Data selection / filtering / security
• Data (warehouse) storage
• Modeling / analyzing methods-tools
• Disorder measurement
• Uncertainty handling
• Real-time measurement
• Control/Improvement strategy
© 2015 Honeywell International
More info? Please contact
Dr. Bert Knegtering - – TÜV FSExp, CFSE
Honeywell Safety Management Systems
Global Center of Excellence (CoE) for Safety Solutions
Burgemeester Burgerslaan 40
5245 NH Rosmalen
The Netherlands
+31-73-6273273 office
+31-6-20607213 mobile
www.honeywellsms.com
31

© 2015 Honeywell International
WHERE WE ARE HEADED - 2011 & BEYONDQuestions?
© 2015 Honeywell International
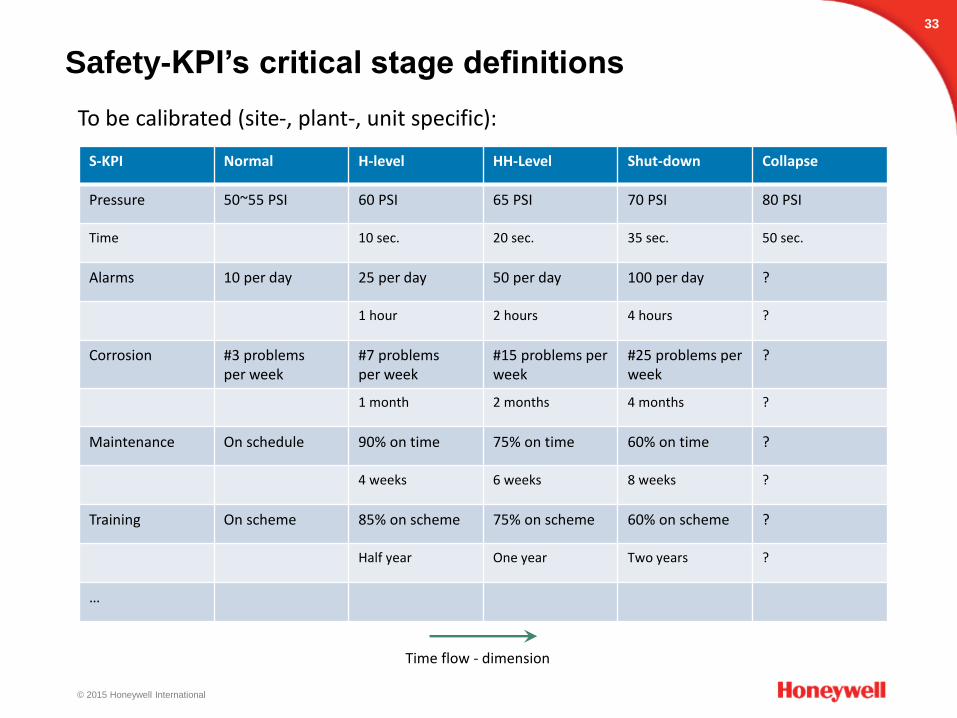
Safety-KPI’s critical stage definitions
33
S-KPI Normal H-level HH-Level Shut-down Collapse
Pressure 50~55 PSI 60 PSI 65 PSI 70 PSI 80 PSI
Time 10 sec. 20 sec. 35 sec. 50 sec.
Alarms 10 per day 25 per day 50 per day 100 per day ?
1 hour 2 hours 4 hours ?
Corrosion #3 problemsper week
#7 problemsper week
#15 problems per week
#25 problems per week
?
1 month 2 months 4 months ?
Maintenance On schedule 90% on time 75% on time 60% on time ?
4 weeks 6 weeks 8 weeks ?
Training On scheme 85% on scheme 75% on scheme 60% on scheme ?
Half year One year Two years ?
…
To be calibrated (site-, plant-, unit specific):
Time flow - dimension
© 2015 Honeywell International
Ultimate goals and achievements summary
‘Prevention of hazardous events by
Prediction of hazardous situations and circumstances,
based on long term, mid term and short term focal points
and strategies’
34
© 2015 Honeywell International
35
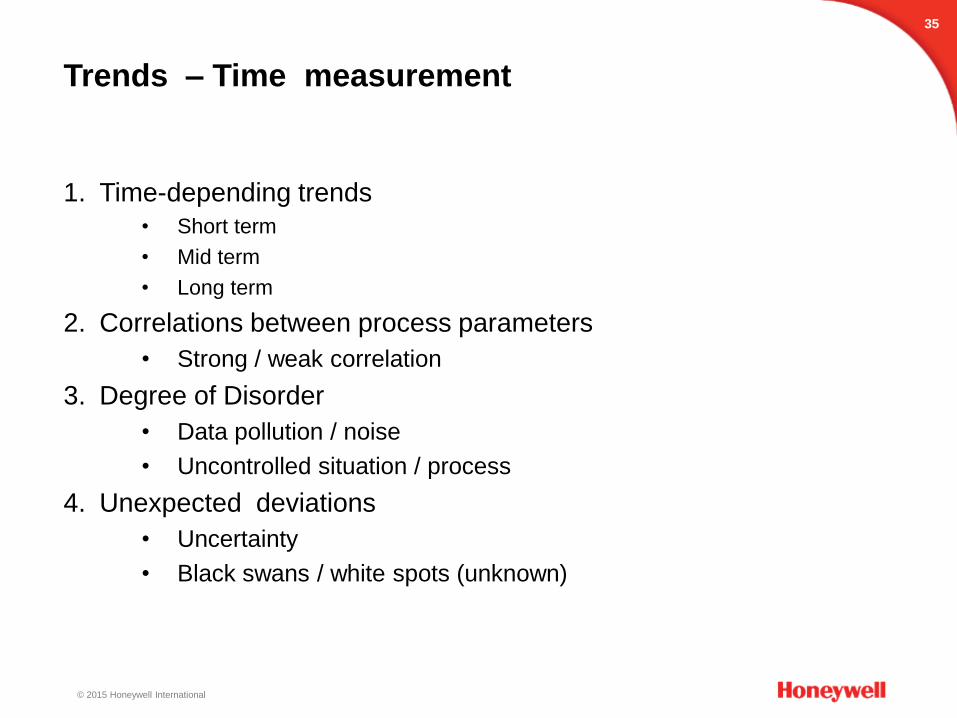
Trends – Time measurement
1. Time-depending trends
• Short term
• Mid term
• Long term
2. Correlations between process parameters
• Strong / weak correlation
3. Degree of Disorder
• Data pollution / noise
• Uncontrolled situation / process
4. Unexpected deviations
• Uncertainty
• Black swans / white spots (unknown)
Recommended