ORIGINAL ARTICLE
A predictive pharmacokinetic–pharmacodynamic model of tumorgrowth kinetics in xenograft mice after administrationof anticancer agents given in combination
Nadia Terranova • Massimiliano Germani •
Francesca Del Bene • Paolo Magni
Received: 18 November 2012 / Accepted: 31 May 2013 / Published online: 29 June 2013
� The Author(s) 2013. This article is published with open access at Springerlink.com
Abstract
Purpose In clinical oncology, combination treatments are
widely used and increasingly preferred over single drug
administrations. A better characterization of the interaction
between drug effects and the selection of synergistic
combinations represent an open challenge in drug devel-
opment process. To this aim, preclinical studies are rou-
tinely performed, even if they are only qualitatively
analyzed due to the lack of generally applicable mathe-
matical models.
Methods This paper presents a new pharmacokinetic–
pharmacodynamic model that, starting from the well-
known single agent Simeoni TGI model, is able to describe
tumor growth in xenograft mice after the co-administration
of two anticancer agents. Due to the drug action, tumor
cells are divided in two groups: damaged and not damaged
ones. The damaging rate has two terms proportional to drug
concentrations (as in the single drug administration model)
and one interaction term proportional to their product. Six
of the eight pharmacodynamic parameters assume the same
value as in the corresponding single drug models. Only one
parameter summarizes the interaction, and it can be used to
compute two important indexes that are a clear way to
score the synergistic/antagonistic interaction among drug
effects.
Results The model was successfully applied to four new
compounds co-administered with four drugs already
available on the market for the treatment of three different
tumor cell lines. It also provided reliable predictions of
different combination regimens in which the same drugs
were administered at different doses/schedules.
Conclusions A good and quantitative measurement of the
intensity and nature of interaction between drug effects, as
well as the capability to correctly predict new combination
arms, suggest the use of this generally applicable model for
supporting the experiment optimal design and the prioriti-
zation of different therapies.
Keywords Pharmacokinetic–pharmacodynamic model �Tumor growth inhibition model � Drug combination
therapy � Drug interaction � Xenograft mice
Introduction
The use of combination therapies (administration of two or
more different drugs) has become a widely adopted strat-
egy in the treatment of patients with cancer, thanks to its
advantages over single agent administrations [5]. Drug
cocktails, in fact, can often provide a more flexible treat-
ment, characterized by a better response with reduced
toxicological effects also thanks to the possibility of
attacking the tumor at the same time through different
biological pathways.
Electronic supplementary material The online version of thisarticle (doi:10.1007/s00280-013-2208-8) contains supplementarymaterial, which is available to authorized users.
N. Terranova � P. Magni (&)
Dipartimento di Ingegneria Industriale e dell’Informazione,
Universita degli Studi di Pavia, Via Ferrata 3, 27100 Pavia, Italy
e-mail: [email protected]
N. Terranova
e-mail: [email protected]
M. Germani � F. Del Bene
PK & Modeling, Accelera srl, V.le Pasteur 10,
20014 Nerviano, MI, Italy
e-mail: [email protected]
F. Del Bene
e-mail: [email protected]
123
Cancer Chemother Pharmacol (2013) 72:471–482
DOI 10.1007/s00280-013-2208-8
Therefore, many pharmacompanies and researchers
have focused their interest and put several efforts to dis-
cover effective drug combinations [23, 24, 28, 29]. In
particular, the evaluation of the most promising combina-
tions of a new compound with other anticancer agents,
including those already available on the market, is become
a fundamental step in early drug development for obtaining
a complete description of the compound characteristics
[20]. For this purpose, ad-hoc in vitro and in vivo experi-
ments, based on cell cultures and tumor-bearing animals,
are routinely performed to assess if the combination has a
synergistic, additive or antagonistic interaction (i.e., the
effect of the combination is more/equal/less what would be
as predicted from the knowledge of the monotherapies) [2,
7, 8, 11, 16]. One of the main objectives of screening
experiments during the early drug development is to
identify drug combinations that yield an enhanced phar-
macological effect and to prioritize them according to their
interaction intensity. During this phase, many variations of
drug combinations are tested, but each drug combination
might be tested only at one or two dose levels [14].
Although these experiments certainly contribute to a better
description of the activities of a new compound, their
quantitative interpretation and the abstraction of general
valid conclusions from the specific experimental design are
not trivial tasks. For example, even if there are several
approaches to evaluate in vitro data (e.g., [4, 7]), these
methods strongly depend on the experimental settings and
they are not suitable for comparing experiments with dif-
ferent designs [12]. The choice of endpoints is crucial as
well. The task becomes more complex when the evaluation
has to be done in vivo, especially because it is confounded
by the dynamics of the tumor growth (present also in non-
treated animals) and the above-mentioned approaches are
only applicable to endpoints and not to time-course data.
This paper is focused on in vivo studies. As reported in
[25], xenograft models are, in the oncology therapeutic
area, the most popular preclinical models for evaluating the
anticancer activity of compounds still under development
[15]. Despite some limitations, their implementation is
relatively easy and requires limited resources. Traditional
approaches to the measurement of efficacy have been based
on the ratio of the tumor volumes/weights in treated and
control animals at a specific endpoint. Unfortunately, most
of these tumor growth inhibition metrics are not invariant
with respect to the experimental conditions. For instance,
the time to maximal value of the tumor growth inhibition
was shown to be dose-, time- and dosing regimen-depen-
dent [21]. Only mathematical models that are able to
describe tumor growth by dissecting the system-specific
properties can provide compound-specific and experiment-
independent model parameters. For this reason, several
mathematical models have been proposed, in the last
decade, to describe the relationship between the drug
pharmacokinetics (PK) and suppression of tumor growth
rates explicitly considering the time variable (see the
reviews [3, 6, 25]). These models are capable of predicting
the antitumor effect of a single compound as a function of
the dosing regimen. They are also indicated as possible
suitable tools for extracting the descriptors of these pro-
cesses, which can be translated from preclinical to clinical
setting [22, 25].
Among these models, the Simeoni tumor growth inhi-
bition (TGI) model [18, 26] is the most popular and, often,
acts as a reference. It has been successfully used for ana-
lyzing hundreds of single agent experiments and even
several general purpose or specialized software tools
included it in their model library [1, 9, 27].
The Simeoni TGI model has also been modified to cope
with combination therapies to provide an in vivo evaluation
of the interaction between drug effects [10, 14]. However,
as better discussed in the conclusions, these models suffer
from some limitations. An interesting and a completely
different approach is that adopted in [19, 20]. Combining
two or more single drug TGI models and applying the Bliss
independence criterion [11] in a dynamic context, a no
interaction (or zero-interaction) model was proposed. In
particular, instead of fitting a drug-drug interaction model,
the simulations obtained by the zero-interaction model are
compared with the experimental data of the combination
therapy; the validity of zero-interaction hypothesis is then
assessed by a suitable statistical test. Therefore, the model
is able to predict the tumor growth inhibition in case of the
‘‘additivity’’ of the combined drugs effects, whereas the
synergistic or antagonistic behaviors are derived from
departures of the experimental data from the predictions.
Under the assumption of a pharmacodynamic (PD) null
interaction, the parameters relative to the drug potencies
preserve in combination the same values of those derived
in single agent regimens.
Despite these recent attempts, as also reported in [10,
25], it is a current opinion that one of the major gaps in the
preclinical characterization of new anticancer compounds
is the lack of a general combination model able to predict
the inhibition of the tumor growth curve in response to
interacting drugs given in combination. The model has to
be simple enough to be identified on experimental data
available during the preclinical phase, in which, as already
highlighted, many drug combinations are tested, but each
drug combination might be tested only at one or two dose
levels.
Then, starting from the Simeoni TGI model and con-
sidering the specific mentioned constraints, in this paper,
we propose and extensively test a new general model able
to fill this gap. It describes and predicts the inhibition of the
tumor growth curve in response to two co-administered
472 Cancer Chemother Pharmacol (2013) 72:471–482
123

drugs, and it allows to assess the nature and the intensity of
the interaction in any considered combination experiment.
Materials and methods
Experimental methods
Compounds
Four novel anticancer compounds still under development
(hereafter called Drug C1, Drug C2, Drug C4, Drug C51),
synthesized by Nerviano Medical Sciences, Nerviano, have
been tested (after a preliminary evaluation in vitro) in
xenograft mice in combination with the following drugs
already used in the standard clinical treatment of specific
tumors: Irinotecan (CPT-11), 5-fluorouracil (5-FU), Cis-
platin and Gemcytabine. In total, six experiments, testing
11 different combination treatments involving more then
230 mice, were led. Three of them were partially analyzed
in [20], where they are indicated as experiment 1, 2 and 3.
The other three experiments, instead, are unpublished data
coming from combination therapies that involve Drug C4,
Drug C5 and the Drug C1 administered in a new combi-
nation treatment.
Animals, cell lines and in vivo tumor growth experiments
Female CD1 athymic nude-nu mice, 5 weeks of age (17–35
g), used in the combination experiment relative to Drug C1
and Gemcytabine (Experiment a, see the following sub-
section) and male Balb, athymic nude-nu mice, 5 weeks of
age (25-35 g) used in all the other experiments, were
obtained from Harlan, S. Pietro al Natisone, Italy.
A2780 human ovarian carcinoma, HT29 human colon
adenocarcinoma and BxPC3 human pancreatic adenocar-
cinoma cell lines (from American Type Culture Collection)
were maintained by s.c. transplantation in athymic mice
using 20–30 mg of tumor brei. Tumors were excised and
fragments were implanted s.c. into the left flank. One week
after inoculation, mice bearing a palpable tumor (approx-
imately 100-300 mm3) were randomized into control and
treatment groups (usually eight animals for group). Then,
mice were treated with anticancer compounds and clini-
cally evaluated daily. Dimension of the tumors were
measured, usually every two or three days, using callipers,
and tumor masses (mg) were calculated as length
(mm)�width2 (mm2)/2, assuming unit density.
All of the experiments were conducted in accordance
with the current best practices and ethic principles.
Drug treatments
Drug C1 was tested in combination with Gemcytabine
(Experiment a) and Cisplatin (Experiment b). In particular,
Drug C1 was given to mice bearing BxPC3 tumor cells at
15 mg/kg (29.4 lM/kg) i.v. two times per day (bid) for
three days for three cycles starting from days 10, 14 and 18
in combination with Gemcytabine 80 mg/kg (267 lM/kg)
i.v. every four days for three times (q4dx3) starting from
day 92. The second experiment has two combination arms.
Drug C1, 30 mg/kg (58.7 lM/kg) i.v. bid for 5 days
starting from day 8 in the first combination arm and from
day 9 in the second one, was administered to mice bearing
A2780 tumor cells in combination with Cisplatin given i.v.
at 8 mg/kg (26.7 lM/kg) as single dose at day 13 and 8 in
the first and the second combination arms, respectively.
Drug C2 was orally given on days 10, 11, 12, 14, 15 and
16 at 45 mg/kg (84.5 lM/kg) and 60 mg/kg (113 lM/kg)
in combination with CPT-11, given i.v. q4dx3 starting from
day 9 at 45 mg/kg (72.9 lM/kg) (Experiment c). Drug C2
was also administered in combination with 5-FU (Experi-
ment d) at 50 mg/kg (384 lM/kg) following the same
schedule and at the same dose level (for Drug C2) of the
Experiment c. In both experiments, HT29 tumor-bearing
mice have been treated.
Drug C4 was orally administered to mice bearing
BxPC3 tumor cells bid for three days for three cycles
starting from day 9 or 103, 14 and 18 at 20 mg/kg
(37.5 lM/kg) and 40 mg/kg (75 lM/kg) in two different
combination arms with Gemcitabine 80 mg/kg (267 lM/
kg) i.v. q4dx3 starting from day 9 (Experiment e).
Drug C5 was administered in combination with CPT-11
to HT29 tumor-bearing mice. Drug C5, i.v daily adminis-
tered for 8 days from day 9 at two different dosages (10
mg/kg, 25.1 lM/kg and 20 mg/kg, 50.3 lM/kg), was given
in combination with CPT-11, i.v. q4dx3 starting from day
8 at 45 mg/kg (72.9 lM/kg) (Experiment f). In the
administration days in which both compounds had to be
administered, Drug C5 was actually given 6 h later then
CPT-11.
In each of the six considered combination experiments,
three additional arms are present: a control arm in which
mice were not treated with any drug and two arms in which
1 Drug C1 is an aurora inhibitor, Drug C2 a polo like kinase (PLK)
inhibitor, Drug C4 and Drug C5 are multikinase inhibitors. Note that,
Drug C1 and Drug C2 are the same compounds analyzed in [20]. For
the sake of readability, we referred to them using the same notation.
2 Drug C1, in the single agent arm, was administered two times per
day for nine days starting from day 9.3 The first administration of Drug C4 was given at day 9 in the single
agent arms, whereas was given at day 10 in the combination arms to
avoid an overlapping in the administration of the two compounds.
Cancer Chemother Pharmacol (2013) 72:471–482 473
123
the anticancer agents were given separately following the
same schedule of the corresponding combination.
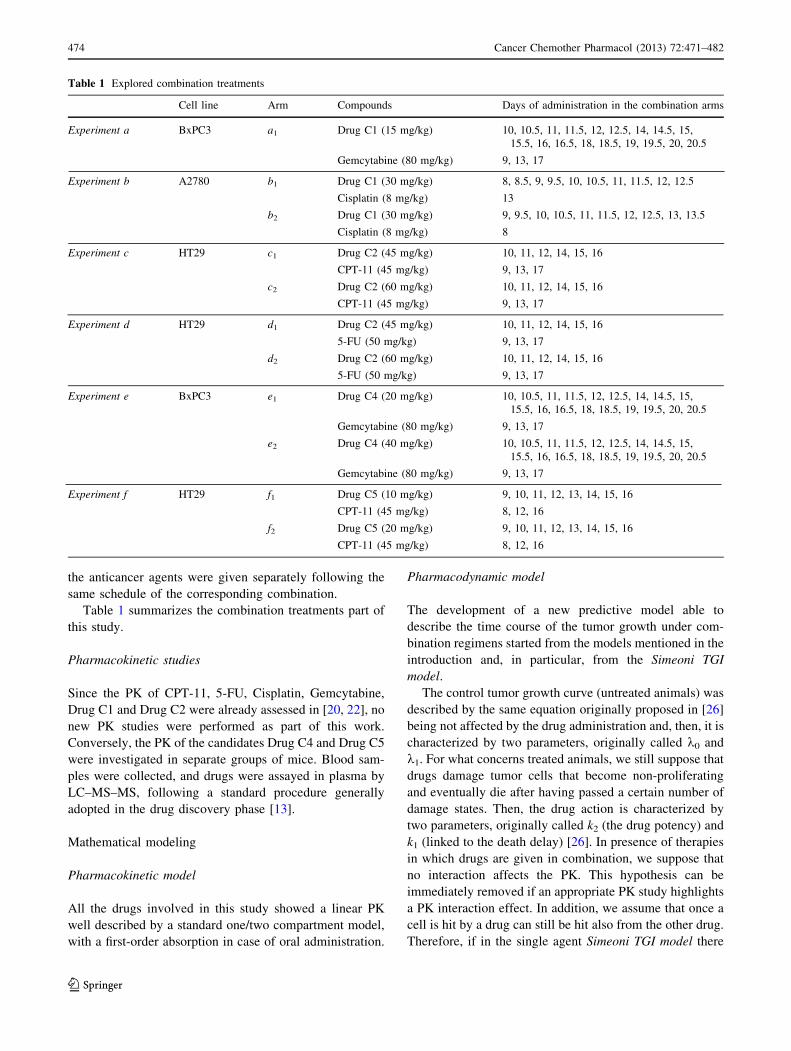
Table 1 summarizes the combination treatments part of
this study.
Pharmacokinetic studies
Since the PK of CPT-11, 5-FU, Cisplatin, Gemcytabine,
Drug C1 and Drug C2 were already assessed in [20, 22], no
new PK studies were performed as part of this work.
Conversely, the PK of the candidates Drug C4 and Drug C5
were investigated in separate groups of mice. Blood sam-
ples were collected, and drugs were assayed in plasma by
LC–MS–MS, following a standard procedure generally
adopted in the drug discovery phase [13].
Mathematical modeling
Pharmacokinetic model
All the drugs involved in this study showed a linear PK
well described by a standard one/two compartment model,
with a first-order absorption in case of oral administration.
Pharmacodynamic model
The development of a new predictive model able to
describe the time course of the tumor growth under com-
bination regimens started from the models mentioned in the
introduction and, in particular, from the Simeoni TGI
model.
The control tumor growth curve (untreated animals) was
described by the same equation originally proposed in [26]
being not affected by the drug administration and, then, it is
characterized by two parameters, originally called k0 and
k1. For what concerns treated animals, we still suppose that
drugs damage tumor cells that become non-proliferating
and eventually die after having passed a certain number of
damage states. Then, the drug action is characterized by
two parameters, originally called k2 (the drug potency) and
k1 (linked to the death delay) [26]. In presence of therapies
in which drugs are given in combination, we suppose that
no interaction affects the PK. This hypothesis can be
immediately removed if an appropriate PK study highlights
a PK interaction effect. In addition, we assume that once a
cell is hit by a drug can still be hit also from the other drug.
Therefore, if in the single agent Simeoni TGI model there
Table 1 Explored combination treatments
Cell line Arm Compounds Days of administration in the combination arms
Experiment a BxPC3 a1 Drug C1 (15 mg/kg) 10, 10.5, 11, 11.5, 12, 12.5, 14, 14.5, 15,
15.5, 16, 16.5, 18, 18.5, 19, 19.5, 20, 20.5
Gemcytabine (80 mg/kg) 9, 13, 17
Experiment b A2780 b1 Drug C1 (30 mg/kg) 8, 8.5, 9, 9.5, 10, 10.5, 11, 11.5, 12, 12.5
Cisplatin (8 mg/kg) 13
b2 Drug C1 (30 mg/kg) 9, 9.5, 10, 10.5, 11, 11.5, 12, 12.5, 13, 13.5
Cisplatin (8 mg/kg) 8
Experiment c HT29 c1 Drug C2 (45 mg/kg) 10, 11, 12, 14, 15, 16
CPT-11 (45 mg/kg) 9, 13, 17
c2 Drug C2 (60 mg/kg) 10, 11, 12, 14, 15, 16
CPT-11 (45 mg/kg) 9, 13, 17
Experiment d HT29 d1 Drug C2 (45 mg/kg) 10, 11, 12, 14, 15, 16
5-FU (50 mg/kg) 9, 13, 17
d2 Drug C2 (60 mg/kg) 10, 11, 12, 14, 15, 16
5-FU (50 mg/kg) 9, 13, 17
Experiment e BxPC3 e1 Drug C4 (20 mg/kg) 10, 10.5, 11, 11.5, 12, 12.5, 14, 14.5, 15,
15.5, 16, 16.5, 18, 18.5, 19, 19.5, 20, 20.5
Gemcytabine (80 mg/kg) 9, 13, 17
e2 Drug C4 (40 mg/kg) 10, 10.5, 11, 11.5, 12, 12.5, 14, 14.5, 15,
15.5, 16, 16.5, 18, 18.5, 19, 19.5, 20, 20.5
Gemcytabine (80 mg/kg) 9, 13, 17
Experiment f HT29 f1 Drug C5 (10 mg/kg) 9, 10, 11, 12, 13, 14, 15, 16
CPT-11 (45 mg/kg) 8, 12, 16
f2 Drug C5 (20 mg/kg) 9, 10, 11, 12, 13, 14, 15, 16
CPT-11 (45 mg/kg) 8, 12, 16
474 Cancer Chemother Pharmacol (2013) 72:471–482
123

are 4 states in which a cell can be (1 state for not damaged
cells and 3 states for damaged ones), in the new model 16
(4 9 4) states have to be defined (1 state for not damaged
cells, 3 states for cells damaged only by drug A, 3 states for
cells damaged only by drugs B and 3 9 3 states for cells
damaged by both drugs). Starting from these assumptions,
some hypotheses were formalized, introduced into a
mathematical model and tested.
In the first attempt, we assumed that the killing potency
of a drug on the tumor cells already damaged by another
drug could be modified by the simultaneous action of the
second drug increasing it in case of synergism or
decreasing it in case of antagonism. This hypothesis leads
to the introduction of two additional parameters k2aband
k2bain the TGI model formulated for two drugs, describing
the drug potency of compound a on the cells already
damaged by drug b and the drug potency of compound b on
the cells already damaged by drug a, respectively (Fig. 1,
left panel).
Then, the comparison of these potency parameters
with those of the single agent regimens (k2a and k2b)
could provide a measurement of PD interaction. Never-
theless, this first attempt showed identification problems
that were investigated by performing a simulation anal-
ysis. It was possible to observe that the simulated tumor
growth curves in combination regimen did not signifi-
cantly change one from the other, even considerably
varying the potency parameters k2aband k2ba
: In fact,
since the introduced parameters influence only the non-
proliferating cells that in the typical setting constitute
only a small part of the total tumor mass, the values of
k2aband k2ba
do not relevantly impact on the growth
curve time course. Similar considerations can be
addressed for a possible variation of the k1 parameters
due to the interaction between the drug effects. There-
fore, an interaction term had to be introduced on the
proliferating cell compartment. This term was assumed
to be proportional to the weight of the proliferating cells
and to the drug concentrations through a parameter c(the interaction parameter). Thus, the final proposed
model (Fig. 1, right panel) can be formulated through the
following differential equations:
_x00ðtÞ ¼ fpðwðtÞÞ � ðk2acaðtÞ þ k2bcbðtÞ þ v11Þx00 ð1Þ
_xijðtÞ ¼ uaij þ ubij þ vij iþ j [ 0 ð2Þ
wðtÞ ¼X3
i¼0
X3
j¼0
xijðtÞ
x00ð0Þ ¼ w0; xijð0Þ ¼ 0 iþ j [ 0
ð3Þ
where
fpðwðtÞÞ ¼k0x00ðtÞ
1þ k0
k1wðtÞ
� �W� � 1
W
uaij ¼0 i ¼ 0
k2acaðtÞxi�1;j � k1axij i ¼ 1
k1axi�1;j � k1axij i ¼ 2; 3
8><
>:
ubij ¼0 j ¼ 0
k2bcbðtÞxi;j�1 � k1bxij j ¼ 1
k1bxi;j�1 � k1bxij j ¼ 2; 3
8><
>:
vij ¼ccaðtÞcbðtÞx00 i ¼ j ¼ 1
0 otherwise
�
Considering that the potency of each drug could change
due to the interaction between drug effects, the interaction
term (v11) cannot be disregarded as in the case of no
interacting (or additive) effects, but it can be positively or
negatively modulated by the parameter c. If the value of cis higher than, lower than or close to zero, the interaction of
drug effects has a synergistic, antagonistic or additive
nature, respectively. It is important to note that the two
additional parameters k2aband k2ba
, introduced in the first
attempt, were not included in the final version of the model
(Fig. 1) because, as discussed before, only the effect
interaction on the proliferating cells can be significantly
appreciated on the tumor mass dynamics. Last but not least,
this model in such formulation, as shown in the ‘‘Results’’
section, can be easily identified and well describes the
experimental data at the same time.
Characterized the nature of the PD interaction in one
combination experiment through the parameter c, it is of
interest to compare results of different experiments in order
to select the most promising combinations, in terms of
strengthened antitumor effects. Nevertheless, the parameter
c cannot be used directly to compare different combination
treatments or to rank them in accordance to it, because its
value is not a pure measure of strength of the drug effect
interaction but it depends from the potencies of the con-
sidered drugs. Conversely, the evaluation of the horizontal
distance between the predictive tumor growth curve
(PTGC), obtained by the zero-interaction model under the
hypothesis of no interaction between drug effects [20], and
the curve obtained by the new combination TGI model can
provide a very useful index to quantify the contribute on
the TGI imputable to the drug effect interaction.
To this aim, the Time Efficacy Index (TEI) [18] for
combination treatments and two new related indexes were
defined. TEI is an antitumor efficacy measure already
defined and largely used for the single agent TGI model. It
is defined as the asymptotic delay between the growth
Cancer Chemother Pharmacol (2013) 72:471–482 475
123

curves of treated and untreated groups. Following the
same rationale in [18], the TEI for combination regimens
(TEIcomb) has been evaluated and it results well approxi-
mated by (see the Supplementary file S1 for more details)
TEIcomb ’k2aAUCca
þ k2bAUCcbþ cAUCcacb
k0
ð4Þ
where AUCx is the area under the curve x.
The TEIcomb index measures the overall antitumor effi-
cacy of a combination regimen treatment and can be used
to compare competing antitumor drug combinations.
However, in order to derive the specific portion of TEIcomb
due to the PD interaction, D was defined as the time-shift of
the growth curve of treated group in combination regimen
with respect the PTGC obtained with the zero-interaction
model. In the Supplementary file S2, it is shown that
D ’ cAUCcacb
k0
ð5Þ
Finally, two very intuitive normalized indexes, always
in the range 0–100, were defined to better express the
percentage contribution of the PD interaction: one for
synergistic combinations and one for antagonistic ones. In
particular, the synergistic combination index (SC) can be
defined for D[ 0 as
SC � 100 � DTEIcomb
ð6Þ
whereas the antagonistic combination index (AC) can be
defined for D\0 as
AC � 100 � �DTEIadd
ð7Þ
where TEIadd is the theoretical TEI computed considering
the PTGC obtained with the zero-interaction model.
Data analysis
PK and PD models were implemented in WinNolin (ver-
sion 3.1, Pharsight, Mountain View, CA) and MATLAB
(version 2007b, The MathWorks, Inc.). The concentration
profiles required by the TGI model were simulated for each
experiment using the PK parameters estimated in single
drug studies. The PK data of Drug C4 and Drug C5,
obtained in satellite groups, were averaged and used to
identify the kinetic parameters. The tumor growth data
were analyzed adopting the following strategy. First, seven
PD parameters were estimated by fitting the Simeoni TGI
model against the average data of control and treated
groups considering only single agent arms. That allows to
share the same tumor-related parameters w0, k0 and k1
between groups and, on the other hand, to identify the
different drug-related parameters k1a, k2a, k1b, k2b. Then,
fixing these parameters to the estimated values, the new
proposed TGI model was simultaneously fitted, for each
combination, against the control and the combination arms
to obtain the value of the interaction term c. Note that a
direct simultaneous fitting of the combination model on all
the arms without fixing any model parameter is possible
and, perhaps, it can improve in some cases even the
parameter estimation. However, the suggested two-step
strategy allows to capture all the drug effect interaction in a
single parameter that can be subsequently used to compare
and rank the different combination therapies without
introducing biases due to the simultaneous variation of the
Fig. 1 Schematic representation of the TGI model for two drugs given in combination: a first attempt (left panel) and the final proposed model
(right panel)
476 Cancer Chemother Pharmacol (2013) 72:471–482
123

monotherapies linked parameters. Moreover, in the drug
development process, a number of single drug experiments
can be performed in an early phase and then single agent
model parameters can be made available before.
Model identification was performed by using the non-
linear weighted least squared algorithm (with weights
equal to 1/yobserved2 )4. In those cases in which several arms
were fitted together, residuals were normalized in order to
give the same weight to each arm5.
Results
Pharmacokinetic model
The PK parameters of CPT-11, Gemcytabine, 5-FU, Cis-
platin, Drug C1 and Drug C2 were previously derived in
[20, 22] and are reported in the Supplementary Table 1.
The PK parameters of Drug C4 and Drug C5 were esti-
mated as part of this study from experimental data (data not
shown). The estimated values are reported in the Supple-
mentary Table 1 as well.
TGI model identification
Drug C1
Considering the first experiment relative to Drug C1 given
in combination with Gemcytabine (Experiment a), seven
PD model parameters (i.e., w0, k0, k1, k1a, k1b, k2a, k2b)
were fixed to the values previously estimated in [20]
(Experiment 1) from the control and single agent arms
(values are reported in the Supplementary Table 2). The
interaction parameter c of the TGI model was estimated,
fitting the combination arm, equal to -0.88 lM-2day-2
with a coefficient of variation (CV) of 10 %.6 The exper-
imental data are well described by the model (see Fig. 2,
top panel). A root-mean-square error (RMSE) of 0.19 g
was computed.
The estimated antagonistic combination index
AC (24 %) shows a significant role of the negative
interaction.
Drug C1 was also studied in combination with Cisplatin
at two different doses and schedules (Experiment b). Seven
PD parameters were preliminary estimated through simul-
taneous fitting of three arms: the control, single agent Drug
C1 (bid from day 9 to day 13) and single agent Cisplatin
(single dose at day 8). The estimates and their CVs
(between brackets) are reported in the Supplementary
Table 2. The RMSE is 0.26 g.
Then, fixing these parameters, the first combination arm
(b1) was fitted (RMSE = 0.17 g) and the interaction
parameter was estimated, c = 8.0 lM-2day-2 (CV =
15 %). In Fig. 2, bottom panel, the fitted tumor growth
curves for the combination and the control arms are shown
together with the experimental data. Even if the positive
value of c could suggest a significant synergistic interac-
tion (its absolute value is tenfold of the previous combi-
nation study), the computation of the synergistic
combination index SC = 14.7 % highlights a moderate
synergistic effect. Drug C1 shows a different behavior
when administered in combination with different drugs on
different tumor cell lines.
Drug C2
Drug C2 was studied in combination with CPT-11
(Experiment c) and 5-FU (Experiment d). In both experi-
ments, seven PD parameters were fixed to the values
0 7 14 21 28 350
1
2
3
4
Time (days)
TW
(g)
0 7 14 21 28 350
1
2
3
4
Time (days)
TW
(g)
Fig. 2 The fitted tumor growth curve (blue continuous line) of the
combination treatment, the PTGC of the related zero-interaction
model (dashed line) and the control curve (black line) are reported
together with the experimental data (circles: mean values, vertical
bars: one standard errors). In the top panel, combination between
Drug C1 (15 mg/kg) and Gemcytabine (80 mg/kg); in the bottom
panel, first combination between Drug C1 (30 mg/kg) and Cisplatin
(8 mg/kg), arm b1
4 This is one of the weighting strategies made available by
WinNonlin and Matlab, adopted in several other studies, to speed-
up the estimation process in order to approximate an additive
proportional error model.5 This is a common choice available in software tools such as
WinNonlin to avoid that the model parameter estimation procedure is
more driven by some arms. However, in the cases reported in this
paper, results are not strongly affected by the adoption of this
strategy, that, therefore, is not crucial in this experimental context.6 Note that a CV B 50 % (under normal distribution hypothesis)
implies that the parameter value is statistically distinguishable from
zero.
Cancer Chemother Pharmacol (2013) 72:471–482 477
123

previously estimated in [20] (Experiment 2 and 3, respec-
tively) from the control and single agent arms (values are
reported in the Supplementary Table 2). Then, the combi-
nation arms were fitted with the proposed TGI model to
estimate the combination parameters.
In particular, considering the first combination arm of
the Experiment c the parameter c was estimated to
3.45 lM-2day-2 (CV = 11 %). The fitted curve of the
combination arm together with the experimental data and
the control arm are shown in Fig. 3, left panel. The RMSE
is 0.07 g.
The synergistic combination index SC, equal to 29 %,
suggests an important interaction between the two drugs
given in combination. In fact, almost one-third of the total
inhibition is due to the interaction effect.
Considering the Experiment d, both the combination
arms were independently fitted7 with the proposed TGI
model. Results are shown in Fig. 3 central and right panels.
The combination parameter was estimated to very sim-
ilar values in both arms: c1 = 0.131 lM-2day-2
(CV = 42 %) for the first combination with RMSE = 0.11
g and c2 = 0.157 lM-2day-2 (CV = 36 %) for the sec-
ond combination arm with RMSE = 0.06 g. A very limited
synergistic interaction is suggested by the SC values equal
to 6 and 8 %, respectively, in the two combination arms. It
is quite interesting to remark a non-trivial result: a
changing of about 33 % in the dose level of Drug C2 does
not affect significantly the interaction intensity.
Drug C4
Considering the experiment relative to Drug C4 given in
combination with Gemcytabine, the seven PD parameters
were preliminary estimated from the single agent experi-
mental arms (RMSE = 0.06 g), i.e., control group, group
treated with Drug C4 20 mg/kg, group treated with Gem-
cytabine 80 mg/kg. The estimates and their CVs (between
brackets) are reported in the Supplementary Table 2.
Then, the first combination arm, e1, was fitted
(RMSE = 0.09 g) and the combination parameter c =
-0.0455 lM-2day-2 (CV = 28 %) was estimated. Results
are shown in Fig. 4.
The antagonistic combination index AC is equal to
10 %, although the small negative values of c highlights a
slight antagonistic interaction effect.
Drug C5
The two arms, f1 and f2, related to Drug C5 and CPT-11
combination were independently fitted with the model.
Seven PD parameters were preliminary estimated
(RMSE = 0.19 g) from the control arm, two single agent
0 7 14 21 28 35 42 49 56 63 700
1
2
3
Time (days)
TW
(g)
0 7 14 21 28 35 42 49 56 63 700
1
2
3
Time (days)
TW
(g)
0 7 14 21 28 35 42 49 56 63 700
1
2
3
Time (days)
TW
(g)
Fig. 3 The fitted tumor growth curve (blue continuous line) of the
combination treatment, the PTGC of the related zero-interaction
model (dashed line) and the control curve (black line) are reported
together with the experimental data (circles: mean values, vertical
bars: one standard errors). In the left panel, first combination between
Drug C2 (45 mg/kg) and CPT-11 (45 mg/kg), arm c1; in the central
panel, first combination between Drug C2 (45 mg/kg) and 5-FU
(50 mg/kg), arm d1; in the right panel, second combination between
Drug C2 (60 mg/kg) and 5-FU (50 mg/kg), arm d2
0 7 14 21 28 350
1
2
3
4
Time (days)
TW
(g)
Fig. 4 Fitted tumor growth curve of the first combination (blue
continuous line) between Drug C4 (20 mg/kg) and Gemcytabine
(80 mg/kg), arm e1, the PTGC of the related zero-interaction model
(dashed lined) and the control curve (black line) are reported together
with the experimental data (circles: mean values, very small vertical
bars: one standard errors)
7 The simultaneous estimation of the two combination arms could be
also performed with success, if the goal of the analysis was only the
characterization of the investigated combination therapy. However,
the goal in this section is slightly different: it is the evaluation of the
robustness of the proposed approach. Then, the question was to assess
how the gamma estimates change from one experiment to another one
Footnote 7 continued
and to understand what happens if only one of the two experiments
was actually performed. This evaluation is a preliminary step to the
validation results reported in the ‘‘TGI model predictive power’’
section.
478 Cancer Chemother Pharmacol (2013) 72:471–482
123

arms treated with Drug C5 (10 and 20 mg/kg) and a single
agent arm treated with CPT-11 45 mg/kg. The estimates
and their CVs (between brackets) are reported in the
Supplementary Table 2.
Then, the interaction parameters were estimated to negative
values for both combination arms: c1 = -2.04 lM-2day-2
(CV = 18 %) and c2 = -1.05 lM-2day-2 (CV = 30 %).
The fitting showed an RMSE equal to 0.25 and 0.36 g,
respectively, for the two different conditions. Results are
shown in Fig. 5.
The computed antagonistic combination indexes
AC = 14 % and AC = 12 % indicate a possible antago-
nistic interaction. Note that, although the two interaction
parameters c are twofold in the two conditions, the com-
bination indexes are very similar.
TGI model predictive power
Since the proposed TGI model showed excellent fitting
capabilities in a number of different situations and similar
gamma values in the different arms related to therapies
using the same drugs, it was interesting to explore its pre-
dictive power. In particular, given the PD parameters esti-
mated in a combination experiment, the behavior of a new
combination therapy involving the same drugs administered
in a different schedule/dose was predicted and compared
with the data actually collected. Three different situations
have been explored: a modification of the schedule (Cis-
platin is given before or after the administration of Drug C1,
i.e., b1 vs b2), a 30 % dose increasing (Drug C2 with CPT-
11, i.e., c1 vs c2) and a 100 % dose increasing (Drug C4 with
Gemcytabine, e1 vs e2). The administration regimens of the
predicted situations are not totally different from those
considered in the model fitting step, for the following rea-
sons: (i) generally in case of combination studies each drug
is previously widely studied as single agent, therefore the
exposures really tested in combination do not cover a wide
range but are focused on the single drug results (and only
one or two dose levels are considered to avoid a very
expensive combinatory approach); (ii) in combination
studies, the drug effect interaction is expected to be drug
concentration dependent, if a huge range of concentrations
is explored, then it is very important to verify the region of
validity of the model and discover its limits within a range
of reasonable working doses.
The first situation considered the second combination
arm of the Experiment b, not yet used in the TGI model
identification analysis section. In Fig. 6, left panel, the
PTGC of the b2 combination arm obtained by fixing the
TGI model parameters to those derived by fitting the
control, the single agents and the b1 combination arms are
reported together with the real data.
Fig. 6 In the left panel, the PTGC curve (blue line) of the second
combination between Drug C1 (30 mg/kg) and Cisplatin (8 mg/kg),
arm b2, and the control curve (black line) are reported together with
the experimental data (circles: mean values). In the middle panel, the
PTGC (blue line) of the second combination between Drug C2 (60
mg/kg) and CPT-11 (45 mg/kg), arm c2 and the control curve (black
line) are reported together with the experimental data (circles: mean
values). In the right panel, the PTGC (blue line) of the second
combination between Drug C4 (40 mg/kg) and Gemcytabine (80 mg/
kg), arm e2, and the control curve (black line) are reported together
with the experimental data (circles: mean values)
0 7 14 21 28 35 42 49 560
1
2
3
4
Time (days)
TW
(g)
0 7 14 21 28 35 42 49 560
1
2
3
4
Time (days)
TW
(g)
Fig. 5 The fitted tumor growth curve (blue continuous line) of the
combination treatment, the PTGC of the related zero-interaction
model (dashed line) and the control curve (black line) are reported
together with the experimental data (circles: mean values, vertical
bars: one standard errors). In the top panel, first combination between
Drug C5 (10 mg/kg) and CPT-11 (45 mg/kg), arm f1; in the bottom
panel, the second combination between Drug C5 (20 mg/kg) and
CPT-11 (45 mg/kg), arm f2
Cancer Chemother Pharmacol (2013) 72:471–482 479
123

Note that, no fitting was done in this case on the second
arm. Model predictions are quite close to the experimental
data (RMSE = 0.32 g), even if the error is greater for the
highest tumor weights. Another important measure to
assess the TGI predictive power is the comparison of the
synergistic/antagonistic combination index predicted by
the model identified on another arm with that computed
actually fitting the experimental data. In the case of
Experiment b, the synergistic combination index SC pre-
dicted by the model is close to zero whereas that computed
fitting the data are equal to 8 %. Therefore, also consid-
ering this very impacting index, the prediction capability is
very good: in both cases, the conclusion is that no signif-
icant synergistic neither antagonistic interactions were
shown in this combination arm. The result is particular
important also taking into account that the schedule in the
two arms is completely different (the order of the admin-
istration of the two drugs was exchanged, see Table 1).
The second example is the second combination arm of
the Experiment c. The PTGC of the c2 arm is reported in
Fig. 6, central panel, with the real data. The generated
curve very well predicts the experimental data
(RMSE = 0.08 g). The synergistic combination index
predicted in this case is 32 %, and it suggests a strong
interaction between the two drugs. On the other hand, fit-
ting c2 arm data to obtain the combination parameter c, the
resulting value of the SC is 21 % that indicates an actually
significant synergism again. Note that, in this case, the dose
level changes of about 30 % between the two combination
conditions.
The third example is the second combination arm of the
Experiment e. The PTGC of the e2 arm is reported in Fig. 6,
right panel, with the experimental data. The experimental
data are well described by the model (RMSE = 0.08 g). In
this case, the antagonistic combination index AC = 14 %
predicted by the model suggests a moderate antagonism
between the two drugs, confirmed by the real value computed
by fitting the TGI model against the second combination arm
data (AC = 9 %). In this case, the dose level changes of about
100 % between the to combination conditions.
Conclusion
Considering the great interest and the relevant effort put in
the design and assessment of new anticancer combination
therapies that represent the actual strategy widely adopted
in clinical oncology, we proposed a new model able to
characterize and quantify the interaction of co-adminis-
tered drugs and to get guidance for early discovery and
development. Indeed, even if several approaches have been
proposed in literature, none of them provides a generally
valid tool for the assessment of the drug effect interaction
nature and intensity in combination administration studies
in xenograft mice. For example, the applicability field of
the model proposed by Koch et al. [14] is restricted only to
drugs that have the same mechanism of action, in terms of
tumor cell death rate. In fact, in the Simeoni TGI model
(from which this model derives), the parameter k1 (the
tumor cell death rate) is known to be linked to the drug
mechanism of action. Substantially, different k1 values are
supposed to be related to different mechanisms of action.
The Koch model includes only one k1 parameter, implicitly
assuming that both drug have to be characterized by the
same tumor cell death rate. If the two drugs (when
administered as single agent) show a different k1 values,
this combination model is not able to take into account it.
Moreover, in Koch model, since only one drug potency is
modulated through the interaction term, a-priori strong
assumptions on the interaction effect are required. The first
restriction also characterizes the two slightly different
models proposed by Goteti et al. [10]. Both models lack of
general validity: in the first one, the drug interaction term is
assumed to be exactly equal to the product of the activities
of the two drugs when given as single agent; in the second
one, the combination term also includes a delay between
the action of a drug and its concentration level, neglecting
one of the single drug activities.
The TGI model here proposed wants to be an answer
and a valid way to definitely fill a well acknowledged gap.
From a modeling point of view, an interaction term c has
been introduced only on the proliferating cell compartment
of a two drugs TGI model, in which a 4 9 4 mortality
matrix allows to take into account for different mechanisms
of action. The effect of drugs interaction on non-prolifer-
ating cells has been neglected since it has a very limited
impact on the total tumor weight, and then, it is not
appreciable on the real data. The proposed model is simple
enough to be identified on the experimental data available
during the preclinical phase, in which many drug combi-
nations are tested, but each drug combination might be
tested only at one or two dose levels. Gaining immediately
information on the compounds under study about their
possible future use in combination therapy may substan-
tially impact on the subsequent phases of the drug devel-
opment process.
The estimation of the interaction term allows an easy
evaluation of the nature of the interaction: positive or
negative c values indicate a possible synergistic or antag-
onistic nature of the drug effect interaction, respectively. In
order to provide an understandable measure of the strength
of the interaction, two additional indexes (called syner-
gistic/antagonistic combination index) were defined start-
ing from a largely used antitumor efficacy index (TEI)
originally introduced in [18, 26] and here evaluated for a
combination treatment.
480 Cancer Chemother Pharmacol (2013) 72:471–482
123
Note that, as in the Simeoni TGI model, the TGI com-
bination model assumes a linear relationship between drug
concentrations and the killing rate. However, even if in all
the analyzed experiments a linear relationship adequately
described the data, our experience with single drug
administrations suggests that, in few cases, it is possible to
have nonlinear drug effects, e.g., saturable effects, mainly
when a wide range of concentration is tested. Following the
general approach here proposed, the nonlinear drug effects
should be learnt in single drug administrations and then
embedded in the combination model. These cases can be
easily managed, modifying the k2c(t) term following the
discussion reported in [17, 19] in which a more general
TGI model framework is presented.
The strongest and most important point of the model
here proposed is that it is able to characterize the drug
potency and the pharmacological drug interaction inde-
pendently from dose levels and schedules, at least in a
reasonable range of experimental conditions as discussed
in the ‘‘Results’’ section. Then, it is possible to predict the
tumor growth in new combination arms, starting from the
interaction term estimated for the same considered com-
pounds given in a different administration schedule/dose.
Modeling the time course of anticancer effects of co-
administered drugs is desirable, since it may facilitate
optimization strategies of combination therapies, thus
reducing times and costs. In fact, this approach could
represent a guide in the definition of Phase I studies, in the
selection of clinical doses and optimal schedules to maxi-
mize tumor suppression. Finally, it could be also applied to
test pharmacological hypotheses, such as the synergistic
inhibition of two complementary signaling pathways.
The relevance and general applicability of the proposed
PK-PD model was demonstrated analyzing 11 studies
involving three tumor cell lines, four new compounds as
well as four drugs already on the market. It has been shown
that this approach is of practical use as it can be applied to
assess combination therapies in routinely performed
xenograft experiments, without requiring drug-specific
mechanistic hypothesis. It enables to identify synergistic
drug combinations when detailed information on the drug
action pathways are not available, filling the lack of a
generally applicable combination model. For these reasons,
this model can be considered an indispensable tool in the
preclinical drug development and a crucial advance in the
knowledge as it integrates the previous information (also
on single drug administrations) to improve the decision
making.
Acknowledgments We thank Paola Gionfriddo for her help in the
preliminary analysis of the model and the anonymous reviewers for
their suggestions. The research leading to these results has received
support (for NT, PM) from the Innovative Medicines Initiative Joint
Undertaking under grant agreement no 115156, resources of which
are composed of financial contributions from the European Union’s
Seventh Framework Programme (FP7/2007–2013) and EFPIA com-
panies in kind contribution. The DDMoRe project is also supported
by financial contribution from Academic and SME partners. This
work does not necessarily represent the view of all DDMoRe partners.
Open Access This article is distributed under the terms of the
Creative Commons Attribution License which permits any use, dis-
tribution, and reproduction in any medium, provided the original
author(s) and the source are credited.
References
1. Asawari: SimBiology model for PK/PD of anticancer
drugs. Matlab Central, http://www.mathworks.com/matlabcentral/
fileexchange/32929-simbiology-model-for-pkpd-of-anticancer-drugs
(2011)
2. Berenbaum M (1989) What is synergy? Parmacol Rev 41:93–141
3. Bonate PL (2011) Modeling tumor growth in oncology. In:
Bonate PL, Howard D (eds) Pharmacokinetics in drug develop-
ment. American Association of Pharmaceutical Scientists, Srin-
ger, US, pp 1-19. ISBN: 978-1-4419-7936-0
4. Chou TC, Talalay P (1984) Quantitative analysis of dose-effect
relationships: the combined effects of multilple drugs or enzyme
inhibitors. Adv Enzyme Regul 22:27–55
5. De Vita V (1984) Principles of cancer management: chemotherapy.
In: De Vita V, Hellman S, Rosenberg SA (eds) Cancer: principles
and practice of oncology. Lippincott-Raven, Philadelphia
6. Della Pasqua OE (2011) PKPD and disease modeling: concepts
and application to oncology. In: Kimko H, Peck C (eds) Clinical
trial simulations, AAPS advances in the pharmaceutical sciences,
vol 1, chap 13. Springer, New York, pp 277–306
7. Drewinko B, Loo T, Brown B, Gottlieb J, Freireich E (1976)
Combination chemotherapy in vitro with Adriamycin. Observa-
tions of additive, antagonistic and synergistic effects when used
in two-drug combination on cultured human lymphoma cells.
Cancer Biochem Biophys 1:187–195
8. Earp J, Krzyzanski W, Chakraborty A, Zamacona MK, Jusko W
(2005) Assessment of drug interactions relevant to pharmacody-
namic indirect response models. J Pharmacokinet Pharmacodyn
31:345–380
9. Germani M, Del Bene F, Rocchetti M, Van Der Graaf P (2013) A4S:
a user-friendly graphical tool for pharmacokinetic and pharmaco-
dynamic (PK/PD) simulation. Comp Meth Prog 110:203–214
10. Goteti K, Garner CE, Utley L, Dai J, Ashwell S, Moustakas DT,
Gonen M, Schwartz GK, Kern SE, Zabludoff S, Brassil PJ (2010)
Preclinical pharmacokinetic/pharmacodynamic models to predict
synergistic effects of co-administered anti-cancer agents. Cancer
Chemother Pharmacol 66:245–254
11. Greco WR, Bravo G, Parsons JC (1995) The search for synergy: a
critical review from a responde surface perspective. Pharmacol
Rev 47(2):332–382
12. Greco WR, Park HS, Rustum YM (1990) An application of a new
approach for the quantitation of drug synergism to the combi-
nation of cis-diamminedichloroplatinum and 1-b-D-arabinofur-
anosylcytosine. Cancer Res 50:5318–5327
13. James C, Breda M, Frigerio E, Long J, Munesada K (2002) Fast
turnaround bioanalysis in discovery and early clinical develop-
ment. Chromatographia 55(Suppl):S41–S43
14. Koch G, Walz A, Lahu G, Shoropp J (2009) Modeling of tumor
growth and anticancer effects of combination therapy. J Pharma-
cokinet Pharmacodyn 36:179–197
Cancer Chemother Pharmacol (2013) 72:471–482 481
123

15. Liu M, Hicklin D (2011) Human tumor xenograft efficacy
models. In: Teicher B (ed) Tumor models in cancer research,
cancer drug discovery and development. Springer, New York
16. Lopez AM, Pegram MD, Slamont DJ, Landaw EM (1999) A
model-based approach for assessing in vivo combination therapy
interactions. PNAS 96:13,023–13,028
17. Magni P, Germani M, De Nicolao G, Bianchini G, Simeoni M,
Poggesi I, Rocchetti M (2008) A minimal model of tumor growth
inhibition. IEEE Trans Biomed Eng 55(12):2683–2690
18. Magni P, Simeoni M, Poggesi I, Rocchetti M, De Nicolao G
(2006) A mathematical model to study the effects of drugs
administration on tumor growth dynamics. Math Biosci
200(2):127–151
19. Magni P, Terranova N, Del Bene F, Germani M, De Nicolao G
(2012) A minimal model of tumor growth inhibition in combi-
nation regimens under the hypothesis of no interaction between
drugs. IEEE Trans Biomed Eng 59:2161–2170
20. Rocchetti M, Del Bene F, Germani M, Fiorentini F, Poggessi I,
Pesenti E, Magni P, De Nicolao G (2009) Testing additivity of
anticancer agents in pre-clinical studies: a PK/PD modelling
approach. Eur J Cancer 45:3336–3346
21. Rocchetti M, Poggesi I, Germani M, Fiorentini F, Pellizzoni C,
Zugnoni PEEP, Simeoni M, De Nicolao G (2005) A pharmaco-
kinetic-pharmacodynamic model for predicting tumour growth
inhibition in mice: a useful tool in oncology drug development.
Basic Clin Pharmacol Toxicol 96:265–268
22. Rocchetti M, Simeoni M, Pesenti E, De Nicolao G, Poggesi I
(2007) Predicting the active doses in humans from animal studies:
a novel approach in oncology. Eur J Cancer 43:1862–1868
23. Schwartz G (2005) Development of cell cycle active drugs for the
treatment of gastrointestinal cancers: a new approach to cancer
therapy. J Clin Oncol 23:4499–4508
24. Shah M, Kortmansky J, Motwani M, Drobnjak M, Gonen M, Yi
S, Weyerbacher A, Cordon-Cardo C, Lefkowitz R, Brenner B,
O’Reilly E, Saltz L, Tong W, Kelsen D, Schwartz G (2005) A
phase I clinical trial of the sequential combination of Irinotecan
followed by Flavopiridol. Clin Cancer Res 11:3836–3845
25. Simeoni M, De Nicolao G, Magni P, Rocchetti M, Poggesi I
(2012) Modeling of human tumor xenografts and dose rationale
in oncology. Drug Discovery Today: Technologies (2012 avail-
able on line). doi:10.1016/j.ddtec.2012.07.004
26. Simeoni M, Magni P, Cammia C, De Nicolao G, Croci V, Pesenti
E, Germani M, Poggesi I, Rocchetti M (2004) Predictive phar-
macokinetic-pharmacodynamic modeling of tumor growth
kinetics in xenograft models after administration of anticancer
agents. Cancer Res 64:1094–1101
27. Terranova N, Magni P (2012) TGI-Simulator: a visual tool to
support the preclinical phase of the drug discovery process by
assessing in silico the effect of an anticancer drug. Comput
Methods Programs Biomed 105(2):162–174
28. Zabludoff SD, Deng C, Grondine M, Sheehy AM, Ashwell S,
Caleb B, Green S, Haye H, Horn C, Janetka J, Liu D, Mouche E,
Ready S, Rosenthal JL, Queva C, Schwarts G, Taylor K, Tse A,
Walker G, White A (2008) AZD7762, a novel checkpoint kinase
inhibitor, drives checkpoit abrogation and potentiales DNA-tar-
geted therapies. Mol Cancer Ther 7:2955–2966
29. Zandvliet A, Siegel-Lakhai W, Beijnen J, Copalu W, Etienne-
Grimaldi M, Milano G, Schellens J, Huitema A (2008) PK/PD
model of Indisulam and Capecitabine: interaction causes exces-
sive myelosuppression. Clin Pharmacol Ther 83:829–839
482 Cancer Chemother Pharmacol (2013) 72:471–482
123
Recommended