International Journal of Innovative Research in Engineering & Science ISSN 2319-5665
(December 2013, issue 2 volume 12)
1
A combined sensitivity factor based GA-IPSO approach for
system loss reduction and voltage profile enhancement
Julius Kilonzi Charles
#1, Dr. Nicodemus Abungu Odero
#2
#1 Post Graduate Student, Department of Electrical and Information Engineering,
University of Nairobi-Kenya, P.O Box 30197-00100 GPO
#2 Senior Lecturer, Department of Electrical and Information Engineering,
University of Nairobi - Kenya, P.O Box 30197-00100 GPO
ABSTRACT
Though several algorithms for optimizing DG location and size in a network with the aim of
reducing system power losses and enhancing better voltage profile have already been proposed,
they still suffer from several drawbacks. As a result much can be done in coming up with new
algorithms or improving the already existing ones so as to address this important issue more
efficiently and effectively. Majority of the proposed algorithms have emphasized on real power
losses only in their formulations. They have ignored the reactive power losses which is key in the
operation of power systems. In modern practical power systems reactive power injection plays a
critical role in voltage stability control, thus the reactive power losses need to be incorporated in
optimizing DG allocation for voltage profile improvement. The results of the few works which
have considered reactive power losses in their optimization can be improved by using more
recent and accurate algorithms. This research work aimed at solving this problem by proposing a
hybrid of GA and IPSO to optimize DG location and size while considering both real and
reactive power losses. Both real and reactive power flow and power loss sensitivity factors were
utilized in identifying the candidate buses for DG allocation. This reduced the search space for
the algorithm and increasing its rate of convergence. This research considers a multi-type DG;
type 1 DG (DG generating real power only), type 2 DG (DG generating both real and active
power) and type 3 DG (DG generating real power and absorbing reactive power).
Key words: Distributed Generation (DG), Particle Swarm Optimization (PSO), Genetic
Algorithm (GA), system loss reduction, voltage profile improvement.
INTRODUCTION
Distribution Systems
The objective of power system operation is to meet the demand at all the locations within power
network as economically and reliably as possible. The traditional electric power generation
systems utilize the conventional energy resources, such as fossil fuels, hydro, nuclear etc. for
electricity generation. The operation of such traditional generation systems is based on
centralized control utility generators, delivering power through an extensive transmission and
distribution system, to meet the given demands of widely dispersed users. Nowadays, the
justification for the large central-station plants is weakening due to depleting conventional

International Journal of Innovative Research in Engineering & Science ISSN 2319-5665
(December 2013, issue 2 volume 12)
2
resources, increased transmission and distribution costs, deregulation trends, heightened
environmental concerns, and technological advancements [1].
Distribution Systems Power Loss Minimization
Normally, the real power loss reduction draws more attention for the utilities, as it reduces the
efficiency of transmitting energy to customers. Nevertheless, reactive power loss is obviously not
less important. This is due to the fact that reactive power flow in the system needs to be
maintained at a certain amount for sufficient voltage level. Consequently, reactive power makes
it possible to transfer real power through transmission and distribution lines to customers.
System loss reduction by strategically placed DG along the network feeder can be very useful if
the decision maker is committed to reduce losses and to improve network performance (e.g. on
the level of losses and/or reliability) maintaining investments to a reasonable low level [2]. This
feature may be very useful in case of revenue recovered by distribution company (DISCO) which
is not only based on the asset value but also on network performance. Studies indicate that poor
selection of location and size of a DG in a distribution system would lead to higher losses than
the losses without DG [3a, 3b].
Distribution Systems Voltage Profile Improvement
In a power system, the system operator is obligated to maintain voltage level of each customer
bus within the required limit. To ensure voltage profiles are satisfactory in distribution systems,
different standards have been established to provide stipulations or recommendations. For
example, the American National Standards Institute (ANSI) standard C84.1 has stipulated that
voltage variations in a distribution system should be controlled within the range of -13% to 7%
[4]. Actually in practice, many electricity companies try to control voltage variations within the
range of ±6%. One of the upcoming widely adopted methods for improving voltage profiles of
distribution systems is introducing distributed generation (DG) in distribution systems. The DG
units improve voltage profiles by changing power flow patterns. The locations and size of DGs
would have a significant impact on the effect of voltage profile enhancement.
Distributed Generation placement and sizing
Distributed generation (DG) is small-scale power generation that is usually connected to
distribution system. The Electric Power Research Institute (EPRI) defines DG as generation from
a few kilowatts up to 50MW [5]. Ackermann et al. have given the most recent definition of DG
as: “DG is an electric power generation source connected directly to the distribution network or
on the customer side of the meter.” [6]. The DG when connected to network can provide a
number of benefits. Some of the benefits are power losses reduction, energy undelivered costs
reduction, preventing or delaying network expansion [7, 8]. Other benefits are peak load
operating costs reduction, improved voltage profile and improved load factor [9]. Other than
providing benefits, DG can also have negative impacts on network. These impacts include
frequency deviation, voltage deviation and harmonics on network [10]. The increase of power
losses is another effect that may occur [7, 11]. Thus careful considerations need to be taken when
sizing and locating DGs in distribution systems.
Usually, DGs are integrated with the existing distribution system and lots of studies are done to
find out the best location and size of DGs to produce utmost benefits. The main characteristics
that are considered for the identification of an optimal DG location and size are the minimization

International Journal of Innovative Research in Engineering & Science ISSN 2319-5665
(December 2013, issue 2 volume 12)
3
of transmission loss, maximization of supply reliability and maximization of profit of the
distribution companies (DISCOs). Due to extensive costs, the DGs should be allocated properly
with optimal size to enhance the system performance in order to minimize the system loss as
well as to get some improvements in the voltage profile while maintaining the stability of the
system. The effect of placing a DG on network indices usually differs on the basis of its type,
location and load at the connection point [12]. Thus interconnection planning of DG to electrical
network must consider a number of factors. The factors include DG technology; capacity of DG
unit; location of DG connected and network connection type [7, 11].
In EI-hattam and Salma [13], an analytical approach has been presented to identify appropriate
location to place single DG in radial as well as loop systems to minimize losses. But, in this
approach, optimal sizing is not considered. Loss Sensitivity Factor method (LSF) applied by
Graham et al., [14] is based on the principle of linearization of the original nonlinear equation
(loss equation) around the initial operating point, which helps to reduce the amount of solution
space. Optimal placement of DG units is determined exclusively for the various distributed load
profiles to minimize the total losses. Ashwani Kumar and Wenzhong Gao [15] presented a multi-
objective optimization approach for determining optimal location of DGs in deregulated
electricity markets with a aim of improving the voltage profile and reducing the line losses. This
approach combined the use of power flow and power loss sensitivity factors in identifying the
most suitable zone and then optimized the solution by maximizing the voltage improvement and
minimizing the line losses in the network. This work did not consider reactive power loss in
optimization.
T. N. Shukla, S.P. Singh and K. B Naik (2010) [2] used GA to optimally locate DG for minimum
system losses in radial distribution networks. The appropriate location is decided on the basis of
active power loss sensitivity to real power injection through DG. They demonstrated that the
benefit increases with increased number of locations within certain locations beyond which it is
uneconomical. This formulation considered active power losses only. The Genetic Algorithm
(GA) based method to determine size and location of DG unit was also used in Ault and
McDonald (2000) and Caisheng and Nehrir (2004) [16, 17]. They addressed the problem in
terms of cost, considering that cost function may lead to deviation of exact size of the DG unit at
suitable location. J. J. Jamian and others (2012) [18] implemented an Evolutionary PSO for
sizing DGs to achieve power loss reduction. They argued that though EPSO and PSO give same
performance in finding the optimal size of DG, EPSO can give superior results by having less
iteration and shorter computation time. Besides that, EPSO avoids the problem of being trapped
in a local minimum by selecting the survival particles to remain in the next iteration. Yustra,
Mochamad Ashari and Adi Soeprijanto (2012) [19] proposed a method based on Improved PSO
(IPSO) for optimal DG allocation with the aim of reducing system losses. IPSO generated more
optimal solution than PSO and SGA methods using active power losses reduction parameter.
However, IPSO method needed more iteration to converge compared to the other two methods.
M. Vatankhah and S.M. Hosseini (2012) [20] proposed the use of new coding in PSO which
included both active and reactive powers of DGs to achieve better profile improvement by
optimizing the size and location of the DGs. In their proposed method, four set of weighing
factors are chosen based on the importance and criticality of the different loads. Their results
showed that the weighting factor had a considerable effect on voltage profile improvement.
Arash Afraz and others (2012) [21] also proposed a PSO based approach to optimize the sizing
International Journal of Innovative Research in Engineering & Science ISSN 2319-5665
(December 2013, issue 2 volume 12)
4
and sitting of DGs in radial distribution systems with an objective of reducing line losses and
improving voltage profile. The proposed objective function was a multi-objective one
considering active and reactive power losses of the system and the voltage profile. In their
research they considered a DG generating active power only.
S. Chandrashekhar Reddy, P. V. N. Prasad and A. Jaya Laxmi (2012) [12], proposed a hybrid
technique which includes genetic algorithm (GA) and neural network (NN) for identification of
possible locations for fixing DGs and the amount of power to be generated by the DG to achieve
power quality improvement. They argued that by fixing DGs at suitable locations and evaluating
generating power based on the load conditions, the power quality of a system can be improved.
In this work only real power loss was considered. M. Abedini and H. Saremi (2012) [22]
presented a combination of GA and PSO for optimal DG location and sizing in distribution
systems with load uncertainty. The combined method was implemented for the 52 bus system to
minimize real power losses and increase voltage stability. The proposed method was found to
produce better results compared to either of the two methods. They optimized the location and
size of a DG generating active power only. In their work J. K. Charles et al. (2013) [23]
presented a GA-IPSO based approach for optimizing the size and location of a DG in power
system network with the aim of reducing system losses and improving voltage profile. Though
this method was quite successful the research work considered the location of a single DG
generating active power only.
FORMULATIONS
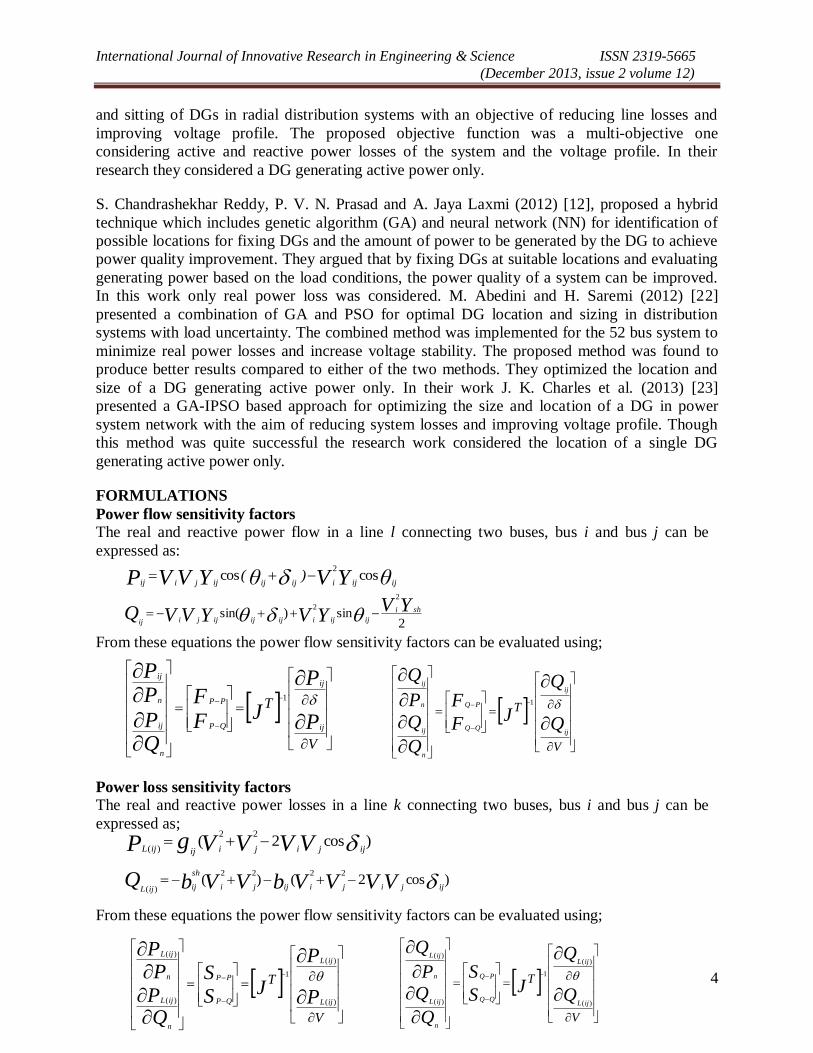
Power flow sensitivity factors The real and reactive power flow in a line l connecting two buses, bus i and bus j can be
expressed as:
From these equations the power flow sensitivity factors can be evaluated using;
Power loss sensitivity factors The real and reactive power losses in a line k connecting two buses, bus i and bus j can be
expressed as;
From these equations the power flow sensitivity factors can be evaluated using;
θYVθYVVP ijijiijijijjiij)( coscos
2
2sin)sin(
2
2 YVYVYVVQ shi
ijijiijijijjiij
V
T
P
P
JFF
QP
PP
ij
ij
QP
PP
n
ij
n
ij
1
V
T
Q
Q
JF
F
Q
Q
P
Q
ij
ij
PQ
n
ij
n
ij
1
)cos2(22
)( ijjijiijijL VVVVgP
)cos2()(2222
)( ijjijiijji
sh
ijijL VVVVbVVbQ
V
T
P
P
JS
S
QP
PP
ijL
ijL
QP
PP
n
ijL
n
ijL
)(
)(
1
)(
)(
V
T
Q
Q
JS
S
Q
Q
P
Q
ijL
ijL
PQ
n
ijL
n
ijL
)(
)(
1
)(
)(

International Journal of Innovative Research in Engineering & Science ISSN 2319-5665
(December 2013, issue 2 volume 12)
5
The combined sensitivity factor of each bus is obtained as follows;
Multi-objective function
The multi-objective index for the performance calculation of distribution systems for DG size
and location planning considers the below mentioned indices by giving a weight to each index.
Real power loss reduction index
Real Power Loss Reduction Index (PLRI) is expressed as:
PPP
baseL
DGiLbaseLPLRI
)(
)()(
Reactive power loss reduction index Reactive Power Loss Reduction Index (QLRI) is expressed as;
Q
baseL
DGiLbaseLQLRI
)(
)()(
Voltage profile improvement index
The Voltage Profile Improvement Index (VPII) is defined as;
))(1(max
1
1nV
VPIIn
Multi-objective based problem formulation In order to achieve the performance calculation of distributed systems for DG size and location
the Multi-Objective Function (MOF) is given by;
VPIIQLRIPLRI wwwMOF 321
Where;
w1 , w2
and w3 are the respective weights assigned to each factor.
The sum of the absolute values of the weights assigned to all the impacts should add up to one.
That is;
1321 www
These weights are indicated to give the corresponding importance to each impact indices and
depend on the required analysis. The weights vary according to engineer’s concerns. In this
research work, more emphasizes is given to real power loss reduction since this results to a
considerable decrease in total cost. Though this is not to mean that the other two factors are not
important, thus the weights are assigned as follows;
6.01w , 2.0
2w and 2.0
3w
Thus the MOF is given by;
)()()()( SSSSFFFFCSF QiQQiPPiQPiPQiQQiPPiQPiPi

International Journal of Innovative Research in Engineering & Science ISSN 2319-5665
(December 2013, issue 2 volume 12)
6
VPIIQLRIPLRIMOF 2.02.06.0
Operational constraints formulation
The above formulated multi-objective function is minimized subject to various operational
constraints so as satisfy the electrical requirements for the distribution network.
Load balance constraint
For each bus, the following load regulations should be satisfied;
0)cos(1
njnjni
N
jnjnjnidnigni YVVPP
0)sin(1
njnjni
N
jnjnjnidnigni YVVQQ
Real and reactive power generation limit
This refers to the upper and lower real and reactive power generation limit of generators at bus-i. NPPP ggigigi
i ,...2,1,maxmin
NQQQ qgigigii ,...2,1,
maxmin
Voltage limit
The voltage must be kept within standard limits at each bus.
NVVV biiii ,....2,1,
maxmin
DG real and reactive power generation limit
This includes the upper and lower real and reactive power generation limit of distributed
generators connected at bus-i. NPPP DGDGiDGiDGi
i ,...2,1,maxmin
NQQQ DGDGiDGiDGi
i ,...2,1,maxmin
PROPOSED METHODOLOGY
The proposed GA-IPSO based approach for optimal allocation of DG units in the distribution
systems is as detailed in the following implementation steps;
1. Get system data by reading the power system parameters.
2. Employ Newton-Raphson method for load flow studies to calculate system base case power
loss.
3. Compute CSF for each bus and arrange buses in order of sensitivity
)()()()( SSSSFFFFCSF QiQQiPPiQPiPQiQQiPPiQPiPi
4. Buses with high sensitivities are chosen as candidate buses.
5. Input both GA and IPSO control parameters.
6. Set candidate bus count
7. While ni
International Journal of Innovative Research in Engineering & Science ISSN 2319-5665
(December 2013, issue 2 volume 12)
7
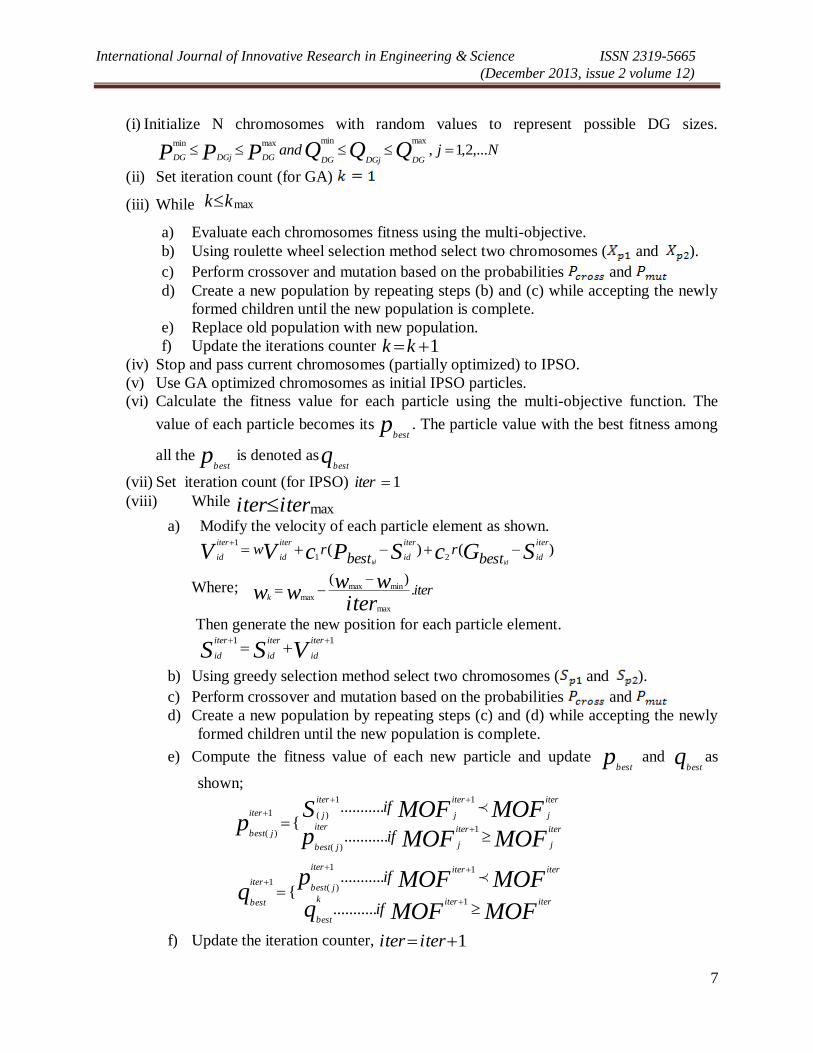
(i) Initialize N chromosomes with random values to represent possible DG sizes.
Njand QQQPPP DGDGjDGDGDGjDG,...2,1,
maxminmaxmin
(ii) Set iteration count (for GA)
(iii) While kk max
a) Evaluate each chromosomes fitness using the multi-objective.
b) Using roulette wheel selection method select two chromosomes ( and ).
c) Perform crossover and mutation based on the probabilities and
d) Create a new population by repeating steps (b) and (c) while accepting the newly
formed children until the new population is complete.
e) Replace old population with new population.
f) Update the iterations counter 1kk
(iv) Stop and pass current chromosomes (partially optimized) to IPSO.
(v) Use GA optimized chromosomes as initial IPSO particles.
(vi) Calculate the fitness value for each particle using the multi-objective function. The
value of each particle becomes its pbest
. The particle value with the best fitness among
all the pbest
is denoted asqbest
(vii) Set iteration count (for IPSO) 1iter
(viii) While iteriter max
a) Modify the velocity of each particle element as shown.
)()(21
1
SGcSPcVViter
id
iter
id
iter
id
iter
id bestr
bestrw
idid
Where; iteriter
wwwwk
.)(
max
minmax
max
Then generate the new position for each particle element.
VSSiter
id
iter
id
iter
id
11
b) Using greedy selection method select two chromosomes ( and ).
c) Perform crossover and mutation based on the probabilities and
d) Create a new population by repeating steps (c) and (d) while accepting the newly
formed children until the new population is complete.
e) Compute the fitness value of each new particle and update pbest
and qbest
as
shown;
MOFMOFpMOFMOFS
p iter
j
iter
j
iter
jbest
iter
j
iter
j
iter
jiter
jbest if
if
1
)(
11
)(1
)( ...........
...........{
MOFMOFq
MOFMOFpq
iteriterk
best
iteriteriter
jbestiter
bestif
if
1
11
)(1
...........
...........{
f) Update the iteration counter, 1 iteriter

International Journal of Innovative Research in Engineering & Science ISSN 2319-5665
(December 2013, issue 2 volume 12)
8
(ix) Stop. The particle that generates the latest qbest
is the optimal solution.
(x) With the latest qbest
in the network calculate system power loss and bus voltages
( VQP DGiDGiLDGiLand
)()()(, ).
(xi) Update the candidate bus 1 ii
8. Compare the fitness of candidate buses sqbest
' and get the most minimized one(s).
9. The results give the optimal locations and their respective optimal DG sizes.
RESULTS AND ANALYSIS
In this case the DG(s) were assumed to be located in an IEEE 30-bus test system. For
comparison purposes the base case real power losses of this test system were taken as
17.9773MW as given by Yustra et al. in their research work which they proposed an algorithm to
optimize the location and size of a multi-type DG [19]. Since the main objective of Yustra et al.
work was to minimize real power losses they did not take into account the reactive power losses.
Thus the base case reactive power losses were obtained using Newton Raphson method to be
68.8881MVAR. To ensure fair comparison the number of DGs to be optimally located and sized
was maintained same with that of the work under comparison; that is four DGs.
The DG limits were taken to be as follows so as to ensure the same values during validation;
0MW -12MW for real power limit (Type 1, 2 and 3 DGs)
0MVar – 3MVar for reactive power limit (Type 2 DG)
-3MVar – 0MVar for reactive power limit (Type 3 DG)
Results for all Candidate Buses
The combined sensitivity factors were analyzed for all the buses and the buses which gave a
combined sensitivity factor of more than 0.8 were taken to be the candidate buses. So as to be
able to choose the optimal location(s) of the DG(s) and their respective optimal sizes, results
were obtained taking into consideration all the candidate buses. This was done for each of the
three types of DG and the obtained results tabulated as follows;
Table 1: Results for CSF, Fitness and optimal DG sizes for candidate buses

International Journal of Innovative Research in Engineering & Science ISSN 2319-5665
(December 2013, issue 2 volume 12)
9
Table 2: A comparison of Results obtained using Type 1 DG
International Journal of Innovative Research in Engineering & Science ISSN 2319-5665
(December 2013, issue 2 volume 12)
10
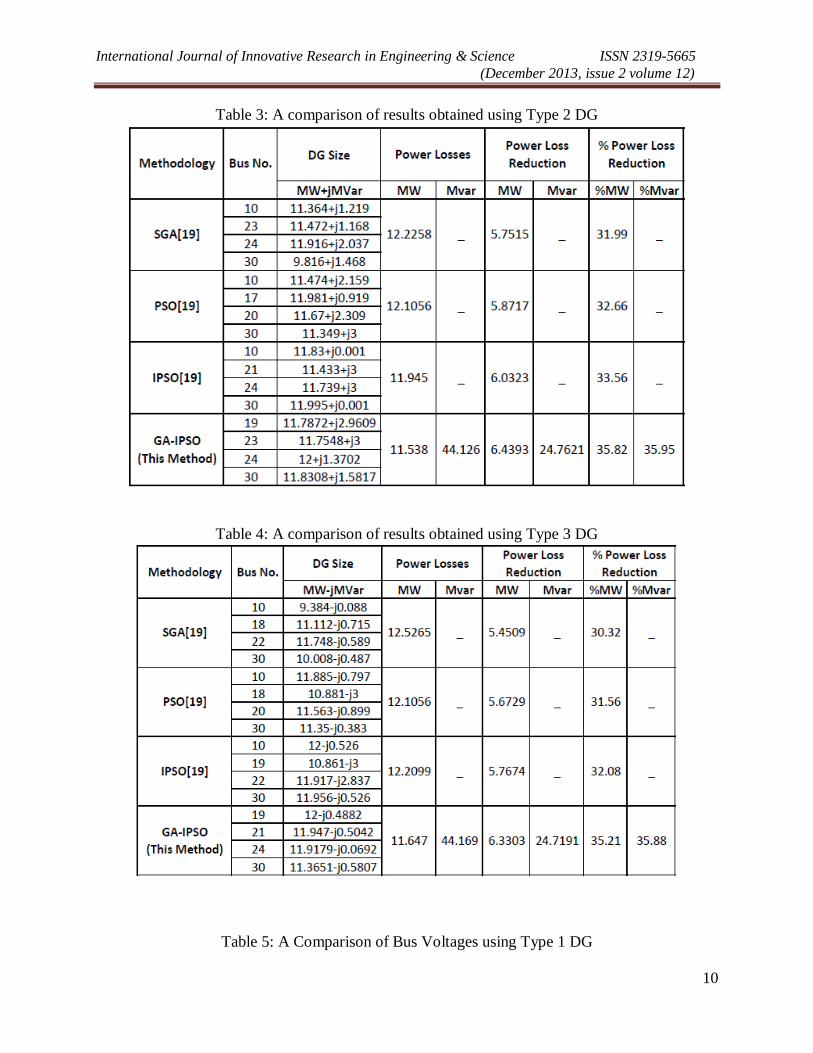
Table 3: A comparison of results obtained using Type 2 DG
Table 4: A comparison of results obtained using Type 3 DG
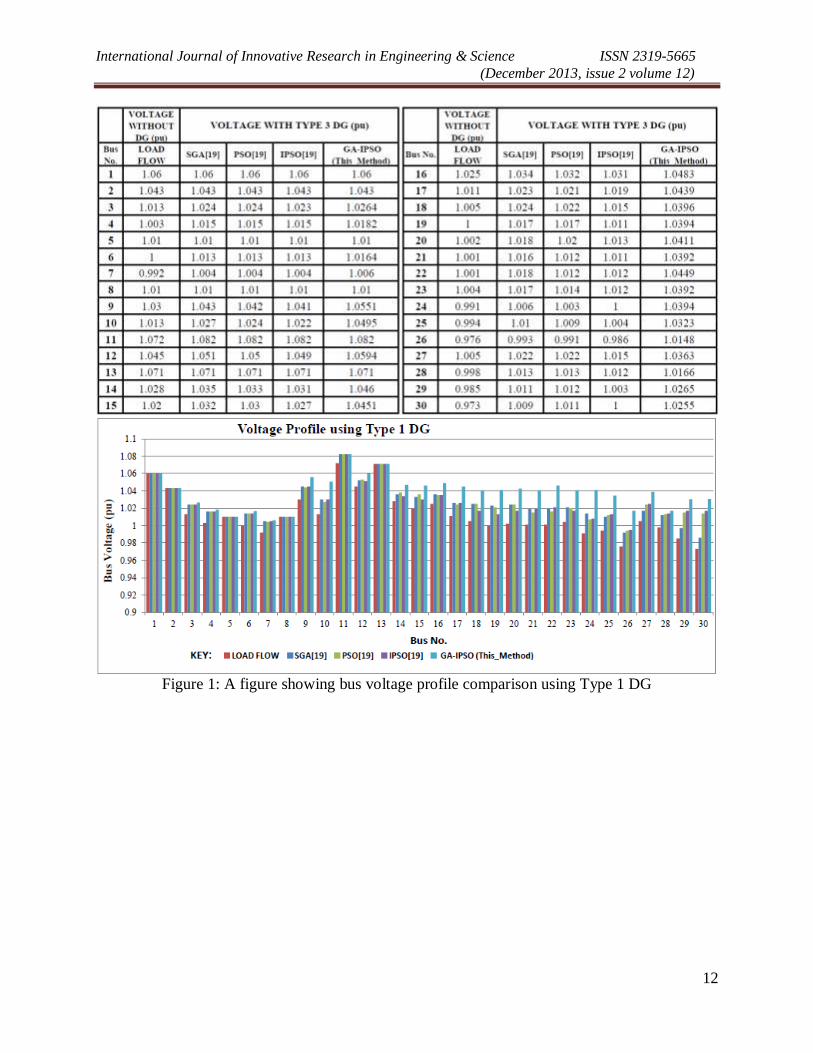
Table 5: A Comparison of Bus Voltages using Type 1 DG

International Journal of Innovative Research in Engineering & Science ISSN 2319-5665
(December 2013, issue 2 volume 12)
11
Table 6: A Comparison of Bus Voltages using Type 2 DG
Table 7: A Comparison of Bus Voltages using Type 3 DG
International Journal of Innovative Research in Engineering & Science ISSN 2319-5665
(December 2013, issue 2 volume 12)
12
Figure 1: A figure showing bus voltage profile comparison using Type 1 DG

International Journal of Innovative Research in Engineering & Science ISSN 2319-5665
(December 2013, issue 2 volume 12)
13
Figure 2: A figure showing bus voltage profile comparison using Type 2 DG
Figure 3: A figure showing bus voltage profile comparison using Type 3 DG
From the above results it can be seen clearly that the GA-IPSO method gave the greatest real
power loss reduction margin as compared to the other three methodologies. The percentage real
power loss reduction from this method considering type 1 DG was 35.46% compared to 32.22%
for IPSO, 31.79% for PSO and 31.07% for SGA. The percentage reduction in real power losses
obtained when optimizing the location and size of type 2 DG using GA-IPSO method is 35.82%.
This percentage is the highest when compared to the other three methodologies; IPSO gave a
reduction of 33.56%, PSO gave a reduction of 32.66% while SGA resulted to a real power
reduction percentage of 31.99%. With a real power reduction percentage of 35.21% compared to
IPSO’s 32.08%, 31.56% from PSO and 30.32% from SGA it is with no doubt that GA-IPSO
method performs best among the optimization techniques when considering type 3 DG.
Though, the reference work under comparison considered only real power losses the results of
GA-IPSO method showed considerable reduction of reactive power losses in the system. The
respective percentage reductions in reactive power losses were as follows; 36.01% for type 1
DG, 35.95% for type 2 DG and 35.88% for type 3 DG. It is also important to note that the sizes
International Journal of Innovative Research in Engineering & Science ISSN 2319-5665
(December 2013, issue 2 volume 12)
14
of DGs obtained using GA-IPSO method compared well to the sizes from the other methods.
Therefore the GA-IPSO method is seen to be superior to the other three methods in terms of
optimizing the location and size of a multi-type DG with the objective of reducing system power
losses. Although the voltages of an ideal IEEE 30-bus test system are within the acceptable
ranges that is 0.95pu to 1.1pu, the inclusion of a DG can affect this voltage stability. From the
results shown above it can be seen that the inclusion of the DGs does not result to deviation of
voltage levels outside the acceptable limits. As it is evident all the bus voltages were in the range
of 1.0pu to 1.1pu. Thus the GA-IPSO method improved the voltage levels of those buses which
had voltages of less than 1.0pu to at least 1.01pu while ensuring that no voltage level rises above
the acceptable limit. As a matter of fact this method maintained the highest bus voltage value at
1.082pu.
CONCLUSION
This paper gives the formulation and implementation of a GA/IPSO based algorithm for system
loss reduction and voltage profile improvement in distribution systems by optimal location and
sizing of a DG. Combined sensitivity factors were effectively utilized to come up with the
candidate locations for DGs. The algorithm proposed has resulted to better results in terms of
both real and reactive power loss reduction and voltage profile improvement as compared to
SGA, PSO and IPSO methods. Arithmetic crossover and mutation was employed in this
methodology enabling the use of real coded GA chromosomes and PSO particles. GA algorithm
was used for the first less iterations so as to utilize its advantage of exploring fast regions and
avoid its disadvantage of lower convergence. The results of GA were used to initialize PSO
particles so as to increase its convergence rate. Both crossover and mutation operators were also
employed in improving the PSO. This ensured that the disadvantage of premature convergence
for PSO is avoided.
As a result of utilizing the merits of these two optimization techniques while trying to avoid their
demerits the proposed methodology resulted to a real power loss reduction of 35.46%, 35.82%
and 35.21% for Type 1, 2 and 3 DGs respectively. On the other hand the reactive power losses
were reduced by 36.01% for Type 1 DG, 35.95% for Type 2 DG and 35.88% for Type 3 DG. In
addition the lowest bus voltage was improved from 0.973pu to 1.01pu while maintaining the
highest voltage level at 1.082pu.
REFERENCES
[1] Mohammad Mohammadi and M. Akbari Nasab, “PSO Based Multiobjective Approach for
Optimal Sizing and Placement of Distributed Generation”, Research Journal of Applied
Sciences, Engineering and Technology 2(8): 832-837, 2011
[2] T. N. Shukla, S.P. Singh, K. B. Naik, “Allocation of optimal distributed generation using GA
for minimum system losses in radial distribution networks”, International Journal of
Engineering, Science and Technology, Vol. 2, No. 3, 2010, pp. 94-106
[3a] Kim, T.E., 2001a. “A method for determining the introduction limit of distributed generation
system in distribution system.” IEEE Trans. Power Delivery, 4(2): 100-117.

International Journal of Innovative Research in Engineering & Science ISSN 2319-5665
(December 2013, issue 2 volume 12)
15
[3b] Kim, T.E., 2001b. “Voltage regulation coordination of distributed generation system in
distribution system.” IEEE Trans. Power Delivery, 6(3): 1100-1117.
[4] Minnan Wang and Jin Zhong, “A Novel Method for Distributed Generation and Capacitor
Optimal Placement considering Voltage Profiles”, 978-1-4577-1002-5/11/©2011 IEEE
[5] Ackermann, T., Anderson, G. and Soder, L., 2001. “Distributed Generation: A Definition”,
Electric Power System Research, 57(3): 195-204.
[6] Satish Kansal, B.B.R. Sai, Barjeev Tyagi, Vishal Kumar “Optimal placement of distributed
generation in distribution networks”, International Journal of Engineering, Science and
Technology,Vol. 3, No. 3, 2011, pp. 47-55.
[7] Tautiva, C. and Cadena, A., 2008. “Optimal Placement of Distributed Generation on
Distribution Network.” Proceeding of Transmission and Distribution Conference and
Exposition-IEEE/PES-Bogota,
[8] Brown R.E., Pan J., Feng X., and Koutlev K., 1997. “Siting distributed generation to defer
T&D expansion”, Proc. IEE. Generation, Transmission and Distribution, Vol. 12, pp. 1151-
1159.
[9] Haghifam, M.R., Falaghi, H. and Malik, O.P., 2008. “Risk-Based Distributed Generation
Placement.” IET Generation Transmission Distribution, 2(2): 252-262.
[10] El-Ela A.A.A., Allam, S.M. and Shatla, M.M., 2010. “Maximal Optimal Benefits of
Distributed Generation Using Genetic Algorithm.” Electric Power Systems Research, 80:
869-877.
[11] Borges, C.L.T. and Falcao, D.M., 2006. “Optimal Distributed Generation Allocation for
Reliability, Losses and Voltage Improvement.” Electric Power and Energy System, 28: 413-
420.
[12] S. Chandrashekhar Reddy, P. V. N. Prasad and A. Jaya Laxmi, “Power Quality Improvement
of Distribution System by Optimal Placement and Power Generation of DGs using GA and
NN”, European Journal of Scientific Research ISSN 1450-216X, Vol.69, No.3 (2012), pp.
326-336
[13] EI-hattam, W. and M.M.A. Salma, 2004. “Distributed generation technologies, definitions
and benefits.” Electric. Power Sys. Res., 71: 119-1283.
[14] Graham, W., A. James and R. Mc-Donald, 2000. “Optimal placement of distributed
generation sources in power systems.” IEEE Trans. Power Sys., 19(5): 127-134.
[15] Ashwani Kumar and Wenzhong Gao, “Voltage Profile Improvement and Line Loss Reduction
with Distributed Generation in Deregulated Electricity Markets”
[16] Ault, G.W. and J.R. McDonald, 2000. “Planning for distribution generation within
distribution networks in restructured electricity markets.” IEEE Power Eng. Rev., 20: 52-54.

International Journal of Innovative Research in Engineering & Science ISSN 2319-5665
(December 2013, issue 2 volume 12)
16
[17] Caisheng, W. and M.H. Nehrir, 2004. “Analytical approaches for optimal placement of
distributed generation sources in power systems.” IEEE Trans. Power Sys, 19(4): 27-34.
[18] J.J. Jamian, M.W. Mustafa, H. Mokhlis and M.A. Baharudin, “Implementation of
Evolutionary Particle Swarm Optimization in Distributed Generation Sizing”, IJECE Vol. 2,
No. 1, February 2012, pp. 137-146.
[19] Yustra, Mochamad Ashari and Adi Soeprijanto, “Optimal Distributed Generation (DG)
Allocation for Losses Reduction Using Improved Particle Swarm Optimization (IPSO)
Method”, J. Basic. Appl. Sci. Res., 2(7) pp 7016-7023, 2012
[20] M. Vatankhah and S.M. Hosseini, “PSO based voltage profile improvement by optimizing the
size and location of DGS”, IJTPE June 2012, issue 11, volume 4, number 2, pages 135-139.
[21] Arash Afraz, Farzad Malekinezhad, Seyed Jalal Seyed Shenava and Aref Jlili, “Optimal
Sizing and Sitting in Radial Standard System using PSO”, American Journal of Scientific
Research ISSN 2301-2005 Issue 67 (2012), pp. 50-58
[22] M. Abedini and H. Saremi, “A Hybrid of GA and PSO for Optimal DG Location and Sizing in
Distribution Systems with Load Uncertainty.” J. Basic. Appl. Sci. Res., 2(5) pp 5103-5118,
2012
[23] Julius Kilonzi Charles and Dr. Nicodemus Abungu Odero, “A GA/IPSO based approach for
system loss reduction and voltage profile improvement employing arithmetic crossover and
mutation”, International Journal of Engineering Science and Technology (IJEST) ISSN:
0975-5462, Vol. 5 No.07, July 2013 pp 1501-1510
Recommended