Accepted Manuscript
A combination treatment of ultrasound and ε-polylysine to improve microorganismsand storage quality of fresh-cut lettuce
Kai Fan, Min Zhang, Bhesh Bhandari, Fangjun Jiang
PII: S0023-6438(19)30655-3
DOI: https://doi.org/10.1016/j.lwt.2019.108315
Article Number: 108315
Reference: YFSTL 108315
To appear in: LWT - Food Science and Technology
Received Date: 25 February 2019
Revised Date: 23 June 2019
Accepted Date: 25 June 2019
Please cite this article as: Fan, K., Zhang, M., Bhandari, B., Jiang, F., A combination treatment ofultrasound and ε-polylysine to improve microorganisms and storage quality of fresh-cut lettuce, LWT -Food Science and Technology (2019), doi: https://doi.org/10.1016/j.lwt.2019.108315.
This is a PDF file of an unedited manuscript that has been accepted for publication. As a service toour customers we are providing this early version of the manuscript. The manuscript will undergocopyediting, typesetting, and review of the resulting proof before it is published in its final form. Pleasenote that during the production process errors may be discovered which could affect the content, and alllegal disclaimers that apply to the journal pertain.

MANUSCRIP
T
ACCEPTED
ACCEPTED MANUSCRIPT
A combination treatment of ultrasound and ε-polylysine to 1
improve microorganisms and storage quality of fresh-cut lettuce 2
3
Kai Fan a, b, Min Zhang a, c, * , Bhesh Bhandari d, Fangjun Jiang e 4
5
a State Key Laboratory of Food Science and Technology, Jiangnan University, 214122 6
Wuxi, Jiangsu, China 7
b International Joint Laboratory on Food Safety, Jiangnan University, China 8
c Jiangsu Province Key Laboratory of Advanced Food Manufacturing Equipment and 9
Technology, Jiangnan University, China 10
d School of Agriculture and Food Sciences, University of Queensland, Brisbane, QLD, 11
Australia 12
e Jiangsu First Farm Technology Co., Changzhou, Jiangsu, China 13
14
*Corresponding author: Professor Min Zhang, School of Food Science and 15
Technology, Jiangnan University, 214122 Wuxi, Jiangsu Province, China. 16
E-mail: [email protected] Fax: 0086-(0)510-8580797617

MANUSCRIP
T
ACCEPTED
ACCEPTED MANUSCRIPT
Abstract: 18
A combination treatment of ultrasound and ε-polylysine to improve microorganisms 19
and storage quality of fresh-cut lettuce were investigated. Fresh-cut lettuce was 20
treated with ultrasound (20kHz, 17-29 W/L), ε-polylysine (0.1-0.6 g/L) and their 21
combination at 20 ºC for 10 min and then packaged as well as stored at 4 ºC for 12 d. 22
The results showed that 23 W/L ultrasound combined with 0.4 g/L ε-polylysine 23
treatment was superior to 23 W/L ultrasound or 0.4 g/L ε-polylysine treatment alone 24
in inhibiting the growth of microorganisms such as total number of colonies, mold 25
and yeast, and total coliform counts of fresh-cut lettuce during storage. Ultrasound 26
combined with ε-polylysine treatment reduced weight loss and total color difference 27
(∆E), declined POD and PPO activities, maintained the higher level of total phenolics 28
content, vitamin C and chlorophyll, as well as decreased water mobility and 29
respiration rate in fresh-cut lettuce during storage compared to control. Therefore, 30
these results demonstrated that ultrasound combined with ε-polylysine treatment was 31
helpful for inhibiting microorganisms and improving storage quality, and can be an 32
effective preservation method to extend shelf-life of fresh-cut lettuce. 33
Keywords: ε-Polylysine; Ultrasound; Microorganisms; Storage quality; Fresh-cut 34
lettuce 35

MANUSCRIP
T
ACCEPTED
ACCEPTED MANUSCRIPT
1. Introduction 36
Fresh-cut lettuce is a very popular vegetable in human diet (Kim, Moon, Tou, 37
Mou, & Waterland, 2016). It’s vulnerability to microbial infection in postharvest 38
handling and processing leading to short shelf-life and poor quality. Washing is 39
necessary to decontaminate fresh-cut products. A suitable cleaning method for 40
fresh-cut vegetables will not only reduce the risk of diseases caused by pathogenic 41
microorganism contaminants, but also prolong shelf life (Sothornvit & 42
Kiatchanapaibul, 2009). The chlorine-containing disinfectants in fruits and vegetables 43
processing are unacceptable for affecting the environment and human health from 44
consumers’ concern (Gómez-López, Marín, Medina-Martínez, Gil, & Allende, 2013). 45
Therefore, it is necessary to identify safe washing ways to improve the safety of 46
fresh-cut lettuce. 47
ε-Polylysine (ε-PL) is a polypeptide which includes above 25 L-lysine linked by 48
amide bond at the ɛ position of the amino acid (Yoshida & Nagasawa, 2003). ε-PL is a 49
natural antibacterial agent acting also as detergent which is not only effective against 50
microorganisms such as Gram-positive and Gram-negative bacteria, yeast and mold, 51
but also heat stable, has good water solubility and is non-toxic to human (Li et al., 52
2014; Liu, Pei, Han, Feng, & Li, 2015). In 2003, ε-PL was listed as FDA-permitted 53
additives in USA and is widely applied to food. Recently, some studies have reported 54
that ε-PL had a good antimicrobial effect against various pathogens in food (Hiraki et 55
al., 2003). According to Chang, Lu, Park, and Kang (2010), ε-PL showed an effective 56
inhibition against pathogens in roast beef slurry. Song et al. (2017) reported that ε-PL 57

MANUSCRIP
T
ACCEPTED
ACCEPTED MANUSCRIPT
showed strong effectiveness in inhibiting microbial growth in fresh-cut carrot. 58
Ultrasound (US), as a novel and safe technology, is widely used for food 59
processing and preservation due to the cavitation effect in liquid media causing the 60
microbial inactivation (Aday, Temizkan, Büyükcan, & Caner, 2013; Cheng, Zhang, 61
Adhikari, & Islam, 2014; Islam, Zhang, & Adhikari, 2013; Lagnika, Zhang, & 62
Mothibe, 2013). Several studies have reported that ultrasound was applied for the 63
preservation of fresh-cut vegetables. Pinheiro, Alegria, Abreu, Gonçalves, and Silva 64
(2015) presented that tomato subjected to US treatment keep good storage quality. 65
Hashemi (2018) found that US treatment decreased bacterial count by 0.42-1.47 log 66
CFU/g in Mirabelle plum. Although many studies have reported that the ultrasound 67
treatment is beneficial to reduce microorganisms and prolong shelf-life of fresh 68
products, the effect of ultrasound treatment alone is limited. Therefore, ultrasound has 69
been combined with other hurdles such as the preservatives of organic acids, essential 70
oils, ozone and sanitizers in order to enhance its effectiveness. Sagong et al. (2011) 71
found that US combined with organic acids can effectively reduce pathogen load 72
without inducing the degradation of quality. Aday and Caner (2014) found that 73
ultrasound combined with ozone or chlorine dioxide for 5 min prolonged shelf-life of 74
strawberries up to 4 weeks. Millan-Sango, McElhatton, and Valdramidis (2015) found 75
that essential oils combined with ultrasound can be effective against Escherichia 76
strains. Previous researches have reported antimicrobial effect of individual US or 77
ε-PL on fresh-cut products. Nonetheless, there is limited information on the effect of 78
ultrasound combined with ε-polylysine on microorganisms and quality of fresh-cut 79

MANUSCRIP
T
ACCEPTED
ACCEPTED MANUSCRIPT
vegetables during storage. The cavitation effect of US can promote the adsorption of 80
ε-PL on the cell membrane leading to the increase of cell membrane permeability, 81
which affect the synthesis of protein and nucleic acid, and then inhibit the growth of 82
microorganisms (Tan, Bo, Guo, Cui, & Jia, 2018). The synergistic effect of two 83
treatments can make the process further effective in producing safe food products. 84
Therefore, this study paid attention to evaluate a combination treatment of ultrasound 85
and ε-polylysine on microorganisms and quality of fresh-cut lettuce during storage. 86
2. Materials and methods 87
2.1 Raw materials 88
Lettuce was purchased at Auchan supermarket (Wuxi, China), and then stored at 89
4 ºC until use. The outer and core leaves were discarded, then cut into pieces of 3 cm2 90
by a stainless knife sterilized with 75% alcohol. The cut lettuce was fully mixed to 91
achieve uniformity and used in the below sections. 92
2.2 ε-Polylysine and ultrasound treatment 93
For ε-PL treatment, fresh-cut lettuce (50 g) was put into 2 L glass beaker with 1 L 94
different concentrations of ε-polylysine solution (0, 0.1, 0.2, 0.3, 0.4 and 0.6 g/L) 95
prepared using distilled water for 10 min at 20 ºC according to the temperature 96
decreased by Chen and Zhu (2011). After treatments, sterile filter paper was used to 97
wipe the sample surface for removing excess water and air-dried for 30 min in the 98
biosafety cabinet. 99
For US treatment, fresh-cut lettuce (50 g) was put into 2 L glass beaker with 1 L 100
distilled water at 20 ºC. A 15 mm diameter ultrasound probe (NingBo Scientz 101

MANUSCRIP
T
ACCEPTED
ACCEPTED MANUSCRIPT
Biotechnology Co., China) immersed 2 cm into distilled water at 20 kHz. Schematic 102
diagram of ultrasound instrument is shown in Fig. 1. US treatment were conducted at 103
power densities of 17, 23 and 29 W/L (according to the method calculated by Ricce, 104
Rojas, Miano, Siche, and Augusto (2016)) for 10 min with pulse way (10 s on : 5 s 105
off ) at 20 ºC using a cold water circulation connected to a thermostatic bath. The 106
increase of temperature was below 2 °C after 10 min of US treatment. Distilled water 107
treatment for 10 min was used as a control. After the experiments, excess water from 108
the sample surface was removed by sterile filter paper, and samples were put into the 109
biosafety cabinet to dry for 30 min. 110
For the combination of ultrasound and ε-polylysine treatment (US+ε-PL), the 111
optimum treatment conditions were first measured for ε-PL treatments and US 112
treatments alone and evaluated the combined effects of ε-PL and US treatments at 113
those optimum conditions. Fresh-cut lettuce samples (50 g) were put into 2 L glass 114
beaker filling with 1 L ε-PL solution at 20 ºC and subjected to ultrasound treatment. 115
Samples treated by distilled water for 10 min were used as a control. Then, samples 116
were taken out and wiped with sterile filter paper to remove the excess water from the 117
surface, and the biosafety cabinet was used to dry samples for 30 min. 118
All samples were packaged at atmospheric conditions with 5 % O2, 5 % CO2, 119
90 % N2, and stored under 4 ºC. Samples were tested every 3 days (0, 3, 6, 9 and 12 d). 120
Triplicates of the experiments were done. 121
2.3 Microorganisms determination 122
Total number of colonies (total bacterial count), mold and yeast, and total 123

MANUSCRIP
T
ACCEPTED
ACCEPTED MANUSCRIPT
coliform counts of samples were tested as reported by Alexopoulos et al. (2013). Total 124
number of colonies (5.87 CFU/g), mold and yeast (4.09 CFU/g), and total coliform 125
counts (4.88 CFU/g) were observed in fresh samples without treatment. Samples (25 g) 126
were put into sterile physiological saline solution with 0.2% Tween 80 (225 mL), 127
homogenized for 2 min in a stomacher at 8000 rpm (SH-IIM, Anke Biotechnology 128
Co., Shanghai, China), and then, a series of 10 times dilutions in physiological saline 129
buffer was made. One mL of diluted sample were surface-plated on plate count agar 130
in petri dish, incubated at 37 ºC for 48 h for total number of colonies count, incubated 131
at 28 ºC for 96 h in Bangladeshi-red culture medium for mold and yeast counts (Cao 132
et al., 2010) and incubated at 37 ºC for 48 h in violet red bile glucose agar for total 133
coliform counts. Results were expressed as log CFU/g. 134
2.4 Quality parameters 135
2.4.1 Weight loss and total color difference 136
Weight loss was tested as reported by Meng, Zhang, and Adhikari (2012). The 137
mass of samples was weighted every 3 days. Results were expressed as %. 138
A colorimeter (CR-400, Konica Minolta, Japan) used to estimate the chromatic 139
characteristics of samples as L*, a* and b* according to Lu et al. (2010). Three 140
different samples were determined for each treatment and each sample was taken at 141
three positions to measure color. Total color difference (∆E) was determined by the 142
below equation. 143
144
where Lo*, ao
* and bo* were color of fresh-cut lettuce samples at 0 d after treatment. 145

MANUSCRIP
T
ACCEPTED
ACCEPTED MANUSCRIPT
2.4.2 Respiratory rate 146
Respiratory rate was tested as presented by Wu, Zhang, and Wang (2012). 147
Samples (50 g) were put into a 2 L airtight container for 30 min at 4 ºC. Gas (5 mL) 148
was taken and analyzed using gas chromatograph (Shimadzu, Co., Japan). The set 149
parameters were used for detecting CO2 as follows: Detector temperature 80 ºC, 150
column temperature 50 ºC and flow rate 0.5 mL/s. Data results were expressed as mg 151
CO2/kg·h. 152
2.4.3 Peroxidases and polyphenoloxidase activities 153
Crude enzyme extract was prepared as presented by Fante and Noreña (2012). 154
Samples (1 g) were grinded with mortar adding 5 mL 0.05 mol/L phosphate buffer 155
(pH 7.0), and then centrifuged for 20 min at 3,500 g and 4 ºC. Supernatant was used 156
for the following analysis. 157
Peroxidases (POD) activity was tested according to Meng et al. (2012). The 158
experiment was conducted by mixing 2.2 mL 1 % guaiacol, 0.2 mL 1.5 % hydrogen 159
peroxide, and 0.5 mL crude enzyme extract. Absorbance was tested using the 160
spectrophotometer at 470 nm. 161
Polyphenoloxidase (PPO) activity tested as presented by Fang, Zhang, Sun, and 162
Sun (2007). Assay was conducted by mixing 3 mL 0.01 mol/L catechol and 0.5 mL 163
crude enzyme extract. Absorbance was measured at 420 nm. 164
One unit of enzyme activity was defined as the quantity of the enzyme able to 165
produce a 0.01 increase of the absorbance units per min, both for POD and PPO. 166
2.4.4 Total phenolics content 167

MANUSCRIP
T
ACCEPTED
ACCEPTED MANUSCRIPT
Total phenolics content was tested as reported by Wang, Zhang, and Mujumdar 168
(2012). Samples (1 g) and 80% cold acetone (5 mL) were ground, then centrifuged for 169
30 min at 3,500 g and 4 ºC. The absorbance was recorded at 765 nm after 90min using 170
the spectrophotometer (UV-2600, Precision Science Instrument, Shanghai, China). 171
2.4.5 Vitamin C and chlorophyll contents 172
Vitamin C content was determined according to Yang, Cao, Cai, and Zheng 173
(2011). Samples (10 g) were ground with 10 mL 3 % metaphosphoric acid with 174
volume made up to 100 mL, and then centrifuged for 20 min at 3,500 g. Supernatant 175
(10 mL) was titrated against standard 2,6-dichloroindophenol. 176
Chlorophyll content were tested as presented by An, Zhang, Lu, and Zhang (2006) 177
with slight modifications. Samples (1 g) were mixed with 10 mL 80 % acetone and 178
centrifuged (3,500 g, 20 ºC) for 20 min. Supernatant was determined for absorbance 179
at 645 nm (A645) and 663 nm (A663). Chlorophyll content was calculated by the 180
equation: 181
2.4.6 LF-NMR 182
A low-field nuclear magnetic resonance (LF-NMR) analyzer (Niumag Electric 183
Corporation, China) with 22.6 MHz was used to test water status of fresh-cut lettuce 184
(Xin, Zhang, & Adhikari, 2013). Sample (1±0.05 g) was placed in glass tube, then put 185
into the magnet chamber at 32 ºC. Carre-Purcelle-Meiboome-Gill (CPMG) sequence 186
was used to test transverse relaxation time (T2). 187
2.5 Statistical analysis 188
One-way analysis of variance (ANOVA) was performed by SPSS 19 (SPSS Inc., 189

MANUSCRIP
T
ACCEPTED
ACCEPTED MANUSCRIPT
Chicago, USA). Duncan’s test was used to determine significant difference at 95 % of 190
confidence (P < 0.05). 191
3. Results and discussion 192
3.1 Effect of ε-PL treatment on microorganisms 193
Effect of different ε-PL concentration treatments on total number of colonies, 194
mold and yeast, and total coliforms counts in fresh-cut lettuce during 12 days of 195
storage are shown in Fig. 2A, B and C. ε-PL treatment significantly decreased (P < 196
0.05) initial microbial numbers. An increase in ε-PL concentration elevated the 197
inhibition effect of microorganisms at 12 d of storage period. The ε-PL can penetrate 198
microbial cells causing the interaction of ε-PL with nucleic acids to prevent nucleic 199
acids transcription (Song et al., 2017). As ε-PL concentration raised from 0.1 to 0.4 200
g/L, there were significant differences (P < 0.05) in inhibiting total number of 201
colonies, mold and yeast and total coliform counts during storage. There were no 202
significant differences (P > 0.05) on the reduction of total number of colonies, mold 203
and yeast and total coliform counts between 0.4 and 0.6 g/L at the storage period. Li 204
et al. (2014) reported that 0.5%-1.5% ε-PL treated chilled pork. They found that 205
1.25% ε-PL can effectively inhibit microbial growth. Therefore, 0.4 g/L ε-PL was 206
selected to study individual and combined effects. 207
3.2 Effect of ultrasound treatment on microorganisms 208
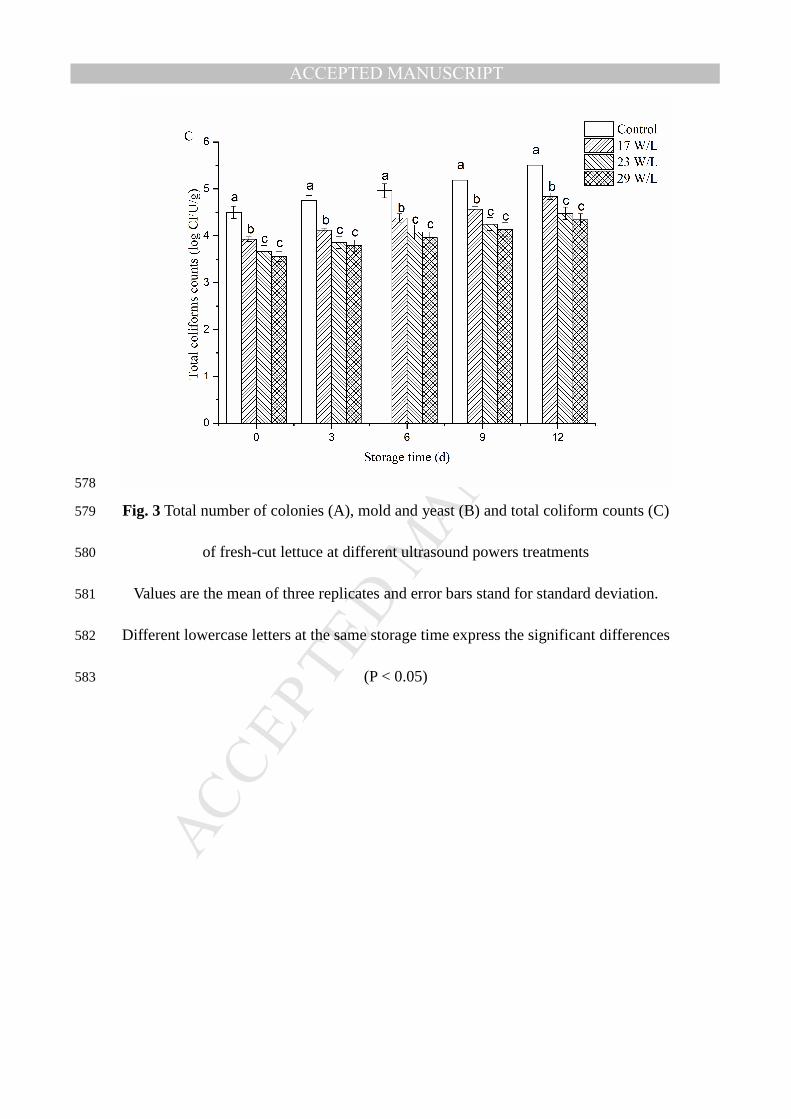
As can be seen from Fig. 3A, B and C. US treatment significantly decreased (P < 209
0.05) the initial microbial numbers. In comparison to control, as US power increased 210
from 17 to 29 W/L, total number of colonies, mold and yeast and total coliform 211

MANUSCRIP
T
ACCEPTED
ACCEPTED MANUSCRIPT
counts decreased. US can bring the cavitation phenomenon, which generate 212
mechanical and chemical energies to inactivate microorganisms (Brilhante São José & 213
Dantas Vanetti, 2012). Gani et al. (2016) reported that ultrasound treatment decreased 214
microbial number of strawberry at the storage period. US treatment at 23 and 29 W/L 215
had no significant differences (P > 0.05) in inhibiting the growth of total number of 216
colonies, mold and yeast and total coliform counts at 12 d storage period. Similarly, 217
66.64-145.74 W/L US treatment of cherry tomato, in which 106.19 W/L US 218
effectively reduced spoilage microorganisms (Wang et al., 2015). Therefore, 23 W/L 219
US treatment was selected as the treatment condition to study its individual and 220
combined effects on quality during storage. 221
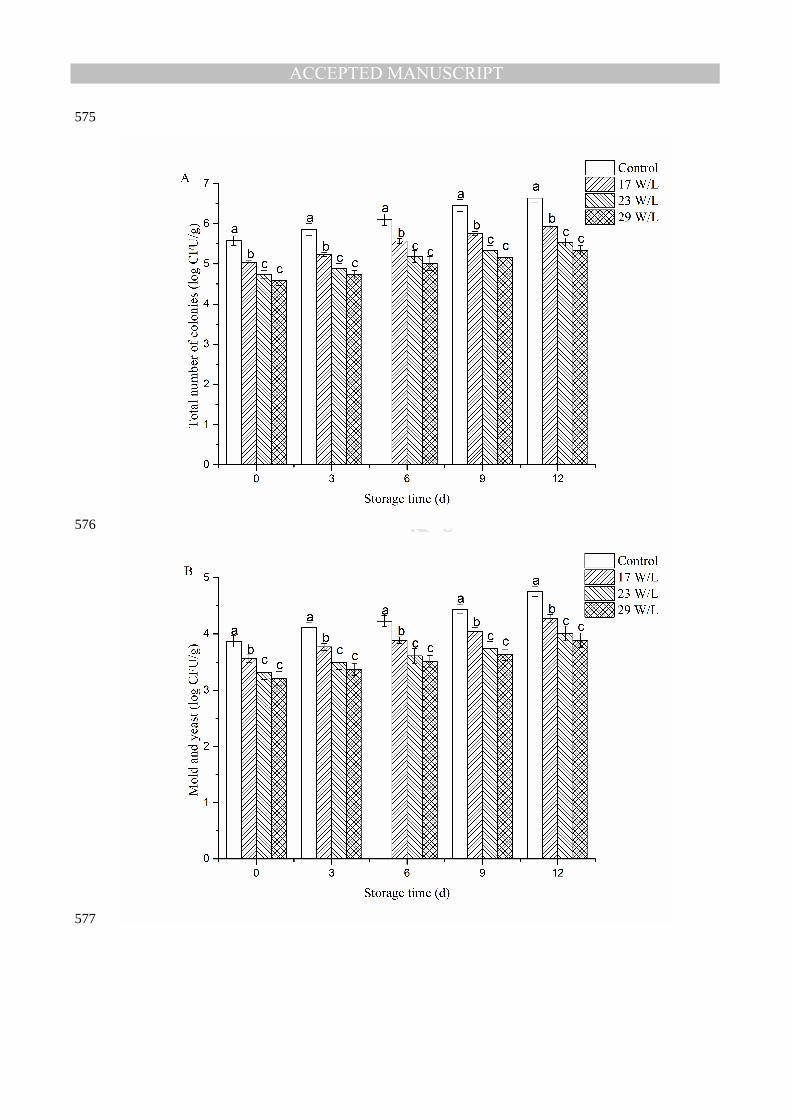
3.3 Effect of ultrasound combined with ε-PL treatment on microorganisms 222
As can be seen from Fig. 4A, B and C, compared to control, US (23 W/L), ε-PL 223
(0.4 g/L) and US (23 W/L) combined with ε-PL (0.4 g/L) treatments decreased initial 224
microbial numbers in fresh-cut lettuce by 0.85, 1.39 and 2.21 log CFU/g for total 225
number of colonies, 0.55, 0.8 and 1.35 log CFU/g for mold and yeast, 0.83, 1.14 and 226
1.88 log CFU/g for total coliform counts, respectively. US and ε-PL treatments all 227
reduced the initial microbial numbers of fresh-cut lettuce, and their combination had a 228
certain synergistic effect. Compared with the literature, Sagong et al. (2011) presented 229
that ultrasound combined with organic acid significantly reduced pathogen compared 230
to their individual treatments. The microbial numbers of fresh-cut lettuce subjected to 231
US treatment, ε-PL and US combined with ε-PL exhibited a growth with the 232
prolongation of storage time. Microbial numbers in fresh-cut lettuce subjected to US, 233

MANUSCRIP
T
ACCEPTED
ACCEPTED MANUSCRIPT
ε-PL and their combined treatments were obviously lower (P < 0.05) compared to 234
control. US showed 0.75-1.11 log CFU/g reduction, ε-PL showed 1.04-1.59 log 235
CFU/g reduction and the combined effects of US and ε-PL showed 1.52-2.57 log 236
CFU/g reduction for total number of colonies, mold and yeast, and total coliform 237
counts at 12 d of storage. This suggested that US combined with ε-PL treatment can 238
effectively reduce the microbial numbers and relatively inhibited microbial growth 239
during storage. This may be due to the fact that US promoted the adsorption of ε-PL 240
on the cell membrane to inhibit microbial growth (Cao et al., 2010). Ge, Liu, Ding, 241
Xu, and Zhong (2013) also obtained that individual and combined treatments of US 242
and slightly acidic electrolyzed water inhibited the microbial number growth of 243
strawberry during storage, and the microbial numbers of treated strawberry were 244
lower than that of control. 245
3.4 Effect of ultrasound combined with ε-PL treatment on weight loss and total color 246
difference 247
Weight loss reflects the loss of water in fruits and vegetables during storage 248
(Jiang, 2013; Qian et al., 2018). Fig. 5A shows that weight loss of all treated samples 249
gradually raised as the storage time prolonged. To compare with control, weight loss 250
of fresh-cut lettuce treated by US, ε-PL and US combined with ε-PL significantly (P < 251
0.05) reduced. US combined with ε-PL treated samples had the lowest weight loss of 252
1.42 % at 12 d. This could be because US combined with ε-PL treatment preserved 253
hydrogen bonding between water molecules and macromolecules to reduce 254
respiratory metabolism of samples leading to decrease in water loss (Li et al., 2017). 255

MANUSCRIP
T
ACCEPTED
ACCEPTED MANUSCRIPT
To compare with literature, Feng, Zhang, Adhikari, and Guo (2018) also reported that 256
combination of US and controlled atmosphere effectively decreased water loss. Hence, 257
the results suggest that US combined with ε-PL can reduce the moisture loss in 258
fresh-cut lettuce. 259
Total color difference is a critical quality indicator (Engmann, Ma, Tchabo, & Ma, 260
2015). As can be seen from Fig. 5B, ∆E of fresh-cut lettuce subjected to control, US, 261
ε-PL and US combined with ε-PL treatments increased as the storage time prolonged. 262
The ∆E of treated samples was significantly (P < 0.05) lower in comparison to control. 263
∆E of US combined with ε-PL treatment was the lowest. This could be because US 264
combined with ε-PL treatment retarded the degradation rate of pigments such as 265
chlorophyll (Feng et al., 2018). Aday and Caner (2014) also reported that US 266
combined with ozone and chlorine dioxide treatments greatly inhibited the color 267
changes. 268
3.5 Effect of ultrasound combined with ε-PL treatment on peroxidases activity, 269
polyphenoloxidase activity and total phenolics content 270
Browning related peroxidases (POD) and polyphenoloxidase (PPO) activities 271
affect the preservation of fresh-cut products (Li et al., 2017). Fig. 6 shows the effect 272
of US combined with ε-PL treatment on POD and PPO activities in fresh-cut lettuce at 273
12 d of storage period. In Fig. 6A, it is seen that POD activity increased first and then 274
decreased. POD activity for US and combination of US and ε-PL treatments 275
significantly decreased (P < 0.05) in comparison to control during the storage period. 276
However, control and ε-PL treatment had no significant differences (P > 0.05) in POD 277

MANUSCRIP
T
ACCEPTED
ACCEPTED MANUSCRIPT
activity. At 6 d of storage, POD activity reached a maximum value of 304.5 U/kg·s for 278
control and 287.67 U/kg·s for ε-PL treatment, respectively. At 9 d of storage, POD 279
activity of fresh-cut lettuce reached the maximum value of 267 U/kg·s for US 280
treatment and 256.33 U/kg·s for US combined with ε-PL treatment, respectively. POD 281
activity for US combined with ε-PL treatment was lower compared to other treatments 282
at 12 d. This could be because free radicals produced by mechanical and chemical 283
effects of US can react with the amino acids of the enzyme structure inhibiting POD 284
activity (Wang et al., 2015). Thus, this suggested that US combined with ε-PL can 285
effectively inhibit POD activity. Wei and Ye (2011) also found that POD activity in 286
asparagus subjected to US assisted with 6-benzylaminopurinetreatment declined 287
during storage. 288
Fig. 6B shows that PPO activity increased first and then decreased during storage. 289
PPO activity for US combined with ε-PL treatment significantly decreased (P < 0.05) 290
compared to control at the storage period. At storage for 6 d, PPO activity reached 291
maximum value of 297.16 U/kg·s for control, 277.5 U U/kg·s for ε-PL treatment, 292
252.83 U/kg·s for US treatment and 234.67 U/kg·s for US combined ε-PL treatment, 293
respectively. PPO activity for US combined with ε-PL treatment was lower in 294
comparison to other treatments. This could be because US produced the mechanical 295
and chemical effects inhibiting PPO activity (Li et al., 2017). Thus, US combined 296
with ε-PL had a positive effect in inhibition of PPO activity. Lagnika, Zhang, 297
Nsoratindana, and Bashari (2014) obtained a similar result with white mushroom 298
when treated with US combined with citric acid. 299

MANUSCRIP
T
ACCEPTED
ACCEPTED MANUSCRIPT
Fig. 6C shows that total phenolics content increased first and then decreased at 12 300
d of storage period. At 6 d, total phenolics content for control and ε-PL treatment 301
reached maximum value. At 9 d, total phenolics content for US and US combined 302
with ε-PL treatment reached maximum value. Total phenolics content for US 303
combined with ε-PL treatment significantly higher (P < 0.05) compared to control at 304
12 d. An increase in phenolic content could be attributed to the reason that US 305
combined with ε-PL treatment caused release of bound phenolics leading to maintain 306
a high total phenolics content during storage. As reported by Yang et al. (2011), the 307
combination treatment of ultrasound and salicylic acid can decay incidence of peach 308
fruit. 309
3.6 Effect of ultrasound combined with ε-PL treatment on vitamin C and chlorophyll 310
contents 311
Vitamin C and chlorophyll are key nutritional indicator in vegetables (Miller & 312
Riceevans, 1997). Fig. 7 shows effect of US combined with ε-PL treatment on vitamin 313
C and chlorophyll contents in fresh-cut lettuce at the storage period. As can be seen 314
from Fig. 7A, vitamin C content decreased as the storage time prolonged. To compare 315
with control, vitamin C content for US combined with ε-PL treatment significantly 316
reduced (P < 0.05) the loss of vitamin C during storage. At 12 d, vitamin C content 317
decreased by 56.48 % for control, 51.34 % for ε-PL treatment, 48.9 % for US 318
treatment and 44.01 % for US combined with ε-PL treatment. Thus, vitamin C content 319
for US and US combined with ε-PL treatments was higher in comparison to control 320
and ε-PL treatment at 12 d. This attributed to cavitation effect of ultrasound leading to 321

MANUSCRIP
T
ACCEPTED
ACCEPTED MANUSCRIPT
elimination of dissolved oxygen and microbial inactivation (Bhat, Kamaruddin, 322
Min-Tze, & Karim, 2011). As presented by Chen and Zhu (2011), US combined with 323
aqueous chlorine dioxide maintained high vitamin C content at the storage period. 324
As can be seen from Fig. 7B, chlorophyll content decreased in fresh-cut lettuce at 325
the storage period. Chlorophyll content for US combined with ε-PL treatment was a 326
significantly higher (P < 0.05) in comparison to control at the same storage period. 327
Control and ε-PL treatment had significant differences in chlorophyll content after 328
storage for 6 d (P < 0.05). At 12 d, US and US combined with ε-PL treatments 329
maintained higher chlorophyll content in comparison to control and ε-PL treatment 330
during storage. This may be due to the fact that mechanical and chemical effects of 331
ultrasound inhibited reaction of enzyme and substrates to retard chlorophyll 332
degradation rate (Wei & Ye, 2011). Thus, US combined with ε-PL treatment 333
effectively maintained the chlorophyll content in the product. Wei and Ye (2011) also 334
reported that US assisted with 6-benzylaminopurine can maintain chlorophyll content 335
of asparagus. 336
3.7 Water status and respiration rate of fresh-cut lettuce 337
Fig. 8 presents water status of fresh-cut lettuce by LF-NMR. The amplitude 338
versus T2 plot can be divided into three relaxation peaks (T21, T22 and T23). Relaxation 339
time of three peaks were centered at 0.01-1 ms (T21), 4-20 ms (T22) and 80-1000 ms 340
(T23), respectively. T21 represents the water status of bound water. T22 indicates the 341
water status of immobilized water. T23 reveals the water status of free water. 342
Table 1 presents T23 and free water proportion (A23) in the vacuole. T23 values of 343

MANUSCRIP
T
ACCEPTED
ACCEPTED MANUSCRIPT
all lettuce samples increased with the prolongation of storage time. T23 of US 344
combined with ε-PL treatment was significantly smaller (P < 0.05) in comparison to 345
control during storage. As seen from Table 1, A23 of all treated samples decreased as 346
storage time prolonged. A23 of US combined with ε-PL treatment was significantly 347
higher (P < 0.05) in comparison to other treatments at the storage period. This could 348
be because issue cell in fresh-cut lettuce had low permeability of tonoplast membrane 349
and metabolic activity, and US combined with ε-PL treatment decreased the 350
respiration rate (Fundo et al., 2016). Feng et al. (2018) reported similar results with 351
changes of water status in cucumber by US treatment. 352
As can be seen from Fig. 9, respiration rate increased first and then decreased 353
during storage. At 3 d, respiration rate reached maximum value. Fresh-cut lettuce 354
treated by US combined with ε-PL was significantly (P < 0.05) lower level of CO2 355
production compared to other treatment at the end of storage. Chen and Zhu (2011) 356
presented that US treatment can effectively retard respiration rate. This demonstrated 357
that US combined with ε-PL treatment can decrease water mobility and slow down 358
the respiration rate. 359
4. Conclusion 360
The study indicated that ε-PL, ultrasound and ultrasound combined with ε-PL 361
treatments can effectively inhibit the microorganisms growth and improve quality of 362
fresh-cut lettuce at the storage period. Ultrasound combined with ε-PL treatment can 363
be preferred over ε-PL and ultrasound alone treatments for the storage of fresh-cut 364
lettuce. Ultrasound combined with ε-PL treatment significantly decreased total 365

MANUSCRIP
T
ACCEPTED
ACCEPTED MANUSCRIPT
number of colonies, mold and yeast, and total coliform counts. Ultrasound combined 366
with ε-PL treatment had a better effect on the reduction of weight loss and change of 367
color, the inhibition of POD and PPO activities, and the maintenance of total 368
phenolics content, vitamin C and chlorophyll contents as compared to ε-PL and 369
ultrasound alone treatments. Ultrasound combined with ε-PL treatment can also 370
decrease water mobility as indicated by LF-NMR and respiration rate. In overall 371
summary, the results exhibited that the ultrasound combined with ε-PL treatment can 372
prolong preservation period of fresh-cut lettuce. This could also be a promising result 373
that can be applied to other vegetables. 374
375
Acknowledgments 376
We acknowledge the financial support from National Key R&D Program of 377
China (No. 2018YFD0700303), Postgraduate Research & Practice Innovation 378
Program of Jiangsu Province (No. KYCX19_1802), Jiangsu Province (China) Key 379
Project in Agriculture (Contract No. BE2015310217), Jiangsu Province Key 380
Laboratory Project of Advanced Food Manufacturing Equipment and Technology (No. 381
FMZ201803), National First-class Discipline Program of Food Science and 382
Technology (No. JUFSTR20180205), all of which enabled us to carry out this study.383

MANUSCRIP
T
ACCEPTED
ACCEPTED MANUSCRIPT
References 384
Aday, M. S., & Caner, C. (2014). Individual and combined effects of ultrasound, 385
ozone and chlorine dioxide on strawberry storage life. LWT - Food Science 386
and Technology, 57(1), 344-351. 387
Aday, M. S., Temizkan, R., Büyükcan, M. B., & Caner, C. (2013). An innovative 388
technique for extending shelf life of strawberry: Ultrasound. LWT - Food 389
Science and Technology, 52(2), 93-101. 390
Alexopoulos, A., Plessas, S., Ceciu, S., Lazar, V., Mantzourani, I., Voidarou, C., et al. 391
(2013). Evaluation of ozone efficacy on the reduction of microbial population 392
of fresh cut lettuce ( Lactuca sativa ) and green bell pepper ( Capsicum 393
annuum ). Food Control, 30(2), 491-496. 394
An, J., Zhang, M., Lu, Q., & Zhang, Z. (2006). Effect of a prestorage treatment with 395
6-benzylaminopurine and modified atmosphere packaging storage on the 396
respiration and quality of green asparagus spears. Journal of Food 397
Engineering, 77(4), 951-957. 398
Bhat, R., Kamaruddin, N. S., Min-Tze, L., & Karim, A. A. (2011). Sonication 399
improves kasturi lime (Citrus microcarpa) juice quality. Ultrasonics 400
Sonochemistry, 18(6), 1295-1300. 401
Brilhante São José, J. F., & Dantas Vanetti, M. C. (2012). Effect of ultrasound and 402
commercial sanitizers in removing natural contaminants and Salmonella 403
enterica Typhimurium on cherry tomatoes. Food Control, 24(1-2), 95-99. 404
Cao, S., Hu, Z., Pang, B., Wang, H., Xie, H., & Wu, F. (2010). Effect of ultrasound 405

MANUSCRIP
T
ACCEPTED
ACCEPTED MANUSCRIPT
treatment on fruit decay and quality maintenance in strawberry after harvest. 406
Food Control, 21(4), 529-532. 407
Chang, S. S., Lu, W. Y., Park, S. H., & Kang, D. H. (2010). Control of foodborne 408
pathogens on ready-to-eat roast beef slurry by epsilon-polylysine. Int J Food 409
Microbiol, 141(3), 236-241. 410
Chen, Z., & Zhu, C. (2011). Combined effects of aqueous chlorine dioxide and 411
ultrasonic treatments on postharvest storage quality of plum fruit ( Prunus 412
salicina L.). Postharvest Biology and Technology, 61(2), 117-123. 413
Cheng, X.-f., Zhang, M., Adhikari, B., & Islam, M. N. (2014). Effect of power 414
ultrasound and pulsed vacuum treatments on the dehydration kinetics, 415
distribution, and status of water in osmotically dehydrated strawberry: a 416
combined NMR and DSC study. Food Bioprocess Technol., 7(10), 2782-2792. 417
Engmann, F. N., Ma, Y., Tchabo, W., & Ma, H. (2015). Ultrasonication treatment 418
effect on anthocyanins, color, microorganisms and enzyme inactivation of 419
mulberry (Moraceae nigra) juice. Journal of Food Processing & Preservation, 420
39(6). 421
Fang, Z., Zhang, M., Sun, Y., & Sun, J. (2007). Polyphenol oxidase from bayberry 422
(Myrica rubra Sieb. et Zucc.) and its role in anthocyanin degradation. Food 423
Chemistry, 103(2), 268-273. 424
Fante, L., & Noreña, C. P. Z. (2012). Enzyme inactivation kinetics and colour changes 425
in Garlic ( Allium sativum L.) blanched under different conditions. Journal of 426
Food Engineering, 108(3), 436-443. 427

MANUSCRIP
T
ACCEPTED
ACCEPTED MANUSCRIPT
Feng, L., Zhang, M., Adhikari, B., & Guo, Z. (2018). Effect of ultrasound combined 428
with controlled atmosphere on postharvest storage quality of cucumbers 429
( Cucumis sativus L.). Food & Bioprocess Technology, 11(7), 1328-1338. 430
Fundo, J. F., Galvis-Sanchez, A., Madureira, A. R., Carvalho, A., Feio, G., Silva, C. L. 431
M., et al. (2016). NMR water transverse relaxation time approach to 432
understand storage stability of fresh-cut ‘Rocha’ pear. LWT - Food Science and 433
Technology, 74, 280-285. 434
Gómez-López, V. M., Marín, A., Medina-Martínez, M. S., Gil, M. I., & Allende, A. 435
(2013). Generation of trihalomethanes with chlorine-based sanitizers and 436
impact on microbial, nutritional and sensory quality of baby spinach. 437
Postharvest Biology and Technology, 85, 210-217. 438
Gani, A., Baba, W. N., Ahmad, M., Shah, U., Khan, A. A., Wani, I. A., et al. (2016). 439
Effect of ultrasound treatment on physico-chemical, nutraceutical and 440
microbial quality of strawberry. LWT - Food Science and Technology, 66, 441
496-502. 442
Ge, Z., Liu, D., Ding, T., Xu, Y., & Zhong, J. (2013). Ultrasound combined with 443
slightly acidic electrolyzed water treatment improves quality of immature 444
strawberry. Transactions of the Chinese Society of Agricultural Engineering, 445
29(17), 265-270. 446
Hashemi, S. M. B. (2018). Effect of pulsed ultrasound treatment compared to 447
continuous mode on microbiological and quality of Mirabelle plum during 448
postharvest storage. International Journal of Food Science & Technology, 449

MANUSCRIP
T
ACCEPTED
ACCEPTED MANUSCRIPT
53(3), 564-570. 450
Hiraki, J., Ichikawa, T., Ninomiya, S., Seki, H., Uohama, K., Seki, H., et al. (2003). 451
Use of ADME studies to confirm the safety of epsilon-polylysine as a 452
preservative in food. Regul Toxicol Pharmacol, 37(2), 328-340. 453
Islam, M. N., Zhang, M., & Adhikari, B. (2013). The inactivation of enzymes by 454
ultrasound—A review of potential mechanisms. Food Reviews International, 455
30(1), 1-21. 456
Jiang, T. (2013). Effect of alginate coating on physicochemical and sensory qualities 457
of button mushrooms (Agaricus bisporus) under a high oxygen modified 458
atmosphere. Postharvest Biology and Technology, 76(1), 91-97. 459
Kim, M. J., Moon, Y., Tou, J. C., Mou, B., & Waterland, N. L. (2016). Nutritional 460
value, bioactive compounds and health benefits of lettuce ( Lactuca sativa L.). 461
Journal of Food Composition & Analysis, 49, 19-34. 462
Lagnika, C., Zhang, M., & Mothibe, K. J. (2013). Effects of ultrasound and high 463
pressure argon on physico-chemical properties of white mushrooms (Agaricus 464
bisporus) during postharvest storage. Postharvest Biology and Technology, 82, 465
87-94. 466
Lagnika, C., Zhang, M., Nsoratindana, J., & Bashari, M. (2014). Effects of ultrasound 467
and chemical treatments on white mushroom (Agaricus bisporus) prior to 468
modified atmosphere packaging in extending shelf-life. Journal of Food 469
Science & Technology, 51(12), 3749-3757. 470
Li, N., Chen, F., Cui, F., Sun, W., Zhang, J., Qian, L., et al. (2017). Improved 471

MANUSCRIP
T
ACCEPTED
ACCEPTED MANUSCRIPT
postharvest quality and respiratory activity of straw mushroom (Volvariella 472
volvacea) with ultrasound treatment and controlled relative humidity. Scientia 473
Horticulturae, 225, 56-64. 474
Li, Y. Q., Feng, J. L., Han, Q., Dai, Z. Y., Liu, W., & Mo, H. Z. (2014). Effects of 475
ε-polylysine on physicochemical characteristics of chilled pork. Food & 476
Bioprocess Technology, 7(9), 2507-2515. 477
Liu, H., Pei, H., Han, Z., Feng, G., & Li, D. (2015). The antimicrobial effects and 478
synergistic antibacterial mechanism of the combination of ε-Polylysine and 479
nisin against Bacillus subtilis. Food Control, 47(1), 444-450. 480
Lu, D., Zhang, M., Wang, S., Cai, J., Zhou, X., & Zhu, C. (2010). Nutritional 481
characterization and changes in quality of Salicornia bigelovii Torr. during 482
storage. LWT - Food Science and Technology, 43(3), 519-524. 483
Meng, X., Zhang, M., & Adhikari, B. (2012). Extending shelf-life of fresh-cut green 484
peppers using pressurized argon treatment. Postharvest Biology and 485
Technology, 71, 13-20. 486
Millan-Sango, D., McElhatton, A., & Valdramidis, V. P. (2015). Determination of the 487
efficacy of ultrasound in combination with essential oil of oregano for the 488
decontamination of Escherichia coli on inoculated lettuce leaves. Food 489
Research International, 67, 145-154. 490
Miller, N. J., & Riceevans, C. A. (1997). The relative contributions of ascorbic acid 491
and phenolic antioxidants to the total antioxidant activity of orange and apple 492
fruit juices and blackcurrant drink. Food Chemistry, 60(3), 331-337. 493

MANUSCRIP
T
ACCEPTED
ACCEPTED MANUSCRIPT
Pinheiro, J., Alegria, C., Abreu, M., Gonçalves, E. M., & Silva, C. L. M. (2015). 494
Influence of postharvest ultrasounds treatments on tomato (Solanum 495
lycopersicum , cv. Zinac) quality and microbial load during storage. 496
Ultrasonics Sonochemistry, 27, 552-559. 497
Qian, C., Ren, N., Wang, J., Xu, Q., Chen, X., & Qi, X. (2018). Effects of exogenous 498
application of CPPU, NAA and GA4+7 on parthenocarpy and fruit quality in 499
cucumber (Cucumis sativus L.). Food Chemistry, 243, 410-413. 500
Ricce, C., Rojas, M. L., Miano, A. C., Siche, R., & Augusto, P. E. D. (2016). 501
Ultrasound pre-treatment enhances the carrot drying and rehydration. Food 502
Res Int, 89(Pt 1), 701-708. 503
Sagong, H.-G., Lee, S.-Y., Chang, P.-S., Heu, S., Ryu, S., Choi, Y.-J., et al. (2011). 504
Combined effect of ultrasound and organic acids to reduce Escherichia coli 505
O157:H7, Salmonella Typhimurium, and Listeria monocytogenes on organic 506
fresh lettuce. International Journal of Food Microbiology, 145(1), 287-292. 507
Song, Z., Li, F., Guan, H., Xu, Y., Fu, Q., & Li, D. (2017). Combination of nisin and 508
ε-polylysine with chitosan coating inhibits the white blush of fresh-cut carrots. 509
Food Control, 74, 34-44. 510
Sothornvit, R., & Kiatchanapaibul, P. (2009). Quality and shelf-life of washed 511
fresh-cut asparagus in modified atmosphere packaging. LWT - Food Science 512
and Technology, 42(9), 1484-1490. 513
Tan, Z., Bo, T., Guo, F., Cui, J., & Jia, S. (2018). Effects of epsilon-poly-l-lysine on 514
the cell wall of Saccharomyces cerevisiae and its involved antimicrobial 515

MANUSCRIP
T
ACCEPTED
ACCEPTED MANUSCRIPT
mechanism. Int J Biol Macromol, 118(Pt B), 2230-2236. 516
Wang, W., Ma, X., Zou, M., Jiang, P., Hu, W., Li, J., et al. (2015). Effects of 517
ultrasound on spoilage microorganisms, quality, and antioxidant capacity of 518
postharvest cherry tomatoes. Journal of Food Science, 80(10), C2117-C2126. 519
Wang, Y., Zhang, M., & Mujumdar, A. S. (2012). Influence of green banana flour 520
substitution for cassava starch on the nutrition, color, texture and sensory 521
quality in two types of snacks. LWT - Food Science and Technology, 47(1), 522
175-182. 523
Wei, Y., & Ye, X. (2011). Effect of 6-benzylaminopurine combined with ultrasound as 524
pre-treatment on quality and enzyme activity of green asparagus. Journal of 525
Food Processing & Preservation, 35(5), 587-595. 526
Wu, Z. S., Zhang, M., & Wang, S. (2012). Effects of high pressure argon treatments 527
on the quality of fresh-cut apples at cold storage. Food Control, 23(1), 528
120-127. 529
Xin, Y., Zhang, M., & Adhikari, B. (2013). Effect of trehalose and ultrasound-assisted 530
osmotic dehydration on the state of water and glass transition temperature of 531
broccoli (Brassica oleracea L. var. botrytis L.). Journal of Food Engineering, 532
119(3), 640-647. 533
Yang, Z., Cao, S., Cai, Y., & Zheng, Y. (2011). Combination of salicylic acid and 534
ultrasound to control postharvest blue mold caused by Penicillium expansum 535
in peach fruit. Innovative Food Science & Emerging Technologies, 12(3), 536
310-314. 537
MANUSCRIP
T
ACCEPTED
ACCEPTED MANUSCRIPT
Yoshida, T., & Nagasawa, T. (2003). ε-Poly-L-lysine: microbial production, 538
biodegradation and application potential. Applied Microbiology & 539
Biotechnology, 62(1), 21-26. 540
541

MANUSCRIP
T
ACCEPTED
ACCEPTED MANUSCRIPT
Figure and Table captions: 542
Fig. 1 Schematic diagram of ultrasound treatment set-up 543
Fig. 2 Total number of colonies (A), mold and yeast (B) and total coliform counts (C) 544
of fresh-cut lettuce at different ε-PL concentrations treatments 545
Fig. 3 Total number of colonies (A), mold and yeast (B) and total coliform counts (C) 546
of fresh-cut lettuce at different ultrasound powers treatments 547
Fig. 4 Effect of ultrasound combined with ε-PL treatments on total number of 548
colonies (A), mold and yeast (B) and total coliform counts (C) of fresh-cut lettuce 549
Fig. 5 Effect of ultrasound combined with ε-PL treatments on weight loss (A) and 550
total color difference (B) of fresh-cut lettuce 551
Fig. 6 Effect of ultrasound combined with ε-PL treatments on peroxidases activity (A), 552
polyphenoloxidase activity (B) and total phenolics content (C) of fresh-cut lettuce 553
Fig. 7 Effect of ultrasound combined with ε-PL treatments on vitamin C content (A) 554
and chlorophyll content (B) of fresh-cut lettuce 555
Fig. 8 Distribution of transverse relaxation times (T2) in fresh-cut lettuce 556
Fig. 9 Effect of ultrasound combined with ε-PL treatments on respiratory rate of 557
fresh-cut lettuce 558
Table 1 Transverse relaxation time (T23) and free water proportion (A23) of fresh-cut 559
lettuce during storage560

MANUSCRIP
T
ACCEPTED
ACCEPTED MANUSCRIPT
561
562
Fig. 1 Schematic diagram of ultrasound treatment set-up: 1. ultrasound generator, 2. 563
beaker; 3. ultrasonic transducer, 4. ultrasound probe, 5. thermocouple, 6. distilled 564
water, 7. samples, 8. data logger565

MANUSCRIP
T
ACCEPTED
ACCEPTED MANUSCRIPT
566
567
568

MANUSCRIP
T
ACCEPTED
ACCEPTED MANUSCRIPT
569
Fig. 2 Total number of colonies (A), mold and yeast (B) and total coliform counts (C) 570
of fresh-cut lettuce at different ε-PL concentrations treatments 571
Values are the mean of three replicates and error bars stand for standard deviation. 572
Different lowercase letters at the same storage time express the significant differences 573
(P < 0.05) 574
MANUSCRIP
T
ACCEPTED
ACCEPTED MANUSCRIPT
575
576
577
MANUSCRIP
T
ACCEPTED
ACCEPTED MANUSCRIPT
578
Fig. 3 Total number of colonies (A), mold and yeast (B) and total coliform counts (C) 579
of fresh-cut lettuce at different ultrasound powers treatments 580
Values are the mean of three replicates and error bars stand for standard deviation. 581
Different lowercase letters at the same storage time express the significant differences 582
(P < 0.05) 583

MANUSCRIP
T
ACCEPTED
ACCEPTED MANUSCRIPT
584
585
586

MANUSCRIP
T
ACCEPTED
ACCEPTED MANUSCRIPT
587
Fig. 4 Effect of ultrasound combined with ε-PL treatments on total number of 588
colonies (A), mold and yeast (B) and total coliform counts (C) of fresh-cut lettuce 589
Values are the mean of three replicates and error bars stand for standard deviation. 590
Different lowercase letters at the same storage time express the significant differences 591
(P < 0.05) 592

MANUSCRIP
T
ACCEPTED
ACCEPTED MANUSCRIPT
593
594
Fig. 5 Effect of ultrasound combined with ε-PL treatments on weight loss (A) and 595
total color difference (B) of fresh-cut lettuce 596
Values are the mean of three replicates and error bars stand for standard deviation. 597
Different lowercase letters at the same storage time express the significant differences 598
(P < 0.05) 599

MANUSCRIP
T
ACCEPTED
ACCEPTED MANUSCRIPT
600
601
602

MANUSCRIP
T
ACCEPTED
ACCEPTED MANUSCRIPT
603
Fig. 6 Effect of ultrasound combined with ε-PL treatments on peroxidases activity (A), 604
polyphenoloxidase activity (B) and total phenolics content (C) of fresh-cut lettuce 605
Values are the mean of three replicates and error bars stand for standard deviation. 606
Different lowercase letters at the same storage time express the significant differences 607
(P < 0.05) 608

MANUSCRIP
T
ACCEPTED
ACCEPTED MANUSCRIPT
609
610
Fig. 7 Effect of ultrasound combined with ε-PL treatments on vitamin C content (A) 611
and chlorophyll content (B) of fresh-cut lettuce 612
Values are the mean of three replicates and error bars stand for standard deviation. 613
Different lowercase letters at the same storage time express the significant differences 614
(P < 0.05) 615

MANUSCRIP
T
ACCEPTED
ACCEPTED MANUSCRIPT
616
617
Fig. 8 Distribution of transverse relaxation times (T2) in fresh-cut lettuce. Three 618
relaxation peaks: T21, bound water; T22, immobilized water; T23, free water 619

MANUSCRIP
T
ACCEPTED
ACCEPTED MANUSCRIPT
620
621
Fig. 9 Effect of ultrasound combined with ε-PL treatments on respiratory rate of 622
fresh-cut lettuce 623
Values are the mean of three replicates and error bars stand for standard deviation. 624
Different lowercase letters at the same storage time express the significant differences 625
(P < 0.05) 626

MANUSCRIP
T
ACCEPTED
ACCEPTED MANUSCRIPT
Table 1 Transverse relaxation time (T23) and free water proportion (A23) of fresh-cut lettuce during storage 627
Storage Time (d) Control ε-PL US US+ε-PL
T23 (ms) 0 219.64 ± 10.86a 219.64 ± 10.86a 219.64 ± 10.86a 219.64 ± 10.86a
3 289.94 ± 14.81a 252.35 ± 28.53ab 270.49 ± 13.07ab 235.43 ± 22.22b
6 302.15 ± 14.96a 284.42 ± 22.92a 311.27 ± 19.28ab 247.15 ±17.08b
9 355.26 ±21.39a 309.75 ± 18.20ab 346.53 ± 22.29a 261.29 ± 16.47b
12 388.37 ± 22.89a 330.28 ± 15.05b 372.16 ± 18.49ab 272.57 ± 13.84c
A23 (%) 0 96.31 ± 1.51a 96.31 ±1.51a 96.31 ±1.51a 96.31 ±1.51a
3 90.89 ± 0.63c 93.74 ± 0.52ab 92.98 ± 0.69b 94.17 ± 0.66a
6 88.65 ± 0.46d 91.58 ± 0.41c 89.17 ± 0.58b 92.34 ± 0.24a
9 86.78 ± 0.55c 89.83 ± 0.59b 87.84 ± 0.59c 91.12 ± 0.08a
12 84.54 ± 0.38d 87.22 ± 0.16b 85.25 ± 0.18c 89.56 ± 0.33a
Values are mean ± standard deviation of three replicates.Different lowercase letters in the same row express the significant differences (P < 0.05) 628

MANUSCRIP
T
ACCEPTED
ACCEPTED MANUSCRIPT
Highlights
• Ultrasound combined with ε-polylysine treatment inhibited microorganisms.
• Ultrasound combined with ε-polylysine treatment maintained quality
attributes.
• Ultrasound combined with ε-polylysine treatment decreased water mobility.
• Ultrasound combined with ε-polylysine treatment extend shelf life of lettuce.

MANUSCRIP
T
ACCEPTED
ACCEPTED MANUSCRIPT
Conflicts of interest
There are no conflicts to declare.
Recommended