
A Citizens’ Report Card on Water, Sanitation & Hygiene in 25 slums of
Lucknow, Uttar Pradesh

SACOSAN IV FOLLOW UP SERIES-2
ESTEEMED U.P. PARTNER PARTICIPATED IN THE STUDY
SHOHRATGARH ENVIRONMENTAL SOCIETY
GANGA
A Citizens’ Report Card on Water, Sanitation &
Hygiene in 25 slums of Lucknow, Uttar Pradesh
Study Supported by: FANSA
Analysis & Report by : Sandeep Srivastava & Programme Monitoring
Evaluation & Documentation (PMED) team, SES
Published in 2013 by: FANSA U.P. Chapter & SHOHRATGARH
ENVIRONMENTAL SOCIETY
Data Compilation: Prashant Kumar
Picture on Cover Page: People in balu walla addah slum where dwellers do
not have any source of drinking water as well as toilets & they bring water
from outside & person in Right to Sanitation Campaign in March 2013

CONTENTS
FOREWORD 4
EXECUTIVE SUMMARY 5
INTRODUCTION 6
CHAPTER 1- ABOUT THE STUDY 9
CHAPTER 2- STATUS OF WATER, SANITATION & 11 HYGIENE IN 25 SLUMS
CHAPTER 3- KEY FINDINGS & CONCLUSION 23

4 | P a g e
FOREWORD
It is my pleasure to present you citizen report card (CRC) on water, sanitation &
hygiene in 25 slums of Lucknow. 1.1 billion People live without clean drinking
water.2.6 billion people lack adequate sanitation across the world. Earlier, to face
the crisis, the United Nations formulated an amount of so called Millennium
Development Goals, dedicated to reduce poverty and ensure sustainable
development. Water & sanitation was important target under goal 7 i.e. Ensure
Environmental Sustainability. Goal number 7, target 10 is the following one:
"Halve, by 2015, the proportion of people without sustainable access to safe water
and basic sanitation." The year of reference for this goal was 1990. In Post 2015
Development agenda, water & sanitation may be designated as separate goal.
Including the issue as separate goal explains crucial condition of water &
sanitation across the globe.
The citizen report card is joint initiative of FANSA India & SES. It is an effort to
present current status of WASH in slums. We felt that the voice of citizens, often
weak in our country. It is necessary to know citizens’ experiences, levels of
satisfaction and priorities for service improvements. It is well captured in the CRC
as a timely and welcome health check. It can be used basis for continued dialogue
among citizen groups, service providers and policy makers towards marked
improvements in the quantity and quality of services. Hope you will like our
effort & help you to some extent.
Sandeep Srivastava
Convener, FANSA U.P. Chapter

5 | P a g e
EXECUTIVE SUMMARY
This is a summary of the Citizen‟s Report Card (CRC) on water, sanitation and
hygiene & its services undertaken in 25 slums of Lucknow in Uttar Pradesh .CRC is
a tool providing service providers and policy makers with feedback from citizens.
These CRCs were undertaken by a representative group of stakeholders in each
slums .CRCs gauge both citizens‟ access to and satisfaction with services. They point
out areas where service providers are succeeding and areas that need improvement.
When prepared regularly, CRCs may be used as a combined
advocacy/benchmarking tool. The information provided in a CRC may be helpful to
utility managers in strategic planning; to policy makers in guiding the sector; to
regulatory bodies in sector oversight; to investors in deciding where to channel funds;
and to civil society representing an objective measure of public perception. Most
importantly, CRCs are useful for citizens who generally lack the information
conducive to meaningful dialogue. The CRC is the experience of citizens as told by
citizens. It is not a technical sector overview written for specialist audiences and does
not include figures from the service providers such as volume of water produced or
number of households served. It is meant to guide recommendations but does not in
itself provide the solutions.

6 | P a g e
INTRODUCTION
Citizen Report Card
The Citizen Report Card (CRC) is an important & powerful tool to provide feedback to public
agencies from users of public services, and enable them to map their strengths and weaknesses in
their work & improve it. CRCs are is analysis from compilation of data collected during a
randomized sample survey of the users of public services. In our case, water, sanitation, hygiene
and solid waste (rubbish) management. The responses are collected & analyzed in order to rate the
services. Just like the report cards used to rate students in school. Through this Citizen Report
Cards one will get consumer response over quality and adequacy of water and sanitation services.
It‟ll express their satisfaction level with service. It should be taken as opportunity which tried to
bring the attention of decision-makers, and give consumers and civil society organization a tool for
bringing pressure to bear for their resolution. It is important to understand the difference between
the data provided by a CRC and that of other studies or reports. Whereas a study of service
provision standards may provide factual information on the number of connections registered by a
utility, the water quality based on laboratory tests, or the volume of wastewater treated, CRCs
provide information of the consumers‟ perceptions of services: whether they have access to
connections, whether they think the water is clean, whether they feel the service meets their needs.
Need of Citizen Report Card
Historically, consumers of public services in India have not enjoyed high levels of engagement with
service providers on the planning or ongoing management of their services. It may be reason
where no systems which can make service provider accountable. To strengthen „consumer voice‟
and the accountability of service providers is very important in order to improve public services.
Citizen Report Cards provide reliable, quantitative information on the aspects of service provision
that users know best, and are based directly on users‟ experience.
This information can be used to generate recommendations on sector policies, program strategy
and management of service delivery. Furthermore, the information can be used as a basis for
policy makers, service providers and consumers to engage in dialogue, an important step towards
improved public services.

7 | P a g e
In The Context of Lucknow:
Estimates of the number of slums in Lucknow vary. Certainly, as the areas of poor housing are
found on the fringes of the city, on the banks of river arid nallahs near railway tracks, as well as
other areas where land can be found. These slums are sometimes in large well defined settlements,
but often in scattered clusters in the interstices between better housing zones. In Lucknow,
existence of settlements of poor is denied or they are treated as illegal settlements or categorized as
illegal encroachers and they hardly considered in the city development planning rather plans are
executed to evict them whereas provisions are made for the regularization of the illegal colonies in
the city Master Plan. In 2001, Lucknow was ranked as slum less city. After CSO pressure, 3,
60,958 slum dwellers were identified. CSO mapped 787 slum settlements with 11 lakh population
in 2005-06. Government data of 2010 says there are 793 slums.
Total population of Lucknow (census 2011) is 45, 88,455 and out of this slum population and
homeless data is still to come. In some cases municipal bodies and utility service providers are
constrained by capacities and resources to tackle this challenge and the poorest of the poor, living
in slum clusters, end up receiving extremely low levels of service delivery for water supply,
sanitation and hygiene management.
Lack of maintenance, provision and awareness about health and hygiene services is the major
cause of diarrhoea and other intestinal infections that are amongst the major killers of young
children in the world today. In the city of Lucknow there may be a million episodes and deaths
each year from diarrhoea. Chronic diarrhea can also hinder child development by impeding the
absorption of essential nutrients that are critical to the development of the mind, body, and
immune system.
Improving the water supply, sanitary infrastructure along with improvements in domestic
conditions may be able to make a big impact on preventing these unnecessary losses due to illness.
Creating sanitation infrastructure and public services that work for everyone, including poor
people, and that keep waste out of the environment is a major challenge.
There is a huge disparity between the level of service prevailing in planned settlements and
unorganized slum clusters, this leads to both social discontent and frustration among the poor. In
8 | P a g e
the absence of proper service, the following becomes essential:
• To promote using latrines for the disposal of child stools for those that have them, and
building latrines by those that do not.
•Use of soap kept especially for hand washing.
•Mothers to be keen and able to adopt these practices because cleanliness is very important
to them.
•Communicating with mothers, which is otherwise difficult because of the low level of
contact with outside sources of information.
Though above are general problems, but there is no documented number of hand pumps or tube
wells in Lucknow.
Right to Water and Sanitation is for everyone even they
live in slums.

9 | P a g e
Chapter 1 - ABOUT THE STUDY
RATIONALE OF THE STUDY
From April 4-7, 2011 heads of delegation from Afghanistan, Bangladesh, India, Maldives, Nepal,
and Pakistan & Srilanka have participated in 4th South Asian Conference on Sanitation
(SACOSAN IV). It was also attended by ministers, senior civil servants, civil society, NGO &
private sector and school children. They acknowledged that sanitation & hygiene is in very critical
condition in South Asia. They have committed on several points in the meeting. Few are
mentioned below:
As UN resolution has recognized right to sanitation, they are committed to work
progressively to realize this in programme & projects and eventually in legislation
To design & deliver context specific equitable & inclusive sanitation & hygiene
programme including better identification of the poorest & most marginalized group in
rural & urban area who need them most .
To recognise importance of people‟s own contribution to sanitation
To establish specific public sector budget for sanitation & hygiene.
To design & deliver context specific equitable & inclusive sanitation & hygiene programmes
including better identification of the poorest & most marginalized groups in rural & urban
areas, including transparent targeting of financing to programmes for those who need them
most, and taking into account the challenge of protecting the environment and responding
to emergencies & climate change.
As SACOSAN V has to be organized this year in Nepal. In SACOSAN IV, It was also committed
to report specifically all SACOSAN IV commitments at SACOSAN V. If you give attention to last
bold points above, it has dealt with sanitation & hygiene facilities of urban & rural poor &
marginalized community. Hence, it is necessary to take up study on current status of sanitation &
hygiene facilities in slums of Uttar Pradesh. It will give glimpse over sanitation & hygiene facility
condition & status of school in largest populated state of India. As water, sanitation & hygine are
interlimked, we have also tried to find water & solid management condition in these slums.

10 | P a g e
OBJECTIVE OF STUDY
Uttar Pradesh (UP) is the most populous state of India. The objective of this study was to conduct
survey based study of situation of WASH and its services in 25 urban slums settlement of
Lucknow and prepare a citizen report card and disseminate among crucial stakeholders to
generate awareness about the current scenario.
PROCESS & METHODOLOGY
This study tried to provide current status of water, sanitation & hygiene in 25 slums. There were
questions regarding sanitation & hygiene in slums. Initially, through a series of small meeting with
stakeholders, was combined with assessments to ascertain whether local conditions were suitable.
Political receptivity, the openness of service providers to receive feedback and the vibrancy of civil
society and media in the cities were assessed. It was decided to focus the process in 25 slums of
Lucknow city in May 2013. Two civil society organizations who would act as Lead Agencies were
selected in city. In June, each Agency in organized Focus Group Discussions (FGDs) with groups
of residents of slums to examine the issues and challenges affecting delivery of water supply,
sanitation and solid waste management services. Total 25 FGDs were conducted amongst
communities from various age group, gender etc.
The Methodology for study includes survey of selected 25 slums of Lucknow. The study was
conducted over a three-week period from June 1st to June 22nd
, 2013. The study was given to
FANSA U.P. Partners. FANSA U.P. Chapter has communicated the objectives of the study to its
partner. In order to carry out the household survey & interviews, both organization mobilized total
6 surveyors cum interviewer supported by their other organizational staff. They‟ll also informally
orient about the study by their respective organization. Participation of community was completely
voluntary. They provided oral consent prior to participating and they actively participated in study.
The survey consisted of 375 household interviews in 25 slums. The survey aimed to cover the old
lucknow & new lucknow city. The survey format was developed by FANSA U.P. Chapter.
Four themes were identified for data analysis and report preparation:
Availability, access and use of services
Perceptions of quality and reliability of services
Costs incurred by users
Satisfaction with services

11 | P a g e
Chapter -2- Status of Water, Sanitation & Hygiene in 25 Slums
TARGET AREA
Uttar Pradesh is largest populated state. On development aspect, some of region is leading & some
are lagging behind. Lucknow is the capital city of the state of Uttar Pradesh in India. As reported in
the Census of India 2011 Lucknow had population of 2,908,455. Between 1991 and 2001 the
population registered a decadal growth of 32.03 percent which was much less than the 37.14
percent which was registered between 1981 and 1991 decade. The initial provisional data suggest a
density of 1,815 in 2011 compared to 1,443 of 2001. However, the density of population was
much above that obtained at the state level (690 persons per km2.). The National Sample Survey
Organization of the Ministry of Programme of Implementation has published the information
regarding the urban slums in India by basic services. As per Compendium of Environment
Statistics, 2001, more than 90 per cent of the slums in India and Uttar Pradesh had facilities for
safe drinking water. Our study tried to find reality regarding Water, Sanitation & Hygiene in
selected slums.
Lucknow

12 | P a g e
TARGETED GROUP
Under This Study, Total 25 Slums were surveyed. We have selected two type of locality i.e. old
lucknow & new lucknow city. Direct Target group of this proposal are people living in selected
slums. Women and Children are most important stakeholders of this proposal. Indirect Target
Group are those government functionary related to schemes to those slums, people from NGO
fraternity and Media people. The study aims to share this CRC with them & let them take
appropriate action to improve condition of people living in slums (PLS).
WATER
Availability, Access and Usage of Water Sources
Below Figure shows the pattern of access for the total population of the 25 slums. These are
sources that are available to a household, not only the ones they choose to use. (Note that
respondents could indicate that they had access to more than one source.) Around 67 % of
community members surveyed use public water taps while 12.8 % have their individual hand
pump , 16.8 % use hand pump located at public place. Rest of members use protected &
unprotected source for water.
0
50
100
150
200
250
300Handpump at Individual
Handpump at public place
Public water taps /watersupply
Supply by tankers
Protected source
Unprotected Source
Bring water on their own
Figure 1: Water Source Used By Slum Dwellers

13 | P a g e
We asked respondents about times of scarcity, which were defined as low or lack of water supply
lasting five days or longer. It was explained to respondents that this is different from a short term
water cut. Figure below show the months in which scarcity was reported by users:
0
20
40
60
80
100
120
140
160
March
April
May
June
July
August
Figure 2: Month Of Water Scarcity in slums
62.13 % respondent said they face scarcity of water in summers & 15.7 % said they face scarcity in
monsoon season. At that time, they seem to rely more on protected wells and rainwater and even
unprotected sources, including rivers, streams and dug-out wells, presumably because of the Cost
implications of buying supplemental water. We can conclude that the problems posed in times of
scarcity impose a cost; either in amounts spent on water, or in the time spent fetching water from
outside the home.
Consumer Perceptions on Quality and Reliability of Service
Collected data show that the vast majority of households using water from public tap.14.93 % of
respondent said taste is acceptable while 70.1 % said taste is not acceptable. 5.06 % said smell is
acceptable While 5.6 % said non acceptable smell. While, 4.85 % said clear colour of water. Thus
majority of respondent said taste is not acceptable to them.

14 | P a g e
0
50
100
150
200
250
300
Acceptable Taste
Non Acceptabletaste
Acceptable smell
Non Acceptablesmell
Clear colour
Figure 3: Quality of Water
We asked respondents who used mains how many hours /days/ week they receive water. In normal
times a large proportion of mains users reported getting water seven days a week. In scarcity
times few tap users having consistent level of water supply. As well as asking about the number
of days per week, we asked respondents who used the public taps how many hours a day they
received water from them. As shown below, It was found 92 % of respondent get water less than
2 hours.
20%
27%45%
8%
Less than 1 hr
1-2 hr
2 hr
No supply
Figure 4: Supply of Water Hours

15 | P a g e
The maximum combination is 24 hours of water seven days a week, or 168 hours a week. The
benchmarks for service require provision of a minimum of 20 hours a day, or 140 hours a week, to
be scored as “good”, and a minimum of 16 hours a day, or 112 hours a week, to be scored as
“acceptable”. But above data says a different story, results regarding supply of water to these
community members are not good in any way.
As mentioned above surveyed most of community members face scarcity of water in some months
or get less than two hour supply. Most of them use public taps for water. So, they have to come out
to carry water. But majority (99%) of walk less than 1 kilo meter to carry water. From below pie
chart it clear that out of 100 times, 63.43 times female carry water while male carry only 33.6 times.
0
10
20
30
40
50
60
70
female carrying
water
male carrying
water
Figure 5: Water Carrier at Household
It is clear that women are shouldering the burden of water collection, and that this is exacting a
high price in terms of time spent. If women from poor families are spending an hour or more a
day fetching water in normal times, and even more in scarcity times, they are losing out on wage
earning activities. Time to take part in community activities, get an education or care for other
family members and will also be suffering from exhaustion. The data show that the participation of
men in water collection increases in scarcity times, with adult males becoming slightly more
involved. It can be assumed that this also has an impact on the wage-earning potential of
households.

16 | P a g e
We asked households who used sources outside the residential premises how many minutes they
spent fetching water every day. Around 65 % fetch it in less than half an hour while rest collects in
more than half an hour. Below chart will give clear view of fetching water.
58%
9%
17%
13%3%
Less than 15 minutes
half an hour
45 minutes
60 minutes
more than 60 minutes
Figure 6: Spend Time in fetching Water
When we ask water they daily use is safe for drinking .60 % said it is safe for drinking while 40 %
do not consider it safe for drinking. Due to bad taste, smell and colour, majority of users in city
felt it was necessary to treat tap water, probably because they are worried about bacterial
contamination. It was later asked whether they know any method of purification of water, 45 %
responded affirmatively. Majority of respondent boil water for purification. 83.5 Of respondent
have storage utensil for water which is covered.

17 | P a g e
60%
40%
Safe Water for Drnking
Unsafe water for drinking
Figure 7: Drinking Water Quality
The percent of water tap –using households who reported experiencing major stoppages, defined
as interruptions in water supply lasting more than 24 hours i.e. 66.4 % response from community
members. It is clear that the poor seem to experience more stoppages than other non –poor family
We asked households who reported using water sources outside their residential premises, such as
Public hand pump or taps, if they faced problems when hey fetched water. The highest proportion
of respondents saying yes .The top problem households told us about water collection is long
queue. The data below indicate that fetching water from outside sources is stressful, cumbersome
and unpleasant.
72%
7%
11%
10%
Long Queue
Queue Jumping
Quarrel
Problem increased at time of scarcity
Figure 8: Problem in Fetching Water

18 | P a g e
SANITATION
Figure below shows the main place where respondents said their family members relieve
themselves. It is clear that pit latrines are the type of toilet used by 24 % Of people. Pit latrines are
used much more in comparison to flush toilets i.e. 3 %. We aware surprised by data of open
defecation in state capital of Lucknow. 62 % of people in these slums defecate openly. This is
condition of Lucknow and slums around posh area. So, imagining toilets in other district is difficult
for us.
24%
8%
2%
1%
62%
1%2%
Private Pit
Share pit
Private Flush
Shared Flush
Neighbourhood toilet
Public Toilet
Openly Defecate
Figure 9: Availability of toilet facilities
We asked people who said they used toilets where the waste from their toilet goes. A majority of
respondents using toilets said it goes to pit. 26 % said, it goes to sewer.

19 | P a g e
26%
65%
8% 1%
Goes in sewer
Pit
Septic tank
Treatment
Figure 10: Release of Waste from Toilets
Looking at majority of open defecation in these slums, we tried to find reason of open defecation.
Majority of respondent said they do not have space in home to construct a toilet . Surprisingly ,
only 5 % reasoned lack of money for toilet lacking house. Data collected can be seen in below pie
.chart.
5%
63%
6%
4%
6%
6%
6%2%2%
No Money
No Space
Not their property
No Near By Public Toilet
Feel Public toilet too expensive
Dirty/smelly public toilet
feel public toilet unsafe for children
Full & overflown public toilet
poor constructed public toilets

20 | P a g e
Figure 11: Reason For Open Defecation
76 % percentage of respondents said they have experienced problems with sewerage. Pproblems
that seemed to be the most prevalent were to mosquito breeding by poor sewerage. See below data
to know the reason.
3%11%
13%
9%
3%
61%
Sewer is broken
Sewer is spilled out/flooded
Sewer open
bad smell
no tretament
invitation to mosquito breeding
Slice 7
Figure 12: Problem with sewerage
Figure below shows the satisfaction with the availability of and cleanliness of public toilets.81 % of
respondents expressing an opinion said they were satisfied, with availability of public toilet but only
18 % were satisfy with cleanliness of public toilets.
0
10
20
3040
50
60
70
80
90
In
percentage
Satisfied with availability ofPublic toilets
Satisfied with cleanliness ofpublic toilets
Figure 13: Satisfaction with Availability & Cleanliness of public toilets
21 | P a g e
SOLID WASTE MANAGEMENT
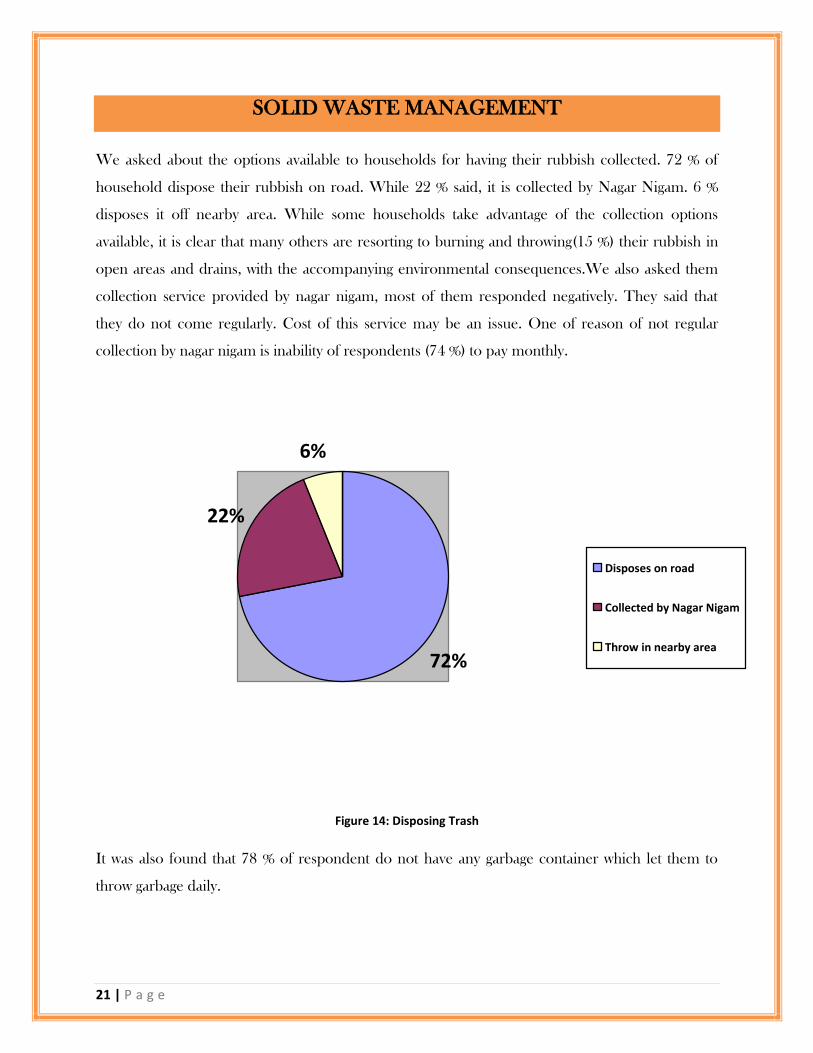
We asked about the options available to households for having their rubbish collected. 72 % of
household dispose their rubbish on road. While 22 % said, it is collected by Nagar Nigam. 6 %
disposes it off nearby area. While some households take advantage of the collection options
available, it is clear that many others are resorting to burning and throwing(15 %) their rubbish in
open areas and drains, with the accompanying environmental consequences.We also asked them
collection service provided by nagar nigam, most of them responded negatively. They said that
they do not come regularly. Cost of this service may be an issue. One of reason of not regular
collection by nagar nigam is inability of respondents (74 %) to pay monthly.
72%
22%
6%
Disposes on road
Collected by Nagar Nigam
Throw in nearby area
Figure 14: Disposing Trash
It was also found that 78 % of respondent do not have any garbage container which let them to
throw garbage daily.

22 | P a g e
HYGEINE
Hygiene is commonly known as cleanliness or conditions and practices that serve to promote or
preserve health. A population that does not take into consideration hygiene is at risk of infection
and illness. Improved housing, improved nutrition and improved hygiene are the essential
components for the war against infectious diseases.
Many people living in these slums experience that they practice personal hygiene such as brushing
teeth, hand washing , bathing the body although not as frequent as it is desired. From water &
sanitation data it is clear that lack of resources, such as water, results in poor hygiene levels; toilets
cannot be washed and there is not enough water to shower in these slums. This experience was
shared by participants in focused group discussion.
These slums dwellers house were made of temporary materials such as straw roofs, mud, earthen
floors. High population density at limited area provides little space per person. Most of
cohabitation of various families and more single rooms. It was seen one room shared by six
family members. Same room is used for cooking, sleeping and living. The lack of basic services,
visible and open sewers, the lack of pathways, the uncontrolled dumping of waste and polluted
environments, result to unhealthy living and hazardous living conditions. Some Houses are built
in locations which are not suitable for a human settlement; such as near waste disposal sites. Due
to poor waste management & a poor drainage system along with poor infrastructure increase
suffering of these slum dwellers.

23 | P a g e
Chapter -3- Key Findings & Conclusion
Only 12.8 % individuals have their
own individual water source
Major stoppage of water is of more
than 24 hours. 64 % are affected by this.
A small but significant number of
household is using unprotected source of
water
Due to unavailability of toilets 62 %
defecate openly
Large number of people is using
public tabs
Large number of people experiencing
poor sewerage system
In time of scarcity, most of them
dependent on other sources of water or
fetch water from outside which cot them
money as well as time.
Options for solid management is very
limited & most people dispose their trash on
roads
Large number of respondent said
taste of water from public tab is not
acceptable
Satisfaction with solid waste
management is very low.
Taps consumer get water less than
two hours.

24 | P a g e
CRC is just like monitoring & evaluation tool which help stakeholder to know where sector is
aiming. It certainly helps to measure progress over a period of time & help in better planning &
implementation with already set milestones
Citizen‟s Report Card finding provides us a conspicuous understanding of how these gaps affect
the respondent in their day-to-day lives. In this study, it was found that most of use public tap but
most of taps provide water around two hours. AT the time of water scarcity their suffering
increases. They were paying more for water & relaying heavily on taps. It gives insight baout lesser
known area & their qulaity of life. There are positive as well as negative from this study &
satisafction varies from one slum to another.
Most of residents of these slums has expressed their satisfaction over sanitation facilities. Especially
old lucknow area where open defecation is common. As there is less space in slums, there can be
mobile toilets This is an important area where & decision & policy maker need to heed.
Like sanitation, satisfaction with solid waste management is much lower than water. Mos of
respondents throw their rubbish in open spaces especially roads. Such action has also serious
public health implications. So there can be suitable investment.
As a tool CRC can be discussed in detail and used as a basis for continued interaction among city
dwellers, citizen groups, slum dwellers, association, service providers and decision/policy makers.

25 | P a g e
Sample of Questionnaire Format Used In Study

26 | P a g e
NAME OF 25 SLUMS IN STUDY
PALTAN AKBARNAGAR PURANA
KATARA RAHIM NAGAR PURANA
MOHIBULLAPUR DHOBI TOLA
BELIGARAD NAHAR KA KINARA WALA SLUM
NAYA GAON HATA RASOOL KA
PURANIA CROSSING KUNDANLAL KA HATA
JANKI VIHAR WALA SLUM CHURAI KERA MALIN
ABHISHEKPURAM ALANKAR CINEMA KE PEECHE WALA SLUM
NAYI BASTI CHIMARAN TOLA
KHANNA KA TAKIA NAVBASTA HAIDER GANJ
MEHNDIGANJ PATTEGANJ
CHAUBE JI KA HATA MOTINAGAR
SLUM NEAR RAM LILA PARK NOOR WADI
GAVARAN TOLA
Recommended


![m03[1]Sanitation and Hygiene](https://img.dokumen.tips/doc/110x75/577c81e51a28abe054ae98fe/m031sanitation-and-hygiene.jpg)


