1
1996

2
CIP-GEGEVENS KONINKLIJKE BIBLIOTHEEK, DEN HAAG
Annual
Annual Report/Eurotransplant International Foundation.–Leiden:Eurotransplant Foundation. -III., graf., tab.Verschijnt jaarlijksAnnual report 1996 / ed. by Bernard Cohen, Guido Persijn, Johan De MeesterISBN 90-71658-14-7Trefw.: Eurotransplant Foundation; jaarverslagen.

3
Eurotransplant mission statement
1. To achieve an optimal use of available donor organs and tissues;2. To secure a transparent and objective selection system, based upon medical criteria;3. To assess the importance of factors which have the greatest influence on transplant results;4. To support donor procurement to increase the supply of donor organs and tissue;5. To further improve the results of transplantation through scientific research;6. Promotion, support and coordination of organ transplantation in the broadest sense of terms.

4
TABLE OF CONTENTS
Eurotransplant mission statement 3
Board of Eurotransplant International Foundation 7Renal Transplant Centers 8Heart Transplant Centers 10Lung Transplant Centers 11Liver Transplant Centers 11Pancreas Transplant Centers 12Tissue Typing Laboratories 13
Foreword 15
Introduction 17
1. Report of the Board of Stichting Eurotransplant International Foundation 19
2. Eurotransplant: donation, waiting lists and transplants 232.1 Donation and donor organ availability in 1996 232.1.1 Cadaveric organ donors from the Eurotransplant area 232.1.2 Cadaveric organ donors from outside the Eurotransplant area 242.1.3 Living donor transplants 242.2 Active patient waiting list at the end of 1996 242.3 Inflow on the waiting list during 1996 252.4 Outflow from the waiting list during 1996 252.4.1 Organ transplants from non-living donors 252.4.2 Mortality on the waiting list 26
3. Kidney: donation, waiting lists and transplants 273.1 Kidney donors 273.2 Waiting list 293.3 Inflow on the waiting list during 1996 313.4 Outflow from the waiting list during 1996 313.4.1 Kidney transplants from non-living donors 313.4.2 Mortality on the waiting list 313.4.3 De-listing 313.5 Living donor kidney transplants 313.6 Kidney-only ‘High Urgency’ program 32
4. Thoracic Organs: donation, waiting lists and transplants 334.1 Thoracic organ donors 334.1.1 Heart donors 334.1.2 Lung donors 334.2 Waiting lists 354.3 Inflow on the thoracic waiting list during 1996 384.4 Outflow from the waiting list during 1996 384.4.1 Thoracic organ transplants from non-living donors 384.4.2 Mortality on the waiting list 394.4.3 De-listing 394.4.4 Thoracic organ transplants from living donors 404.5 Thoracic ‘High Urgency’ program 404.6 Thoracic ‘Special Urgency’ program 41

5
Table of Contents (continued)
5. Liver: donation, waiting lists and transplants 435.1 Liver donors 435.2 Waiting list 445.3 Inflow on the liver waiting list during 1996 455.4 Outflow from the liver waiting list during 1996 455.4.1 Liver transplants from non-living donors 455.4.2 Mortality on the waiting list 455.4.3 De-listing 455.5 Living donor liver transplants 465.6 Liver ‘High Urgency’ program 47
6. Pancreas: donation, waiting lists and transplants 496.1 Pancreas donors 496.2 Waiting list 496.3 Inflow on the pancreas waiting list during 1996 516.4 Outflow from the waiting list during 1996 516.4.1 Pancreas transplants from non-living donors 516.4.2 Mortality on the waiting list 52
7. Histocompatibility Testing 53Introduction 53
7.1 Eurotransplant Proficiency Testing 537.1.1 Quality control exercise on HLA typing 537.1.2 Quality control exercise on HLA-DR typing by DNA 537.1.3 Quality control exercise on crossmatching 547.1.4 Quality control exercise on screening 547.1.5 Proficiency testing on donor retyping 547.2 Eurotransplant serum sets 557.3 Other activities 557.3.1 Third extramural meeting 557.3.2 Acceptable mismatch program 557.3.3 Recipient retyping study 557.3.4 Site visits 557.3.5 Tissue Typing Advisory Committee 557.4 Future perspectives 55
8. Publications 57Introduction 57
8.1 Publications 578.2 Abstracts 59
Addendum 57Table 1 Number of patients actively on the waiting list on December 31, 1996,
stratified by organ, per country and center 63Table 2a Cadaveric donor activities in 1996, stratified by type of donation,
per country and center 64Table 2b Cadaveric donor activities in 1996, stratified by organ used in a transplant,
per country and per center 65Table 3a Cadaveric donor transplant activities in 1996, stratified by organ,
per country and per center 66Table 3b Living donor transplant activities in 1996, stratified by organ,
per country and per center 67Table 4 Organ exchange of the Eurotransplant countries, based upon the tranplant
activities in 1996 68Table 5 Organ exchange in cadaveric donor transplantation, in 1996,
between the Eurotransplant transplant programs 70
Balance sheet and exploitation result 80

6
7
Board of EurotransplantInternational Foundationas per December 31, 1996
Prof. Dr. Y. Vanrenterghem, Leuven president
Drs. H.M.A. Schippers, The Hague secretary/treasurer
Prof. Dr. U. Frei, Berlin on behalf of the kidney / pancreas section
Prof. Dr. J.P. van Hooff, Maastricht on behalf of the kidney / pancreas section
Prof. Dr. A. Haverich, Hannover on behalf of the thoracic section
Prof. Dr. J. Vanhaecke, Leuven on behalf of the thoracic section
Prof. Dr. B. Ringe, Göttingen on behalf of the liver section
Prof. Dr. M.J.H. Slooff, Groningen on behalf of the liver section
Prof. Dr. E. Dupont, Brussels on behalf of the tissue typing section
Prof. Dr. G. Opelz, Heidelberg on behalf of the tissue typing section
Prof. Dr. F.X. Lackner, Vienna ethical advisor
Prof. Dr. F. Mühlbacher, Vienna on behalf of the Austrian Transplant Society
Prof. Dr. B. de Hemptinne, Gent on behalf of the Belgian Transplant Society
Prof. Dr. G. Kootstra, Maastricht on behalf of the Dutch Transplant Society
Prof. Dr. P. Neuhaus, Berlin on behalf of the German Transplant Society
Prof. Dr. F. H.J. Claas, Leiden on behalf of the Eurotransplant Reference Laboratory
8
TR
AN
SP
LA
NT
AC
TIV
ITIE
S I
N 1
996
Cent
er-
Cent
er /
City
Surg
eon
Phys
icia
nTr
ansp
lant
coo
rdin
ator
s.co
de
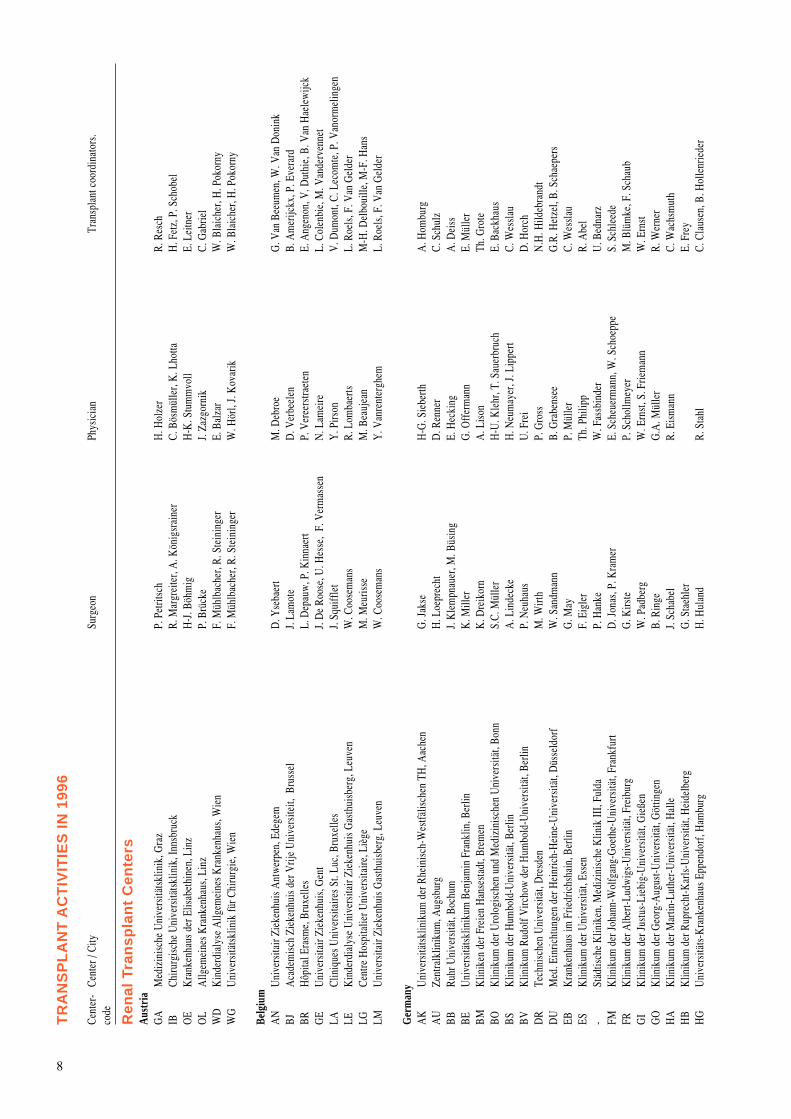
Ren
al T
ran
spla
nt
Cen
ters
Aus
tria
GA
Med
izin
isch
e U
nive
rsitä
tskl
inik
, Gra
zP.
Pet
ritsc
hH
. Hol
zer
R. R
esch
IBCh
irurg
isch
e U
nive
rsitä
tskl
inik
, Inn
sbru
ckR.
Mar
grei
ter,
A. K
önig
srai
ner
C. B
ösm
ülle
r, K
. Lho
ttaH
. Fet
z, P
. Sch
obel
OE
Kra
nken
haus
der
Elis
abet
hine
n, L
inz
H-J
. Böh
mig
H-K
. Stu
mm
voll
E. L
eitn
erO
LA
llgem
eine
s Kra
nken
haus
, Lin
zP.
Brü
cke
J. Za
zgor
nik
C. G
abrie
lW
DK
inde
rdia
lyse
Allg
emei
nes K
rank
enha
us, W
ien
F. M
ühlb
ache
r, R.
Ste
inin
ger
E. B
alza
rW
. Bla
iche
r, H
. Pok
orny
WG
Uni
vers
itäts
klin
ik fü
r Chi
rurg
ie, W
ien
F. M
ühlb
ache
r, R.
Ste
inin
ger
W. H
örl,
J. K
ovar
ikW
. Bla
iche
r, H
. Pok
orny
Belg
ium
AN
Uni
vers
itair
Ziek
enhu
is A
ntw
erpe
n, E
dege
mD
. Yse
baer
tM
. Deb
roe
G. V
an B
eeum
en, W
. Van
Don
ink
BJA
cade
mis
ch Z
ieke
nhui
s der
Vrij
e U
nive
rsite
it, B
russ
elJ.
Lam
ote
D. V
erbe
elen
B. A
mer
ijckx
, P. E
vera
rdBR
Hôp
ital E
rasm
e, B
ruxe
lles
L. D
epau
w, P
. Kin
naer
tP.
Ver
eers
traet
enE.
Ang
enon
, V. D
uthi
e, B
. Van
Hae
lew
ijck
GE
Uni
vers
itair
Ziek
enhu
is, G
ent
J. D
e Ro
ose,
U. H
esse
, F.
Ver
mas
sen
N. L
amei
reL.
Col
enbi
e, M
. Van
derv
enne
tLA
Clin
ique
s Uni
vers
itaire
s St.
Luc,
Bru
xelle
sJ.
Squi
ffle
tY
. Pirs
onV
. Dum
ont,
C. L
ecom
te, P
. Van
orm
elin
gen
LEK
inde
rdia
lyse
Uni
vers
itair
Zie k
e nhu
is G
a sth
uisb
e rg,
Le u
ven
W. C
oose
man
sR.
Lom
bae r
tsL.
Roe
ls, F
. Va n
Ge l
der
LGCe
ntre
Hos
pita
lier U
nive
rsita
ire, L
iège
M. M
euris
seM
. Be a
uje a
nM
-H. D
e lbo
uille
, M-F
. Ha n
sLM
Uni
vers
itair
Zie k
e nhu
is G
a sth
uisb
e rg,
Le u
ven
W. C
oose
man
sY
. Va n
rent
e rgh
emL.
Roe
ls, F
. Va n
Ge l
der
Ge r
man
yA
KU
nive
rsitä
tskl
inik
um d
e r R
hein
isc h
-We s
tfälis
c he n
TH
, Aa c
hen
G. J
a kse
H-G
. Sie
berth
A. H
ombu
rgA
UZe
ntra
lklin
ikum
, Aug
sbur
gH
. Loe
pre c
htD
. Re n
ner
C. S
c hul
zBB
Ruhr
Uni
vers
ität,
Boch
umJ.
Kle
mpn
aue r
, M. B
üsin
gE.
He c
king
A. D
e iss
BEU
nive
rsitä
tskl
inik
um B
enja
min
Fra
nklin
, Be r
linK
. Mill
e rG
. Off
e rm
ann
E. M
ülle
rBM
Klin
ike n
de r
Fre
ien
Ha n
sest
a dt,
Brem
enK
. Dre
ikor
nA
. Lis
onTh
. Gro
teBO
Klin
ikum
de r
Uro
logi
sche
n un
d M
ediz
inis
c he n
Uni
vers
ität,
Bonn
S.C.
Mül
ler
H-U
. Kle
hr, T
. Sa u
e rbr
uch
E. B
a ckh
aus
BSK
linik
um d
e r H
umbo
ld-U
nive
rsitä
t, Be
rlin
A. L
inde
c ke
H. N
e um
aye r
, J. L
ippe
rtC.
We s
sla u
BVK
linik
um R
udol
f Virc
how
de r
Hum
bold
-Uni
vers
ität,
Berli
nP.
Ne u
haus
U. F
rei
D. H
orc h
DR
Tec h
nisc
hen
Uni
vers
ität,
Dre
sde n
M. W
irth
P. G
ross
N.H
. Hild
e bra
ndt
DU
Med
. Ein
richt
unge
n de
r He i
nric
h-H
e ine
-Uni
vers
ität,
Düs
seld
orf
W. S
a ndm
ann
B. G
rabe
nse e
G.R
. He t
z el,
B. S
c ha e
pers
EBK
rank
enha
us im
Frie
dric
hsha
in, B
e rlin
G. M
ayP.
Mül
ler
C. W
e ssl
a uES
Klin
ikum
de r
Uni
vers
ität,
Esse
nF.
Eig
ler
Th. P
hilip
pR.
Abe
l-
Stä d
tisc h
e K
linik
e n, M
ediz
inis
c he
Klin
ik II
I, Fu
lda
P. H
a nke
W. F
a ssb
inde
rU
. Be d
narz
FMK
linik
um d
e r Jo
hann
-Wol
fga n
g-G
oeth
e -U
nive
rsitä
t, Fr
a nkf
urt
D. J
ona s
, P. K
ram
e rE.
Sc h
e ue r
man
n, W
. Sc h
oepp
eS.
Sc h
lee d
eFR
Klin
ikum
de r
Alb
e rt-L
udw
igs-
Uni
vers
ität,
Fre i
burg
G. K
irste
P. S
c hol
lmey
e rM
. Blü
mke
, F. S
c ha u
bG
IK
linik
um d
e r Ju
stus
-Lie
big-
Uni
vers
ität,
Gie
ßen
W. P
a dbe
rgW
. Ern
st, S
. Frie
man
nW
. Ern
stG
OK
linik
um d
e r G
e org
-Aug
ust-U
nive
rsitä
t, G
öttin
gen
B. R
inge
G.A
. Mül
ler
R. W
e rne
rH
AK
linik
um d
e r M
a rtin
-Lut
her-
Uni
vers
ität,
Ha l
leJ.
Scha
bel
R. E
ism
ann
C. W
a chs
mut
hH
BK
linik
um d
er R
upre
cht-K
arls
-Uni
vers
ität,
Hei
delb
erg
G. S
taeh
ler
E. F
rey
HG
Uni
vers
itäts
-Kra
nken
haus
Epp
endo
rf, H
ambu
rgH
. Hul
and
R. S
tahl
C. C
laus
en, B
. Hol
lenr
iede
r

9
Cent
er-
Cent
er /
City
Surg
eon
Phys
icia
nTr
ansp
lant
coo
rdin
ator
s.co
de
HM
Nep
hrol
ogis
ches
Zen
trum
Nie
ders
achs
en, H
ann.
Mün
den
W. S
chot
t, K
. Roh
wer
E. Q
uellh
orst
K. R
ohw
erH
OK
linik
um d
er M
ediz
inis
chen
Hoc
hsch
ule,
Han
nove
rR.
Pic
hlm
ayr
K. K
och
F. V
ogel
sang
HS
Klin
ikum
der
Uni
vers
ität d
es S
aarla
ndes
, Hom
burg
/Saa
rM
. Zie
gler
H. K
öhle
r, W
. Rie
gel
C. F
riedr
ichs
ohn
JEK
linik
um d
er F
riedr
ich-
Schi
ller-
Uni
vers
ität,
Jena
J. Sc
hube
rtH
. Spe
rsch
neid
erR.
Bör
ner
KI
Klin
ikum
Chr
istia
n-A
lbre
chts
-Uni
vers
ität,
Kie
lD
. Hen
ne-B
runs
H. K
raem
er-H
anse
nG
. Sch
ütt,
N. R
obie
nK
KK
inde
rklin
ik d
er U
nive
rsitä
t, K
öln
H. P
ichl
mai
erC.
Bal
dam
usM
. Pol
lok
KL
Klin
ik d
er U
nive
rsitä
t Köl
n-Li
nden
thal
, Köl
nA
.H. H
ölsc
her
C. B
alda
mus
M. P
ollo
kK
MSt
ädtis
che
Kra
nken
anst
alte
n K
öln-
Mer
heim
, Köl
nA
. Pau
l, H
. Tro
idl
W. A
rns,
M. W
eber
W. A
rns
KS
III.
Med
izin
isch
e K
linik
, Kai
sers
laut
ern
W. S
eybo
ld-E
ptin
gF.
Alb
ert,
U. S
chm
idt
S. S
chle
ede
LPK
linik
um d
er U
nive
rsitä
t, Le
ipzi
gJ.
Hau
ssH
. Ach
enba
chT.
Wei
skirc
hen
LUK
linik
um d
er M
ediz
inis
chen
Uni
vers
ität,
Lübe
ckJ.
Hoy
erL.
Fric
keL.
Fric
ke, E
. Pet
erse
nM
AK
linik
um d
er S
tadt
, M
annh
eim
D. L
oren
z, P
. Tre
deF.
J. va
n de
r Wou
de, P
. Sch
nülle
A. M
ülle
rM
HK
linik
um R
echt
s der
Isar
der
Tec
hnis
chen
Uni
vers
ität
C.D
. Hei
deck
eF.
Kop
pC.
Sch
ulz,
W. E
berh
ardt
ML
Klin
. Gro
ßhad
ern
der L
udw
ig-M
axim
ilian
s-U
nive
rsitä
t, M
ünch
enW
. Lan
dB.
Zan
ker
C. S
chul
zM
NK
linik
um d
er W
estfä
lisch
en W
ilhel
ms-
Uni
vers
ität,
Mün
ster
K.H
. Die
tlC.
Spi
eker
S. K
ley,
M. M
aurit
zM
RK
linik
um L
ahnb
e rge
de r
Phi
lipps
-Uni
vers
ität,
Ma r
burg
H. R
iedm
ille r
H. L
a nge
U. H
e ck
MZ
Klin
ikum
de r
Joha
nne s
-Gut
e nbe
rg-U
nive
rsitä
t, M
a inz
R. H
ohen
felln
e rE.
Wan
del
C. K
rebe
r-W
a lth
e r, S
. Sc h
lee d
eN
BM
ed. E
inric
htun
gen
der U
nive
rsitä
t Erla
ngen
-Nür
nbe r
g, N
ürnb
e rg
K. S
c hro
ttI.
Ha u
ser
K. B
urkh
a rdt
, L. R
e nde
rsRB
Klin
ikum
de r
Uni
vers
ität,
Rege
nsbu
rgK
.W. J
a uc h
, C. Z
ülke
B.K
. Krä
me r
L. R
e nde
rs, C
. Bur
kha r
dtRO
Klin
ikum
de r
Uni
vers
ität,
Rost
ock
H. S
e ite
r, R.
Tem
plin
R. S
c hm
idt
F-P.
Nits
c hke
STK
a tha
rine n
hosp
ital,
Stut
tga r
tG
. Je n
a lC.
J. O
lbric
htM
. Ka l
usTU
Klin
ikum
de r
Ebe
rha r
d-K
a rls
-Uni
vers
ität,
Tübi
ngen
W. L
auch
a rt
H. B
e cke
rC.
Fis
c he r
-Frö
hlic
hU
LK
linik
um d
e r U
nive
rsitä
t, U
lmD
. Abe
ndro
thM
. Sch
imm
e rW
ZK
linik
um d
e r Ju
lius-
Max
imili
a ns-
Uni
vers
ität,
Wür
z bur
gH
. Fro
hmül
ler
C. W
anne
rD
. De
Cic c
o
Luxe
mbo
urg
LXCe
ntre
Hos
pita
lier d
e Lu
xem
bour
gS.
Lam
yP.
Duh
oux
R . D
iffe r
ding
The
Ne t
her l
ands
AW
Ac a
dem
isc h
Med
isc h
Ce n
trum
, Am
ste r
dam
C. K
oxJ.
Wilm
ink
J. Po
pma
GR
Ac a
dem
isc h
Zie
kenh
uis,
Gro
ning
enH
. Men
sink
, R. P
loe g
A. T
e gz e
ssR.
va n
Gin
kel,
J. K
rane
nbur
g,P.
va n
Wijn
gaa r
den
LBA
c ade
mis
c h Z
ieke
nhui
s, Le
ide n
J. Ri
nge r
sH
. de
Fijte
rM
. va n
Gur
p, M
. Kru
ysw
ijkM
SA
c ade
mis
c h Z
ieke
nhui
s, M
a ast
richt
G. K
oots
traJ.
van
Hoo
ffA
. Oom
enN
YA
c ade
mis
c h Z
ieke
nhui
s St.
Radb
oud,
Nijm
egen
F. B
uske
nsR.
Koe
neH
. va n
We z
e l, W
. Hor
dijk
,RD
Ac a
dem
isc h
Zie
kenh
uis D
ijkz i
gt, R
otte
rdam
J. Je
e ke l
W. W
e im
a rM
. Kru
ysw
ijk, M
. Gro
ot, M
. va n
Gur
pRS
Soph
ia K
inde
rzie
kenh
uis,
Rotte
rdam
J. Be
rgm
e ije
rJ.
Na u
taM
. Kru
ysw
ijk, M
. Gro
ot, M
. va n
Gur
pU
TA
c ade
mis
c h Z
ieke
nhui
s, U
trec h
tR.
va n
Re e
dt D
ortla
ndR.
He n
éP.
Ba t
a vie
r, D
. Na a
fs, J
. Pop
ma
UW
Wilh
e lm
ina
Kin
derz
ieke
nhui
s, U
trec h
tN
. Ba x
J. va
n G
ool,
M. L
ilie n
P. B
a ta v
ier,
D. N
a afs
, J. P
opm
a

10
Cent
er-
Cent
er /
City
Surg
eon
Phys
icia
nTr
ansp
lant
coo
rdin
ator
s.co
de
Hea
rt T
ran
spla
nt
Cen
ters
Aus
tria
GA
Chiru
rgis
che
Uni
vers
itäts
klin
ik, G
raz
K-H
. Tsc
helie
ssni
ggW
. Kle
inR.
Res
chIB
Chiru
rgis
che
Uni
vers
itäts
klin
ik, I
nnsb
ruck
R. M
argr
eite
r, H
. Ant
rette
rO
. Pac
hing
erH
. Fet
z, P
. Sch
obel
WG
Uni
vers
itäts
klin
ik fü
r Chi
rurg
ie, W
ien
G. L
aufe
r, M
. Grim
m, W
. Wis
ser
R. P
ache
rK
. Mal
linge
r, G
. Kuc
hlin
g
Belg
ium
AN
Uni
vers
itair
Ziek
enhu
is A
ntw
erpe
n, E
dege
mA
. Mou
lijn
V. C
onra
ads
G. V
an B
eeum
en, W
. Van
Don
ink
AS
Onz
e Li
eve
Vro
uw Z
ieke
nhui
s, A
alst
F. W
elle
nsM
. Goe
thal
sT.
Goo
ris, W
. Tac
kBR
Hôp
ital E
rasm
e, B
ruxe
lles
M. A
ntoi
ne, J
. Lec
lerc
qJ.
Vac
hier
yE.
Ang
enon
, V. D
uthi
e, B
. Van
Hae
lew
ijck
GE
Uni
vers
itair
Ziek
enhu
is, G
ent
G. V
an N
oote
n, F
. Cae
sG
. Van
Noo
ten
F. D
e So
mer
LACl
iniq
ues U
nive
rsita
ires S
t. Lu
c, B
ruxe
lles
J. Sc
hoev
aerd
ts, P
. Noi
rhom
me
M. G
oene
nV
. Dum
ont,
C. L
ecom
te, P
. Van
orm
elin
gen
LGCe
ntre
Hos
pita
lier U
nive
rsita
ire, L
iège
R. L
imet
J-C.
Dem
oulin
M-H
. Del
boui
lle, M
-F. H
ans
LMU
nive
rsita
ir Zi
eken
huis
Gas
thui
sber
g, L
euve
nW
. Dae
nen
J. V
anha
ecke
L. R
oels
, F. V
an G
elde
r
Ger
man
yA
KU
nive
rsitä
tskl
inik
um d
er R
hein
isch
-Wes
tfälis
chen
TH
, Aac
hen
B. M
essm
er, F
. Sch
öndu
beP.
Han
rath
A. H
ombu
rgBA
He r
z - &
Dia
bete
sze n
trum
Nor
drhe
in-W
e stfa
len,
Ba d
Oe y
nhau
sen
R. K
örfe
r, K
. Min
ami
M. K
örne
rH
. Gro
mz i
k, S
. Wlo
st-
Berg
man
nshe
il, B
ochu
mA
. La c
z kov
ics
BDD
euts
c he s
He r
z ze n
trum
, Be r
linR.
He t
z er
M. H
umm
e lN
. Fra
nz, H
. Krie
gle r
BHK
e rkh
off K
linik
, Ba d
Na u
heim
W. K
loev
ekor
nM
. Sch
lepp
e rA
. Frie
dlBK
Bene
dikt
Kre
utz
Reha
bilit
a tio
nsz e
ntru
m,
Bad
Kro
z ing
enW
. Pe c
kH
. Ros
kam
mM
. Wie
ssne
rBS
Klin
ikum
de r
Hum
bold
-Uni
vers
ität,
Berli
nW
. Kon
e rtz
G. B
a um
ann
W. L
ohse
DR
Tec h
nisc
hen
Uni
vers
ität D
resd
e nS.
Sc h
üle r
N.H
. Hild
e bra
ndt
DU
Med
. Ein
richt
unge
n de
r He i
nric
h H
e ine
Uni
vers
ität,
Düs
seld
orf
E. G
ams
T. P
e tz o
ldG
.R. H
e tz e
l, B.
Sc h
a epe
rsES
Klin
ikum
de r
Uni
vers
ität,
Esse
nCh
. Re i
dem
e ist
e rB.
Sc h
önfe
lde r
R. A
bel
FDK
linik
um F
ulda
, Tho
rax-
, He r
z - u
nd G
e fä ß
c hiru
rgie
, Ful
daTh
. Ste
gman
nT.
Bon
z el
H-U
. Gün
the r
FMK
linik
um d
e r Jo
hann
-Wol
fga n
g-G
oeth
e -U
nive
rsitä
t, Fr
a nkf
urt
P. S
a tte
rA
. Ha r
tman
nJ.
Gos
sman
nFR
Klin
ikum
de r
Alb
e rt-L
udw
igs-
Uni
vers
ität,
Fre i
burg
F. B
e ye r
sdor
fG
. Ha s
e nfu
ßM
. Blü
mke
, F. S
c ha u
bG
IK
linik
um d
e r Ju
stus
-Lie
big-
Uni
vers
ität,
Gie
ßen
F. D
a ppe
rJ.
Baue
r, W
. Ha b
e rbo
sch
J. Ba
uer,
W. H
a be r
bosc
hG
OK
linik
um d
e r G
e org
-Aug
ust-U
nive
rsitä
t, G
öttin
gen
M. B
a rya
lei
H. F
igul
laR.
We r
ner
HA
Klin
ikum
de r
Ma r
tin-L
uthe
r-U
nive
rsitä
t, H
a lle
H.K
.G. Z
e rko
wsk
iB.
La n
dgra
f,C.
Wa c
hsm
uth
HB
Klin
ikum
de r
Rup
rec h
t-Ka r
ls-U
nive
rsitä
t, H
e ide
lbe r
gS.
Ha g
lR.
La n
geM
. He i
nen
HG
Uni
vers
itäts
-Kra
nken
haus
Epp
endo
rf, H
ambu
rgP.
Ka l
ma r
W. R
ödig
e rC.
Cla
use n
, B. H
olle
nrie
der
HO
Klin
ikum
de r
Med
izin
isc h
e n H
ochs
c hul
e , H
a nno
ver
H. B
orst
P. L
icht
len
F. V
oge l
sang
HS
Klin
ikum
de r
Uni
vers
ität d
e s S
a arla
nde s
, Hom
burg
-Sa a
rH
.J. S
c hä f
e rs
H.J.
Sc h
ieff
e rC.
Frie
dric
hsoh
nK
IK
linik
um d
e r C
hris
tian-
Alb
rec h
ts-U
nive
rsitä
t, K
iel
D. R
e ge n
sbur
ger
A. J
ä ckl
eG
. Sc h
ütt,
N. R
obie
nK
LK
linik
de r
Uni
vers
ität K
öln-
Lind
enth
a l, K
öln
E. d
e V
ivie
E. E
rdm
ann
F. K
uhn-
Regn
ier
KS
Klin
ik fü
r He r
z - u
nd T
hora
xchi
rurg
ie, K
a ise
rsla
ute r
nW
. Se y
bold
-Ept
ing
H. G
lunz
S. S
c hle
e de
LPK
linik
um d
e r U
nive
rsitä
t, Le
ipz i
gF.
W. M
ohr
T. W
e isk
irche
nM
DD
euts
ches
Her
zzen
trum
, Mün
chen
H. M
eisn
er, M
. Ove
rbec
kB.
Per
man
ette
rC.
Sch
ulz
ML
Klin
. Gro
ßhad
ern
der L
udw
ig-M
axim
ilian
s-U
nive
rsitä
t, M
ünch
enB.
Rei
char
t, P.
Übe
rfuh
rB.
Mei
ser
C. S
chul
zM
NK
linik
um d
er W
estfä
lisch
en W
ilhel
ms-
Uni
vers
ität,
Mün
ster
H. S
chel
dM
. Wey
and
S. K
ley,
M. M
aurit
z
11
Cent
er-
Cent
er /
City
Surg
eon
Phys
icia
nTr
ansp
lant
coo
rdin
ator
s.co
de
MZ
Klin
ikum
der
Joha
nnes
-Gut
enbe
rg-U
nive
rsitä
t, M
ainz
U. H
ake
J. M
eyer
C. K
rebe
r-W
alth
er, S
. Sch
leed
eRB
Klin
ikum
der
Uni
vers
ität,
Rege
nsbu
rgD
. Birn
baum
M. K
aise
rL.
Ren
ders
, C. B
urkh
ardt
TUK
linik
um d
er E
berh
ard-
Kar
ls-U
nive
rsitä
t, Tü
bing
enG
. Zie
mer
M. J
urm
ann
C. F
isch
er-F
rölic
hW
ZK
linik
um d
er Ju
lius-
Max
imili
ans-
Uni
vers
ität,
Wür
zbur
gR-
E. S
ilber
R-E.
Silb
erD
. De
Cicc
oA
. Wie
selth
aler
, M. A
ghau
iTh
e N
ethe
rlan
ds-
Aca
dem
isch
Zie
kenh
uis,
Gro
ning
enT.
Ebe
lsR.
van
Gin
kel,
J. K
rane
nbur
g, P
. Nie
boer
RDA
cade
mis
ch Z
ieke
nhui
s Dijk
zigt
, Rot
terd
amB.
Moc
htar
M. S
imoo
nsM
. Kru
ysw
ijk, M
. Gro
ot, M
. van
Gur
pU
TA
cade
mis
ch Z
ieke
nhui
s, U
trech
tJ.
Lahp
or, J
. Bre
dee
N. d
e Jo
nge
P. B
atav
ier,
D. N
aafs
, J. P
opm
a
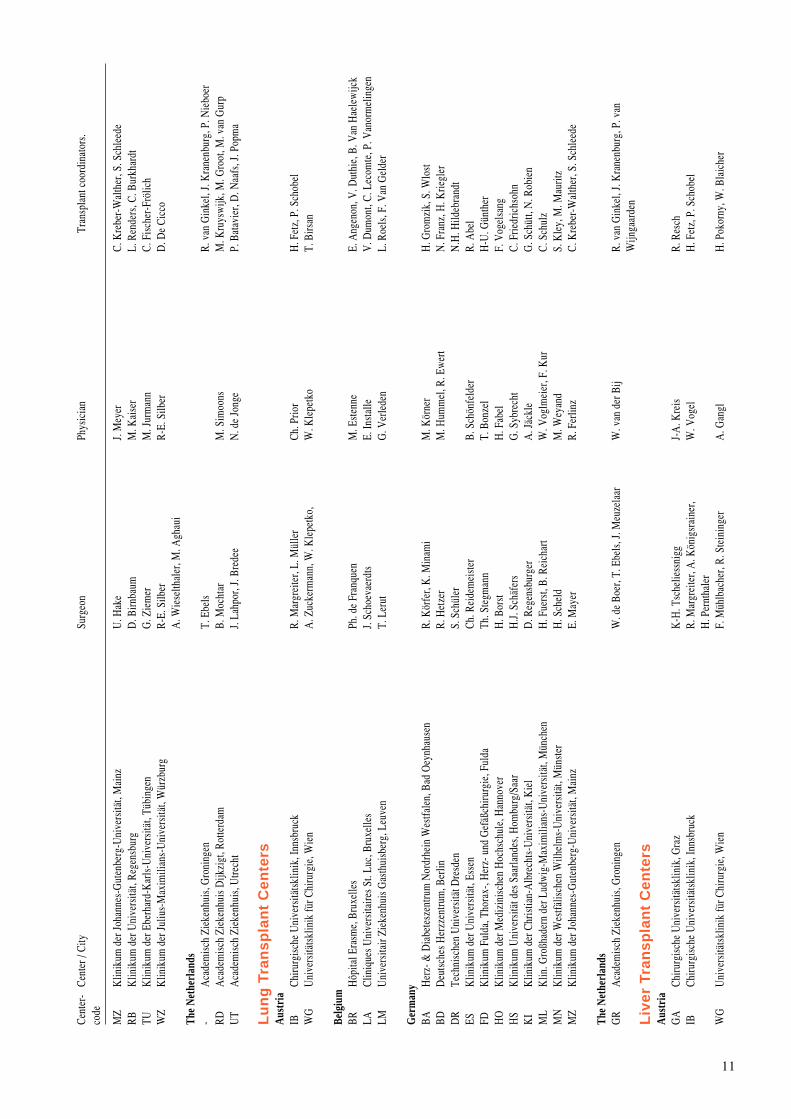
Lu
ng
Tra
nsp
lan
t C
ente
rsA
ustr
iaIB
Chiru
rgis
che
Uni
vers
itäts
klin
ik, I
nnsb
ruck
R. M
argr
eite
r, L.
Mül
ler
Ch. P
rior
H. F
etz,
P. S
chob
elW
GU
nive
rsitä
tskl
inik
für C
hiru
rgie
, Wie
nA
. Zuc
kerm
ann,
W. K
lepe
tko,
W. K
lepe
tko
T. B
irsan
Belg
ium
BRH
ôpita
l Era
sme ,
Bru
xelle
sPh
. de
Fra n
quen
M. E
ste n
neE.
Ang
enon
, V. D
uthi
e , B
. Va n
Ha e
lew
ijck
LACl
iniq
ues U
nive
rsita
ires S
t. Lu
c , B
ruxe
lles
J. Sc
hoev
a erd
tsE.
Inst
a lle
V. D
umon
t, C.
Le c
omte
, P. V
a nor
me l
inge
nLM
Uni
vers
itair
Zie k
e nhu
is G
a sth
uisb
e rg,
Le u
ven
T. L
e rut
G. V
e rle
den
L. R
oels
, F. V
a n G
e lde
r
Ge r
man
yBA
He r
z - &
Dia
bete
sze n
trum
Nor
drhe
in W
e stfa
len,
Ba d
Oe y
nhau
sen
R. K
örfe
r, K
. Min
ami
M. K
örne
rH
. Gro
mz i
k, S
. Wlo
stBD
Deu
tsc h
e s H
e rz z
e ntru
m, B
e rlin
R. H
e tz e
rM
. Hum
me l
, R. E
we r
tN
. Fra
nz, H
. Krie
gle r
DR
Tec h
nisc
hen
Uni
vers
ität D
resd
e nS.
Sc h
üle r
N.H
. Hild
e bra
ndt
ESK
linik
um d
e r U
nive
rsitä
t, Es
sen
Ch. R
e ide
me i
ste r
B. S
c hön
feld
e rR.
Abe
lFD
Klin
ikum
Ful
da, T
hora
x-, H
e rz -
und
Ge f
ä ßc h
irurg
ie, F
ulda
Th. S
tegm
ann
T. B
onz e
lH
-U. G
ünth
e rH
OK
linik
um d
e r M
ediz
inis
c he n
Hoc
hsc h
ule ,
Ha n
nove
rH
. Bor
stH
. Fa b
e lF.
Vog
e lsa
ngH
SK
linik
um U
nive
rsitä
t de s
Sa a
rland
e s, H
ombu
rg/S
a ar
H.J.
Sc h
ä fe r
sG
. Syb
rec h
tC.
Frie
dric
hsoh
nK
IK
linik
um d
e r C
hris
tian-
Alb
rec h
ts-U
nive
rsitä
t, K
iel
D. R
e ge n
sbur
ger
A. J
ä ckl
eG
. Sc h
ütt,
N. R
obie
nM
LK
lin. G
roßh
ade r
n de
r Lud
wig
-Max
imili
a ns-
Uni
vers
ität,
Mün
chen
H. F
uers
t, B.
Re i
c ha r
tW
. Vog
lme i
e r, F
. Kur
C. S
c hul
zM
NK
linik
um d
e r W
e stfä
lisc h
e n W
ilhe l
ms-
Uni
vers
ität,
Mün
ste r
H. S
c he l
dM
. Wey
and
S. K
ley,
M. M
aurit
zM
ZK
linik
um d
e r Jo
hann
e s-G
ute n
berg
-Uni
vers
ität,
Ma i
nzE.
May
e rR.
Fe r
linz
C. K
rebe
r-W
a lth
e r, S
. Sc h
lee d
e
The
Ne t
her l
ands
GR
Ac a
dem
isc h
Zie
kenh
uis,
Gro
ning
enW
. de
Boe r
, T. E
bels
, J. M
euz e
laa r
W. v
a n d
e r B
ijR.
va n
Gin
kel,
J. K
rane
nbur
g, P
. va n
Wijn
gaa r
den
Liv
er T
ran
spla
nt
Cen
ters
Aus
tria
GA
Chiru
rgis
c he
Uni
vers
itäts
klin
ik, G
raz
K-H
. Tsc
helie
ssni
ggJ-
A. K
reis
R. R
e sc h
IBCh
irurg
isch
e U
nive
rsitä
tskl
inik
, Inn
sbru
ckR.
Mar
grei
ter,
A. K
önig
srai
ner,
W. V
ogel
H. F
etz,
P. S
chob
elH
. Per
ntha
ler
WG
Uni
vers
itäts
klin
ik fü
r Chi
rurg
ie, W
ien
F. M
ühlb
ache
r, R.
Ste
inin
ger
A. G
angl
H. P
okor
ny, W
. Bla
iche
r
12
Cent
er-
Cent
er /
City
Surg
eon
Phys
icia
nTr
ansp
lant
coo
rdin
ator
s.co
de
Belg
ium
BRH
ôpita
l Era
sme,
Bru
xelle
sM
. Gel
inM
. Adl
erE.
Ang
enon
, V. D
uthi
e, B
. Van
Hal
ewijc
kG
EU
nive
rsita
ir Zi
eken
huis
, Gen
tB.
De
Hem
ptin
ne, U
. Hes
se, P
. Pat
tyn
J. V
ersi
eck
(†)
L. C
olen
bie,
M. V
ande
rven
net
LACl
iniq
ues U
nive
rsita
ires S
t. Lu
c, B
ruxe
lles
J. O
tteA
. Geu
bel,
E. S
okal
M. J
anse
n, F
. Rog
gen
LGCe
ntre
Hos
pita
lier U
nive
rsita
ire, L
iège
P. H
onor
é, M
. Meu
risse
J. Be
leic
heM
-H. D
elbo
uille
, M-F
. Han
sLM
Uni
vers
itair
Ziek
enhu
is G
asth
uisb
erg,
Leu
ven
R. A
erts
J. Fe
very
L. R
oels
, F. V
an G
elde
r
Ger
man
yA
KU
nive
rsitä
tskl
inik
um d
er R
hein
isch
-Wes
tfälis
chen
TH
, Aac
hen
V. S
chum
pelic
kS.
Mat
ern
R. K
aspe
rk-
Kna
ppsc
hafts
kran
kenh
aus,
Boch
umM
. Büs
ing
J. K
lem
pnau
erA
. Dei
ssBO
Chiru
rgis
che
Uni
vers
itäts
klin
ik, B
onn
A. H
irner
, A. M
ülle
rU
. Spe
ngle
rE.
Bac
khau
sBV
Klin
ikum
Rud
olf V
ircho
w d
er H
umbo
ld-U
nive
rsitä
t, Be
rlin
P. N
euha
usU
. Fre
iD
. Hor
chES
Klin
ikum
der
Uni
vers
ität,
Esse
nF.
Eig
ler
J. Er
hard
R. A
bel
FMK
linik
um d
er Jo
hann
-Wol
fgan
g-G
oeth
e-U
nive
rsitä
t, Fr
ankf
urt
A. E
ncke
W. A
llers
W. A
llers
FRK
linik
um d
er A
lber
t-Lud
wig
s-U
nive
rsitä
t, Fr
eibu
rgG
. Kirs
teH
. Blu
mM
. Blü
mke
, F. S
chau
bG
OK
linik
um d
er G
eorg
-Aug
ust-U
nive
rsitä
t, G
öttin
gen
B. R
inge
G. R
amad
ori
R. W
erne
rH
BK
linik
um d
er R
upre
cht-K
arls
-Uni
vers
ität,
Hei
delb
erg
Ch. H
erfa
rth, G
. Otto
E. F
rey
HG
Uni
vers
itäts
-Kra
nken
haus
Epp
endo
rf, H
ambu
rgCh
. Bro
e lsc
hM
. Ste
rne c
kT.
Ka r
be, R
. Küt
eme i
e rH
OK
linik
um d
e r M
ediz
inis
c he n
Hoc
hsc h
ule ,
Ha n
nove
rR.
Pic
hlm
ayr
M. M
anns
F. V
oge l
sang
JEK
linik
um d
e r F
riedr
ich-
Schi
ller-
Uni
vers
ität,
Jena
J. Sc
hee l
eR.
Bör
ner
KI
Klin
ikum
de r
Chr
istia
n-A
lbre
c hts
-Uni
vers
ität,
Kie
lB.
Kre
me r
H. K
raem
e r-H
a nse
nG
. Sc h
ütt,
N. R
obie
nK
LK
linik
de r
Uni
vers
ität K
öln-
Lind
enth
a l, K
öln
T. B
e cku
rtsG
. Ke r
pK
MSt
ä dtis
c he
Kra
nken
anst
a lte
n K
öln-
Me r
heim
, Köl
nA
. Pa u
lG
. Ke r
p, A
. Fro
hnLP
Klin
ikum
de r
Uni
vers
ität,
Leip
z ig
J. H
a uss
J. M
össn
e rT.
We i
skirc
hen
MB
Klin
ikum
Otto
-von
-Gue
ricke
Uni
vers
ität,
Mag
debu
rgH
. Lip
pert,
T. M
ange
rK
. Rid
we l
ski,
J. Fa
hlke
, M. P
ross
C. W
a chs
mut
h, J.
Fa l
keM
HK
linik
um R
e cht
s de r
Isa r
de r
Te c
hnis
c he n
Uni
vers
ität,
Mün
chen
C.D
. He i
dec k
eV
. Sc h
usdz
iarr
aC.
Sc h
ulz
ML
Klin
. Gro
ßhad
e rn
der L
udw
ig-M
axim
ilia n
s-U
nive
rsitä
t, M
ünch
enH
-J. K
räm
ling
A. G
e rbe
sC.
Sc h
ulz
MN
Klin
ikum
de r
We s
tfälis
c he n
Wilh
e lm
s-U
nive
rsitä
t, M
ünst
e rN
. Se n
ning
e rK
.H. D
ietl
S. K
ley,
M. M
aurit
zN
BCh
irurg
isc h
e K
linik
de r
Uni
vers
ität E
rlang
en-N
ürnb
e rg,
Erla
ngen
W. H
ohen
berg
e rK
. Bur
kha r
dt, L
. Re n
ders
RBK
linik
um d
e r U
nive
rsitä
t, Re
gens
burg
K.W
. Ja u
c h, M
. Ant
hube
rL.
Re n
ders
, C. B
urkh
a rdt
ROK
linik
um d
e r U
nive
rsitä
t, Ro
stoc
kU
.T. H
opt,
W. S
c ha r
e ck
S. L
iebe
, M. L
öhr
F-P.
Nits
c hke
TUK
linik
um d
e r E
berh
a rd-
Ka r
ls U
nive
rsitä
t, Tü
bing
enW
. Lau
cha r
tH
. Be c
ker
C. F
isc h
e r-F
röhl
ich
WZ
Klin
ikum
de r
Juliu
s-M
axim
ilia n
s-U
nive
rsitä
t, W
ürz b
urg
W. T
imm
e rm
ann
D. D
e Ci
c co
The
Ne t
her l
ands
GR
Ac a
dem
isc h
Zie
kenh
uis,
Gro
ning
enP.
de
Jong
, E. P
e ete
rs, M
. Slo
off
E. H
a ags
ma ,
L. M
e erm
an,
R. v
a n G
inke
l, J.
Kra
nenb
urg,
I. K
lom
pmak
e rP.
va n
Wijn
gaa r
den
LBA
c ade
mis
c h Z
ieke
nhui
s, Le
ide n
O. T
e rps
traB.
va n
Hoe
kM
. van
Gur
p, M
. Kru
ysw
ijk, M
. Gro
otRD
Ac a
dem
isc h
Zie
kenh
uis D
ijzig
t, Ro
tterd
amJ.
IJz e
rman
s, H
. Tila
nus
H. M
e tse
laa r
M. K
ruys
wijk
, M. G
root
, M. v
a n G
urp
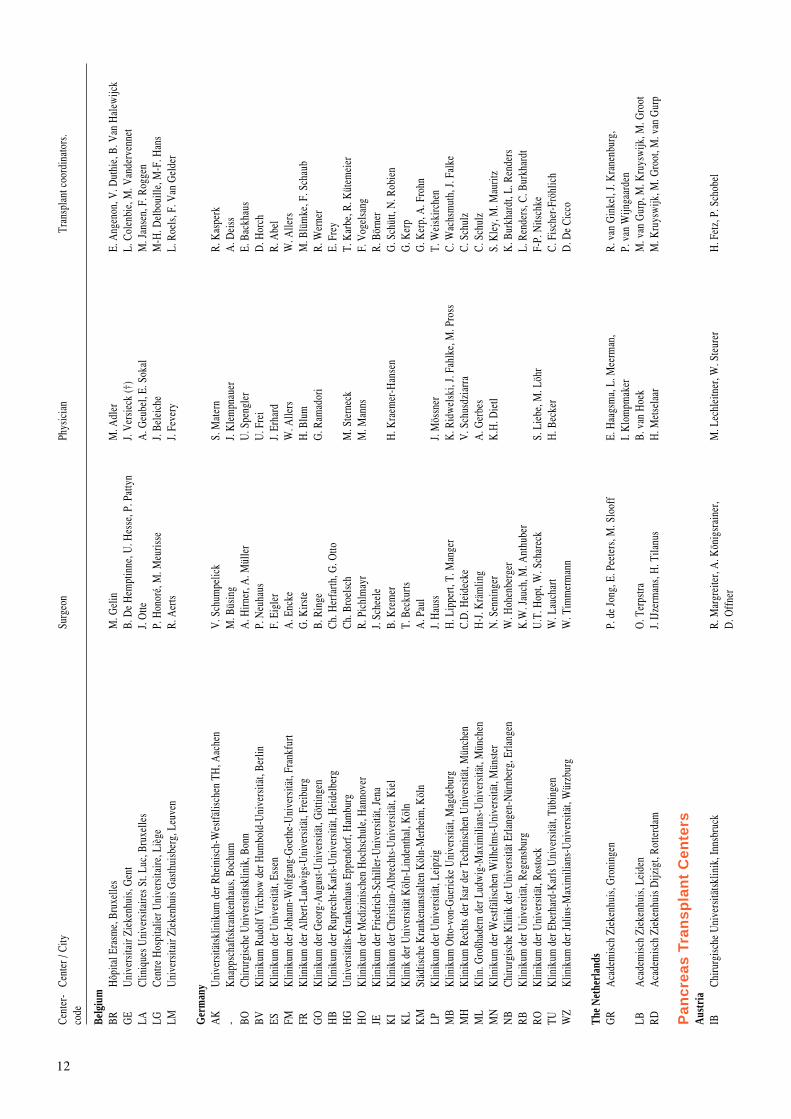
Pan
crea
s Tr
ansp
lan
t C
ente
rsA
ustr
iaIB
Chiru
rgis
che
Uni
vers
itäts
klin
ik, I
nnsb
ruck
R. M
argr
eite
r, A
. Kön
igsr
aine
r,M
. Lec
hlei
tner
, W. S
teur
erH
. Fet
z, P
. Sch
obel
D. O
ffne
r
13
Cent
er-
Cent
er /
City
Surg
eon
Phys
icia
nTr
ansp
lant
coo
rdin
ator
s.co
de
Belg
ium
AN
Uni
vers
itair
Ziek
enhu
is A
ntw
erpe
n, E
dege
mD
. Yse
baer
tM
. Deb
roe
G. V
an B
eeum
en, W
. Van
Don
ink
BJA
cade
mis
ch Z
ieke
nhui
s der
Vrij
e U
nive
rsite
it, B
russ
elD
. Pip
elee
rsC.
Hen
drie
ckx
BRH
ôpita
l Era
sme,
Bru
xelle
sL.
Dep
auw
F. F
ery
E. A
ngen
on, V
. Dut
hie,
B. V
an H
aele
wijc
kG
EU
nive
rsita
ir Zi
eken
huis
, Gen
tU
. Hes
seB.
De
Hem
ptin
neL.
Col
enbi
e, M
. Van
derv
enne
tLA
Clin
ique
s Uni
vers
itaire
s St.
Luc,
Bru
xelle
sJ.
Squi
ffle
tB.
Van
dele
ene
C. L
ecom
te, V
. Dum
ont
LGCe
ntre
Hos
pita
lier U
nive
rsita
ire, L
iège
M. M
euris
seM
. Bea
ujea
nM
-H. D
elbo
uille
, M-F
. Han
sLM
Uni
vers
itair
Ziek
enhu
is G
asth
uisb
erg,
Leu
ven
R. A
erts
, W. C
oose
man
sY
. Van
rent
ergh
emL.
Roe
ls, F
. Van
Gel
der
Ger
man
yBB
Kna
ppsc
hafts
kran
kenh
aus,
Boch
umM
. Büs
ing
M. N
auck
A. D
eiss
BVK
linik
um R
udol
f Virc
how
der
Hum
bold
-Uni
vers
ität,
Berli
nP.
Neu
haus
U. F
rei
D. H
orch
ESK
linik
um d
er U
nive
rsitä
t, Es
sen
F. E
igle
rJ.
Frie
dric
hR.
Abe
lG
IK
linik
um d
er Ju
stus
-Lie
big-
Uni
vers
ität,
Gie
ßen
R.G
. Bre
tzel
M. B
rend
elH
GU
nive
rsitä
ts-K
rank
enha
us E
ppen
dorf
, Ham
burg
Ch. B
roel
sch
M. S
tern
eck
T. K
arbe
, R. K
ütem
eier
MH
Klin
ikum
Rec
hts d
er Is
ar d
er T
echn
isch
en U
nive
rsitä
t, M
ünch
enC.
D. H
eide
cke
C. S
c hul
z , W
. Ebe
rha r
dtM
LK
lin. G
roßh
ade r
n de
r Lud
wig
-Max
imili
a ns-
Uni
vers
ität,
Mün
chen
W. L
and
R. L
a ndg
raf,
B. Z
a nke
rC.
Sc h
ulz
MR
Klin
ikum
Lah
nbe r
ge d
e r P
hilip
s-U
nive
rsitä
t, M
a rbu
rgM
. Rot
hmun
dH
. La n
geL.
Vio
resc
u, U
. He c
kRO
Klin
ikum
de r
Uni
vers
ität,
Rost
ock
U.T
. Hop
t, W
. Sc h
a re c
kR.
Ham
pel
F-P.
Nits
c hke
TUK
linik
um d
e r E
berh
a rd-
Ka r
ls-U
nive
rsitä
t, Tü
bing
enI.
Irki
n, W
. La u
c ha r
tH
. Be c
ker
C. F
isc h
e r-F
röhl
ich
UL
Klin
ikum
de r
Uni
vers
ität,
Ulm
D. A
bend
roth
M. S
chim
me r
The
Ne t
her l
ands
GR
Ac a
dem
isc h
Zie
kenh
uis,
Gro
ning
enR.
Plo
e g, R
. va n
Sc h
ilfga
a rde
A. T
e gz e
ssR.
va n
Gin
kel,
J. K
rane
nbur
g, P
. Nie
boe r
LBA
c ade
mis
c h Z
ieke
nhui
s, Le
ide n
J. Ri
nge r
sH
. de
Fijte
rM
. va n
Gur
p, M
. Kru
ysw
ijk, M
. Gro
ot
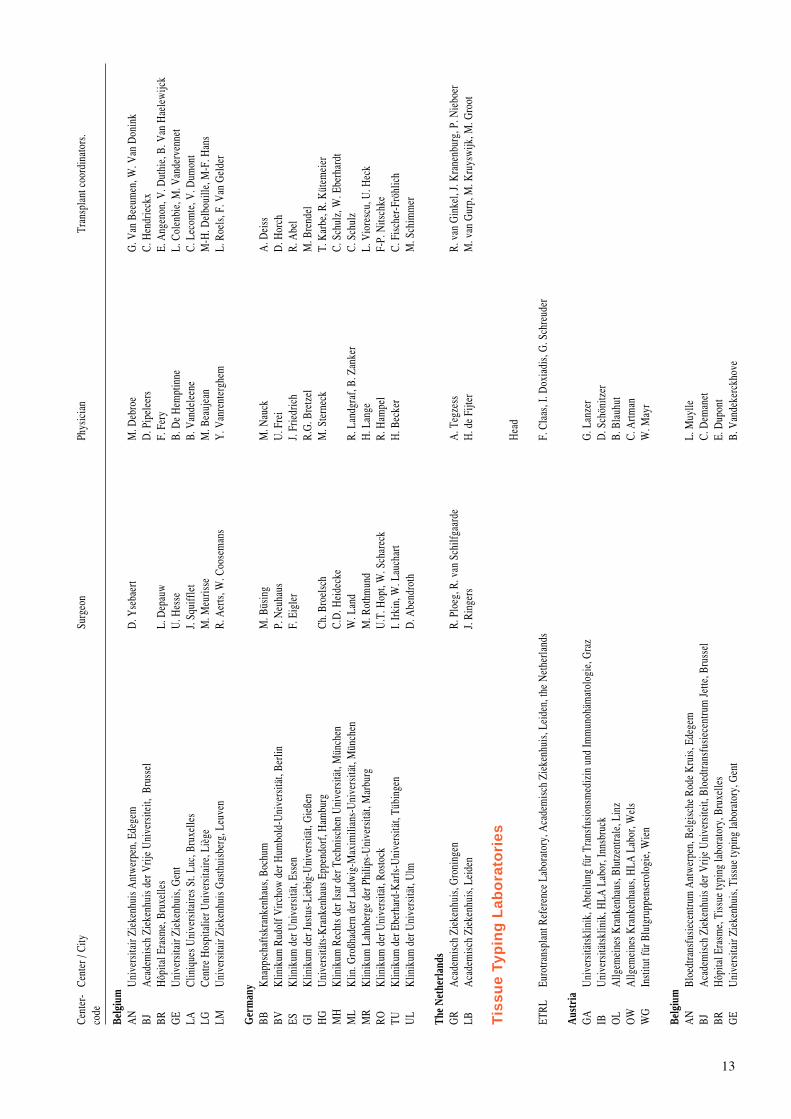
Tis
sue
Typ
ing
Lab
ora
tori
esH
e ad
ETRL
Euro
trans
pla n
t Re f
e re n
c e L
a bor
a tor
y, A
c ade
mis
c h Z
ieke
nhui
s, Le
ide n
, the
Ne t
herla
nds
F. C
laa s
, I. D
oxia
dis,
G. S
c hre
ude r
Aus
tria
GA
Uni
vers
itäts
klin
ik, A
bte i
lung
für T
rans
fusi
onsm
ediz
in u
nd Im
mun
ohäm
a tol
ogie
, Gra
zG
. La n
z er
IBU
nive
rsitä
tskl
inik
, HLA
Lab
or, I
nnsb
ruck
D. S
c hön
itze r
OL
Allg
eme i
nes K
rank
enha
us, B
lutz
e ntra
le, L
inz
B. B
lauh
utO
WA
llgem
e ine
s Kra
nken
haus
, HLA
Lab
or, W
e ls
C. A
rtman
WG
Inst
itut f
ür B
lutg
rupp
ense
rolo
gie ,
Wie
nW
. May
r
Belg
ium
AN
Bloe
dtra
nsfu
siec
entru
m A
ntw
erpe
n, B
elgi
sche
Rod
e K
ruis
, Ede
gem
L. M
uylle
BJA
cade
mis
ch Z
ieke
nhui
s der
Vrij
e U
nive
rsite
it, B
loed
trans
fusi
ecen
trum
Jette
, Bru
ssel
C. D
eman
etBR
Hôp
ital E
rasm
e, T
issu
e ty
ping
labo
rato
ry, B
ruxe
lles
E. D
upon
tG
EU
nive
rsita
ir Zi
eken
huis
, Tis
sue
typi
ng la
bora
tory
, Gen
tB.
Van
deke
rckh
ove

14
Cent
er-
Cent
er /
City
Surg
eon
Phys
icia
nTr
ansp
lant
coo
rdin
ator
s.co
de
LAU
nive
rsité
de
Louv
ain,
Tis
sue
typi
ng la
bora
tory
, Bru
xelle
sM
. de
Bruy
ère
LGLa
bora
toire
des
Gro
upes
San
guin
s, Li
ège
C. B
ouill
enne
LMBl
oedt
rans
fusi
ecen
trum
, Bel
gisc
he R
ode
krui
s, Le
uven
M.P
. Em
onds
Ger
man
yA
KM
ikro
biol
ogie
am
Uni
vers
itäts
klin
. der
Rhe
inis
ch-W
estfä
lisch
en T
H, A
ache
nK
. Sch
wei
tzer
BEK
linik
um S
tegl
itz d
er F
reie
n U
nive
rsitä
t, La
bor f
ür G
eweb
etyp
isie
rung
, Ber
linS.
Bün
teBV
Klin
ikum
Rud
olf V
ircho
w d
er H
umbo
ld-U
nive
rsitä
t, Be
rlin
R. B
lasc
zyk
EBK
rank
enha
us im
Frie
dric
hsha
in, H
LA L
abor
, Ber
linC.
Sch
önem
ann
DU
Inst
itut f
ür B
lutg
erin
nung
und
Tra
nsfu
sion
smed
izin
, Düs
seld
orf
B. K
untz
ERIn
stitu
t für
Klin
isch
e Im
mun
olog
ie, E
rlang
enR.
Waß
mut
hES
Klin
ikum
der
Uni
vers
ität,
Abt
eilu
ng fü
r Im
mun
gene
tik, E
ssen
H. G
ross
e-W
ilde
FMIm
mun
ohae
mat
olog
ie, B
luts
pend
edie
nst H
esse
n, F
rank
furt
C. S
eidl
FRBl
utsp
ende
dien
st, L
abor
für G
eweb
etyp
isie
rung
, Fre
ibur
gH
. Lan
gG
IIn
stitu
t für
Klin
isch
e Im
mun
olog
ie u
nd T
rans
fusi
onsm
ediz
in, G
ieße
nG
. Mue
ller-
Eckh
ardt
GO
Klin
ikum
der
Uni
vers
ität,
HLA
Lab
or, G
öttin
gen
H. N
eum
eyer
HA
Inst
itut f
ür P
hath
olog
isch
e Bi
oche
mie
, Int
erdi
szip
linär
es T
ypis
ieru
ngsl
abor
, Hal
leH
. Mac
hulla
HG
Uni
vers
itäts
-Kra
nken
haus
Epp
endo
rf, H
LA L
abor
, Ham
burg
P. K
ühnl
HM
Inst
itut K
a sse
l de s
Blu
tspe
nded
iens
t He s
sen,
Ka s
sel
H.D
. We i
ßha a
rH
BIn
stitu
t für
Imm
unol
ogie
und
Se r
olog
ie, H
e ide
lbe r
gG
. Ope
lzH
OK
linik
um d
e r M
ediz
inis
c he n
Hoc
hsc h
ule ,
Imm
unoh
a em
a tol
ogie
/Blu
tba n
k, H
a nno
ver
H. R
obin
-Win
nJE
Inst
itut f
ür T
rans
fusi
onsm
ediz
in, H
LA-L
abor
, Je n
aW
. Alte
rman
nK
IK
linik
um d
e r C
hris
tian-
Alb
rec h
ts-U
nive
rsitä
t, H
LA L
abor
, Kie
lE.
We s
tpha
lK
MIn
stitu
t für
Tra
nsfu
sion
smed
izin
, Köl
n-M
e rhe
imM
. Dör
ner
KS
Inst
itut f
ür R
e cht
smed
izin
, Tra
nspl
a nta
tions
imm
unol
ogie
, Ka i
sers
laut
e rn
B. T
hie l
eLP
Inst
itut f
ür T
rans
fusi
onsm
ediz
in, L
e ipz
igS.
Sc h
röde
rLU
Inst
itut f
ür Im
mun
olog
ie u
nd T
rans
fusi
onsm
ediz
in, L
übe c
kG
. Be i
nM
LK
inde
rklin
ik d
e r L
udw
ig-M
axim
ilia n
s-U
nive
rsitä
t, H
LA L
abor
, Mün
chen
E. A
lbe r
tM
RK
linik
um L
ahnb
e rge
de r
Phi
lipps
-Uni
vers
ität,
HLA
Lab
or, M
a rbu
rgF.
We i
denb
a ch
MZ
Klin
ikum
de r
Joha
nne s
-Gut
e nbe
rg U
nive
rsitä
t, H
LA L
abor
, Ma i
nzW
. Hitz
ler
ROK
linik
um d
e r U
nive
rsitä
t, A
bte i
lung
für T
rans
fusi
onsm
ediz
in, H
LA L
abor
, Ros
toc k
D. B
a rz
TUK
linik
um d
e r E
berh
a rd-
Ka r
ls-U
nive
rsitä
t, A
bte i
lung
für T
rans
fusi
onsw
e se n
und
Blu
tban
k, T
übin
gen
D. W
e rne
tU
LD
RK B
luts
pend
e ze n
trale
, Tra
nspl
a nta
tions
imm
unol
ogie
, Ulm
S. G
oldm
ann
Luxe
mbo
urg
LXCe
ntre
Hos
pita
lier,
HLA
Lab
or, L
uxem
bour
gF.
He n
tge s
The
Ne t
her l
ands
AW
Cent
raa l
La b
ora t
oriu
m B
loed
trans
fusi
e die
ntst
, Ne d
e rla
ndse
Rod
e K
ruis
, Am
ste r
dam
N.M
. La r
dyG
RLa
bora
toriu
m v
oor B
loe d
groe
pens
e rol
ogie
, Gro
ning
enS.
Lem
sLB
Aca
dem
isch
Zie
kenh
uis,
Imm
unoh
aem
atol
ogie
, Lei
den
F. C
laas
, G. S
chre
uder
MS
Aca
dem
isch
Zie
kenh
uis,
Labo
rato
rium
voo
r wee
fsel
type
ring,
Maa
stric
htE.
van
den
Ber
g-Lo
onen
NY
Aca
dem
isch
Zie
kenh
uis S
t. Ra
dbou
d, L
euco
cyte
nlab
orat
oriu
m, N
ijmeg
enW
. Alle
bes
UT
Aca
dem
isch
Zie
kenh
uis,
Bloe
dban
k, U
trech
tG
. de
Gas
t

15
FForeword
The new Articles of Association of the Eurotransplant International Foundation, accepted in 1994 by theGeneral Assembly, aimed to guarantee a decentralized decision making process by representatives from thedifferent countries and disciplines, elected in a democratic way. Over the past year, the many advisorycommittees of Eurotransplant (ET) have met at regular intervals and have formulated a lot of recommendationsto the ET Board. After discussion, most of these recommendations have been accepted and implemented. Bydoing so, the primary objective of the Board is to guarantee a fair and objective allocation of the availableorgans in the interest of the patients, desperately waiting for a new life with their transplanted organ. Alongthe same line, the Board during its last meeting in June 1997, agreed on the following mission statement sayingthat ‘Eurotransplant is a service organization to the transplant candidates through the collaborating transplantprograms within Eurotransplant’.
In March 1996, the new ET kidney allocation system, based on the algorythm originally described by Wucjiakand Opelz, was implemented. The results of this new allocation system were closely monitored by the KidneyAdvisory Committee and if needed the algorythm was adjusted. As already mentioned in the ET newsletters,the primary objectives of this new system were rapidly realized. A lot of long waiting patients have beentransplanted and the national import-export ratio is in balance while a high degree of HLA compatibility is stillmaintained. The implementation of this new system has been well accepted by most of the ET centers, althoughsome of them have temporarily seen a substantial drop in their transplant activities. The persisting discrepancybetween the number of kidneys retrieved and the number of organs transplanted is for some centers and regionsdifficult to accept. Although the weight of the so-called distance factor has been increased, the low numberof patients on the waiting list in many of these centers remains the main reason for this imbalance. Despite thepersistence of this problem, I am happy to see that the number of violations of the new ET kidney allocationsystem is low and does not increase. I hope that further constructive discussions can bring a solution whichis acceptable for all centers and continues to serve primarily the interest of all patients.
Also the allocation of livers remained a matter of controversy over the last year. On several occasions, the LiverAdvisory Committee discussed the issue of allocation and the discussion is still going on. The initiatives takenby some of the liver transplant programs to split the liver in order to increase the number of transplantablelivers should receive more attention and support.
It can be hoped that the acceptance of a new legislation on organ donation and transplantation in theNetherlands in 1996 and, more recently, also in Germany will facilitate the discussions on organ allocation.In these two countries future organ allocation has to be done by an officially recognized organ allocationorganization. I am confident that Eurotransplant International will meet the criteria to do this job.
During the last year the Board has further stimulated the scientific output of the foundation. Thanks to thecontinuous efforts of the Directors and the ET staff, several important papers have been published whilepresentations have been given at most of the leading transplant congresses. For the near future the followinggoals have been set:– a closer collaboration with the various existing transplant registries in order to ease the data exchange
between the transplant programs and the national and international registries, including Eurotransplant;– smoothening the collection of follow-up data in such a way that it does not increase the extra work for the
centers;– stimulation and initiation of participation in scientific studies and analyses of the transplant centers.
16
I would like to end this foreword by thanking all colleagues working in the many ET transplant centersthroughout Austria, the Benelux and Germany for their continuous support and confidence in the Eurotrans-plant organization. Close collaboration, solidarity in the interest of the patient and open and fair discussionwhen problems occur are essential for the future of Eurotransplant. Last but not least, I would cordially liketo thank the ET Directors and the ET staff for preparing this Annual Report.
Prof. Dr. Y. VanrenterghemPresident

17
IIntroduction
Following decisions taken by the Board of Eurotransplant and the introduction of a remodelled Eurotransplantcomputer database, the data content and presentation of this Annual Report 1996 has undergone major changesin comparison with the Annual Report of previous years. In order to visualize the direct need of organs andto have a more realistic assessment of organ allocation, the Board decided to disclose only waiting list figureson actively waiting patients. Thus, (temporarily) non-transplantable patients have been excluded from allwaiting list figures.
New is an overview of the publications which, as a result of the epidemiological and scientific analysesperformed, have appeared during the year 1996. The Board of Eurotransplant Foundation as a whole alsoserves as the Scientific Committee. The Board as well as the Directors have set for the near future a fewimportant goals with regard to scientific output, which are already mentioned in the Foreword of the President.
In its core business, i.e. the allocation of donor organs according to well defined and accepted criteria, a fewimportant developments have taken place at Eurotransplant. In particular, the acceptance of legislation onorgan donation and transplantation in The Netherlands (1996) and in Germany (1997). Allocation procedureshave received major attention in these laws and will certainly have a great impact on the day-to-day work atthe central office and in the transplant centers in the coming years. We are confident that we are able to meetthese new challenges for all of us.
For everything that has been achieved during the nearly 30 years of Eurotransplant’s existence we, on behalfof the central office, would like to acknowledge and thank all colleagues in Eurotransplant involved in thevarious fields of organ donation and transplantation. Thanks to them we are again able to provide you with awealth of information over the year 1996. May this Annual Report be a reflection of our sincere gratitude toall of you.A special word of thanks goes to Dr. Johan De Meester, for looking after the data and performing the differentanalyses. For typing and preparing the Annual Report we would like to thank Ms. Jacqueline Engel.
Bernard Cohen Guido G. PersijnDirector Medical Director

18

19
R1. Report of the Board of
Stichting EurotransplantInternational Foundation
Drs. B. Haase-Kromwijk, Eurotransplant International Foundation, Leiden, the Netherlands
The Board of Stichting Eurotransplant International Foundation met four times, on January 17, April 22, June21 and September 25/26, 1996.
Following the retirement of Prof. J.J. Van Rood, on May 1, 1996, Prof. Y. Vanrenterghem, Leuven, Belgium,became the new president of Eurotransplant International Foundation. Prof. M. Slooff from Groningen, theNetherlands, was appointed as vice-president of the Board and Prof. F. Lackner, from Vienna, Austria, asethical expert and subsequently as chairman of the Ethics Committee. A re-election schedule for Boardmembers was approved: each year, three Board members A are to be elected by the Assembly.
In 1996, it became apparent that, although the Eurotransplant Network Information System project has beenimplemented and completed according to planning, the Eurotransplant Automation Department could nolonger cope with growing demands from the Committees and users. Based on the advice of an externalconsultant, the Board approved a strategic information plan. The Automation Department will be restructuredinto an Information Department.
The progress of the new housing of Eurotransplant was discussed several times. Plans to construct a newbuilding in the direct neighborhood of the University Hospital Leiden, which should be completed in 2000,were approved. A new house style was approved for Eurotransplant International Foundation.
The Board prepared the official cooperation with Czech Transplant. Unfortunately, the signing of theagreement in which all aspects of organizational, financial and legal actions were described, was postponeduntil further notice by the Czech government.
A new kidney allocation program was implemented and was subject to continuous evaluation and finetuning.Upon recommendation of the Non-resident Working Group, the Board also approved an adaptation of thekidney allocation system in order to reduce non-resident patients on the renal waiting list.
The Board furthermore stated that centers which would systematically violate the exchange rules wouldoutplace themselves from the Eurotransplant organization.
The Board approved that the HIT program of Prof. G. Opelz for highly immunized patients should be continuedby the Eurotransplant Reference Laboratory (ETRL). The original procedure of shipment of all donor spleensto the ETRL for serological retyping was abolished in order to reduce costs. A new quality assurance programwill be set up.
The central role of Eurotransplant in collecting follow-up data on transplanted patients – in close collaborationwith international registries – was reconfirmed.
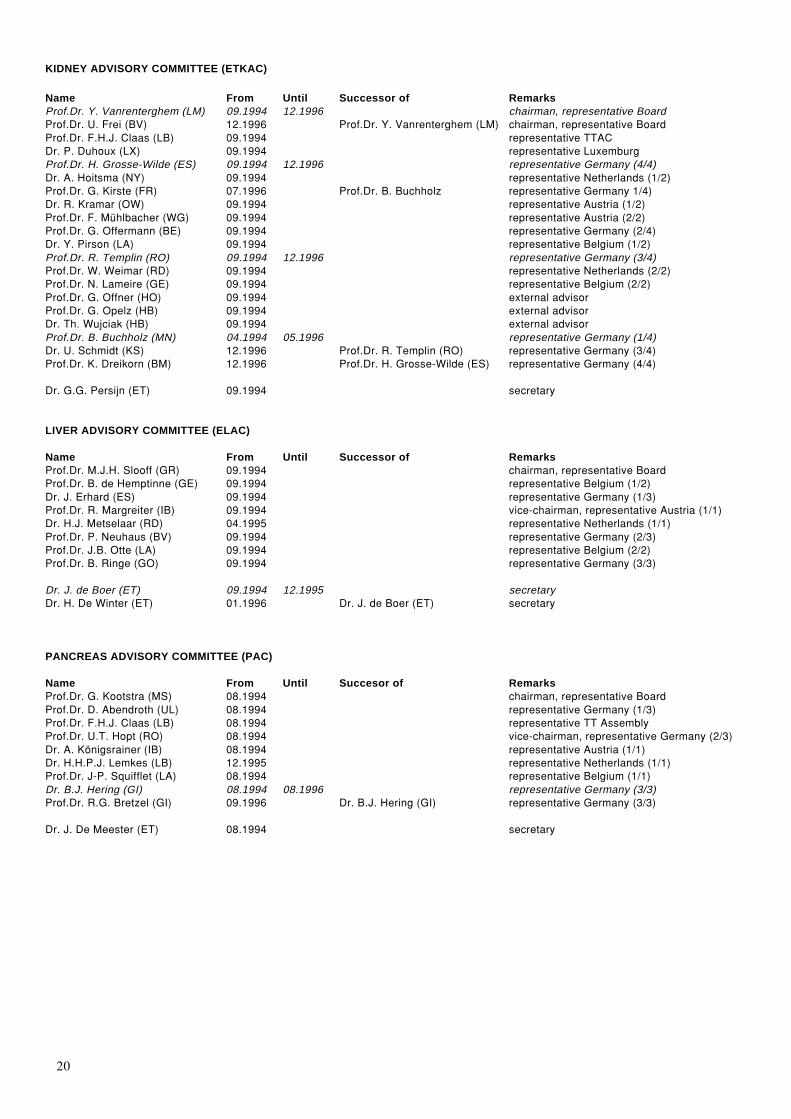
The Board approved many recommendations from the Advisory Committees, which are regularly publishedin the Eurotransplant newsletters.In 1996, the Advisory Committees were composed as follows.
20
KIDNEY ADVISORY COMMITTEE (ETKAC)
Name From Until Successor of RemarksProf.Dr. Y. Vanrenterghem (LM) 09.1994 12.1996 chairman, representative BoardProf.Dr. U. Frei (BV) 12.1996 Prof.Dr. Y. Vanrenterghem (LM) chairman, representative BoardProf.Dr. F.H.J. Claas (LB) 09.1994 representative TTACDr. P. Duhoux (LX) 09.1994 representative LuxemburgProf.Dr. H. Grosse-Wilde (ES) 09.1994 12.1996 representative Germany (4/4)Dr. A. Hoitsma (NY) 09.1994 representative Netherlands (1/2)Prof.Dr. G. Kirste (FR) 07.1996 Prof.Dr. B. Buchholz representative Germany 1/4)Dr. R. Kramar (OW) 09.1994 representative Austria (1/2)Prof.Dr. F. Mühlbacher (WG) 09.1994 representative Austria (2/2)Prof.Dr. G. Offermann (BE) 09.1994 representative Germany (2/4)Dr. Y. Pirson (LA) 09.1994 representative Belgium (1/2)Prof.Dr. R. Templin (RO) 09.1994 12.1996 representative Germany (3/4)Prof.Dr. W. Weimar (RD) 09.1994 representative Netherlands (2/2)Prof.Dr. N. Lameire (GE) 09.1994 representative Belgium (2/2)Prof.Dr. G. Offner (HO) 09.1994 external advisorProf.Dr. G. Opelz (HB) 09.1994 external advisorDr. Th. Wujciak (HB) 09.1994 external advisorProf.Dr. B. Buchholz (MN) 04.1994 05.1996 representative Germany (1/4)Dr. U. Schmidt (KS) 12.1996 Prof.Dr. R. Templin (RO) representative Germany (3/4)Prof.Dr. K. Dreikorn (BM) 12.1996 Prof.Dr. H. Grosse-Wilde (ES) representative Germany (4/4)
Dr. G.G. Persijn (ET) 09.1994 secretary
LIVER ADVISORY COMMITTEE (ELAC)
Name From Until Successor of RemarksProf.Dr. M.J.H. Slooff (GR) 09.1994 chairman, representative BoardProf.Dr. B. de Hemptinne (GE) 09.1994 representative Belgium (1/2)Dr. J. Erhard (ES) 09.1994 representative Germany (1/3)Prof.Dr. R. Margreiter (IB) 09.1994 vice-chairman, representative Austria (1/1)Dr. H.J. Metselaar (RD) 04.1995 representative Netherlands (1/1)Prof.Dr. P. Neuhaus (BV) 09.1994 representative Germany (2/3)Prof.Dr. J.B. Otte (LA) 09.1994 representative Belgium (2/2)Prof.Dr. B. Ringe (GO) 09.1994 representative Germany (3/3)
Dr. J. de Boer (ET) 09.1994 12.1995 secretaryDr. H. De Winter (ET) 01.1996 Dr. J. de Boer (ET) secretary
PANCREAS ADVISORY COMMITTEE (PAC)
Name From Until Succesor of RemarksProf.Dr. G. Kootstra (MS) 08.1994 chairman, representative BoardProf.Dr. D. Abendroth (UL) 08.1994 representative Germany (1/3)Prof.Dr. F.H.J. Claas (LB) 08.1994 representative TT AssemblyProf.Dr. U.T. Hopt (RO) 08.1994 vice-chairman, representative Germany (2/3)Dr. A. Königsrainer (IB) 08.1994 representative Austria (1/1)Dr. H.H.P.J. Lemkes (LB) 12.1995 representative Netherlands (1/1)Prof.Dr. J-P. Squifflet (LA) 08.1994 representative Belgium (1/1)Dr. B.J. Hering (GI) 08.1994 08.1996 representative Germany (3/3)Prof.Dr. R.G. Bretzel (GI) 09.1996 Dr. B.J. Hering (GI) representative Germany (3/3)
Dr. J. De Meester (ET) 08.1994 secretary

21
THORACIC ADVISORY COMMITTEE (ThAC)
Name From Until Successor of RemarksProf.Dr. A. Haverich (HO) 09.1994 chairman, representative BoardDr. W.J. de Boer (GR) 09.1994 representative Netherlands (1/2)Prof.Dr. S. Hagl (HB) 09.1994 representative Germany (1/4)Dr. N. de Jonge (UT) 09.1994 representative Netherlands (2/2)Dr. G. Laufer (WG) 09.1994 representative Austria (1/2)Prof.Dr. B. Reichart (ML) 09.1994 representative Germany (2/4)Prof.Dr. J. Schoevaerdts (LA) 09.1994 representative Belgium (1/2)Prof.Dr. S. Schüler (DR) 09.1994 12.1996 representative Germany (4/4)Dr. K. Tscheliessnigg (GA) 09.1994 representative Austria (2/2)Prof.Dr. J. Vanhaecke (LM) 09.1994 vice-chairman, representative Belgium (2/2)Prof.Dr. Th. Wahlers (HO) 09.1994 representative Germany (3/4)Prof.Dr. H. Scheld (MN) 12.1996 Prof.Dr. S. Schüler (DR) representative Germany (4/4)Dr. M. Loebe (BD) 12.1995 external advisorDr. M. Antoine (BR) 06.1995 external advisor
Dr. J. De Meester (ET) 09.1994 secretary
TISSUE TYPING ADVISORY COMMITTEE (TTAC)
Name From Until Successor RemarksProf.Dr. F.H.J. Claas (LB) 09.1995 chairman, representative BoardDr. G. Bein (LU) 09.1995 representative Germany (1/2)Dr. M.P. Emonds (LM) 09.1995 representative Belgium (1/1)Dr. F. Hentges (LX) 09.1995 representative Luxemburg (1/1)Dr. G. Holzberger (Kassel) 09.1995 12.1996 representative Germany (2/2)Dr. S. Lems (GR) 09.1995 representative Netherlands (1/1)Prof.Dr. W. Mayr (WG) 09.1995 representative Austria (1/1)
Dr. I.I.N. Doxiadis (ETRL) 09.1995 secretary
ORGAN PROCUREMENT COMMITTEE (OPC)
Name From Until Successor of RemarksProf.Dr. B. Ringe (GO) 09.1995 chairman, representative BoardDr. P. Wamser (WG) 03.1996 representative TC’s AustriaProf.Dr. R. Margreiter (IB) 09.1995 03.1996 representative ELACMs. B. Van Haelewijck (BR) 09.1995 representative TC’s BelgiumMr. J. Kranenburg (GR) 09.1995 representative TC’s NetherlandsDr. J. Erhard (ES) 06.1996 Prof.Dr. R. Margreiter (IB) representative ELACDr. F-P. Nitschke (RO) 09.1995 representative TC’s Germany (1/2)Prof.Dr. J-P. Squifflet (LA) 09.1995 representative PACProf.Dr. Th. Wahlers (HO) 09.1995 representative ThACMr. R. Werner (GO) 09.1995 representative TC’s Germany (2/2)Prof.Dr. G. Kirste (FR) 05.1996 Prof.Dr. B. Buchholz representative ETKACProf.Dr. B. Buchholz (MN) 09.1995 05.1996 representative ETKAC
Dr. J. de Boer (ET) 09.1995 secretary
COMPUTER SERVICES WORKING GROUP (CSWG)
Name From Until Successor of RemarksProf.Dr. F. Mühlbacher (WG) 09.1995 chairman, representative BoardProf.Dr. G.A. Verpooten (AN) 09.1995 representative BelgiumDr. F.A. Zantvoort (BM) 09.1995 vice-chairman, representative GermanyDr. A. Hoitsma (NY) 09.1995 representative ETKAC + NetherlandsDr. R. Kramar (OW) 09.1995 representative AustriaDr. S. Lems (GR) 06.1996 representative TTACDr. H.J. Metselaar (RD) 06.1996 representative ELACDr. W.J. de Boer (GR) 09.1995 representative ThACMr. H. Riedl (DSO) 09.1995 external advisorDr. H.H.P.J. Lemkes (LB) 12.1995 representative PAC
Drs. B. Haase-Kromwijk (ET) 09.1995 secretary
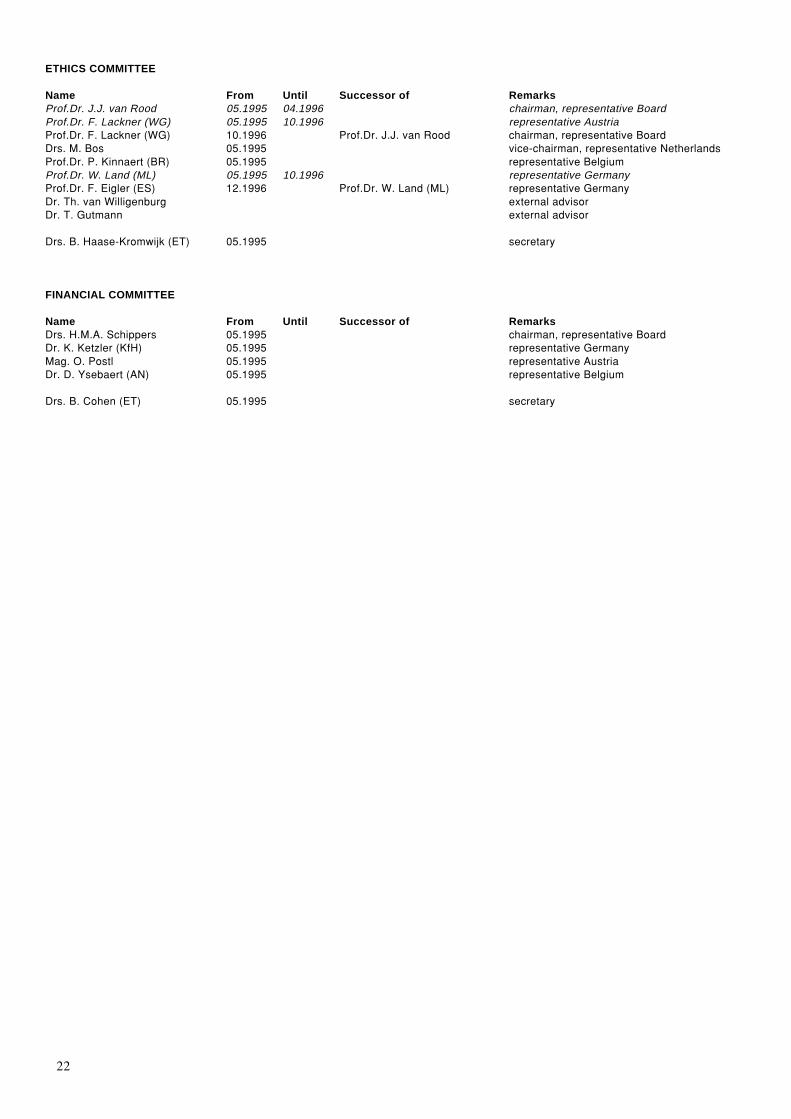
22
ETHICS COMMITTEE
Name From Until Successor of RemarksProf.Dr. J.J. van Rood 05.1995 04.1996 chairman, representative BoardProf.Dr. F. Lackner (WG) 05.1995 10.1996 representative AustriaProf.Dr. F. Lackner (WG) 10.1996 Prof.Dr. J.J. van Rood chairman, representative BoardDrs. M. Bos 05.1995 vice-chairman, representative NetherlandsProf.Dr. P. Kinnaert (BR) 05.1995 representative BelgiumProf.Dr. W. Land (ML) 05.1995 10.1996 representative GermanyProf.Dr. F. Eigler (ES) 12.1996 Prof.Dr. W. Land (ML) representative GermanyDr. Th. van Willigenburg external advisorDr. T. Gutmann external advisor
Drs. B. Haase-Kromwijk (ET) 05.1995 secretary
FINANCIAL COMMITTEE
Name From Until Successor of RemarksDrs. H.M.A. Schippers 05.1995 chairman, representative BoardDr. K. Ketzler (KfH) 05.1995 representative GermanyMag. O. Postl 05.1995 representative AustriaDr. D. Ysebaert (AN) 05.1995 representative Belgium
Drs. B. Cohen (ET) 05.1995 secretary

23
E2. Eurotransplant: donation,
waiting lists and transplantsJ. De Meester, MD, Eurotransplant International Foundation, Leiden, The Netherlands
2.1 Donation and donor organ availability in 19962.1.1 Cadaveric organ donors from the Eurotransplant areaThe statistics on donation only deal with cadaveric donors, of whom at least one single organ has been usedin a transplant. Excluded are donors, reported to and/or offered by Eurotransplant, but from whom not a singleone organ transplant was realised (1994: N=77; 1995: N=89; 1996: N=76).
The total number of cadaveric donors, used in 1996 (N=1647), was nearly similar to the 1995 number(N=1620) [Table 2.1]. The donation figures of each Eurotransplant country are clearly fluctuating on a plateau.The total number of donors further increased slightly from 1620 in 1995 to 1647 in 1996. It should be notedthat liver donation and transplantation still enjoys expansion (N=+109, +13%), and more pancreata wereactually used in a clinical transplant (N=+35, +29%) [Table 2.2].
Comparing 1995 and 1996, there was no further increase of the usage of elderly donors (aged over 55 years):350 in 1995 versus 348 in 1996 [Table 2.3]. In 1996, a higher number of donors with AB0 blood group type0 was noted (N=742), in comparison with 1995 (N=654), while the AB0 blood group type A and AB showed5% and 30% decrease respectively.
Table 2.1 Number of cadaveric organ donors, from the Eurotransplant area and used for a transplant, from 1993 to 1996
Country population 1993 1994 1995 1996 1995/1996(million) pmp
Austria 8.4 207 171 172 184 23.0 + 6.9%Belgium 10.4 217 228 196 212 21.2 + 8.2%Germany 80.4 1095 982 1022 1012 12.6 –Luxemburg 0.4 9 4 2 13 32.5 –Netherlands 15.4 221 196 228 226 15.1 –
Total 113.4 1749 1581 1620 1647 14.5 + 1.7%
Table 2.2 Number of cadaveric organ donors, from the Eurotransplant area and used for a transplant, by organ, from 1993 to1996
Year 1993 1994 1995 1996
Organ donors total 1749 1581 1620 1647Kidney 1720 1544 1585 1607Heart 785 725 746 773Lung 146 155 144 168Liver 844 827 825 934Pancreas 100 97 119 154
Table 2.3 Demographic data on the cadaveric organ donors, from the Eurotransplant area and used for a transplant in 1996
Country Total Age (years) Sex AB0 Blood group Cause of death0–15 16–55 ≥56 Male Female A AB B 0 Accident Natural Suicide
Austria 184 10 144 30 113 71 78 8 20 78 68 106 10Belgium 212 24 155 33 129 83 95 5 11 101 101 95 16Germany 1012 66 710 236 598 414 405 36 119 452 359 608 45Luxemburg 13 0 12 1 8 5 8 0 2 3 7 5 1Netherlands 226 15 163 48 124 102 88 9 21 108 81 141 4
Total 1647 115 1184 348 972 675 674 58 173 742 616 955 76100% 7% 72% 21% 59% 41% 41% 4% 10% 45% 37% 58% 5%

24
As shown in Table 2.4, the percentage of multi-organ donation has gradually increased over the last 4 years,from 61% in 1993 to 67% in 1996. Differences between the Eurotransplant countries remained: Austria andBelgium are ahead of Germany and The Netherlands. However, these differences are less pronounced whenthe denominator donor population is limited to heart-beating cadaveric kidney donors aged from 16 to 55 years(N=1136/1607; 71%): Austria, 77%; Belgium, 84%; Germany, 74%; The Netherlands, 77%.
2.1.2 Cadaveric organ donors from outside the Eurotransplant areaFrom outside the Eurotransplant area, organs from 224 donors were offered to the duty office of Eurotrans-plant. Organs from 100 donors were actually accepted and transplanted within the Eurotransplant area.
These organ offers from outside the Eurotransplant area can be divided into two categories:a. The first category consists of donor organs, offered by another European organ exchange organization, in
case these organs can not be used within the local organization. Through this international collaboration,21 donor livers, 15 donor hearts, 12 donor kidneys (3 HIT kidneys) and 4 donor lungs were transplantedin the Eurotransplant area.
b. To the second category belong donor organs, which are made available to a Eurotransplant transplantprogram by an individual center from outside the Eurotransplant area, in the frame work of an educationalcollaboration.Organs from a cadaveric donor which can not be used at the foreign center are considered as a local donoron the account of the fellow Eurotransplant transplant program. For these ‘local donor’ organs, the usualorgan allocation procedures of Eurotransplant are applicable.In total, 50 donor livers, 8 donor hearts, 2 donor kidneys and 4 donor lungs were used in the Eurotransplantarea.
2.1.3 Living donor transplantsIn 1996, 246 living donors gave their next-of-kin a kidney: +35 (+16%) [Table 2.7]. Twenty-two times, a livertransplant was performed using a liver segment from a living related donor or using the explanted native liverof a patient who got a liver transplant (‘domino’). One ‘domino’ heart transplant was done, using the nativehealthy heart of a patient who received a heart/lung transplant.
2.2 Active patient waiting list at the end of 1996Compared with 1995, a major increase on the ‘transplantable’ waiting list at the end of 1996 was noted for liver(+24%) and pancreas (+32%) [Table 2.5]. A 4-5% rise was present for kidney and heart. Heart/Lung and lungwaiting lists were about 10% lower.
Table 2.4 Type of organ donation in 1996
Country Kidney donor No-kidney donor Cadaveric donor
Total Kidney-only Multi-organ %MOD Total
Austria 178 52 126 71% 6 184 11%Belgium 203 45 158 78% 9 212 13%Germany 991 357 634 64% 21 1012 62%Luxemburg 13 2 11 85% 0 13 <1%Netherlands 222 79 143 64% 4 226 14%
Total 1996 1607 535 1072 67% 40 1647 100%
Total 1995 1585 585 1000 63% 35 1620Total 1994 1544 549 995 64% 37 1581Total 1993 1720 671 1049 61% 29 1749
In the Eurotransplant organization, a kidney donor is defined as a donor from whom at least one kidney is transplanted (thus, not only procured). Akidney donor from whom also at least one non-renal organ is used in a transplant, is called a multi-organ donor. When only one or more non-renalorgans are used, the donor is classified as a no-kidney donor.

25
2.3 Inflow on the waiting list during 1996Registrations comprise listing for a first transplant as well as for repeat transplants, irrespective of the urgencycode at the time of listing [Table 2.6]. More registrations were noted with regard to liver (+12%), pancreas(+39%) and heart (+9%). The number of registrations for a kidney transplant has decreased over the last 4 years.
2.4 Outflow from the waiting list during 19962.4.1 Organ transplants from non-living donorsIn 1996, 5216 cadaveric donor organs were used in 5053 transplant operations [Table 2.7]; the lower numberof transplant operations is due to multiple organ transplants, e.g. pancreas/kidney, heart/lung, etc. A highernumber of cadaveric transplants was noted for pancreas (+35; +29%) and for liver (+88; +9%).
With regard to organ allocation, local and regional transplants were, on average, realized in 63% of hearttransplantations and 54% of kidney transplantations. As in 1995, organ exchange was present in 60-65% withregard to liver, heart/lung, lung and pancreas transplants.
Table 2.5 Size of the active Eurotransplant waiting list, by organ, on December 31, 1992 to 1996
December 31, 1992 1993 1994 1995 1996
Organ,Kidney 9023 9419 10157 10510 10988Heart 552 672 723 709 744Heart/Lung 48 49 71 79 71Lung 141 203 227 224 204Liver 253 203 212 263 327Pancreas 165 134 147 138 182
Data reported concern a snapshot of the waiting lists on the last day of each calendar year; only the patients who are actively awaiting an organtransplant have been counted. Patients who are awaiting a simultaneous multiple organ transplant, are registered on the waiting list of each organawaited. Therefore, the organ-specific waiting list rather represents the need for organs than the actual number of patients.Patients on the waiting list, having the urgency code ‘Not Transplantable’, have been excluded.
Table 2.6 Registrations on the Eurotransplant waiting list, by organ, from 1993 to 1996
Year 1993 1994 1995 1996
Organ,Kidney 5164 5059 4886 4826Heart 1368 1218 1208 1319Heart/Lung 78 93 81 71Lung 223 223 226 219Liver 1067 1114 1240 1393Pancreas 121 123 157 219
Table 2.7 Number of transplants within the Eurotransplant area, by organ, from 1993 to 1996
Year 1993 1994 1995 1996
Cadaveric donors
Transplanted organs,Kidney 3293 2997 3064 3083Heart 773 696 732 759Heart/Lung 28 43 42 34Lung 119 138 125 154Liver 878 892 944 1032Pancreas 100 96 119 154
Transplant operations,Total 5071 4746 4899 5053
Living donors
Kidney 126 168 211 246Heart (‘domino’) 0 2 0 1Lung (lung lobe) 0 0 1 0Liver (segment or ‘domino’) 14 24 25 22
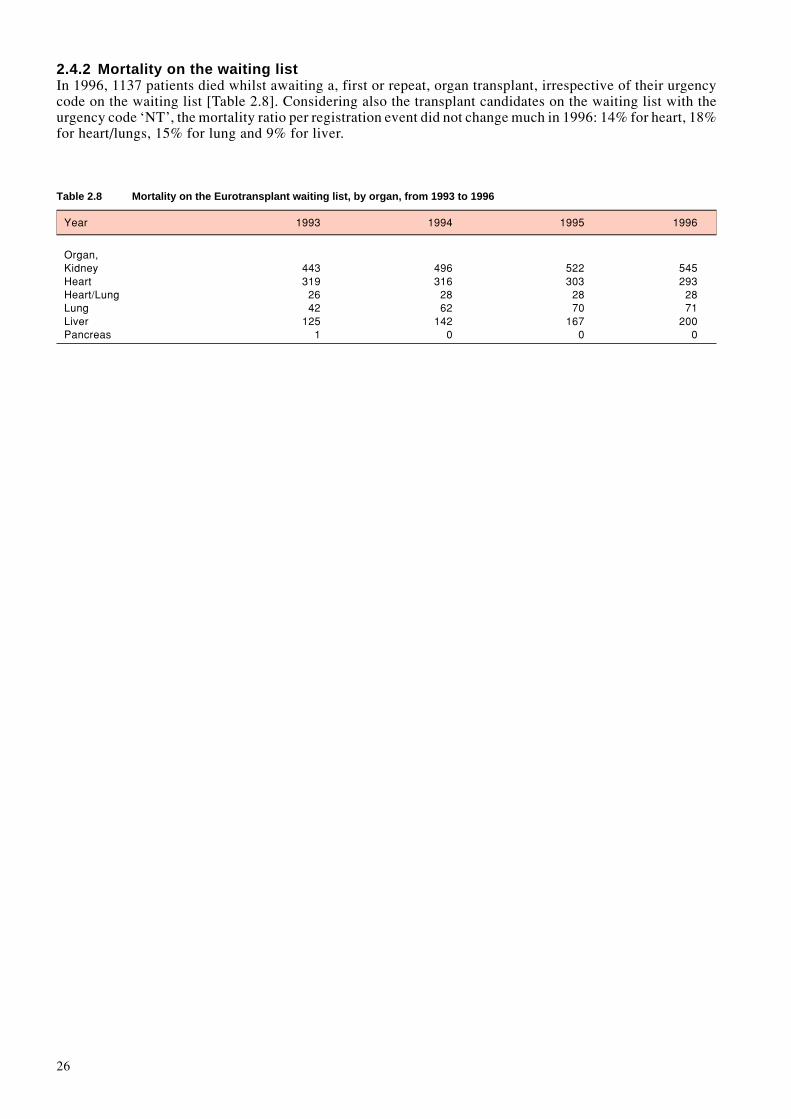
26
2.4.2 Mortality on the waiting listIn 1996, 1137 patients died whilst awaiting a, first or repeat, organ transplant, irrespective of their urgencycode on the waiting list [Table 2.8]. Considering also the transplant candidates on the waiting list with theurgency code ‘NT’, the mortality ratio per registration event did not change much in 1996: 14% for heart, 18%for heart/lungs, 15% for lung and 9% for liver.
Table 2.8 Mortality on the Eurotransplant waiting list, by organ, from 1993 to 1996
Year 1993 1994 1995 1996
Organ,Kidney 443 496 522 545Heart 319 316 303 293Heart/Lung 26 28 28 28Lung 42 62 70 71Liver 125 142 167 200Pancreas 1 0 0 0
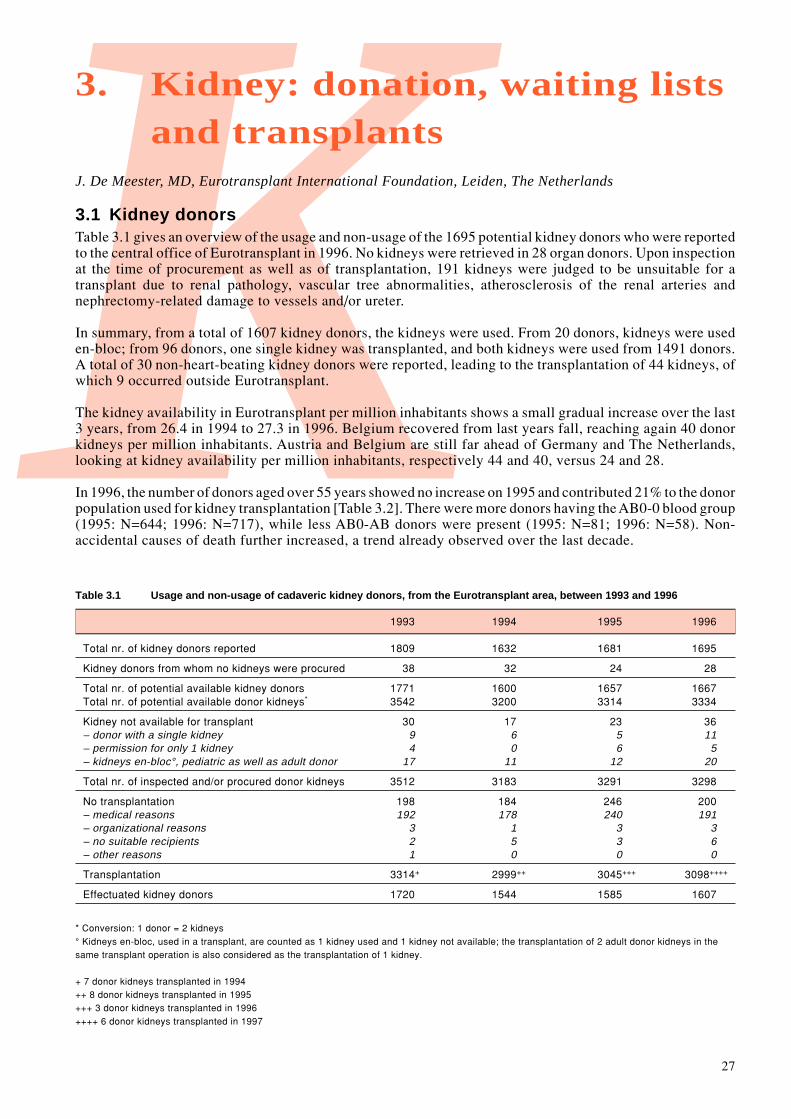
27
K3. Kidney: donation, waiting lists
and transplantsJ. De Meester, MD, Eurotransplant International Foundation, Leiden, The Netherlands
3.1 Kidney donorsTable 3.1 gives an overview of the usage and non-usage of the 1695 potential kidney donors who were reportedto the central office of Eurotransplant in 1996. No kidneys were retrieved in 28 organ donors. Upon inspectionat the time of procurement as well as of transplantation, 191 kidneys were judged to be unsuitable for atransplant due to renal pathology, vascular tree abnormalities, atherosclerosis of the renal arteries andnephrectomy-related damage to vessels and/or ureter.
In summary, from a total of 1607 kidney donors, the kidneys were used. From 20 donors, kidneys were useden-bloc; from 96 donors, one single kidney was transplanted, and both kidneys were used from 1491 donors.A total of 30 non-heart-beating kidney donors were reported, leading to the transplantation of 44 kidneys, ofwhich 9 occurred outside Eurotransplant.
The kidney availability in Eurotransplant per million inhabitants shows a small gradual increase over the last3 years, from 26.4 in 1994 to 27.3 in 1996. Belgium recovered from last years fall, reaching again 40 donorkidneys per million inhabitants. Austria and Belgium are still far ahead of Germany and The Netherlands,looking at kidney availability per million inhabitants, respectively 44 and 40, versus 24 and 28.
In 1996, the number of donors aged over 55 years showed no increase on 1995 and contributed 21% to the donorpopulation used for kidney transplantation [Table 3.2]. There were more donors having the AB0-0 blood group(1995: N=644; 1996: N=717), while less AB0-AB donors were present (1995: N=81; 1996: N=58). Non-accidental causes of death further increased, a trend already observed over the last decade.
Table 3.1 Usage and non-usage of cadaveric kidney donors, from the Eurotransplant area, between 1993 and 1996
1993 1994 1995 1996
Total nr. of kidney donors reported 1809 1632 1681 1695
Kidney donors from whom no kidneys were procured 38 32 24 28
Total nr. of potential available kidney donors 1771 1600 1657 1667Total nr. of potential available donor kidneys* 3542 3200 3314 3334
Kidney not available for transplant 30 17 23 36– donor with a single kidney 9 6 5 11– permission for only 1 kidney 4 0 6 5– kidneys en-bloc°, pediatric as well as adult donor 17 11 12 20
Total nr. of inspected and/or procured donor kidneys 3512 3183 3291 3298
No transplantation 198 184 246 200– medical reasons 192 178 240 191– organizational reasons 3 1 3 3– no suitable recipients 2 5 3 6– other reasons 1 0 0 0
Transplantation 3314+ 2999++ 3045+++ 3098++++
Effectuated kidney donors 1720 1544 1585 1607
* Conversion: 1 donor = 2 kidneys° Kidneys en-bloc, used in a transplant, are counted as 1 kidney used and 1 kidney not available; the transplantation of 2 adult donor kidneys in thesame transplant operation is also considered as the transplantation of 1 kidney.
+ 7 donor kidneys transplanted in 1994++ 8 donor kidneys transplanted in 1995+++ 3 donor kidneys transplanted in 1996++++ 6 donor kidneys transplanted in 1997

28
Table 3.2 Demographic data on cadaveric kidney donors, from the Eurotransplant area and used for a transplant in 1996
Country Total Age (years) Sex AB0 Blood group Cause of death0–15 16–55 ≥56 Male Female A AB B 0 Accident Natural Suicide
Austria 178 10 139 29 110 68 77 8 18 75 67 101 10Belgium 203 21 150 32 125 78 93 5 10 95 96 91 16Germany 991 63 693 235 584 407 396 36 118 441 353 593 45Luxemburg 13 0 12 1 8 5 8 0 2 3 7 5 1Netherlands 222 15 160 47 122 100 89 9 21 103 81 137 4
Total 1607 109 1154 344 949 658 663 58 169 717 604 927 76100% 7% 72% 21% 59% 41% 41% 4% 10% 45% 37% 58% 5%
Table 3.3 Total number of actively waiting patients on the kidney waiting list on December 31, from 1992 to 1996
December 31, 1992 1993 1994 1995 1996
Austria 868 817 794 819 839Belgium 814 923 952 1007 1016Germany 6437 6735 7446 7674 8112Luxemburg 21 13 17 17 16Netherlands 883 931 948 993 1005
Total 9023 9419 10157 10510 10988
Figure 3.1 Dynamic of the Eurotransplant kidney waiting list and kidney transplants, from 1969 to 1996
0
2500
5000
7500
10000
12500
19692
102
19713
228
197311
454
197533583
197733800
197933
1050
198151
1261
19831081673
19851501965
19871612738
19881402736
19891223048
19901003171
19911283395
19921353101
19931263294
19941682997
1995211
3064
19962463083
Living Donor TransplantsCadaveric Donor Transplants

29
3.2 Waiting listThe overall kidney waiting list increased from 10510 at the end of 1995 to 10988 at the end of 1996 [Table3.3, Figure 3.1]. This 4.5% growth is comparable to that noted over the previous 4 years, with the exceptionof the 11.5% increase over the calendar year 1994.
The new Eurotransplant Kidney(-only) Allocation System, introduced on March 11, 1996, has resulted in ahigher transplant rate of long waiting transplant candidates, of pediatric patients, and in a catch-up of thekidney export, noted in 1995 for the non-German countries of Eurotransplant. The impact is noticed in theanalysis of the Eurotransplant kidney-only waiting list at December 31, 1996 (N=10855) [Table 3.4].
The increase of the active kidney-only transplant waiting list is exclusively on the account of Germany, dueto the decreased kidney-only transplant activity in 1996 (minus 197 transplants). The number of pediatricrecipients, less than 16 years old, decreased from 142 to 104 (-27%). In each country, kidney-only transplantcandidates having AB0 blood group type 0 were the largest group on the waiting list. The distribution of thecurrent HLA-sensitization showed a reduction of the currently ‘Highly Immunized’ patients (≥85% PRA),from 184 to 159. The ratio between patients awaiting a repeat transplant and patients awaiting their firsttransplant did not change, the Netherlands having the highest percentage of patients awaiting a re-transplant(28%). At the end of 1996, less patients had a waiting time of more than 5 years (N=1165; 11%), in clearcontrast to rising trend noticed over the last years (1995: N=1262/10405 (12%)). With regard to matchability,i.e. eligibility for consideration in an allocation match run, the same portion (5%) had some missing matchdata: missing AB0 blood group, missing PRA%, outdated PRA% screening. The number of non-residenttransplant candidates, patients who do not live in one of the 5 Eurotransplant countries, increased by 12%, from481 to 540.
Table 3.4 Cadaveric kidney transplant Waiting List: characteristics, per country
Kidney Waiting List Total TotalDecember 31, 1996 Austria Belgium Germany Luxemburg Netherlands 1996 1995
Total 839 1016 8112 16 1005 10988 10510
Type of transplant KI-only 815 993 8038 16 993 10855 10405KI/HE 5 0 2 0 0 7 4KI/LI 2 3 11 0 0 16 12KI/PA 16 20 50 0 12 98 72KI/IS 1 0 11 0 0 12 17
Kidney-only waiting list 815 993 8038 16 993 10855 100% 10405
Age 0–15 3 10 71 1 19 104 1% 142(years) 16–55 588 847 5956 13 720 8124 75% 7967
56+ 224 136 2011 2 254 2627 24% 2296
AB0 A 323 319 3307 4 330 4283 39% 4020AB 8 7 187 1 21 224 2% 176B 70 94 790 2 94 1050 10% 9840 409 571 3751 9 548 5288 49% 5221Not yet reported 5 2 3 0 0 10 – 4
%PRA current 0–5% 630 870 6930 12 709 9151 85% 87116–84% 164 103 1017 4 233 1521 14% 146685–100% 14 12 82 0 51 159 1% 184Not yet reported 7 8 9 0 0 24 – 44
Sequence First 645 824 6747 14 717 8947 82% 8546Repeat 170 169 1291 2 276 1908 18% 1859
Time waiting 0–1 534 596 4145 11 484 5770 53% 5511(years) 2–4 178 309 3032 4 397 3920 36% 3632
5+ 103 88 861 1 112 1165 11% 1262
Residency Living in ET 745 567 8018 16 991 10315 95% 9924Living outside ET 70 448 20 0 2 540 5% 481

30
Table 3.6 Kidney transplants in 1996: characteristics, per country
Total TotalAustria Belgium Germany Luxemburg Netherlands 1996 1995
Cadaveric Donor Total 347 410 1887 14 425 3083 3064
Type of transplant KI-only 335 394 1766 14 406 2915 2938KI/HE 2 0 7 0 0 9 6KI/LI 3 3 11 0 2 19 16KI/PA 6 13 95 0 17 131 98KI/IS 1 0 8 0 0 9 5KI/LU 0 0 0 0 0 0 1
Kidney-only transplants 335 394 1766 14 406 2915 2938
HLA-A,B,DR mismatch0 47 64 478 2 81 672 6191 33 40 191 1 51 316 3132 100 134 511 2 117 864 8223 113 118 439 6 123 799 9054 32 36 119 3 34 224 2565 9 2 18 0 0 30 176 1 0 10 0 0 11 6
Age (years) 0–15 12 20 107 0 17 156 10916–55 238 272 1209 12 295 2026 208456+ 85 102 450 2 94 733 745
AB0 A 141 173 722 5 165 1206 1276AB 22 10 118 1 14 165 199B 42 42 262 4 38 388 13820 130 169 664 4 189 1156 1081
%PRA prior to transplant0–5% 272 364 1537 14 320 2508 25536–84% 58 28 202 0 81 369 36085–100% 5 2 27 0 5 39 25
Time waiting 0–1 210 294 1065 12 281 1862 1748(years) 2–4 60 77 455 2 86 680 914
5+ 65 23 246 0 39 373 276
Sequence First 266 348 1441 14 353 2422 –Repeat 69 46 325 0 53 493 –
Residency Living in ET 298 343 1766 14 406 2827 2853Living outside ET 37 51 0 0 0 88 85
Special kidney transplant groupsHigh Urgency 12 1 51 0 1 65 59Non Heart Beating Donor 6 3 0 0 26 35 31Acceptable Mismatch (AM) 0 1 0 0 14 15 11Highly Immunized Trial (HIT) 6 2 17 0 0 25 19En bloc, pediatric donor 3 2 11 0 0 16 14En bloc, adult donor 0 1 4 0 0 5 0
Living Donor Total 18 18 129 0 81 246 211
Type of donor Living Related 14 14 104 0 75 207 199Living Unrelated 4 4 25 0 6 39 12
Total Kidney Transplant Activity 365 428 2016 14 506 3329 3275
Table 3.5 Inflow and Outflow on the cadaveric kidney transplant Waiting List in 1996, per country
Total TotalAustria Belgium Germany Luxemburg Netherlands 1996 1995
Registrations Total 458 486 3170 12 700 4826 4886First transplant 374 408 2746 10 574 4112 4148Repeat transplant 84 78 424 2 126 714 738
OutflowTransplantation 347 410 1887 14 425 3083 3064Mortality on the waiting list 64 41 351 0 89 545 522De-listing 42 46 425 3 78 554 490

31
3.3 Inflow on the waiting list during 1996Also in 1996, for the third year in row, there were less registrations for a kidney transplant: N=4886, –1%(1994: –2%: 1995: –3%) [Table 3.5]; but because the inflow always exceeded the outflow, the waiting listcontinues to increase. Unaltered was the 15% portion of registrations for a repeat kidney transplant.
3.4 Outflow from the waiting list during 19963.4.1 Kidney transplants from non-living donorsThe number of cadaveric kidney transplants performed in 1996 in the Eurotransplant area amounted to 3083[Table 3.5, Table 3.6], comparable to 1995 (N=3064).
The characteristics of the kidney-only transplants, performed in the Eurotransplant area (N=2915) [ Table 3.6],illustrate the impact of the new Eurotransplant Kidney(-only) Allocation System.Kidney-only transplantation with ‘000’ HLA-A,B,DR mismatches between donor and recipient was realizedin 23% (N=672/2915). Considerably more pediatric patients received a transplant in 1996 (N=156), almost+50% on 1995 (N=109). Thanks to the higher number of AB0-0 donors, more AB0-0 kidney-only transplantswere noted; as such, also the usage of AB0-0 kidneys for recipients with other blood groups slightly increased,9.2% versus the usual 8% noted over the last 4 years.More long-waiting patients, having a waiting time of 5 years or more, were transplanted: 1995, N= 276 versus1996, N=373, an increase of 35%.Thirty-nine currently ‘Highly Immunized’ patients were transplanted, about 10% of the ‘HI’ waiting list. Theregular Eurotransplant kidney allocation program succeeded in the transplantation of 25 ‘HI’ patients (64%),while the AM and HIT program contributed 2 and 12 transplants respectively.The total 1996 activity of the AM program, however, amounted to 15 transplants while 25 transplants inEurotransplant were realized through the HIT protocol. Additionally, six kidneys were transplanted in HIT-patients outside Eurotransplant (Switzerland, N=4; Czech Republic, N=1; Slovak Republic, N=1).Sixteen kidney-en-bloc transplants from pediatric donors were done (1995: N=14). From 5 adult donors, bothkidneys were used for the transplantation of 1 patient, in order to transplant sufficient functional renal mass.
Although there was a major adjustment of the national kidney exchange balances, on average, a similarpercentage of donor kidneys could be transplanted locally or regionally: 55% in 1996 (N=1606/2915) versus56% in 1995 (N=1662/2938).
3.4.2 Mortality on the waiting listA total number of 545 patients were reported to have died in 1996 whilst registered on the waiting list forkidney transplantation [Table 3.5]. The mortality ratio per registration event during the calendar year 1996attained 2.9%, comparable to 1995.
3.4.3 De-listingA portion of patients (N=554), similar to the patients having died on the kidney transplant waiting list, wasde-listed in 1996 [Table 3.6]; reasons were, poor transplant candidate, living donor kidney transplant, patientwas no longer interested, etc.
3.5 Living donor kidney transplantsThe number of living donor kidney transplants further increased, from 211 in 1995 to 246 in 1996, nowachieving 6% of the total Eurotransplant kidney transplant activity.The living unrelated donor kidney transplants, in particular, were responsible for the 1996 increase: from 12in 1995 to 39 in 1996. In this group spousal transplants accounted for 90%.With regard to the living related kidney transplants (N=207), mothers donated a kidney in 79 cases, siblingsin 65, fathers in 53 and other related family members in 10 cases.A survey of the living donor kidney transplant activity, per country and per center, is shown in the Addenda.
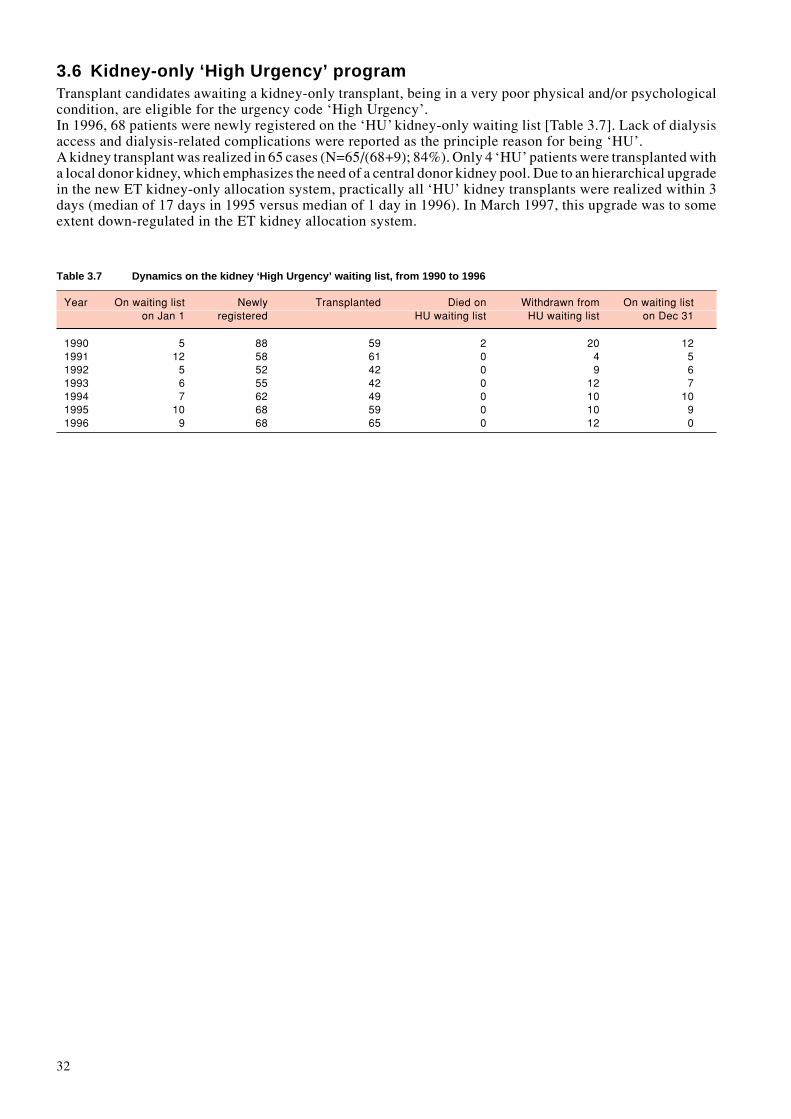
32
3.6 Kidney-only ‘High Urgency’ programTransplant candidates awaiting a kidney-only transplant, being in a very poor physical and/or psychologicalcondition, are eligible for the urgency code ‘High Urgency’.In 1996, 68 patients were newly registered on the ‘HU’ kidney-only waiting list [Table 3.7]. Lack of dialysisaccess and dialysis-related complications were reported as the principle reason for being ‘HU’.A kidney transplant was realized in 65 cases (N=65/(68+9); 84%). Only 4 ‘HU’ patients were transplanted witha local donor kidney, which emphasizes the need of a central donor kidney pool. Due to an hierarchical upgradein the new ET kidney-only allocation system, practically all ‘HU’ kidney transplants were realized within 3days (median of 17 days in 1995 versus median of 1 day in 1996). In March 1997, this upgrade was to someextent down-regulated in the ET kidney allocation system.
Table 3.7 Dynamics on the kidney ‘High Urgency’ waiting list, from 1990 to 1996
Year On waiting list Newly Transplanted Died on Withdrawn from On waiting liston Jan 1 registered HU waiting list HU waiting list on Dec 31
1990 5 88 59 2 20 121991 12 58 61 0 4 51992 5 52 42 0 9 61993 6 55 42 0 12 71994 7 62 49 0 10 101995 10 68 59 0 10 91996 9 68 65 0 12 0

33
T4. Thoracic Organs: donation,
waiting lists and transplantsJ. De Meester, MD, Eurotransplant International Foundation, Leiden, The Netherlands
4.1 Thoracic organ donors4.1.1 Heart donorsTable 4.1 gives an overview of the usage and non-usage of the 1052 potential heart donors who were reportedto the central office of Eurotransplant in 1996. Twelve percent of donor hearts were discarded on inspectionduring procurement. In summary, hearts of 773 donors were used for a transplant; from 34 donors, the heartwas used in a heart/lung en bloc transplant. The last 4 years, the number of heart donors used has clearlyreached a plateau in the Eurotransplant area. Hearts from donors aged over 55 years were less often used in1996 (N=38; 5%) than in 1995 (N=43; 6%) [Table 4.2].
4.1.2 Lung donorsTable 4.3 gives an overview of the usage and non-usage of the 386 potential lung donors who were reportedto the central office of Eurotransplant in 1996. Upon inspection, 17% donor lungs were found to be unsuitablefor transplantation. Lungs from 168 donors were ultimately used in a transplant; only in 18% of the heartdonors, the lungs also were grafted. From 34 donors, lungs were used as a heart/lung bloc. Lungs from 92donors were used for a double lung transplant, while, from 27 donors, only one lung was used. From 15 donors,the 2 lungs were separately used in two recipients. Lung donors, aged over 55 years, were rarely used for a lungtransplant [Table 4.4].
Table 4.1 Usage and non-usage of cadaveric heart donors, from the Eurotransplant area, between 1993 and 1996
1993 1994 1995 1996
Total nr. of heart donors reported 1058 1012 1034 1052
No donor heart procurement: 247 216 210 176– no time for selection / offer withdrawn 16 11 5 8– medical reasons 200 149 153 125– no suitable recipient due to donor size 16 23 15 14– no suitable recipient due to donor blood group 1 4 4 1– center out of capacity / recipient unfit 7 2 3 5– transport problems / other organizational reasons 5 8 11 8– cardiovascular instability of donor 8 19 19 15
Donor heart inspection/procurement: 811 796 824 876
No transplantation 26 71 78 103– organ unsuitable for transplantation 26 69 76 102– no back-up recipient (positive cross-match) 0 2 2 1
Transplantation 785* 725** 746 773– donor for heart/lung 32 43** 40 34– donor for heart 753* 682** 706 739
* 1 heart transplanted in 1994** 1 heart and 1 heart/lung transplanted in 1995
Table 4.2 Demographic data on cadaveric heart donors, from the Eurotransplant area and used in a transplant in 1996
Country Total Age (years) Sex AB0 Blood group Cause of death0–15 16–55 ≥56 Male Female A AB B 0 Accident Natural Suicide
Austria 95 5 88 2 64 31 39 3 14 39 45 45 5Belgium 108 12 92 4 70 38 51 0 6 51 52 48 8Germany 478 36 414 28 283 195 181 17 60 220 218 225 35Luxemburg 10 0 10 0 7 3 6 0 2 2 6 4 0Netherlands 82 6 72 4 44 38 29 7 7 39 37 41 4
Total 773 59 676 38 468 305 306 27 89 351 358 363 52100% 8% 87% 5% 61% 39% 40% 3% 11% 45% 46% 47% 7%
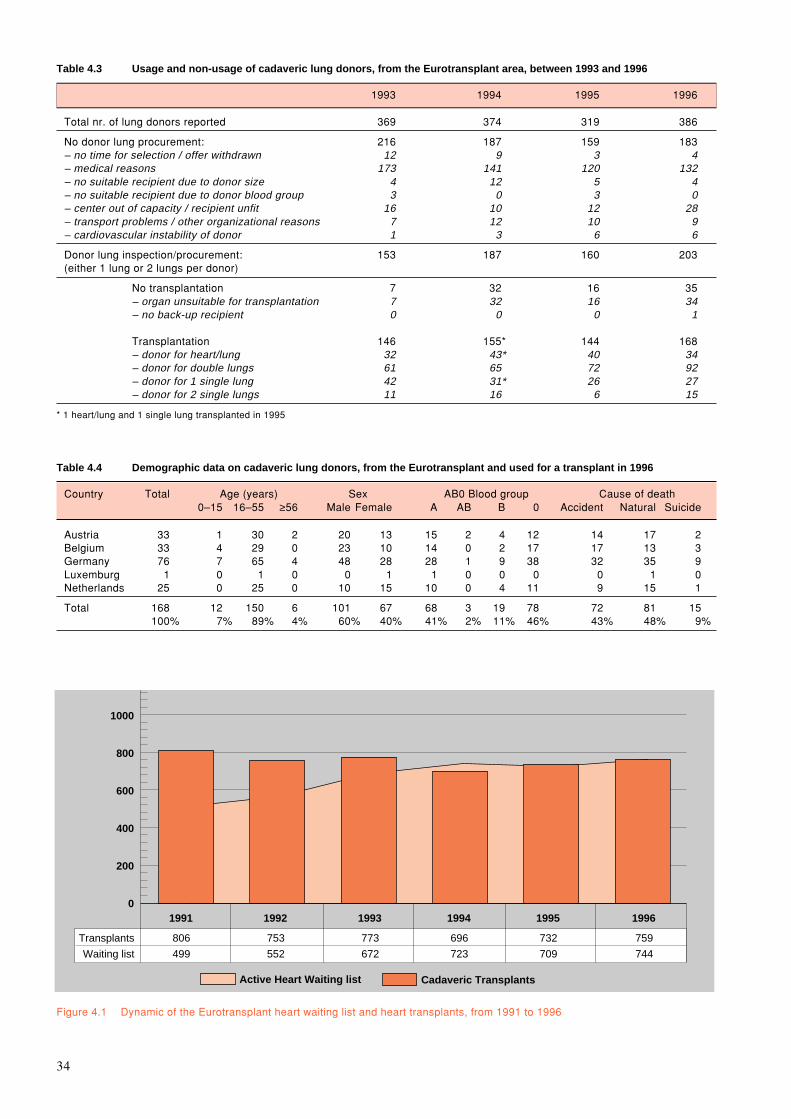
34
0
200
400
600
800
1000
Cadaveric Transplants
1991
Active Heart Waiting list
806
499
1992
753
552
1993
773
672
1994
696
723
1995
732
709
1996
759
744
Transplants
Waiting list
Table 4.3 Usage and non-usage of cadaveric lung donors, from the Eurotransplant area, between 1993 and 1996
1993 1994 1995 1996
Total nr. of lung donors reported 369 374 319 386
No donor lung procurement: 216 187 159 183– no time for selection / offer withdrawn 12 9 3 4– medical reasons 173 141 120 132– no suitable recipient due to donor size 4 12 5 4– no suitable recipient due to donor blood group 3 0 3 0– center out of capacity / recipient unfit 16 10 12 28– transport problems / other organizational reasons 7 12 10 9– cardiovascular instability of donor 1 3 6 6
Donor lung inspection/procurement: 153 187 160 203(either 1 lung or 2 lungs per donor)
No transplantation 7 32 16 35– organ unsuitable for transplantation 7 32 16 34– no back-up recipient 0 0 0 1
Transplantation 146 155* 144 168– donor for heart/lung 32 43* 40 34– donor for double lungs 61 65 72 92– donor for 1 single lung 42 31* 26 27– donor for 2 single lungs 11 16 6 15
* 1 heart/lung and 1 single lung transplanted in 1995
Table 4.4 Demographic data on cadaveric lung donors, from the Eurotransplant and used for a transplant in 1996
Country Total Age (years) Sex AB0 Blood group Cause of death0–15 16–55 ≥56 Male Female A AB B 0 Accident Natural Suicide
Austria 33 1 30 2 20 13 15 2 4 12 14 17 2Belgium 33 4 29 0 23 10 14 0 2 17 17 13 3Germany 76 7 65 4 48 28 28 1 9 38 32 35 9Luxemburg 1 0 1 0 0 1 1 0 0 0 0 1 0Netherlands 25 0 25 0 10 15 10 0 4 11 9 15 1
Total 168 12 150 6 101 67 68 3 19 78 72 81 15100% 7% 89% 4% 60% 40% 41% 2% 11% 46% 43% 48% 9%
Figure 4.1 Dynamic of the Eurotransplant heart waiting list and heart transplants, from 1991 to 1996
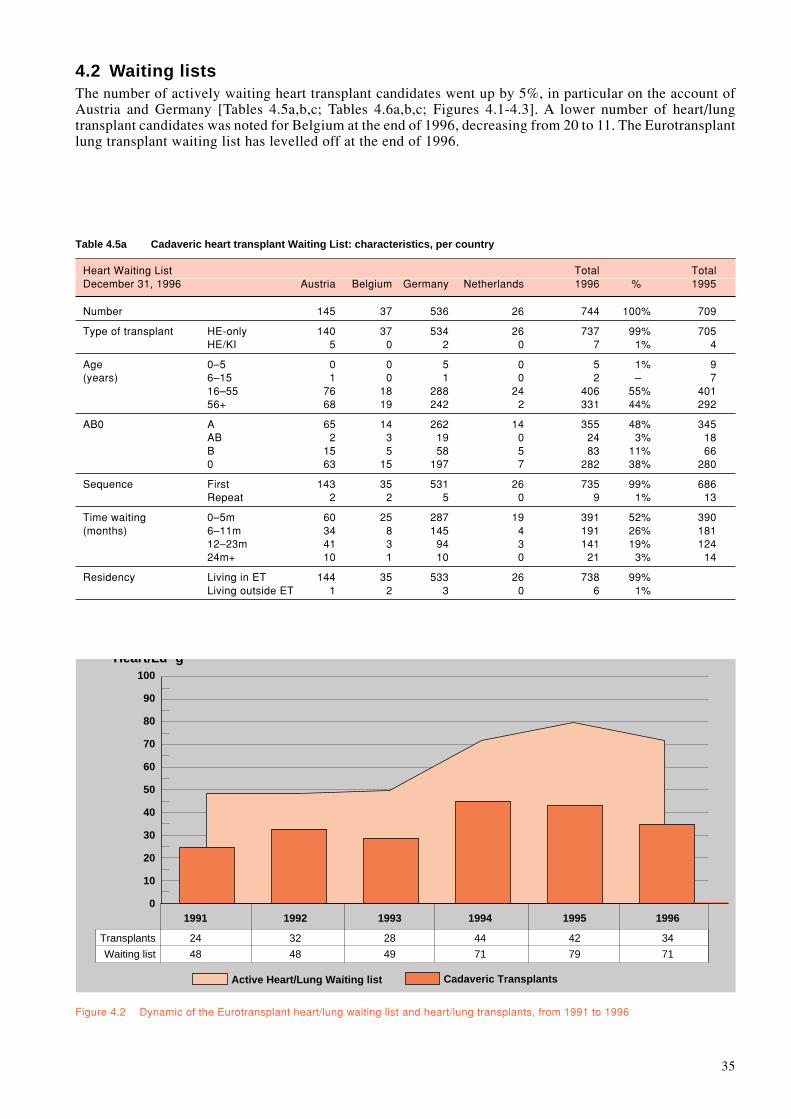
35
Active Heart/Lung Waiting list
Heart/Lu g
Transplants
Waiting list
0
10
20
30
40
50
60
70
80
90
100
Cadaveric Transplants
24
48
1991
32
48
1992
28
49
1993
44
71
1994
42
79
1995
34
71
1996
Figure 4.2 Dynamic of the Eurotransplant heart/lung waiting list and heart/lung transplants, from 1991 to 1996
4.2 Waiting listsThe number of actively waiting heart transplant candidates went up by 5%, in particular on the account ofAustria and Germany [Tables 4.5a,b,c; Tables 4.6a,b,c; Figures 4.1-4.3]. A lower number of heart/lungtransplant candidates was noted for Belgium at the end of 1996, decreasing from 20 to 11. The Eurotransplantlung transplant waiting list has levelled off at the end of 1996.
Table 4.5a Cadaveric heart transplant Waiting List: characteristics, per country
Heart Waiting List Total TotalDecember 31, 1996 Austria Belgium Germany Netherlands 1996 % 1995
Number 145 37 536 26 744 100% 709
Type of transplant HE-only 140 37 534 26 737 99% 705HE/KI 5 0 2 0 7 1% 4
Age 0–5 0 0 5 0 5 1% 9(years) 6–15 1 0 1 0 2 – 7
16–55 76 18 288 24 406 55% 40156+ 68 19 242 2 331 44% 292
AB0 A 65 14 262 14 355 48% 345AB 2 3 19 0 24 3% 18B 15 5 58 5 83 11% 660 63 15 197 7 282 38% 280
Sequence First 143 35 531 26 735 99% 686Repeat 2 2 5 0 9 1% 13
Time waiting 0–5m 60 25 287 19 391 52% 390(months) 6–11m 34 8 145 4 191 26% 181
12–23m 41 3 94 3 141 19% 12424m+ 10 1 10 0 21 3% 14
Residency Living in ET 144 35 533 26 738 99%Living outside ET 1 2 3 0 6 1%
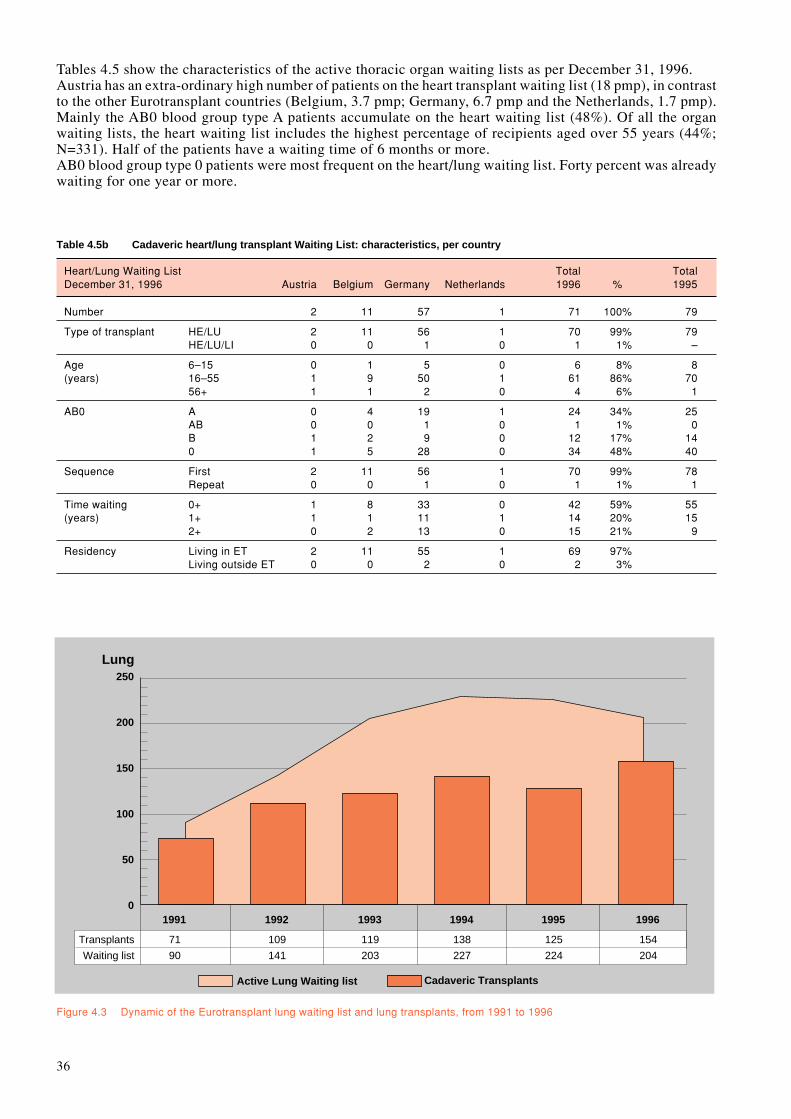
36
Tables 4.5 show the characteristics of the active thoracic organ waiting lists as per December 31, 1996.Austria has an extra-ordinary high number of patients on the heart transplant waiting list (18 pmp), in contrastto the other Eurotransplant countries (Belgium, 3.7 pmp; Germany, 6.7 pmp and the Netherlands, 1.7 pmp).Mainly the AB0 blood group type A patients accumulate on the heart waiting list (48%). Of all the organwaiting lists, the heart waiting list includes the highest percentage of recipients aged over 55 years (44%;N=331). Half of the patients have a waiting time of 6 months or more.AB0 blood group type 0 patients were most frequent on the heart/lung waiting list. Forty percent was alreadywaiting for one year or more.
Lung
0
50
100
150
200
250
Transplants
Waiting list
71
90
1991
109
141
1992
119
203
1993
138
227
1994
125
224
1995
154
204
1996
Active Lung Waiting list Cadaveric Transplants
Figure 4.3 Dynamic of the Eurotransplant lung waiting list and lung transplants, from 1991 to 1996
Table 4.5b Cadaveric heart/lung transplant Waiting List: characteristics, per country
Heart/Lung Waiting List Total TotalDecember 31, 1996 Austria Belgium Germany Netherlands 1996 % 1995
Number 2 11 57 1 71 100% 79
Type of transplant HE/LU 2 11 56 1 70 99% 79HE/LU/LI 0 0 1 0 1 1% –
Age 6–15 0 1 5 0 6 8% 8(years) 16–55 1 9 50 1 61 86% 70
56+ 1 1 2 0 4 6% 1
AB0 A 0 4 19 1 24 34% 25AB 0 0 1 0 1 1% 0B 1 2 9 0 12 17% 140 1 5 28 0 34 48% 40
Sequence First 2 11 56 1 70 99% 78Repeat 0 0 1 0 1 1% 1
Time waiting 0+ 1 8 33 0 42 59% 55(years) 1+ 1 1 11 1 14 20% 15
2+ 0 2 13 0 15 21% 9
Residency Living in ET 2 11 55 1 69 97%Living outside ET 0 0 2 0 2 3%

37
Table 4.5c Cadaveric lung transplant Waiting List: characteristics, per country
Lung Waiting List Total TotalDecember 31, 1996 Austria Belgium Germany Netherlands 1996 % 1995
Number 15 21 119 49 204 100% 224
Type of transplant Double 10 13 93 41 157 77%Double /Liver 0 0 1 0 1 –Single left 0 4 5 0 9 4%Single right 1 2 9 8 20 10%Either single 4 2 12 0 18 9%
Age 6–15 1 0 2 0 3 1% 2(years) 16–55 13 17 104 42 176 87% 191
56+ 1 4 13 7 25 12% 31
AB0 A 6 11 54 24 95 47% 104AB 0 0 4 1 5 2% 11B 1 2 14 3 20 10% 210 8 8 47 21 84 41% 88
Sequence First 15 20 113 49 197 97% 217Repeat 0 1 6 0 7 3% 7
Time waiting 0+ 9 17 53 28 107 53% 142(years) 1+ 3 3 33 21 60 29% 50
2+ 3 1 33 0 37 18% 32
Residency Living in ET 15 20 118 49 202 99%Living outside ET 0 1 1 0 2 1%
The transplant candidates on the thoracic organ waiting lists are assigned a medical urgency code, used for the prioritization inthe allocation procedure.
Code HU: High UrgencyEligible are only patients having a heart graft failure within 3 days after the previous transplant.This code does not exist with regard to lung transplant candidates.In case a patient is on the ‘High Urgency’ list, the offer and exchange of a donor heart (and lungs) is mandatory.
Code SU: Special UrgencyEligible are patients, being in a critical medical condition, however not eligible for HU.There is no mandatory offer, but, in case a donor heart, heart/lung and/or lung is made available to the pool of Eurotransplant,these SU patients have priority over the elective transplantable patients.
Code T: TransplantableElective transplantable patients with end-stage heart and/or end-stage lung disease.
Code NT: Not TransplantableThis code is assigned whenever a patient has a temporary contra-indication for transplantation.Temporary is defined as lasting maximum 6 months.
The majority of patients on the lung waiting list (N=157; 77%) was awaiting a double lung transplant. Dualsingle lung allocation is often hampered by absence of suitable patients, because of small single lung waitinglists. Waiting times of one year or more were already noted in 47% of lung transplant candidates.

38
4.3 Inflow on the thoracic waiting list during 1996The number of registrations for a first heart transplant rose again, +10% [Table 4.6a]; this increase wasexclusively on the account of Germany. Belgium is responsible for the decrease in the registration of heart/lung transplant candidates (minus 10) [Table 4.6b]. The number of new lung transplant candidates listed in1996 was similar to the 1995 figure [Table 4.6c]. Listing for a redo thoracic transplant remains low.
4.4 Outflow from the waiting list during 19964.4.1 Thoracic organ transplants from non-living donorsHeart transplants rose 4% on 1995, parallel to a higher donor report in the Eurotransplant area [Table 4.6a].The usage of AB0-0 donor hearts for non-0 recipients amounted to 18%. Sixty percent of the recipients hadtheir transplant within 6 months after listing [Table 4.7a]. Heart transplantation of small infants is done onlyin Germany (N=22).The majority of the recipients of a heart/lung transplant (N=21; 62%) had a waiting time of less than 6 months[Table 4.7b].In comparison with the waiting list ratio between single (23%) and double lung transplants (77%), slightlymore single lung transplants (36%) were done than double lung transplants (64%) [Tables 4.5c and 4.7c].Similar to the heart/lung transplant recipients, the majority of the lung transplant recipients had their lungtransplant within 6 months after listing (N=109; 71%).
With regard to donor heart allocation, local and regional heart transplants were realized in 63%. Organexchange was more frequent with regard to heart/lung, double lung and single lung transplants, 47%, 59% and74% respectively.
Table 4.6a Inflow and Outflow on the cadaveric heart transplant Waiting List in 1996, per country
Total TotalHeart Waiting List Austria Belgium Germany Netherlands 1996 1995
Registrations Total 178 130 941 70 1319 1208First transplant 170 117 923 69 1279 1172Repeat transplant 8 13 18 1 40 36
OutflowTransplantation 104 107 488 60 759 732Mortality on the waiting list 30 17 228 18 293 303De-listing 18 8 169 5 200 168
Table 4.6b Inflow and Outflow on the cadaveric heart/lung transplant Waiting List in 1996, per country
Total TotalHeart/Lung Waiting List Austria Belgium Germany Netherlands 1996 1995
Registrations Total 1 12 57 1 71 81First transplant 1 12 56 1 70 81Repeat transplant 0 0 1 0 1 0
OutflowTransplantation 1 10 22 1 34 42Mortality on the waiting list 0 7 21 0 28 28De-listing 0 2 3 0 5 4
Table 4.6c Inflow and Outflow on the cadaveric lung transplant Waiting List in 1996, per country
Total TotalLung Waiting List Austria Belgium Germany Netherlands 1996 1995
Registrations Total 27 36 118 38 219 226First transplant 26 34 114 37 211 219Repeat transplant 1 2 4 1 8 7
OutflowTransplantation 29 19 86 20 154 125Mortality on the waiting list 15 5 38 13 71 70De-listing 0 0 11 3 14 18

39
4.4.2 Mortality on the waiting listIn 1996, the number of patients dying on the waiting list whilst awaiting their thoracic organ transplant wassimilar to 1995 [Table 4.6]. The mortality ratio, per registration event, on the thoracic waiting list remained,also in 1996, the highest of all organs (>10%).
4.4.3 De-listingTwo hundred patients were removed from the heart transplant waiting list, because of other reasons than deathor transplantation [Table 4.6a]: no longer a suitable transplant candidate, too good for a transplantation, othertherapeutic approach, etc.
Table 4.7a Heart transplants in 1996: characteristics, per country
Austria Belgium Germany Netherlands Total %
Cadaveric Donor Heart Transplants 104 107 488 60 759 100%
Type of transplant HE-only 102 107 481 60 750 99%HE/KI 2 0 7 0 9 1%
Urgency code HU 5 3 3 1 12 2%SU 14 10 82 10 116 15%Transplantable 85 94 403 49 631 83%
Age 0–5 0 0 22 0 22 3%(years) 6–15 3 2 20 1 26 3%
16–55 39 50 245 37 371 49%56+ 62 55 201 22 340 45%
AB0 A 42 58 209 23 332 44%AB 3 3 33 3 42 5%B 18 9 69 8 104 14%0 41 37 177 26 281 37%
Sequence First 92 97 478 58 725 96%Repeat 12 10 10 2 34 4%
Time waiting 0–5m 66 70 286 33 455 61%(months) 6–11m 22 30 88 15 155 20%
12–23m 13 7 99 12 131 17%24m+ 3 0 15 0 18 2%
Residency Living in ET 104 97 485 60 746 98%Living outside ET 0 10 3 0 13 2%
Living Donor Heart Transplants 0 1 0 0 1
Total Heart Transplant Activity 104 108 488 60 760
Table 4.7b Heart/Lung transplants in 1996: characteristics, per country
Austria Belgium Germany Netherlands Total %
Heart/Lung Transplants 1 10 22 1 34 100%
Urgency code SU 0 2 2 0 4 12%Transplantable 1 8 20 1 30 88%
Age 0–15 0 1 3 0 4 12%(years) 16–55 1 9 19 1 30 88%
AB0 A 0 5 12 0 17 50%AB 0 0 2 0 2 6%B 0 1 3 0 4 12%0 1 4 5 1 11 32%
Sequence First 1 10 22 1 34 100%Repeat 0 0 0 0 0 0%
Time waiting 0+ 0 9 22 1 32 94%(years) 1+ 1 1 0 0 2 6%
Residency Living in ET 1 9 21 1 32 94%Living outside ET 0 1 1 0 2 6%
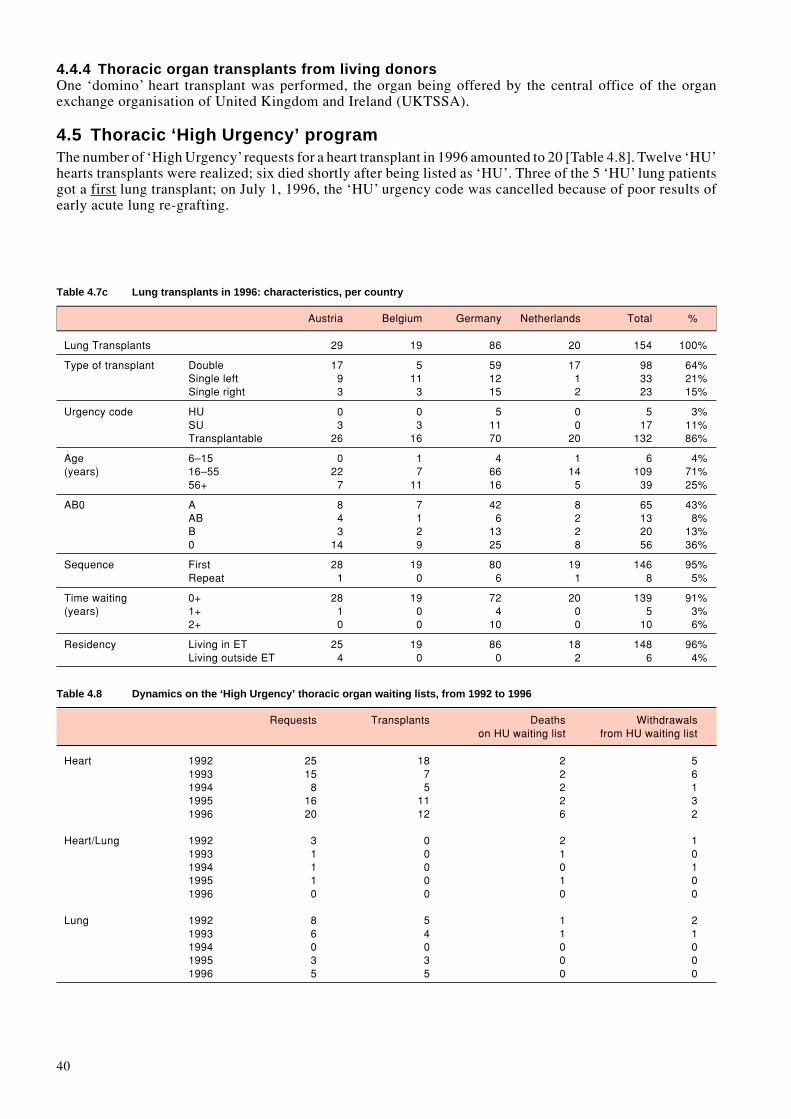
40
4.4.4 Thoracic organ transplants from living donorsOne ‘domino’ heart transplant was performed, the organ being offered by the central office of the organexchange organisation of United Kingdom and Ireland (UKTSSA).
4.5 Thoracic ‘High Urgency’ programThe number of ‘High Urgency’ requests for a heart transplant in 1996 amounted to 20 [Table 4.8]. Twelve ‘HU’hearts transplants were realized; six died shortly after being listed as ‘HU’. Three of the 5 ‘HU’ lung patientsgot a first lung transplant; on July 1, 1996, the ‘HU’ urgency code was cancelled because of poor results ofearly acute lung re-grafting.
Table 4.7c Lung transplants in 1996: characteristics, per country
Austria Belgium Germany Netherlands Total %
Lung Transplants 29 19 86 20 154 100%
Type of transplant Double 17 5 59 17 98 64%Single left 9 11 12 1 33 21%Single right 3 3 15 2 23 15%
Urgency code HU 0 0 5 0 5 3%SU 3 3 11 0 17 11%Transplantable 26 16 70 20 132 86%
Age 6–15 0 1 4 1 6 4%(years) 16–55 22 7 66 14 109 71%
56+ 7 11 16 5 39 25%
AB0 A 8 7 42 8 65 43%AB 4 1 6 2 13 8%B 3 2 13 2 20 13%0 14 9 25 8 56 36%
Sequence First 28 19 80 19 146 95%Repeat 1 0 6 1 8 5%
Time waiting 0+ 28 19 72 20 139 91%(years) 1+ 1 0 4 0 5 3%
2+ 0 0 10 0 10 6%
Residency Living in ET 25 19 86 18 148 96%Living outside ET 4 0 0 2 6 4%
Table 4.8 Dynamics on the ‘High Urgency’ thoracic organ waiting lists, from 1992 to 1996
Requests Transplants Deaths Withdrawalson HU waiting list from HU waiting list
Heart 1992 25 18 2 51993 15 7 2 61994 8 5 2 11995 16 11 2 31996 20 12 6 2
Heart/Lung 1992 3 0 2 11993 1 0 1 01994 1 0 0 11995 1 0 1 01996 0 0 0 0
Lung 1992 8 5 1 21993 6 4 1 11994 0 0 0 01995 3 3 0 01996 5 5 0 0
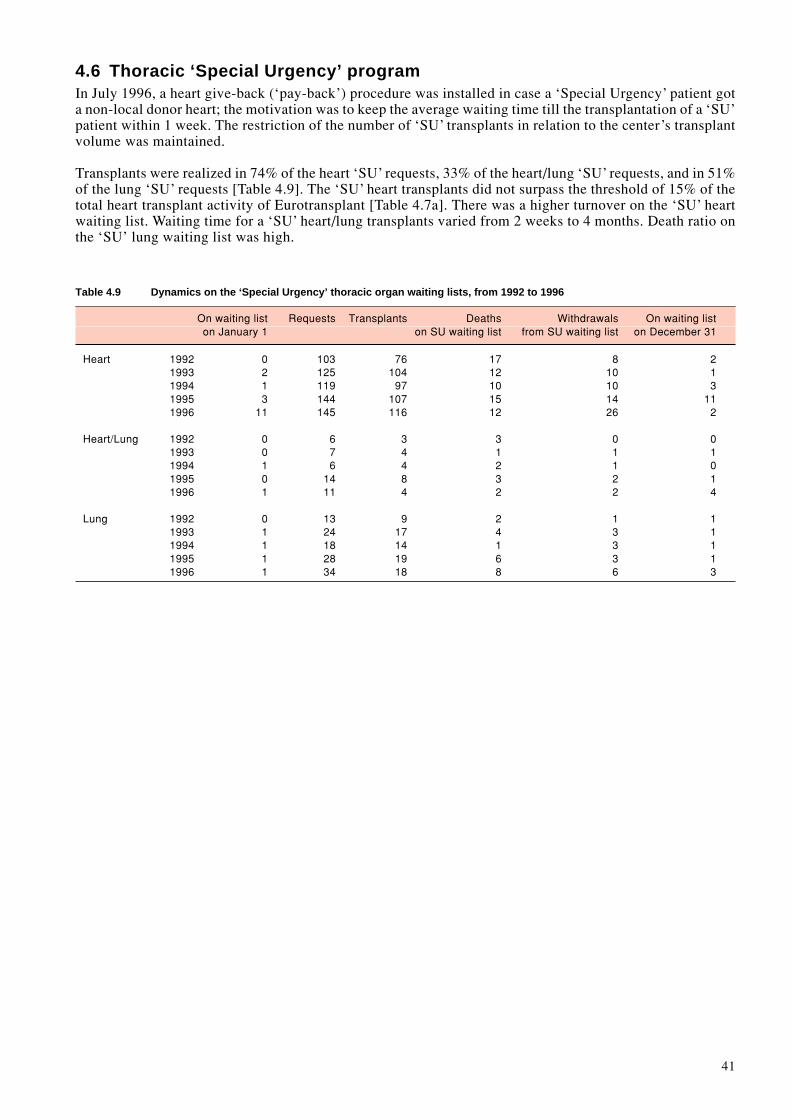
41
4.6 Thoracic ‘Special Urgency’ programIn July 1996, a heart give-back (‘pay-back’) procedure was installed in case a ‘Special Urgency’ patient gota non-local donor heart; the motivation was to keep the average waiting time till the transplantation of a ‘SU’patient within 1 week. The restriction of the number of ‘SU’ transplants in relation to the center’s transplantvolume was maintained.
Transplants were realized in 74% of the heart ‘SU’ requests, 33% of the heart/lung ‘SU’ requests, and in 51%of the lung ‘SU’ requests [Table 4.9]. The ‘SU’ heart transplants did not surpass the threshold of 15% of thetotal heart transplant activity of Eurotransplant [Table 4.7a]. There was a higher turnover on the ‘SU’ heartwaiting list. Waiting time for a ‘SU’ heart/lung transplants varied from 2 weeks to 4 months. Death ratio onthe ‘SU’ lung waiting list was high.
Table 4.9 Dynamics on the ‘Special Urgency’ thoracic organ waiting lists, from 1992 to 1996
On waiting list Requests Transplants Deaths Withdrawals On waiting liston January 1 on SU waiting list from SU waiting list on December 31
Heart 1992 0 103 76 17 8 21993 2 125 104 12 10 11994 1 119 97 10 10 31995 3 144 107 15 14 111996 11 145 116 12 26 2
Heart/Lung 1992 0 6 3 3 0 01993 0 7 4 1 1 11994 1 6 4 2 1 01995 0 14 8 3 2 11996 1 11 4 2 2 4
Lung 1992 0 13 9 2 1 11993 1 24 17 4 3 11994 1 18 14 1 3 11995 1 28 19 6 3 11996 1 34 18 8 6 3

42

43
L5. Liver: donation, waiting lists
and transplantsJ. De Meester, MD, and H. De Winter, MD, Eurotransplant International Foundation, Leiden, The Netherlands
5.1 Liver donorsTable 5.1 gives an overview of the usage and non-usage of the 1223 potential liver donors, from theEurotransplant region, who were reported to the central office of Eurotransplant in 1996. Significantly lessdonor livers were declined upon offer; however, at the time of procurement, the discard was much higher,increasing from 117 donor livers (12%) in 1995 to 192 (17%) in 1996. The total number of Eurotransplantdonors of whom the liver was used in a transplant (N=934) showed a 13% increase on 1995. Thirty-one donorlivers were splitted for a transplant in two different recipients.
The number of elderly liver donors, aged over 55 years (N=104) more than doubled that of the elderly heartdonors (N=38) [Table 5.2]. This illustrates the broader suitability of elderly donor livers for transplantation.The use of liver and heart donors showed a striking difference with respect to the donors who died from anatural cause, 486 and 363 respectively. In general, simultaneous heart and liver donation in 1996 was presentin 65% of the liver donors used and in 78% of the heart donors, comparable to 1995.
Table 5.1 Usage and non-usage of cadaveric donor livers, from the Eurotransplant area, between 1993 and 1996
1993 1994 1995 1996
Total nr. of liver donors reported 1160 1119 1189 1223
No donor liver procurement: 298 217 246 97– no time for selection / offer withdrawn 7 9 3 9– medical reasons 275 185 222 63– no suitable recipient due to donor size 5 2 4 4– no suitable recipient due to donor blood group 1 6 2 2– center out of capacity / recipient unfit 2 2 1 5– transport problems / other organizational reasons 3 2 2 1– cardiovascular instability of donor 5 11 12 13
Donor liver inspection/procurement: 862 902 943 1126
No transplantation 18 75 118 192– organ unsuitable for transplantation 18 74 117 192– no back-up recipient (positive cross-match) 0 1 1 0
Transplantation 844* 827** 825 934– split-liver donors 5 17 14 31– liver donors 839* 810** 811 903
* 1 liver transplanted in 1994** 1 liver transplanted in 1995
Table 5.2 Demographic data on cadaveric liver donors, from the Eurotransplant area and used for a transplant in 1996
Country Total Age (years) Sex AB0 Blood group Cause of death0–15 16–55 ≥56 Male Female A AB B 0 Accident Natural Suicide
Austria 113 9 95 9 71 42 47 6 14 46 46 61 6Belgium 145 20 112 13 90 55 59 3 8 75 74 60 7Germany 535 44 427 64 320 215 207 16 64 248 222 281 32Luxemburg 7 0 7 0 3 4 4 0 2 1 3 4 0Netherlands 134 13 103 18 67 67 53 4 13 64 50 80 4
Total 934 86 744 104 551 383 370 29 101 434 395 486 53100% 9% 80% 11% 59% 41% 40% 3% 11% 46% 42% 52% 6%
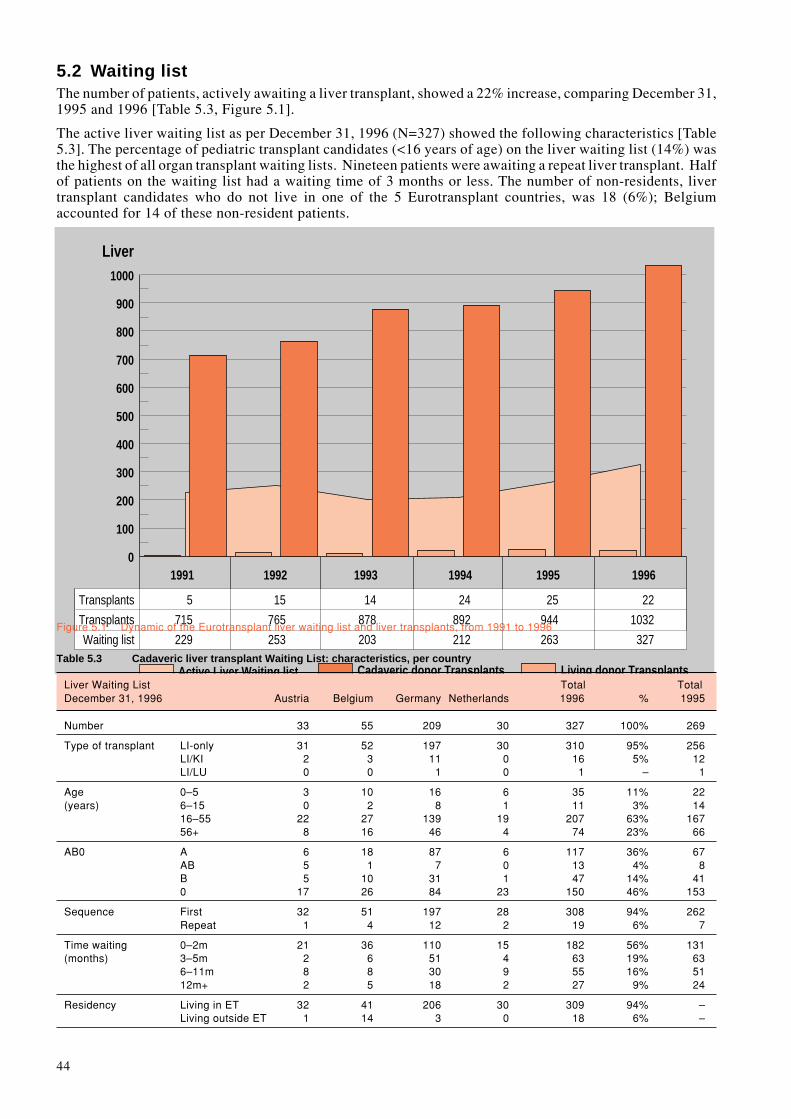
44
Active Liver Waiting list
Liver
0
100
200
300
400
500
600
700
800
900
1000
Cadaveric donor Transplants Living donor Transplants
5
715
229
1991
15
765
253
1992
14
878
203
1993
24
892
212
1994
25
944
263
1995
22
1032
327
1996
Transplants
Transplants
Waiting listTable 5.3 Cadaveric liver transplant Waiting List: characteristics, per country
Liver Waiting List Total TotalDecember 31, 1996 Austria Belgium Germany Netherlands 1996 % 1995
Number 33 55 209 30 327 100% 269
Type of transplant LI-only 31 52 197 30 310 95% 256LI/KI 2 3 11 0 16 5% 12LI/LU 0 0 1 0 1 – 1
Age 0–5 3 10 16 6 35 11% 22(years) 6–15 0 2 8 1 11 3% 14
16–55 22 27 139 19 207 63% 16756+ 8 16 46 4 74 23% 66
AB0 A 6 18 87 6 117 36% 67AB 5 1 7 0 13 4% 8B 5 10 31 1 47 14% 410 17 26 84 23 150 46% 153
Sequence First 32 51 197 28 308 94% 262Repeat 1 4 12 2 19 6% 7
Time waiting 0–2m 21 36 110 15 182 56% 131(months) 3–5m 2 6 51 4 63 19% 63
6–11m 8 8 30 9 55 16% 5112m+ 2 5 18 2 27 9% 24
Residency Living in ET 32 41 206 30 309 94% –Living outside ET 1 14 3 0 18 6% –
Figure 5.1 Dynamic of the Eurotransplant liver waiting list and liver transplants, from 1991 to 1996
5.2 Waiting listThe number of patients, actively awaiting a liver transplant, showed a 22% increase, comparing December 31,1995 and 1996 [Table 5.3, Figure 5.1].
The active liver waiting list as per December 31, 1996 (N=327) showed the following characteristics [Table5.3]. The percentage of pediatric transplant candidates (<16 years of age) on the liver waiting list (14%) wasthe highest of all organ transplant waiting lists. Nineteen patients were awaiting a repeat liver transplant. Halfof patients on the waiting list had a waiting time of 3 months or less. The number of non-residents, livertransplant candidates who do not live in one of the 5 Eurotransplant countries, was 18 (6%); Belgiumaccounted for 14 of these non-resident patients.

45
The liver transplant candidates on the waiting list are assigned a medical urgency code, used for prioritization in the allocationprocedure.
Code HU: High UrgencyEligible are patients with a de novo hepatic failure, ranging from subacute to fulminant onset, patients with a rapidly progressiveWilson’s disease and Budd-Chiari syndrome, patients in need of a repeat transplant due to an irreversible life-threatening graftfailure(*), patients with severe hepatic trauma, and anhepatic patients.Liver tumours are no indication for a HU request.
In case a patient is on the ‘High Urgency’ waiting list, the offering and exchange of a donor liver is mandatory.
Code T: TransplantableElective transplantable patients with end-stage liver disease.
Code NT: Not TransplantableThis code is assigned whenever the patient has a temporary contra-indication for a liver transplant.
(*) Please note that as of July 1, 1997, liver graft failure should occur within 14 days after the previous liver transplant.
Table 5.4 Inflow and Outflow on the cadaveric liver transplant Waiting List in 1996, per country
Total TotalLiver Waiting List Austria Belgium Germany Netherlands 1996 1995
Registrations Total 174 193 921 105 1393 1240First transplant 158 167 780 91 1196 1121Repeat transplant 16 26 141 14 197 119
OutflowTransplantation 132 135 689 76 1032 944Mortality on the waiting list 22 25 137 16 200 167De-listing 16 8 65 22 111 92
5.3 Inflow on the liver waiting list during 1996The number of registrations for a first transplant in 1996 [N=1196] showed a 7% increase on 1995 [N=1121].In contrast to the decrease seen in 1995, registrations for a repeat liver transplant rose by 66%, from 119 to197 [Table 5.4].
5.4 Outflow from the liver waiting list during 19965.4.1 Liver transplants from non-living donorsThe higher number of liver donors in 1996 as well as the successful collaboration of Austrian and German livertransplant programs with centers outside Eurotransplant pushed the number of liver transplants further up:N=1032, +9% on 1995 (N=944). As in 1995, Hamburg, Germany, played a leading role in the realisation ofcadaveric split-liver transplants (45%).
The contribution of split-liver transplants amounted to 6% of the total liver transplant activity [Table 5.5]. Themajority of the pediatric liver transplants was under six years of age. Seventy-five AB0-0 donor livers wereused for the transplantation of non-0 liver patients (16%); nine AB0-incompatible liver transplants were done.Repeat liver transplants comprised 14% of the total number of liver transplants. Even when the ‘HU’ livertransplants are excluded from the calculation of the waiting time till transplantation, still 60% of the recipientsgot a liver transplant within 3 months after listing. The transplantation of non-residents accounted for 9% ofthe liver transplant activity.
5.4.2 Mortality on the waiting listThe number of patients dying on the waiting list in 1996 whilst awaiting their liver transplant amounted to 200[Table 5.4]. The mortality ratio on the liver waiting list, per registration event, however, remained around 10%.
5.4.3 De-listingIn 1996, 111 patients were de-listed, because of other reasons than cadaveric transplantation or death [Table5.4]: poor transplant candidate, living donor liver transplant, recovery of liver function, etc.

46
5.5 Living donor liver transplantsBrussels St.Luc (Belgium) and Hamburg (Germany) continued their program to perform living-(un)relatedsegmental liver transplants. One ‘domino’ liver transplantation was performed; the native liver of a patientwho himself underwent a liver transplant and suffered from a familial amyloid polyneuropathy [FAP], was re-used.
Table 5.5 Liver transplants in 1996: characteristics, per country
Austria Belgium Germany Netherlands Total %
Cadaveric Donor Liver Transplants 132 135 689 76 1032 100%
Type of transplant LI whole 127 123 625 74 949 92%LI split 2 9 53 0 64 6%LI/KI 3 3 10 2 18 2%LI split/KI 0 0 1 0 1 –
Urgency code HU-first 9 15 78 15 117 11%HU-repeat 10 12 55 6 83 8%Transplantable 113 108 556 55 832 81%
Age 0–5 0 21 34 10 65 6%(years) 6–15 6 4 25 7 42 4%
16–55 76 75 451 51 653 63%56+ 50 35 179 8 272 26%
AB0 A 55 58 301 21 435 42%AB 16 0 41 6 63 6%B 19 10 92 9 130 13%0 42 67 255 40 404 39%
Sequence First 118 119 593 66 886 86%Repeat 14 26 96 10 146 14%
Time waiting 0–2m 101 88 510 46 745 72%(months) 3–5m 13 23 103 12 151 15%
6–11m 12 13 59 14 98 9%12m+ 6 11 21 4 42 4%
Residency Living in ET 118 93 659 76 946 91%Living outside ET 14 42 30 0 86 9%
Living Donor Liver Transplants 0 12 10 0 22
Total Liver Transplant Activity 132 147 699 76 1054

47
Table 5.6 Dynamics on the ‘High Urgency’ liver waiting list, from 1992 to 1996
Year HU requests Transplants Deaths Withdrawalson HU waiting list from HU waiting list
1992 190 136 13 411993 235 203 15 171994 221 165 31 251995 198 164* 23 111996 257 201* 25 31
Reason for HU liver transplant
Subacute-Fulminant hepatic failure (first transplant)1992 108 72 9 271993 124 105 11 81994 121 94 12 151995 116 91* 18 71996 146 118* 14 14
Irreversible graft failure (repeat transplant)1992 82 64 4 141993 111 98 4 91994 100 71 19 101995 82 73 5 41996 111 83 11 17
* 1 liver transplant in the next calendar year
5.6 Liver ‘High Urgency’ programIn 1996, the ‘High Urgency’ liver requests comprised 18% of the total number of entries on the waiting list(N=257/1393) [Table 5.6]. There was a higher need for a ‘HU’ repeat liver transplant than in 1995. Mortalityrate varied around 15%. The likelihood of receiving a transplant, while on the HU liver waiting list, attained80%, of which 90% occurred within 24 hours.
‘High Urgency’ liver transplants accounted for 19% of the total number of liver transplants performed in 1996,comparable to the previous calendar years.

48
P

49
P6. Pancreas: donation, waiting
lists and transplantsJ. De Meester, M.D., Eurotransplant International Foundation, Leiden, The Netherlands
6.1 Pancreas donorsIn 1996, 674 pancreas donors were reported to the central office of Eurotransplant. Table 6.1 gives an overviewof the usage and non-usage of the pancreas donors.Over the years, there was no major increase in the number of pancreas offers. Fortunately, today, morepancreata are used in a clinical transplant. Pancreata of 139 donors were used in a whole pancreas transplant,almost all being a pancreas/kidney transplant. From only 18% of the liver donors, aged between 10 and 50years, the pancreas was used as well in a transplant. In addition, pancreas offers were low from large volumeliver transplant programs.Since the majority of the donor pancreata were only made available as a pancreas-only offer, the dispositionwas most often directed to the islet-transplant programs and/or programs involved in pancreas-transplant-oriented research [N=277]. Thirty-three pancreata were, prior to their transplant, processed into pancreaticislets suspensions [N=15 transplants]; islet transplant practices vary from one pancreas per islet transplant tomultiple pancreata per islet transplant.
6.2 Waiting listThe overall number of patients on the waiting list for a pancreas transplant increased by 32% over 1996 [Table6.2]. This was on the account of pancreas/kidney transplantation in all Eurotransplant countries, with theexception of Germany.
Table 6.1 Usage and non-usage of pancreas donors, from the Eurotransplant area, between 1993 and 1996
1993 1994 1995 1996
Total nr. of pancreas donors reported 702 664 667 674
No pancreas donor procurement: 234 175 200 177– no time for selection / offer withdrawn 7 9 3 7– medical reasons 155 121 146 105– no suitable recipient: size or blood group 5 2 1 1– center/bank out of capacity / recipient unfit 47 24 34 47– transport problems/other organizational reasons 16 16 7 13– cardiovascular instability of donor 4 3 9 4
Pancreas donor inspection/procurement: 468 489 467 497
No transplantation 14 52 49 81– organ unsuitable for transplantation/research 12 49 49 80– no back-up recipient (positive cross-match) 2 3 0 1
Whole pancreas transplantation 94 91 99 139
Research & Islet transplantation 360 346 319 277– ß cell project, Brussels 184 181 187 221→ islet transplants (1 transplant : n donors) 0 1 6 3– pancreas islet research, Gießen 163 119 72 32→ islet transplants (1 transplant : 1 donor) 6 5 12 11– local and other pancreas banks 13 46 60 24→ islet transplants Innsbruck 0 0 2 1
Islet transplantation, total 6 6 20 15
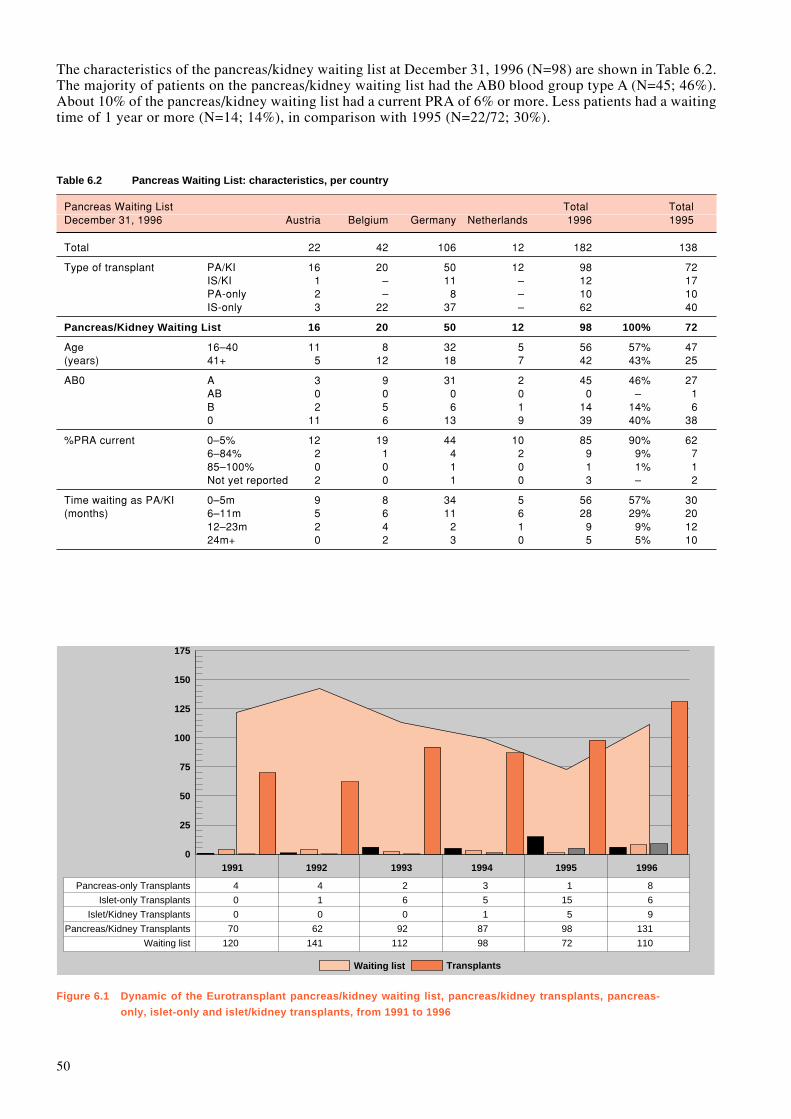
50
Waiting list
Pancreas-only Transplants
Islet-only Transplants
Islet/Kidney Transplants
Pancreas/Kidney Transplants
Waiting list
0
25
50
75
100
125
150
175
Transplants
4
0
0
70
120
1991
4
1
0
62
141
1992
2
6
0
92
112
1993
3
5
1
87
98
1994
1
15
5
98
72
1995
8
6
9
131
110
1996
The characteristics of the pancreas/kidney waiting list at December 31, 1996 (N=98) are shown in Table 6.2.The majority of patients on the pancreas/kidney waiting list had the AB0 blood group type A (N=45; 46%).About 10% of the pancreas/kidney waiting list had a current PRA of 6% or more. Less patients had a waitingtime of 1 year or more (N=14; 14%), in comparison with 1995 (N=22/72; 30%).
Table 6.2 Pancreas Waiting List: characteristics, per country
Pancreas Waiting List Total TotalDecember 31, 1996 Austria Belgium Germany Netherlands 1996 1995
Total 22 42 106 12 182 138
Type of transplant PA/KI 16 20 50 12 98 72IS/KI 1 – 11 – 12 17PA-only 2 – 8 – 10 10IS-only 3 22 37 – 62 40
Pancreas/Kidney Waiting List 16 20 50 12 98 100% 72
Age 16–40 11 8 32 5 56 57% 47(years) 41+ 5 12 18 7 42 43% 25
AB0 A 3 9 31 2 45 46% 27AB 0 0 0 0 0 – 1B 2 5 6 1 14 14% 60 11 6 13 9 39 40% 38
%PRA current 0–5% 12 19 44 10 85 90% 626–84% 2 1 4 2 9 9% 785–100% 0 0 1 0 1 1% 1Not yet reported 2 0 1 0 3 – 2
Time waiting as PA/KI 0–5m 9 8 34 5 56 57% 30(months) 6–11m 5 6 11 6 28 29% 20
12–23m 2 4 2 1 9 9% 1224m+ 0 2 3 0 5 5% 10
Figure 6.1 Dynamic of the Eurotransplant pancreas/kidney waiting list, pancreas/kidney transplants, pancreas-
only, islet-only and islet/kidney transplants, from 1991 to 1996

51
6.3 Inflow on the pancreas waiting list during 1996All Eurotransplant countries listed more diabetic patients for a pancreas(/kidney) transplantation, from 124in 1995 to 186 in 1996 (+31%) [Table 6.3]. The ß-cell Transplant Project of Brussels-Jette initiated a Europeanislet-transplant waiting list, for the time being restricted to their collaborating programs.
6.4 Outflow from the waiting list during 19966.4.1 Pancreas transplants from non-living donorsFollowing a plateau phase after the major boost in 1993, pancreas/kidney transplantation displayed in 1996again a significant increase, +34%, from 98 to 131 [Figure 6.1]. Pancreas-only, islet/kidney and islet-onlytransplants comprised about 15% of the total pancreas transplant activity [Table 6.4].
Transplant activities and pancreas exchange, per country and per center, are shown in detail in the Addenda.
Table 6.3 Inflow and Outflow on the cadaveric pancreas transplant Waiting List in 1996, per country
Total TotalPancreas Waiting List Austria Belgium Germany Netherlands 1996 1995
Registrations Total 24 45 129 21 219 157
Pancreas 21 23 121 21 186 124First pancreas transplant 19 23 111 21 174 113Repeat pancreas transplant 2 0 10 0 12 11
IsletFirst islet transplant 3 22 8 0 33 33
OutflowTransplantation 8 16 113 17 154 119Mortality on the waiting list 0 0 0 0 0 0De-listing 3 2 3 0 8 15
Table 6.4 Pancreas transplants from non-living donors in 1996: characteristics, per country
Pancreas Transplants Austria Belgium Germany Netherlands Total
Total Pancreas Transplant Activity 8 16 113 17 154
Type of transplantPA/KI 6 13 95 17 131IS/KI 1 – 8 – 9PA-only 1 – 7 – 8IS-only – 3 3 – 6
Pancreas/Kidney transplants 6 13 95 17 131 100%
HLA-A,B,DR mismatch 0 0 1 0 0 1 1%1 0 2 2 0 4 3%2 0 2 7 2 11 8%3 1 6 16 7 30 23%4 2 2 32 5 41 32%5 2 0 29 2 33 25%6 1 0 9 1 11 8%
Age (years) 16–40 4 7 64 12 87 66%41+ 2 6 31 5 44 34%
AB0 A 2 6 34 7 49 37%AB 0 0 3 0 3 2%B 1 0 11 1 13 10%0 3 7 47 9 66 51%
%PRA prior to transplant 0–5% 4 12 92 15 123 94%6–84% 2 1 3 2 8 6%
Time waiting as PA/KI 0-5m 5 10 77 14 106 81%(months) 6-11m 1 1 13 1 16 13%
12m+ 0 2 5 2 9 6%
52
HTable 6.4 shows the characteristics of the pancreas/kidney transplants (N=131). The Belgian pancreas/kidneytransplant programs adhere to a limited number of HLA-antigen mismatches; none of the transplants had twoHLA-DR mismatches. In 11% (N=8/74), AB0 blood group type 0 donors were used for pancreas/kidneytransplants in recipients with non-0 blood groups (1995: N=9/98). For the majority of the recipients, thewaiting time till transplant was less than 6 months: N=106, 81%.
6.4.2 Mortality on the waiting listNone of patients, awaiting a pancreas/kidney transplant, died on the waiting list in 1995 and in 1996.
53
H7. Histocompatibility TestingI.I.N. Doxiadis, G.M.Th. Schreuder, and F.H.J. Claas, Eurotransplant Reference Laboratory, Department ofImmunohematology and Blood Bank, Leiden University Medical Center, Leiden, The Netherlands
IntroductionImprovement of the quality of tissue typing, screening and crossmatching is the ongoing task of theEurotransplant Reference Laboratory (ETRL). This task is addressed by organizing quality control exercisesfor the Tissue Typing Centers (TTC) participating in Eurotransplant, initiating studies, and discussing possiblenew recommendations within the Tissue Typing Advisory Committee (TTAC).
7.1 Eurotransplant Proficiency TestingThe quality control schemes applied through 1996 for the determination of the individual performance of theTissue Typing Centers in the frame of Eurotransplant are reported.
7.1.1 Quality control exercise on HLA typingIn 1996, this exercise consisted of a send out of 16 peripheral blood samples. Every TTC received 8 samplesand had to report the results within one month after shipment. The vast majority of the laboratories reportedthe results in time. The introduction of the 75% consensus rule, as requested by the European Federation ofImmunogenetics (EFI), facilitated the acceptance of possible discrepancies. The results for the HLA-A,B andHLA-DR typings are summarized in Table 7.1.
Table 7.1: Quality control exercise on HLA typing
Total N %typings discrepant discrepant
HLA-A,B 354 16 4.5HLA-DR 361 3 0.8
A consensus for HLA-A,B,DR typing was always reached with one exception. In contrast to previous years,for the first time the discrepancy rate for HLA-A,B was higher than the one for HLA-DR. This result can beexplained by the routine use of molecular techniques for HLA-DR typing. We may expect equal results forHLA-A,B typing when similar techniques are routinely used by the TTC.
7.1.2 Quality control exercise on HLA-DR typing by DNATwo exercises (DNA#07 and DNA#08) with 10 samples each were sent to the participants (N = 47). DNA wasisolated from either spleen material from organ donors, peripheral blood from healthy blood donors, or celllines. Some rare alleles and rare haplotypes were included. Only one laboratory is not yet performing DNAtyping and therefore did not submit any results. The overall discrepancy rate for HLA-DR “broad” specificitieswas less than 0.25%. Two typical problems, presented in Table 7.2, were observed.
Table 7.2: Quality control exercise on HLA-DR typing by DNA: problem cases
Sample Typing ResultsHLA-DRB1 Correct Discrepant Other alleles
DNA#0801 *1415, 1502 39 81 DRB1*08 (N= 8)DNA#0802 *0401, 1327 3 411 DRB1*1301 (N=29)
DRB1*03 (N= 9)DRB1*13/03 (N= 3)
The allele HLA-DRB1*1327 is identical to DRB1*1301 with a mutation in codon 26 mimicking a DRB1*03.
1 = discrepancy based on the DRB1 allele level
In summary, the results of DNA typing are adequate and comparable to the last years results. It is noticeablethat almost all TTC succeeded in implementing this new typing technique in a short time and use it routinelywith good results.
54
7.1.3 Quality control exercise on crossmatchingAs in the past, TTC participating in this quality control exercise had to perform a crossmatch using the cellsof the send out and four different Eurotransplant patient sera selected by the ETRL. The TTC used the localcrossmatch techniques simulating the situation during duty. In total 24 sera had to be crossmatched per TTC.
In summary the obtained results were as follows:– HLA specific antibodies of the IgG type were in the vast majority of the cases correctly defined.– Non donor specific HLA antibodies did not cause problems in the crossmatch.– Allo- or autoantibodies of the IgM type still caused problems, as well as weak HLA specific antibodies.– Dithiothreitol (DTT) was used by almost all laboratories, with adequate results.
7.1.4 Quality control exercise on screeningFor the quality control exercise on screening the participating laboratories received in regular intervals serumsamples from the ETRL and were asked to test them in their usual screening procedures. In total 16 sera werescreened per TTC. The panel size used by the participants ranged between 30 and 100 HLA typed cells. Theresults revealed a high concordance in the case of IgG HLA class I specific antibodies, while HLA antibodiesof the IgM type were several times defined as being negative (possible loss of activity during shipment). Allbut one TTC reported the specificity of the sera.In summary, the tissue typing laboratories in Eurotransplant are able to define correctly the specificity of HLAantibodies, when these are of the IgG type and reacting towards HLA-A,B,C antigens. HLA specific antibodiesof the IgM type, auto-antibodies and antibodies towards HLA-DR,DQ still cause some problems.
7.1.5 Proficiency testing on donor retypingFor the last time the retyping of almost all donors has been done at the ETRL, since the Board of Eurotransplantdecided in 1996 to discontinue this activity. For this last period 1995 – 1996, 1568 spleen samples arrived atthe ETRL. The retyping for HLA-A,B,DR was done using serology and occasionally by DNA. The HLA-DRtyping was additionally performed by molecular means (PCR-SSO). The results are depicted in Table 7.3. Forthe first time the HLA-DR discrepancy rate is lower than the one for HLA-A,B. We may assume that theintroduction of DNA based techniques during the duty hours helped to reduce the discrepancy rate.
Table 7.3: Donor Retyping in the period 1995 – 1996.
N discrepant % discrepancy
Typing for HLA-A,B 48+3* 3.3Typing for HLA-DR 37+3* 2.6Typing for HLA-A,B,DR 88 5.6
* = 3 donors with discrepant typings for HLA-A,B and HLA-DR
For the fourth consecutive year the results of the proficiency testing on donor retyping showed more than 90%concordance for HLA-A,B,DR typing (Table 7.4). The number of laboratories with a 100% concordanceincreased by two and only one TTC was below the 85% threshold [concordance 80%]. The overall quality ofdonor typing within Eurotransplant seems to have stabilized.
Table 7.4: HLA-A,B,DR concordance rate in Eurotransplant
Year Concordance 100% <85%average Range N TTC N TTC
1988 89 73–100 5 91989 89 70–100 4 51990 84 69–100 4 91991 90 67–100 3 61992 91 79–100 6 51993 94 60–100 13 41994 93 81–100 12 31995 94 80–100 14 1
N concerns only TTC with ≥10 retypings done by ETRL.
In conclusion the overall incidence of discrepancies in HLA typing for the TTC in Eurotransplant is about 4%.Some of these discrepancies are presumably due to administrative errors.

55
7.2 Eurotransplant serum setsSerum sets for HLA-A,B,C and HLA-DR,DQ are regularly compiled by the ETRL. This effort is realizedthrough the cooperation of many HLA laboratories within and outside Eurotransplant. The aim of thedistribution of the sets remains the same as formulated before: to realize uniform HLA-A,B,C and HLA-DR,DQ typing of organ donors and potential organ recipients and their family members.
In 1995, set # 19 was prepared for HLA-DR,DQ. The set consisted of 44 sera including positive and negativecontrol. The set allows unambiguous typing for DR1, DR2 (DR15, DR16), DR3, DR4, DR5 (DR11, DR12),DR6 (DR13, DR14), DR7, DR8, DR9, DR10. Typing for DR8 is still difficult but possible.The set # 18 for HLA-A,B,C typing was introduced in 1994, and used through 1996. This set consisted of 120sera including a negative control. All HLA specificities occurring normally in the caucasoid population canbe typed with this set. The problematic areas appeared to be the splits of HLA-A10 (A34 and A66), the splitsof HLA-A19 (especially the discrimination between A30 and A31) and weak reactions with anti-HLA-B14 andanti-HLA-B21 sera.In order to evaluate the performance of the sera in the serum sets as many as possible typing results (serumscores and interpretation) should be submitted by the affiliated laboratories to ET/ETRL. In addition, thesedata help to minimize clerical errors in the typing.Typing laboratories inside and outside Eurotransplant are kindly requested to submit sera to be included in thesets. The ETRL can offer local sera in return to help to complete the local sets.
7.3 Other activitiesThe annual tissue typers meeting was held on September 26, 1996. Besides the presentation of the results ofthe different quality control exercises, the results of the DTT study were discussed. The latest recommenda-tions of the Board of Eurotransplant were presented as well.
7.3.1 Third extramural meetingThe third extramural meeting was held on February 16, 1996, in Frankfurt, Germany. More than 50 membersof Eurotransplant affiliated laboratories participated. This meeting is intended to act as a forum for ideas andproblems occurring in the daily work leaving sufficient time for further discussions and short comments.Several aspects of screening and crossmatching were discussed. The presentation of so-called difficult patientsand possible solutions made this meeting valuable.
7.3.2 Acceptable mismatch programThe waiting list for the acceptable mismatch program, which was developed to increase the potential donorpool for highly sensitized patients, consisted of 103 patients at the end of 1996. Until now 233 patients weretransplanted with an HLA-DR matched cross-match negative donor via this program.
7.3.3 Recipient retyping studyIn cooperation with the German Society for Immunogenetics (DGI), the ETRL will perform a study onrecipient retyping in 1997.
7.3.4 Site visitsMembers of the ETRL visited four tissue typing laboratories affiliated to Eurotransplant because of actualproblems in typing and/or screening. One visit was paid to a new laboratory. These visits helped in all instancesto solve the respective problems and to improve the quality of the laboratories and their communication to theETRL.
7.3.5 Tissue Typing Advisory CommitteeThe cooperation between the ETRL and the TTAC is very fruitful opening new ways in discussion anddefinition of new rules within Eurotransplant. All centers can and should have input of ideas. The TTCs receiveboth the agenda and a summary of the minutes of the TTAC.
7.4 Future perspectivesThe donor retyping program of selected samples started in September 1996. The ETRL has still to receivecontinuously donor EDTA blood samples from the TTCs within Eurotransplant.
One of the major challenges for 1997 will be the organization of the Highly Immunized Tray (HIT) program,initially done by Prof. Dr. G. Opelz, Heidelberg, Germany.

56
PThe results of the quality control exercises in screening and crossmatching are still not adequate. Therefore,the ETRL will concentrate on these two aspects of serological testing. Education, wet bench teaching in theETRL, teaching course(s), as well as site visits, may help to overcome this problem. In addition, efforts willbe made to maintain the high level of tissue typing in the future.
57
P8. PublicationsG.G. Persijn, M.D., Ph.D., Eurotransplant International Foundation, Leiden, The Netherlands
IntroductionThe collection of data regarding organ donors and recipients which is part of the daily routine at the centraloffice of Eurotransplant in Leiden leads to a unique database. Most of these epidemiological data are laid downin the Eurotransplant annual reports. However, this database is also used for scientific and statistical analysesby the staff and collaborators of Eurotransplant and the Eurotransplant Reference Laboratory as well as bysome Eurotransplant transplant centers. The results of these efforts are reflected by presentations, abstractsubmissions and publications. It was felt that an overview of all abstracts and publications would serve theEurotransplant community and might stimulate the centers to initiate and/or participate in joint studies oranalyses. The Eurotransplant data belong to the providers of the data, i.e. the transplant centers; the centraloffice in Leiden is the custodian of all collected data and welcomes any data requests.This overview may therefore be seen as an acknowledgement and tribute to all the contributors in the field fromwhich we all are so dependent.
8.1 Publications (in alphabetical order)
Claas FHJ, Giphart MJ, Schreuder GMTh:HistocompatibiliteitMEDISCHE IMMUNOLOGIE 1996 pp. 107-125Eds. R. Benner, JJM van Dongen, W van Ewijk en JJ HaaijmanPubl. Bunge, Utrecht
Claas FHJ:Das HLA systemBLUT, VON DER MAGIE ZUR WISSENSCHAFT 1996 pp. 59-62Eds. PFW Strengers, WG van Aken u.a.Publ. Spektrum Akademische Verlag Heidelberg, Berlin
Cohen B:Einige aktuelle Überlegungen zur Organallokation.ZUR GERECHTIGKEIT DER ORGANVERTEILUNG 1996 pp. 7-13Eds. R. Lachmann, N. MeuterPubl. Gustav Fisher Verlag, Stuttgart
Cohen B, D’Amaro J:Contemporary ethical considerations related to organ transplantationTRANSPLANTATION PROCEEDINGS 1996 (28): 144-145
Doxiadis IIN, Claas FHJ:Proposal for an International Registry and Depository of hyperacute rejection after kidney transplan-tation.ASHI QUARTERLY, summer 1996, (20): 3-6
Doxiadis IIN, Smits JMA, Schreuder GMTh, Persijn GG, van Houwelingen HC, van Rood JJ, Claas FHJ:Association between specific HLA combinations and probability of kidney allograft loss: the tabooconcept.THE LANCET 1996 (348): 850-853
Doxiadis IIN, Smits JMA, Stobbe I, Schreuder GMTh, Persijn GG, van Houwelingen H, van Rood JJ, ClaasFHJ:Taboo HLA mismatches in cadaveric renal transplantation: definition, analysis and possible implica-tions.TRANSPLANTATION PROCEEDINGS 1996 (28): 224

58
De Jong IJ, Reinders ME, Kranenburg J, De Meester JMJ, Persijn GG:Multi-organ donation in the Netherlands: Limited by consent and policy.TRANSPLANT INTERNATIONAL 1996 (9): 430-432
De Meester JMJ:Eurotransplant allocation procedures: The basics, March 1996.ZUR GERECHTIGKEIT DER ORGANVERTEILUNG 1996 pp. 167-177Eds. R. Lachmann, N. Meuter,Publ. Gustav Fischer Verlag, Stuttgart
Persijn GG:Organspende und Transplantation bei Eurotransplant: Aktuelle Entwicklungen bis 1995.ORGANSPENDE: ORGANISATION, KOOPERATION UND VERTEILUNG 1996 pp. 12-22Eds. J. Hauss, S. VogtPubl. Pabst Science Publishers, Lengerich
Persijn GG, De Meester JMJ, Smits JMA:Kidney transplantation from living donors in Eurotransplant.TRANSPLANTATION PROCEEDINGS 1996 (28): 3562-3565
Persijn GG, De Meester JMJ, Smits JMA, Doxiadis IIN:Einfluß der Histokompatibilität auf die langfristige Transplantatüberlebens-zeit in Eurotransplant.ZEITSCHRIFT FüR TRANSPLANTATIONS MEDIZIN 1996 (8): 69-72
Roels L, De Meester JMJ:The relative impact of a presumed consent legislation on thoracic organ donation in the Eurotransplantarea.JOURNAL OF TRANSPLANT COORDINATION 1996 (6): 174-177
Van Rood JJ, Claas FHJ:Impact of histocompatibility testing, or the Yin-Yang of transplantation.TRANSPLANTATION BIOLOGY: CELLULAR AND MOLECULAR ASPECTS 1996 pp. 341-354Eds. NL Tilney, TB Strom and LC PaulPubl. Lippincott-Raven Publishers, Philadelphia
Smits JMA:HLA compatibility in renal transplantation.EUROTRANSPLANT NEWSLETTER 1996 (132): 13-14
Smits JMA, De Meester JMJ, Persijn GG, Claas FHJ, van Houwelingen HC:The outcome of kidney grafts from multiorgan donors and kidney only donors.TRANSPLANTATION 1996 (62): 767-771
Smits JMA, Persijn GG, De Meester JMJ:Living unrelated renal transplantation: the new alternative.TRANSPLANT INTERNATIONAL 1996 (9): 252
Vanrenterghem Y, Persijn GG:The implementation of the new Eurotransplant Kidney Allocation System.ETCO Newsletter 1996 (14): 28-29EUROTRANSPLANT NEWSLETTER 1996 (131): 4-7
Verduyn W, Anholts JDH, Versluis LF, Parlevliet J, Drabbels J, De Meester JMJ, Tilanus MGJ, Doxiadis IIN,Giphart MJ, Schreuder GMT:Six newly identified HLA-DRB alleles: DRB1*1121, *1419, *1420, *1421, DRB3*0203 and DRB5*0105.TISSUE ANTIGENS 1996 (48): 80-86
Wight C, Cohen B:Shortage of organs for transplantation.BRITISH MEDICAL JOURNAL 1996 (312): 989-990
59
Wight C, Cohen B:A shortage of supply.ADVANCES IN TRANSPLANTATION 1996 (4)(suppl. to Hospital update, Transplant Special)
Wight C, Jager K, Blok G, van Dalen J, Cohen B:Overview of the European Donor Hospital Education Programme.TRANSPLANTATION PROCEEDINGS 1996 (28): 422-423
Zantvoort FA, D’Amaro J, Persijn GG, Cohen B, Schreuder GMTh, van Rood JJ, Thorogood J:The impact of HLA-A matching on long-term survival of renal allograftsTRANSPLANTATION 1996 (61): 841-844
8.2 Abstracts (in alphabetical order of the first author)
De Boer J, Slooff M, Erhard J, de Hemptinne B, Margreiter R, Metselaar H, Neuhaus P, Otto JB, Ringe B, DeMeester J, De Winter H, Persijn GG, on behalf of the Eurotransplant liver transplant programs:Eurotransplant allocation program for High Urgency (HU) liver transplantation.XVI International Congress of the Transplantation Society Barcelona, 1996
Doxiadis IIN, Claas FHJ:Proposal for an International Registry and Depository of hyperacute rejection after kidney transplan-tation.TRANSPLANTATION PROCEEDINGS 1996 (28): 225
Doxiadis IIN, de Lange P, D’Amaro J, De Meester JMJ, Schreuder GMTh, Claas FHJ:Differential effects of repeated HLA mismatches in renal transplantation: HLA class II mismatches aredetrimental HLA class I are not.HUMAN IMMUNOLOGY 1996 (49) sup. 1: 7
Doxiadis IIN, Schreuder GMTh, Claas FHJ:Three years experience with proficiency testing of HLA-DR typing using molecular methods: Bye byeserology?HUMAN IMMUNOLOGY 1996 (49) sup. 1: 125
De Meester JMJ, Smits JMA, Persijn GG, Vanrenterghem Y:Interactive effects of preservation solutions and cold ischemia time on kidney graft outcome.NEPHROLOGY DIALYSIS TRANSPLANTATION 1996 (11): 295
Persijn GG:Immunologic evaluation of kidney patients prior to transplantation.Ist SLOVENE CONGRESS OF NEPHROLOGY WITH INTERNATIONAL PARTICIPATION 1996 pp. 129-130
Stobbe I, Doxiadis IIN, Smits JMA, van Rood JJ, Claas FHJ:Why are some HLA mismatches taboo?HUMAN IMMUNOLOGY 1996 (47) :163
De Winter H, De Boer J, De Meester J, Persijn GG, Aerts R, Gelin M, Otte JB, de Hemptinne B:Epidemiology of liver transplants (txp) in Belgium during a 12-month period.ACTA GASTROENTEROLOGICA BELGICA 1996: C17

60
61
AAddendum

62

63
Table 1 Number of patients actively on the waiting list on December 31, 1996, stratified by organ, per country and center
Country Center Kidney Kidney/ Pancreas* Heart Heart/ Lung LiverPancreas* Lung
Austria GA 110 – – 24 – – 2IB 257 14 5 12 1 4 18OE 75 – – – – – –OL 51 – – – – – –OW – – – – – – –WD 5 – – – – – –WG 324 3 – 109 1 11 13
TOTAL 822 17 5 145 2 15 33
Belgium AN 29 2 – 2 – – –AS – – – 5 – – –BJ 16 – 22 – – – –BR 369 5 – 8 8 14 4GE 54 2 – 4 – – 9LA 247 3 – 5 – 3 31LE 3 – – – – – –LG 57 2 – 5 – 1 8LM 221 6 – 8 3 3 3
TOTAL 996 20 22 37 11 21 55
Germany AK 73 – – 6 – – –BA – – – 159 7 2 –BB 172 18 3 3 1 – –BD – – – 83 17 9 –BE 327 – – – – – –BH – – – 4 – – –BK – – – 1 – – –BM 181 – – – – – –BO 77 – – – – – 12BS 124 – – 1 – – –BV 99 1 – – – – 22DR 36 – – 11 3 2 –DU 339 – – 6 – – –EB 370 – – – – – –ES 320 – – 6 2 2 9FD – – – 23 – 2 –FM 269 – – 9 – 1 4FR 274 4 – 4 – – 3GI 142 11 37 13 – – –GO 113 – – 9 – – 9HA 108 – – 10 – 1 –HB 275 – – 30 – 3 6HG 180 – – – – – 15HM 247 – – – – – –HO 822 2 – 20 23 56 74HS 81 – – 6 – 15 –JE 118 – – – – – 5KI 100 – – 17 – 16 4KK 4 – – – – – –KL 110 1 – 2 – – 1KM 220 – – – – – 2KR – – – 4 – – –KS 114 – – 1 – – –LP 48 – – 7 – – 6LU 274 – – – – – –MA 89 – – – – – –MB – – – – – – 4MD – – – 18 – – –MH 167 – – – – – –ML 665 11 3 49 3 6 8MN 257 – – 26 1 3 2MR 109 1 – – – – –MZ 79 – – 5 – 1 –NB 254 – – – – – 3RB 62 2 – – – – 2RO 96 4 2 – – – 1ST 165 – – – – – –TU 120 2 – – – – 17UL 211 4 – – – – –WZ 160 – – 3 – – 1
TOTAL 8051 61 45 536 57 119 209
Luxemburg LX 16 0 0 0 0 0 0
Netherlands AW 130 – – – – – –GR 231 4 – – 1 49 20LB 143 6 – – – – 4MS 86 2 – – – – –NY 128 – – – – – –RD 168 – – 19 – – 6RS 10 – – – – – –UT 93 – – 7 – – –UW 4 – – – – – –
TOTAL 993 12 0 26 1 49 30
Eurotransplant TOTAL 10878 110 72 744 71 204 327
*Note: islet/kidney and/or islet-only transplant candidates are listed at IB, Austria (1 islet/kidney, 3 islet-only), in BJ, Belgium (22 islet-only) and in GI, Germany (11 islet/kidney, 37 islet-only).

64
Table 2a Cadaveric donor activities in 1996, stratified by type of donation, per country and center
Donor country Donor center Total number of donors reportedTotal No transplant Transplant
TOTAL KIDNEY DONOR NO-KIDNEYDONOR
KI only MOD % MOD
Austria GA 25 1 24 2 19 90.5 3IB 56 4 52 14 38 73.1 0OE 5 0 5 4 1 20.0 0OL 8 1 7 0 7 100.0 0OW 3 0 3 0 3 100.0 0WG/WD 97 4 93 32 58 64.4 3
TOTAL 194 10 184 52 126 70.8 6
Belgium AN 21 0 21 12 8 42.9 0AS 3 0 3 0 3 100.0 0BJ 11 1 10 3 6 66.6 1BR 33 3 30 7 18 72.0 5GE 41 3 38 2 35 94.6 1LA 47 2 45 14 31 68.9 0LG 28 3 25 1 22 95.6 1LM/LE 40 0 40 6 34 85.0 0
TOTAL 224 12 212 45 158 77.8 9
Germany AK 12 0 12 4 8 66.7 0BB 14 2 12 4 8 66.7 0BE 14 1 13 5 8 61.5 0BM 19 1 18 7 11 61.1 0BO 23 0 23 1 22 95.4 1BV 13 1 12 3 9 75.0 0DR 11 0 11 2 8 80.0 1DU 45 2 43 18 24 57.1 1EB/BS 46 2 44 8 33 80.5 3ES 43 1 42 11 31 73.8 0FD 6 0 6 2 3 60.0 1FM 19 1 18 4 14 77.8 0FR 25 1 24 13 11 45.8 0GI 15 0 15 7 8 53.3 0GO 19 0 19 7 12 63.2 0HA/MB 27 2 25 4 21 84.0 0HB 19 0 19 5 12 70.6 2HG 35 2 33 10 23 69.7 0HO/HM 94 1 93 44 48 52.2 1HS 14 0 14 8 6 42.9 0JE 37 2 35 6 26 81.2 3KI 13 0 13 0 13 100.0 0KL 20 1 19 6 13 68.4 0KM 25 1 24 11 12 52.2 1KS 9 2 7 3 3 50.0 1LP 30 3 27 6 21 77.8 0LU 32 1 31 15 16 51.6 0MA 14 0 14 7 7 50.0 0ML/MH/AU 89 2 87 31 54 63.5 2MN 41 2 39 20 19 48.7 0MR 10 0 10 5 5 50.0 0MZ 9 0 9 1 8 88.9 0NB 51 3 48 19 28 59.6 1RB 12 1 11 1 10 90.9 0RO 39 1 38 11 25 69.4 2ST 11 1 10 6 4 40.0 0TU 22 0 22 11 11 50.0 0UL 30 1 29 13 15 53.6 1WB 14 0 14 8 6 42.9 0WZ 30 1 29 10 19 65.5 0
TOTAL 1051 39 1012 357 634 63.9 21
Luxemburg LX 13 0 13 2 11 84.6 0
Netherlands AW 35 4 31 11 19 63.3 1GR 37 1 36 5 30 85.7 1LB 20 1 19 7 12 63.2 0MS 40 4 36 21 15 41.7 0NY 55 3 52 15 36 70.6 1RD/RS 34 1 33 12 20 62.5 1UT/UW 20 1 19 8 11 57.9 0
TOTAL 241 15 226 79 143 64.4 4
Eurotransplant, Total 1723 76 1647 535 1072 66.7 40
Czech Republic# 37 9 28 2 0 26Denmark 1 0 1 0 0 1France 24 18 6 1 0 5Greece 4 3 1 0 0 1Hungary# 14 2 12 0 1 11Israel 4 2 2 0 0 2Italy 18 15 3 0 0 3Norway 10 4 6 0 0 6Poland# 4 0 4 0 0 4Slovak Republic# 13 3 10 0 0 10Spain 52 40 12 4 0 8Sweden 9 5 4 1 0 3Switzerland 16 12 4 1 0 3United Kingdom/Ireland 18 11 7 0 0 7
From outside Eurotransplant, Total 224 124 100 9 1 90
# : organ-specific cooperation with Eurotransplant transplant programs
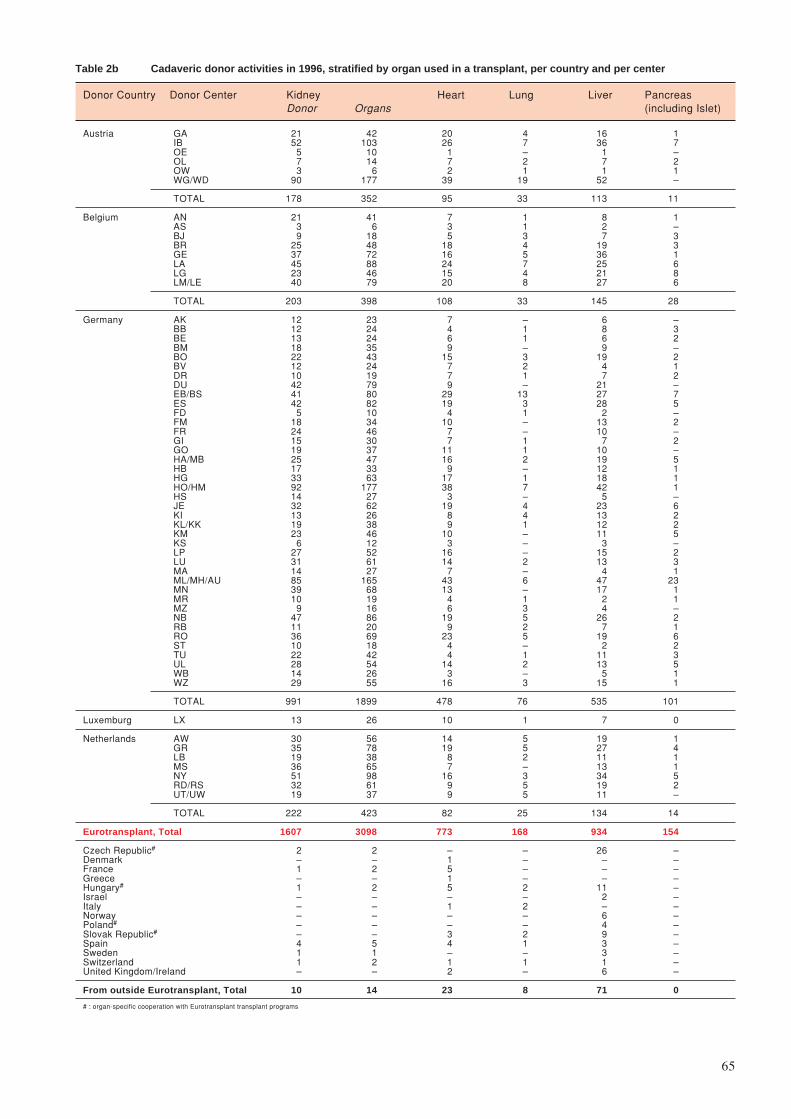
65
Table 2b Cadaveric donor activities in 1996, stratified by organ used in a transplant, per country and per center
Donor Country Donor Center Kidney Heart Lung Liver PancreasDonor Organs (including Islet)
Austria GA 21 42 20 4 16 1IB 52 103 26 7 36 7OE 5 10 1 – 1 –OL 7 14 7 2 7 2OW 3 6 2 1 1 1WG/WD 90 177 39 19 52 –
TOTAL 178 352 95 33 113 11
Belgium AN 21 41 7 1 8 1AS 3 6 3 1 2 –BJ 9 18 5 3 7 3BR 25 48 18 4 19 3GE 37 72 16 5 36 1LA 45 88 24 7 25 6LG 23 46 15 4 21 8LM/LE 40 79 20 8 27 6
TOTAL 203 398 108 33 145 28
Germany AK 12 23 7 – 6 –BB 12 24 4 1 8 3BE 13 24 6 1 6 2BM 18 35 9 – 9 –BO 22 43 15 3 19 2BV 12 24 7 2 4 1DR 10 19 7 1 7 2DU 42 79 9 – 21 –EB/BS 41 80 29 13 27 7ES 42 82 19 3 28 5FD 5 10 4 1 2 –FM 18 34 10 – 13 2FR 24 46 7 – 10 –GI 15 30 7 1 7 2GO 19 37 11 1 10 –HA/MB 25 47 16 2 19 5HB 17 33 9 – 12 1HG 33 63 17 1 18 1HO/HM 92 177 38 7 42 1HS 14 27 3 – 5 –JE 32 62 19 4 23 6KI 13 26 8 4 13 2KL/KK 19 38 9 1 12 2KM 23 46 10 – 11 5KS 6 12 3 – 3 –LP 27 52 16 – 15 2LU 31 61 14 2 13 3MA 14 27 7 – 4 1ML/MH/AU 85 165 43 6 47 23MN 39 68 13 – 17 1MR 10 19 4 1 2 1MZ 9 16 6 3 4 –NB 47 86 19 5 26 2RB 11 20 9 2 7 1RO 36 69 23 5 19 6ST 10 18 4 – 2 2TU 22 42 4 1 11 3UL 28 54 14 2 13 5WB 14 26 3 – 5 1WZ 29 55 16 3 15 1
TOTAL 991 1899 478 76 535 101
Luxemburg LX 13 26 10 1 7 0
Netherlands AW 30 56 14 5 19 1GR 35 78 19 5 27 4LB 19 38 8 2 11 1MS 36 65 7 – 13 1NY 51 98 16 3 34 5RD/RS 32 61 9 5 19 2UT/UW 19 37 9 5 11 –
TOTAL 222 423 82 25 134 14
Eurotransplant, Total 1607 3098 773 168 934 154
Czech Republic# 2 2 – – 26 –Denmark – – 1 – – –France 1 2 5 – – –Greece – – 1 – – –Hungary# 1 2 5 2 11 –Israel – – – – 2 –Italy – – 1 2 – –Norway – – – – 6 –Poland# – – – – 4 –Slovak Republic# – – 3 2 9 –Spain 4 5 4 1 3 –Sweden 1 1 – – 3 –Switzerland 1 2 1 1 1 –United Kingdom/Ireland – – 2 – 6 –
From outside Eurotransplant, Total 10 14 23 8 71 0
# : organ-specific cooperation with Eurotransplant transplant programs

66
Table 3a Cadaveric donor transplant activities in 1996, stratified by organ, per country and per center
Country Center Kidney Kidney/ Pancreas* Heart Heart/ Lung LiverPancreas* Lung
Austria GA 38 – – 21 – – 7IB 109 7 1 26 1 8 49OE 24 – – – – – –OL 14 – – – – – –WD 11 – – – – – –WG 144 – – 57 – 21 76
Total 340 8 1 104 1 29 132
Belgium AN 25 2 – 4 – – –AS – – – 16 – – –BJ 18 – 3 – – – –BR 74 3 – 16 6 5 19GE 36 1 – 7 – – 40LA 100 3 – 20 – 6 44LE 8 – – – – – –LG 22 1 – 22 – – 11LM 114 3 – 22 4 8 21
Total 397 13 3 107 10 19 135
Germany AK 16 – – 4 – – 2AU 8 – – – – – –BA – – – 83 3 – –BB 29 33 3 – – – 1BD – – – 62 11 21 –BE 67 – – – – – –BH – – – 3 – – –BK – – – 6 – – –BM 29 – – – – – –BO 17 – – – – – 22BS 25 – – 5 – – –BV 14 8 – – – – 126DR 4 – – 15 1 – –DU 79 – – 3 – – –EB 61 – – – – – –ES 87 1 – 4 – 2 52FD 1 – – 9 – 2 –FM 50 – – 10 – – 13FR 76 – – 6 – – 12GI 22 8 3 20 – – –GO 28 – – 8 – – 20HA 32 – – 20 – – –HB 56 – – 17 – – 43HG 55 1 – 12 – – 86HM 67 – – – – – –HO 157 – – 25 2 23 93HS 25 – – 4 – 5 –JE 38 – – – – – 25KI 19 – – 25 – 10 23KK 1 – – – – – –KL 31 – – 8 – – 1KM 49 – – – – – 12KS 20 – – 4 – – –LP 28 – – 15 – – 26LU 60 – – – – – –MA 15 – – – – – –MB – – – – – – 6MD – – – 11 – – –MH 42 1 – – – – 10ML 130 30 2 56 4 18 46MN 65 – – 28 1 – 7MR 31 3 – – – – –MZ 12 – – 4 – 5 –NB 71 – – – – – 27RB 14 – – 12 – – 8RO 36 8 2 – – – 5ST 18 – – – – – –TU 25 6 – 2 – – 16UL 37 4 – – – – –WZ 36 – – 7 – – 7
Total 1784 103 10 488 22 86 689
Luxemburg LX 14 0 0 0 0 0 0
Netherlands AW 49 – – – – – –GR 74 5 – 1 1 20 42LB 47 12 – – – – 7MS 50 – – – – – –NY 81 – – – – – –RD 57 – – 28 – – 27RS 9 – – – – – –UT 37 – – 31 – – –UW 4 – – – – – –
Total 408 17 0 60 1 20 76
Eurotransplant, Total 2943 140 14 759 34 154 1032
3083
Note: islet/kidney and/or islet transplantations were performed in IB, Austria (1 Islet/Kidney), in BJ, Belgium (3 Islet-only) and in GI, Germany (8Islet/Kidney, 3 Islet-only).

67
Table 3b Living donor transplant activities in 1996, stratified by organ, per country and per center
Kidney Heart Liver
Country Center Living Living Total Domino Living Living Domino TotalRelated Unrelated Total Related Unrelated
Austria IB 5 3 8 – – – – –OE 1 0 1 – – – – –WD 3 0 3 – – – – –WG 5 1 6 – – – – –
TOTAL 14 4 18 0 0 0 0 0
Belgium AS 0 0 0 1 – – – –BR 3 1 4 – – – – –GE 2 0 2 – – – 1 1LA 9 3 12 – 11 – – 11
TOTAL 14 4 18 1 11 0 1 12
Germany AK 1 1 2 – – – – –BB 0 1 1 – – – – –BE 2 1 3 – – – – –BM 1 1 2 – – – – –BS 4 1 5 – – – – –BV 5 0 5 – – – – –DU 1 0 1 – – – – –EB 1 0 1 – – – – –FM 5 1 6 – – – – –FR 10 7 17 – – – – –GI 10 0 10 – – – – –GO 2 1 3 – – – – –HA 2 0 2 – – – – –HB 9 1 10 – – – – –HG 1 2 3 – 9 1 0 10HM 1 0 1 – – – – –HO 21 2 23 – – – – –KM 2 0 2 – – – – –LU 4 0 4 – – – – –MH 4 0 4 – – – – –ML 2 4 6 – – – – –MN 4 0 4 – – – – –NB 4 0 4 – – – – –RB 1 0 1 – – – – –RO 1 0 1 – – – – –ST 6 0 6 – – – – –WZ 0 1 1 – – – – –
TOTAL 104 25 129 0 9 1 0 10
Luxemburg LX 0 0 0 0 0 0 0 0
Netherlands AW 6 0 6 – – – – –GR 10 0 10 – – – – –LB 5 0 5 – – – – –MS 8 3 11 – – – – –NY 22 0 22 – – – – –RD 18 0 18 – – – – –RS 1 0 1 – – – – –UT 5 3 8 – – – – –
TOTAL 75 6 81 0 0 0 0 0
Eurotransplant, Total 207 39 246 1 20 1 1 22

68
Table 4 Organ exchange of the Eurotransplant countries, based upon the transplant activities in 1996
Table 4a Survey of donor kidney exchange in 1996
Transplant country Austria Belgium Germany Luxemburg Netherlands ET Othersa Total DifferenceDonor country available
Austria 258 8 73 0 11 0 350 –3Belgium 13 263 96 3 21 3 399 +11Germany 66 104 1626 2 85 14 1897 –10Luxemburg 0 12 4 8 2 0 26 –12Netherlands 7 22 79 1 305 9 423 +2
Total Eurotransplant 344 409 1878 14 424 3069 26 3095 –12
Othersb 3 1 9 0 1 14 0 14 +12
Total transplanted 347 410 1887 14 425 3083 26 3109
a. Transplant country: Others: Switzerland (12), Turkey (4), Pakistan (3), Oman (3), Czech Republic (1), Denmark (1), SlovakRepublic (1), Spain (1).b. Donor country: Others: Spain (5), Czech Republic (2), France (2), Hungary (2), Switzerland (2), Sweden (1).
Table 4b Survey of donor heart exchange in 1996
Transplant country Austria Belgium Germany Netherlands ET Othersa Total DifferenceDonor country available
Austria 79 0 14 0 0 93 +11Belgium 4 86 10 0 1 101 +6Germany 12 11 426 4 1 454 +34Luxemburg 0 7 3 0 0 10 –10Netherlands 3 3 19 56 0 81 –21
Total Eurotransplant 98 107 472 60 737 2 739 +20
Othersb 6 0 16 0 22 0 22 –20
Total transplanted 104 107 488 60 759 2 761
a. Transplant country: Others: Italy (1), United Kingdom (1).b. Donor country: Others: France (5), Hungary (5), Spain (4), Slovak Republic (2), United Kingdom/Ireland (2), Denmark (1),Greece (1), Italy (1), Switzerland (1).
Table 4c Survey of donor heart/lung exchange in 1996
Transplant country Austria Belgium Germany Netherlands ET Othersa Total DifferenceDonor country available
Austria 1 1 0 0 0 2 –1Belgium 0 6 1 0 0 7 +3Germany 0 3 20 0 1 24 –2Netherlands 0 0 0 1 0 1 –
Total Eurotransplant 1 10 21 1 33 1 34 –
Othersb 0 0 1 0 1 0 1 –
Total transplanted 1 10 22 1 34 1 35
a. Transplant country: Others : Sweden (1).b. Donor country: Others: Slovak Republic (1).
Table 4d Survey of donor double lungs exchange in 1996
Transplant country Austria Belgium Germany Netherlands ET Othersa Total DifferenceDonor country available
Austria 9 0 9 2 0 20 –3Belgium 0 4 6 3 1 14 –9Germany 1 1 33 2 0 37 +21Luxemburg 1 0 0 0 0 1 –1Netherlands 2 0 7 10 0 19 –2
Total Eurotransplant 13 5 55 17 90 1 91 +6
Othersb 4 0 3 0 7 0 7 –6
Total transplanted 17 5 58 17 97 1 98
a. Transplant country: Others: Switzerland (1).b. Donor country: Others: Hungary (2), Italy (2), Slovak Republic (1), Spain (1), Switzerland (1).
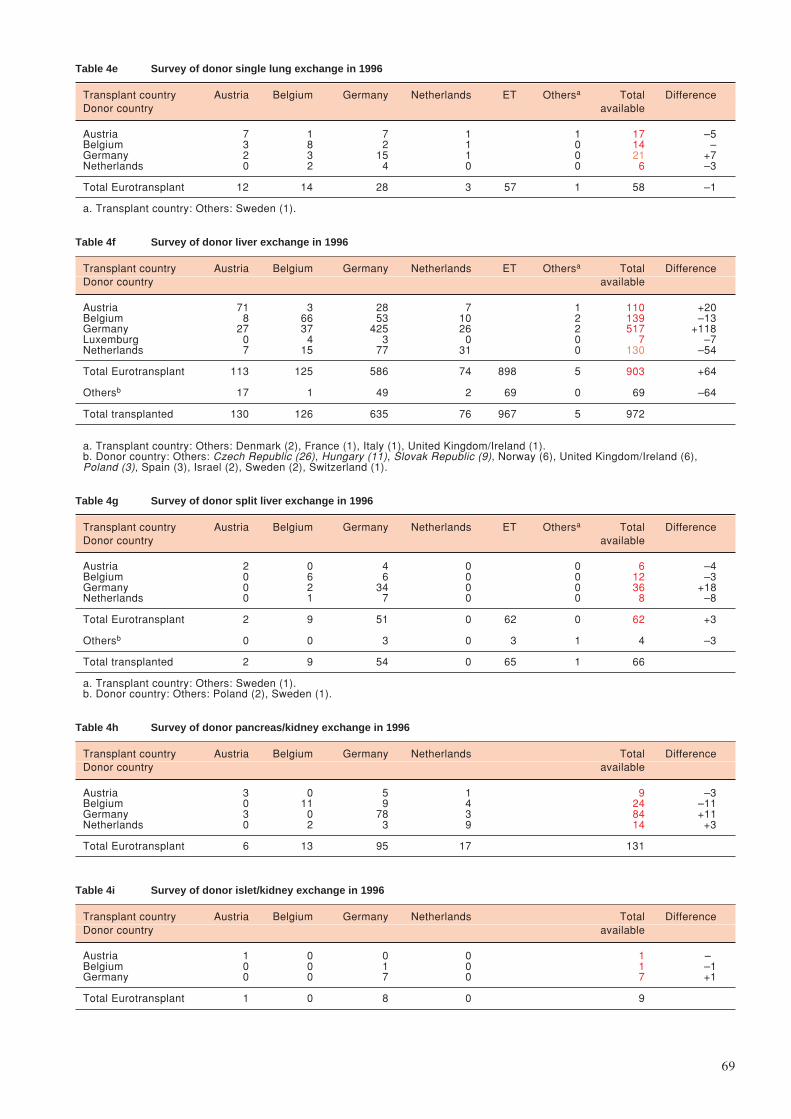
69
Table 4e Survey of donor single lung exchange in 1996
Transplant country Austria Belgium Germany Netherlands ET Othersa Total DifferenceDonor country available
Austria 7 1 7 1 1 17 –5Belgium 3 8 2 1 0 14 –Germany 2 3 15 1 0 21 +7Netherlands 0 2 4 0 0 6 –3
Total Eurotransplant 12 14 28 3 57 1 58 –1
a. Transplant country: Others: Sweden (1).
Table 4f Survey of donor liver exchange in 1996
Transplant country Austria Belgium Germany Netherlands ET Othersa Total DifferenceDonor country available
Austria 71 3 28 7 1 110 +20Belgium 8 66 53 10 2 139 –13Germany 27 37 425 26 2 517 +118Luxemburg 0 4 3 0 0 7 –7Netherlands 7 15 77 31 0 130 –54
Total Eurotransplant 113 125 586 74 898 5 903 +64
Othersb 17 1 49 2 69 0 69 –64
Total transplanted 130 126 635 76 967 5 972
a. Transplant country: Others: Denmark (2), France (1), Italy (1), United Kingdom/Ireland (1).b. Donor country: Others: Czech Republic (26), Hungary (11), Slovak Republic (9), Norway (6), United Kingdom/Ireland (6),Poland (3), Spain (3), Israel (2), Sweden (2), Switzerland (1).
Table 4g Survey of donor split liver exchange in 1996
Transplant country Austria Belgium Germany Netherlands ET Othersa Total DifferenceDonor country available
Austria 2 0 4 0 0 6 –4Belgium 0 6 6 0 0 12 –3Germany 0 2 34 0 0 36 +18Netherlands 0 1 7 0 0 8 –8
Total Eurotransplant 2 9 51 0 62 0 62 +3
Othersb 0 0 3 0 3 1 4 –3
Total transplanted 2 9 54 0 65 1 66
a. Transplant country: Others: Sweden (1).b. Donor country: Others: Poland (2), Sweden (1).
Table 4h Survey of donor pancreas/kidney exchange in 1996
Transplant country Austria Belgium Germany Netherlands Total DifferenceDonor country available
Austria 3 0 5 1 9 –3Belgium 0 11 9 4 24 –11Germany 3 0 78 3 84 +11Netherlands 0 2 3 9 14 +3
Total Eurotransplant 6 13 95 17 131
Table 4i Survey of donor islet/kidney exchange in 1996
Transplant country Austria Belgium Germany Netherlands Total DifferenceDonor country available
Austria 1 0 0 0 1 –Belgium 0 0 1 0 1 –1Germany 0 0 7 0 7 +1
Total Eurotransplant 1 0 8 0 9
70
Table 5 Organ exchange in cadaveric-donor transplantation, in 1996, between the Eurotransplant transplant programs
* How to read the Tables 5a-i
1. Country
2a. Transplant region or center, at which the organ-specific transplants were performed2b. Donors centers and/or transplant centers within the transplant region (center codes, see page 8 - 14)
3. Donors3a. Reported, total number of organ-specific donors reported to Eurotransplant, of whom organs were
transplanted in 19963b. Not used, number of organ-specific donors not used3c. Single organ, number of organ-specific donors of whom only one kidney or one lung was used3d. Two single organs, number of donors from whom the 2 lungs have been used in 2 different recipients
4. Organs used Total, total number of organs which have been used in a transplant which took place in 1996
5. Destination of organs5a. Outside country, number of organs shipped outside the donor country5b. Same country, number of organs shipped to another center outside the region but in the same country5c. Same region, number of organs shipped to another center in the region5d. Local center, number of organs used at the local center
6. Origin of transplanted organs6a. Local center, number of organs transplanted at the local center6b. Same region, number of organs, received from another center from the same region6c. Same country, number of organs, received from another center outside the region but from the same
country6d. Outside country, number of organs, received from outside the donor country
7. Transplants Total, total number of organ transplants performed during 1996
8. Exchange balance, difference between Organs used Total and Transplants Total, i.e. net import:export balance‘+’ means, more import than export‘-’ means, more export than import
The programs in italic represent the individual donor and/or transplant centers in a transplant region.Transplant regions reflect the status at December 31, 1996.

71
Table 5a Survey of donor kidney exchange in 1996
1 2a 2b 4 5a 5b 5c 5d/6a 6b 6c 6d 7 8
Country Region Center Kidneys Destination / Origin Kidney Exchangecode used trans- balance
Total Outside Same Same Local Same Same Outside plantscountry country region center region country country Total
Austria Graz GA 42 7 15 20 9 9 38 -4Innsbruck IB 101 35 9 57 29 30 116 +15Upper Austria 30 6 13 5 6 5 10 17 38 +8
OE 10 1 4 2 3 3 5 13 24OL 14 3 5 3 3 2 5 4 14
OW 6 2 4 - - - - - -Wien WG 177 44 29 104 18 33 155 -22
WD - - - 3 5 3 11WG 177 44 29 101 13 30 144
TOTAL 350 92 66 192 66 89 347 -3
Belgium Bel_1 131 45 23 30 33 30 5 14 82 -49Luxemburg AN 41 18 9 5 9 12 1 7 29
BJ 18 5 2 5 6 8 1 1 16LG 46 16 9 11 10 8 2 3 23LX 26 6 3 9 8 2 1 3 14
Bruxelles BR 48 15 6 27 15 35 77 +29Bruxelles LA 88 27 11 50 12 41 103 +15Bel_2 158 52 14 28 64 28 22 48 162 +4
AS 6 3 1 2 - - - - -GE 73 28 7 25 23 2 3 9 37LE - - - - 0 2 0 6 8LM 79 21 6 1 41 24 19 33 117
Belgium TOTAL 399 133 51 215/222 53 135 410 +11Luxemburg TOTAL 26 6 3 17/10 1 3 14 -12
Germany Aachen AK 23 6 4 13 2 1 16 -7Bochum BB 24 5 7 12 32 18 62 +38Berlin 128 10 25 59 34 59 54 29 176 +48
BE 24 1 3 11 9 31 16 11 67BV 24 2 3 16 3 13 5 2 23EB 80 7 19 32 22 6 22 11 61BS - - - - - 9 11 5 25
UNI-TVN 185 22 66 31 66 31 45 22 164 -21BM 35 5 13 9 8 3 17 1 29HG 63 7 18 9 29 11 10 6 56
KI 26 3 12 5 6 4 5 4 19LU 61 7 23 8 23 13 13 11 60
UNI-RP 126 27 40 30 29 30 7 8 74 -52BO 43 3 13 16 11 3 2 1 17HS 29 9 8 2 10 12 1 2 25KS 12 1 3 1 7 7 1 5 20MZ 16 6 7 2 1 8 3 0 12WB 26 8 9 9 - - - - -
Düsseldorf DU 79 14 21 44 23 12 79 0Essen ES 82 14 18 50 24 14 88 +6Frankfurt/Gießen 74 11 20 15 28 15 26 12 81 +7
Fulda 10 3 1 5 1 - 0 0 1FM 34 6 9 2 17 13 12 8 50GI 30 2 10 8 10 2 14 4 30
Freiburg FR 46 3 6 37 27 12 76 +30Göttingen GO 37 13 13 11 11 6 28 -9UNI-TSA 247 52 90 23 82 23 34 7 146 -101
DR 19 4 11 2 2 1 1 0 4HA 45 14 11 5 15 8 6 3 32JE 62 11 21 4 26 6 4 2 38LP 52 12 16 8 16 5 5 2 28
RO 69 11 31 4 23 3 18 0 44Heidelberg HB 33 6 11 16 31 8 56 +23Hannover 175 18 40 117 70 37 224 +49
HM 35 23 9 67HO 82 47 28 157
Köln 84 5 30 27 22 27 22 10 81 -3KK - - - - - 1 0 0 1KL 38 3 12 15 8 12 9 2 31
KM 46 2 18 12 14 14 13 8 49Mannheim MA 27 5 13 9 4 2 15 -12UNI-NBav 161 25 50 24 62 24 22 13 121 -40
NB 86 11 27 9 39 13 12 7 71RB 20 1 12 3 4 5 3 2 14WZ 55 13 11 12 19 6 7 4 36
UNI-SBav 165 9 32 124 54 33 211 +46AU 8 0 0 8MH 25 14 4 43ML 91 40 29 160
Münster MN 68 7 22 39 20 6 65 -3Marburg MR 19 3 8 8 23 3 34 +15Stuttgart/Tübingen 60 8 20 9 23 9 11 6 49 -11
ST 18 2 6 4 6 5 4 3 18TU 42 6 14 5 17 4 7 3 31
Ulm UL 54 8 14 32 8 1 41 -13
TOTAL 1897 271 550 1076 550 261 1887 -10
Netherlands Amsterdam AW 56 25 10 21 17 11 49 -7Groningen GR 68 17 22 29 23 27 79 +11Leiden LB 38 7 15 16 19 24 59 +21Maastricht MS 65 14 20 31 9 10 50 -15Nijmegen NY 98 26 22 50 11 20 81 -17Rotterdam 61 17 16 28 24 14 66 +5
RD 61 17 16 26 22 9 57RS - - - 2 2 5 9
Utrecht 37 12 17 8 19 14 41 +4UT 37 12 17 8 16 13 37
UW - - - 0 3 1 4
TOTAL 423 118 122 183 122 120 425 +2
Eurotransplant, Total 3095 620 792 1683 792 608 3083 -12
From/To outside ET 14 14 0 0 0 26 26 +12
Total 3109 634 792 1683 792 634 3109 0

72
Table 5b Survey of donor heart exchange in 1996
1 2a 2b 3a 3b 4 5a 5b 5c 5d/6a 6b 6c 6d 7 8
Country Region Center Donors Donors Lungs Destination / Origin HE/LU Nationalcode Report Not Used Used trans- Exchange
Total Total Outside Same Same Local Same Same Outside plants Balancecountry country region center region country country Total
Austria Graz GA 23 3 20 1 1 18 1 2 21Innsbruck IB 32 7 25 2 2 21 1 4 26Wien WG 80 32 48 11 2 4 31 4 3 19 57
OE 2 1 1 1 0 0 - - - - -OL 6 0 6 2 1 3 - - - - -OW 2 0 2 1 0 1 - - - - -WG 70 31 39 7 1 - 31 4 3 19 57
TOTAL 135 42 93 14 5 74 5 25 104 +11
Belgium Bel_1 51 15 36 10 6 10 10 10 4 2 26Luxemburg Antwerpen AN 10 4 6 3 0 2 1 2 0 1 4
BJ 8 3 5 1 2 2 - - - - -Liège LG 22 7 15 3 3 0 9 8 4 1 22
LX 11 1 10 3 1 6 - - - - -Aalst AS 3 0 3 0 0 3 8 5 16Bruxelles BR 18 3 15 3 3 9 2 3 20Bruxelles LA 27 3 24 2 7 15 2 3 20Bel_2 53 20 33 3 7 9 14 9 3 3 29
GE 19 6 13 1 3 7 2 2 1 2 7LM 34 14 20 2 4 2 12 7 2 1 22
Belgium TOTAL 141 40 101 15 20 66/72 21 14 107 +6Luxemburg TOTAL 11 1 10 3 1 6/0 0 0 0 -10
Germany UNI-NRW 112 28 84 8 40 11 25 11 7 4 47Aachen AK 7 0 7 1 3 0 3 0 0 1 4
Bochum 7 3 4 0 4 0 - - - - -Düsseldorf DU 17 8 9 1 5 0 3 0 0 0 3Essen ES 26 7 19 1 9 5 4 0 0 0 4Köln L KL 10 1 9 1 4 0 4 2 1 1 8
KM 13 3 10 1 5 4 - - - - -Münster MN 16 3 13 0 2 - 11 9 6 2 28
BO 16 3 13 3 8 2 - - - - -Berlin BD 40 5 35 1 4 30 0 30 19 13 62Berlin DHZ BD 0 0 0 0 0 - 0 30 19 13 62
BE 7 1 6 0 0 6 - - - - -BV 8 1 7 0 2 5 - - - - -EB 25 3 22 1 2 19 - - - - -
Berlin Charité BS 0 0 0 - - 0 2 3 5Bad Nauheim BH 0 0 0 - - 0 3 0 3Bad Krozingen BK 0 0 0 - - 0 4 2 6UNI-TSA 69 14 55 1 7 33 14 33 3 0 50Dresden DR 6 0 6 0 1 4 1 13 1 0 15Halle HA 24 8 16 1 2 6 7 11 2 0 20
JE 22 5 17 0 2 15 - - - - -Leipzig LP 17 1 16 0 2 8 6 9 0 0 15Fulda FD 4 0 4 0 0 4 5 0 9Frankfurt FM 14 4 10 0 3 7 2 1 10Freiburg FR 10 3 7 0 2 5 1 0 6Gießen GI 8 1 7 0 5 2 7 11 20Göttingen GO 13 2 11 0 5 6 1 1 8Heidelberg HB 11 2 9 0 1 8 7 2 17UNI-TVN 75 15 60 7 23 21 9 21 4 3 37Hamburg HG 23 6 17 2 7 4 4 7 1 0 12Kiel KI 10 2 8 1 1 1 5 14 3 3 25
LU 17 3 14 3 6 5 - - - - -RO 25 4 21 1 9 11 - - - - -
Hann/B.Oeyn HO/BA 63 18 45 2 4 20 19 20 52 17 108B.Oeynhausen BA 0 0 0 - - - - 20 48 15 83
BM 11 2 9 1 1 7 - - - - -Hannover HO/HM 52 16 36 1 3 13 19 0 4 2 25Homburg/Saar HS 5 2 3 0 2 1 2 1 4Kaiserslautern KS 5 2 3 0 0 3 1 0 4- MA 7 0 7 0 0 - - - -München ML/MD 48 8 40 2 6 5 27 5 32 3 67München DHZ MD - - - - - - 0 5 6 0 11München GH ML 48 8 40 2 6 5 27 0 26 3 56- MR 4 1 3 1 2 - - - -Mainz MZ 9 0 9 1 5 1 2 1 1 0 4
MZ 6 0 6 0 4 - 2 1 1 0 4WB 3 0 3 1 1 1 - - - - -
UNI-NBav 47 4 43 1 25 11 6 11 2 0 19NB 21 2 19 0 12 7 - - - - -
Regensburg RB 11 2 9 1 3 0 5 7 0 0 12Würzburg WZ 15 0 15 0 10 4 1 4 2 0 7Tübingen TU 11 4 7 1 6 0 0 0 1 1 2- ST 7 3 4 1 3 0 - - - - -
TU 4 1 3 0 3 - 0 0 1 1 2- UL 16 4 12 3 9 - - - -
TOTAL 571 117 454 28 156 270 156 62 488 +34
Netherlands Rotterdam RD 47 9 38 14 3 15 6 15 6 1 28AW 16 2 14 5 2 7 - - - - -LB 11 3 8 3 0 5 - - - - -MS 9 2 7 4 0 3 - - - - -RD 11 2 9 2 1 - 6 15 6 1 28
Utrecht UT 60 17 43 11 6 22 4 22 3 3 32GR 23 4 19 4 1 14 0 0 0 1 1NY 26 10 16 4 4 8 - - - - -UT 11 3 8 3 1 - 4 22 3 2 31
TOTAL 107 26 81 25 9 47 9 4 60 -21
Eurotransplant, Total 965 226 739 85 191 463 191 405 759 +20
From/ Twinning 9 2 7 2 0 5 0 0 0 0 0To outside ET No twinning 58 43 15 15 0 0 0 0 0 2 2
TOTAL 67 45 22 17 0 5 0 0 0 2 2 -20
Total 1032 271 761 102 191 5 463 191 107 761 0

73
Table 5c Survey of donor heart/lung exchange in 1996
1 2a 2b 3a 3b 4 5a 5b 5c 5d/6a 6b 6c 6d 7 8
Country Region Center Donors Donors Heart/ Destination / Origin HE/LU Nationalcode Report Not Used Lung trans- Exchange
Total Used Outside Same Same Local Same Same Outside plants BalanceTotal country country region center region country country Total
Austria Graz GA 1 1 0 0 0 0 0 0 0Innsbruck IB 4 3 1 0 0 1 0 0 1Wien WG 3 2 1 1 0 0 0 0 0 0 0
OL 1 0 1 1 0 0 - - - - -WG 2 2 0 0 0 - 0 0 0 0 0
TOTAL 8 6 2 1 0 1 0 0 1 -1
Belgium Bel_1 2 1 1 0 1 0 0 0 0 0 0- AN 1 0 1 0 1 - - - - - -
LG 1 1 0 0 0 - - - - - -Bruxelles BR 3 0 3 0 0 3 1 2 6Bruxelles LA 2 2 0 0 0 0 0 0 0Leuven LM 4 1 3 1 0 2 0 2 0 2 4
GE 4 1 3 1 0 2 0 0 0 0LM 0 0 0 0 0 - 0 2 0 2 4
TOTAL 11 4 7 1 1 5 1 4 10 +3
Germany UNI-NRW 8 6 2 1 1 0 0 0 1 0 1DU 2 2 0 0 0 0 - - - - -ES 1 1 0 0 0 - 0 0 0 0 0KL 3 3 0 0 0 0 - - - - -MN 0 0 0 0 0 - 0 0 1 0 1BO 2 0 2 1 1 0 - - - - -
Berlin DHZ BD 9 2 7 0 1 6 0 6 4 1 11BD 0 0 0 0 0 - 0 6 4 1 11BE 2 2 0 0 0 0 - - - - -EB 7 0 7 1 0 6 - - - - -
UNI-TSA 9 6 3 0 2 1 0 1 0 0 1DR 2 1 1 0 1 - 0 1 0 0 1JE 5 3 2 0 1 1 - - - - -LP 2 2 0 0 0 0 - - - - -
UNI-TVN 7 5 2 0 2 0 0 0 0 0 0HG 2 2 0 0 0 0 - - - - -KI 1 1 0 0 0 - 0 0 0 0 0RO 4 2 2 0 2 0 - - - - -
Hannover HO 3 1 2 0 0 0 2 0 2 1 5BM 1 1 0 0 0 0 - - - - -HO/HM 2 0 2 0 0 - 2 0 2 1 5
Homburg/Saar HS 0 0 0 0 0 0 0 0 0- KS 1 1 0 0 0 - - - -- MA 0 0 0 0 0 - - - -München ML 11 8 3 0 1 2 2 0 4- MR 1 0 1 0 1 - - - -UNI-NBav 4 3 1 0 1 - - - -
WZ 4 3 1 0 1 - - - -Tübingen TU 4 3 1 1 0 0 0 0 0 0 0
TU 4 3 1 1 0 - 0 0 0 0 0- UL 2 0 2 1 1 - - - -
TOTAL 59 35 24 4 9 11 9 2 22 -2
Netherlands Groningen GR 9 8 1 0 0 1 0 1 0 0 1AW 2 2 0 0 0 - - - - - -GR 1 1 0 0 0 - 0 1 0 0 1LB 1 1 0 0 0 - - - - - -MS 1 1 0 0 0 - - - - - -NY 3 3 0 0 0 - - - - - -UT 2 1 1 0 0 1 - - - - -
TOTAL 9 8 1 0 0 1 0 0 1 0
Eurotransplant, Total 87 53 34 6 10 18 10 6 34 0
From/ Twinning 3 2 1 1 0 0 0 0 0 0 0To outside ET No twinning 12 12 0 0 0 0 0 0 0 1 1
TOTAL 15 14 1 1 0 0 0 0 0 1 1 0
Total 102 67 35 7 10 18 10 7 35 0

74
Table 5d Survey of donor double lungs exchange in 1995
1 2a 2b 3a 3b 4 5a 5b 5c 5d/6a 6b 6c 6d 7 8
Country Region Center Donors Donors Lungs Destination / Origin Lung Nationalcode Report Not Used Used trans- Exchange
Total Total Outside Same Same Local Same Same Outside plants Balancecountry country region center region country country Total
Austria Graz GA 5 3 2 1 1 0 0 0 0Innsbruck IB 12 6 6 3 0 3 1 3 7Wien WG 25 13 12 7 1 1 3 1 1 5 10
OL 4 3 1 0 0 1 - - - - -OW 1 0 1 1 0 0 - - - - -WG 20 10 10 6 1 - 3 1 1 5 10
TOTAL 42 22 20 11 2 7 2 8 17 -3
Belgium - AN 2 2 0 0 0 - - - -Bruxelles BR 5 4 1 1 0 0 0 0 0Gent GE 1 0 1 1 0 0 0 0 0Bruxelles LA 5 2 3 1 0 2 0 0 2Liège LG 5 2 3 3 0 0 0 0 0Leuven LM 14 8 6 4 0 0 2 0 0 1 3
AS 1 0 1 1 0 0 - - - - -LM 13 8 5 3 0 - 2 - 0 1 3
TOTAL 32 18 14 10 0 4 0 1 5 -9
Germany UNI-NRW 28 23 5 1 3 0 1 0 0 0 1AK 2 2 0 0 0 0 - - - - -Bochum 3 2 1 0 1 0 - - - - -DU 1 1 0 0 0 0 - - - - -ES 8 6 2 0 1 - 1 0 0 0 1KL 4 3 1 1 0 0 - - - - -KM 5 5 0 0 0 0 - - - - -MN 1 1 0 0 0 - 0 0 0 0 0BO 4 3 1 0 1 0 - - - - -
Berlin DHZ BD 17 9 8 0 1 7 0 7 5 7 19BD 0 0 0 0 0 - 0 7 5 7 19BE 1 0 1 0 0 1 - - - - -BV 3 2 1 0 0 1 - - - - -EB 13 7 6 0 1 5 - - - - -
UNI-TSA 15 13 2 0 2 0 0 0 0 0 0DR 3 3 0 0 0 - 0 0 0 0 0HA 7 6 1 0 1 - 0 0 0 0 0JE 5 4 1 0 1 0 - - - - -
Fulda FD 1 1 0 0 0 0 0 0 0Frankfurt FM 1 1 0 0 0 0 0 0 0- FR 2 2 0 0 0 0 0 0 0- GI 1 0 1 0 1 - - - -Göttingen GO 3 3 0 0 0 - - - -Heidelberg HB 1 1 0 0 0 0 0 0 0UNI-TVN 21 13 8 0 4 2 2 2 3 3 10
HG 4 3 1 0 0 1 - - - - -KI 6 3 3 0 1 - 2 2 3 3 10LU 7 5 2 0 1 1 - - - - -RO 4 2 2 0 2 0 - - - - -
Hannover HO 12 8 4 0 2 0 2 0 5 9 16BM 1 1 0 0 0 0 - - - - -HO/HM 11 7 4 0 2 - 2 0 5 9 16
Homburg/Saar HS 2 2 0 0 0 0 0 0 0- KS 1 1 0 0 0 - - - -- MA 2 2 0 0 0 - - - -München ML 8 6 2 0 0 2 2 2 6- MR 1 1 0 0 0 - - - -Mainz MZ 5 4 1 0 1 0 1 1 2UNI-NBav 14 8 6 1 5 - - - -
NB 7 4 3 1 2 - - - -RB 2 0 2 0 2 - - - -WZ 5 4 1 0 1 - - - -
Tübingen TU 4 4 0 0 0 0 0 0 0 0 0ST 2 2 0 0 0 0 - - - - -TU 2 2 0 0 0 - 0 0 0 0 0
- UL 1 1 0 0 0 - - - -
TOTAL 140 103 37 4 17 16 17 25 58 +21
Luxemburg TOTAL 3 2 1 1 0 0 0 0 0 -7
Netherlands Groningen GR 48 29 19 9 0 8 2 8 0 7 17AW 10 5 5 3 0 2 - - - - -GR 11 7 4 2 0 - 2 8 0 7 17LB 4 3 1 0 0 1 - - - - -MS 3 3 0 0 0 0 - - - - -NY 10 7 3 3 0 0 - - - - -RD 7 3 4 1 0 3 - - - - -UT 3 1 2 0 0 2 - - - - -
TOTAL 48 29 19 9 0 10 0 7 17 -2
Eurotransplant, Total 265 174 91 35 19 37 19 41 97 +6
From/ Twinning 5 2 3 1 0 2 0 0 0 0 0To outside ET No twinning 33 29 4 4 0 0 0 0 0 1 1
TOTAL 38 31 7 5 0 2 0 0 0 1 1 -6
Total 303 205 98 40 19 2 37 19 42 98 0

75
Table 5e Survey of donor single lung exchange in 1995
1 2a 2b 3a 3c 3d 4 5a 5b 5c 5d/6a 6b 6c 6d 7 8
Country Region Center Donors Donors Donors Single Destination / Origin Lung Nationalcode Report Single 2 single lungs trans- Exchange
Total lung lung used Outside Same Same Local Same Same Outside plants BalanceTotal country country region center region country country Total
Austria Graz GA 2 2 0 2 2 0 0 0 0 0Innsbruck IB 0 0 0 0 0 0 0 0 1 1Wien WG 9 3 6 15 8 0 0 7 0 0 4 11
TOTAL 11 5 6 17 10 0 7 0 5 12 -5
Belgium - BJ 3 3 0 3 1 2 - - - -Bruxelles BR 0 0 0 0 0 0 0 4 1 5Gent GE 1 1 0 1 1 0 - - - -Bruxelles LA 4 3 1 5 2 1 2 0 2 4Liège LG 1 1 0 1 1 0 - - - -Leuven LM 3 2 1 4 1 1 2 0 3 5
TOTAL 12 10 2 14 6 4 4 4 6 14 0
Germany UNI-NRW 1 1 0 1 0 0 0 1 0 0 0 1ES 1 1 0 1 0 0 - 1 0 0 0 1
Berlin DHZ BD 1 1 0 1 0 1 1 0 1 0 1 2BD - - - 0 0 0 - 0 1 0 1 2BV 1 1 0 1 0 0 1 - - - - -
UNI-TSA 2 1 1 3 0 3 0 0 0 0 0 0HA 1 0 1 2 0 2 - 0 0 0 0 0JE 1 1 0 1 0 1 0 - - - - -
Fulda FD 1 1 0 1 0 1 0 0 2 2- GO 1 0 2 2 1 1 - - - -UNI-TVN 2 1 1 3 0 3 0 0 0 0 0 0
KI 1 0 1 2 0 2 - 0 0 0 0 0RO 1 1 0 1 0 1 0 - - - - -
Hannover HO 1 0 1 2 0 2 0 0 0 2 5 7Homburg/Saar HS 0 0 0 0 0 0 0 1 0 1München ML 1 1 0 1 1 0 0 7 5 12Mainz MZ 2 2 0 2 0 0 2 1 0 3UNI-NBav 3 1 2 5 2 3 - - - -
NB 2 1 1 3 1 2 - - - -WZ 1 0 1 2 1 1 - - - -
TOTAL 15 9 6 21 6 11 4 11 13 28 +7
Netherlands Groningen GR 5 4 1 6 6 0 0 0 0 0 3 3GR 1 1 0 1 1 0 - 0 0 0 3 3LB 1 1 0 1 1 0 0 - - - - -RD 1 1 0 1 1 0 0 - - - - -UT 2 1 1 3 3 0 0 - - - - -
TOTAL 5 4 1 6 6 0 0 0 3 3 -3
Eurotransplant, Total 43 28 15 58 28 15 15 15 27 57 -1
From/ Twinning 0 0 0 0 0 0 0 0 0 0 0 0To outside ET No twinning 0 0 0 0 0 0 0 0 0 0 1 1
TOTAL 0 0 0 0 0 0 0 0 0 0 1 1 +1
Total 43 28 15 58 28 15 15 15 28 58 0

76
Table 5f Survey of donor whole liver exchange in 1996
1 2a 2b 3a 3b 4 5a 5b 5c 5d/6a 6b 6c 6d 7 8
Country Region Center Donors Donors Livers Destination / Origin Liver Nationalcode Report Not Used Used trans- Exchange
Total Total Outside Same Same Local Same Same Outside plants Balancecountry country region center region country country Total
Austria Graz GA 20 6 14 9 0 5 0 2 7Innsbruck IB 44 9 35 11 1 0 23 3 1 20 47
OE/OL/OW 11 2 9 5 0 4 - - - - -Wien WG 72 20 52 14 1 0 37 1 1 37 76
TOTAL 147 37 110 39 2 69 2 59 130 +20
Belgium - AN 12 4 8 7 1 - - - -- BJ 9 2 7 7 0 - - - -Bruxelles BR 27 8 19 7 1 11 3 5 19Gent GE 39 4 35 13 3 19 2 16 37Bruxelles LA 33 11 22 9 0 13 4 21 38Liège LG 25 4 21 16 3 2 1 8 11Leuven LM 40 13 27 14 2 0 11 0 0 10 21
AS 3 1 2 2 0 0 - - - - -LM 37 12 25 12 2 - 11 - 0 10 21
TOTAL 185 46 139 73 10 56 10 60 126 -13
Germany Aachen AK 7 1 6 2 4 0 1 1 2Bonn BO 21 3 18 2 5 11 5 6 22Berlin BV 50 13 37 5 10 20 2 20 40 64 126
BE 8 2 6 2 2 2 - - - - -BV 11 7 4 1 1 - 2 20 40 64 126EB 31 4 27 2 7 18 - - - - -
- DR 8 1 7 1 6 - - - -Essen ES 66 11 55 10 17 14 14 14 14 7 49
Bochum 8 0 8 1 3 3 1 0 0 0 1DU 26 6 20 4 5 11 - - - - -ES 32 5 27 5 9 - 13 14 14 7 48
Frankfurt FM 18 3 15 2 5 1 7 1 3 2 13FD 3 1 2 1 0 1 - - - - -FM 15 2 13 1 5 - 7 1 3 2 13
Freiburg FR 12 2 10 1 2 7 2 3 12- GI 10 3 7 1 6 - - - -Göttingen GO 15 5 10 2 6 2 5 10 17Heidelberg HB 42 10 32 7 9 12 4 12 11 13 40
HB 14 2 12 5 3 - 4 12 11 13 40HS 7 2 5 2 1 2 - - - - -KS 6 3 3 0 1 2 - - - - -MA 4 1 3 0 1 2 - - - - -MZ 6 2 4 0 2 2 - - - - -WB 5 0 5 0 1 4 - - - - -
Hamburg HG 43 17 26 4 13 3 6 3 22 26 57HG 28 14 14 1 7 - 6 3 22 26 57LU 15 3 12 3 6 3 - - - - -
Hannover HO 76 27 49 8 6 4 31 4 22 25 82BM 11 3 8 3 1 4 - - - - -HO/HM 65 34 41 5 5 - 31 4 22 25 82
Jena JE 33 10 23 3 9 11 7 7 25Kiel KI 13 0 13 1 7 5 9 9 23Köln L KL 16 4 12 4 8 0 1 0 1Köln M KM 12 2 10 1 5 4 5 3 12Leipzig LP 25 10 15 0 9 6 17 3 26Magdeburg MB/HA 21 3 18 3 15 0 6 0 6München MH 0 0 0 0 0 - 0 5 4 1 10München ML 56 10 46 6 11 5 24 - 8 13 45Münster MN 24 7 17 7 7 3 2 2 7- MR 5 3 2 1 1 - - - - -Nürnberg NB 35 9 26 6 7 13 8 6 27Regensburg RB 10 3 7 1 3 3 4 1 8Rostock RO 24 7 17 8 7 2 2 1 5Tübingen TU 18 6 12 0 3 0 9 0 2 2 13
ST 4 2 2 0 2 0 - - - - -TU 14 4 10 0 1 - 9 0 2 2 13
- UL 14 2 12 3 9 - - - -Würzburg WZ 18 3 15 3 11 1 1 5 7
TOTAL 692 175 517 92 201 224 201 210 635 +118
Luxemburg TOTAL 11 4 7 7 0 0 0 0 0 -7
Netherlands Groningen GR 96 14 82 65 6 4 7 4 4 27 42GR 30 4 26 17 2 - 7 4 4 27 42MS 16 3 13 11 1 1 - - - - -NY 38 5 33 28 2 3 - - - - -UT 12 2 10 9 1 - - - - - -
Leiden LB 13 2 11 8 1 - 2 0 3 2 7AW 25 6 19 16 0 3 - - - - -
Rotterdam RD 25 7 18 10 3 - 5 3 3 16 27
TOTAL 159 29 130 99 10 21 10 45 76 -54
Eurotransplant, Total 1194 291 903 310 223 370 223 374 967 +64
From/ Twinning 64 15 49 22 0 27 0 0 0 0 0To outside ET No twinning 52 32 20 20 0 0 0 0 0 5 5
TOTAL 116 47 69 42 0 27 0 0 0 5 5 -64
Total 1310 338 972 352 223 27 370 223 379 972 0 0

77
Table 5g Survey of donor split liver exchange in 1996
1 2a 2b 3a 4 5a 5b 5c 5d/6a 6b 6c 6d 7 8
Country Region Center Donors Livers Destination / Origin Liver Nationalcode Report Used trans- Exchange
Total Total Outside Same Same Local Same Same Outside plants Balancecountry country region center region country country Total
Austria Graz GA 2 4 4 0 0 0 0 0Innsbruck IB 1 2 0 0 2 0 0 2
TOTAL 3 6 4 0 2 0 0 2 -4
Belgium Gent GE 1 2 0 0 2 0 1 3Bruxelles LA 3 6 3 0 3 1 2 6Leuven LM 2 4 3 1 0 0 0 0
TOTAL 6 12 6 1 5 1 3 9 -3
Germany Bonn BO 1 2 0 2 0 0 0 0Essen ES 2 4 1 1 2 0 2 2 0 4
ES 1 2 1 1 0 0 2 2 0 4DU 1 2 0 0 2 - - - - -
Göttingen GO 0 0 0 0 0 0 3 3Magdeburg MB/HA 1 2 0 2 0 0 0 0Heidelberg HB 1 2 0 1 1 0 2 3Hamburg HG 5 10 0 0 2 8 2 11 8 29
HG 4 8 0 0 0 8 2 11 8 29LU 1 2 0 0 2 - - - - -
Hannover HO 2 4 0 2 0 2 0 4 5 11BM 1 2 0 2 0 - - - - -HO/HM 1 2 0 0 0 2 0 4 5 11
Köln M KM 1 2 0 1 0 0 0 0München ML/MH 1 2 0 2 0 0 1 1Rostock RO 2 4 1 3 0 0 0 0Tübingen TU 1 2 0 1 1 1 1 3- UL 1 2 0 2 - - - -
TOTAL 18 36 2 18 18 18 20 54 +18
Netherlands Groningen GR 3 6 6 0 0 0 0 0 0 0GR 1 2 2 0 0 0 0 0 0 0NY 1 2 2 0 0 - - - - -UT 1 2 2 0 0 - - - - -
Rotterdam RD 1 2 2 0 0 0 0 0
TOTAL 4 8 8 0 0 0 0 0 -8
Eurotransplant, Total 31 62 20 19 23 19 23 65 +3
From/ Twinning 1 2 0 0 2 0 0 0 0 0To outside ET No twinning 1 2 1 0 0 1 0 0 0 0
TOTAL 2 4 1 0 2 1 0 0 0 1 -3
Total 33 66 21 19 2 24 19 23 66 0
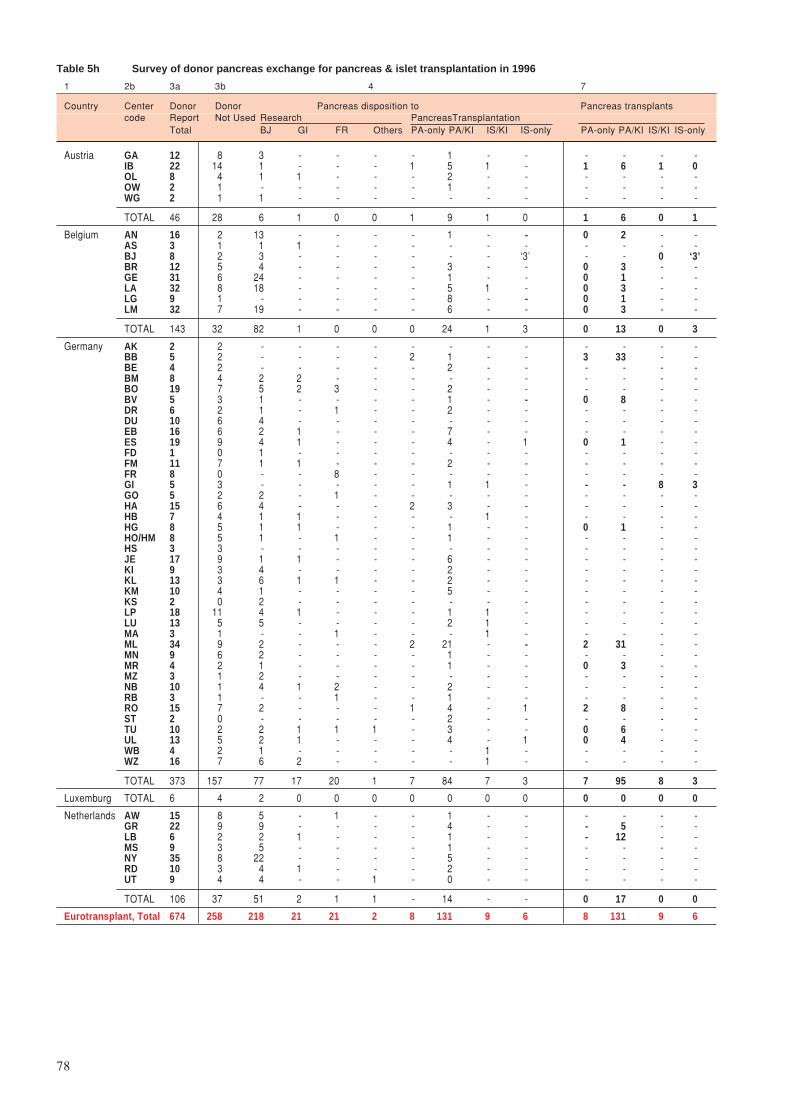
78
Table 5h Survey of donor pancreas exchange for pancreas & islet transplantation in 1996
1 2b 3a 3b 4 7
Country Center Donor Donor Pancreas disposition to Pancreas transplantscode Report Not Used Research PancreasTransplantation
Total BJ GI FR Others PA-only PA/KI IS/KI IS-only PA-only PA/KI IS/KI IS-only
Austria GA 12 8 3 - - - - 1 - - - - - -IB 22 14 1 - - - 1 5 1 - 1 6 1 0OL 8 4 1 1 - - - 2 - - - - - -OW 2 1 - - - - - 1 - - - - - -WG 2 1 1 - - - - - - - - - - -
TOTAL 46 28 6 1 0 0 1 9 1 0 1 6 0 1
Belgium AN 16 2 13 - - - - 1 - - 0 2 - -AS 3 1 1 1 - - - - - - - - - -BJ 8 2 3 - - - - - - ‘3’ - - 0 ‘3’BR 12 5 4 - - - - 3 - - 0 3 - -GE 31 6 24 - - - - 1 - - 0 1 - -LA 32 8 18 - - - - 5 1 - 0 3 - -LG 9 1 - - - - - 8 - - 0 1 - -LM 32 7 19 - - - - 6 - - 0 3 - -
TOTAL 143 32 82 1 0 0 0 24 1 3 0 13 0 3
Germany AK 2 2 - - - - - - - - - - - -BB 5 2 - - - - 2 1 - - 3 33 - -BE 4 2 - - - - - 2 - - - - - -BM 8 4 2 2 - - - - - - - - - -BO 19 7 5 2 3 - - 2 - - - - - -BV 5 3 1 - - - - 1 - - 0 8 - -DR 6 2 1 - 1 - - 2 - - - - - -DU 10 6 4 - - - - - - - - - - -EB 16 6 2 1 - - - 7 - - - - - -ES 19 9 4 1 - - - 4 - 1 0 1 - -FD 1 0 1 - - - - - - - - - - -FM 11 7 1 1 - - - 2 - - - - - -FR 8 0 - - 8 - - - - - - - - -GI 5 3 - - - - - 1 1 - - - 8 3GO 5 2 2 - 1 - - - - - - - - -HA 15 6 4 - - - 2 3 - - - - - -HB 7 4 1 1 - - - - 1 - - - - -HG 8 5 1 1 - - - 1 - - 0 1 - -HO/HM 8 5 1 - 1 - - 1 - - - - - -HS 3 3 - - - - - - - - - - - -JE 17 9 1 1 - - - 6 - - - - - -KI 9 3 4 - - - - 2 - - - - - -KL 13 3 6 1 1 - - 2 - - - - - -KM 10 4 1 - - - - 5 - - - - - -KS 2 0 2 - - - - - - - - - - -LP 18 11 4 1 - - - 1 1 - - - - -LU 13 5 5 - - - - 2 1 - - - - -MA 3 1 - - 1 - - - 1 - - - - -ML 34 9 2 - - - 2 21 - - 2 31 - -MN 9 6 2 - - - - 1 - - - - - -MR 4 2 1 - - - - 1 - - 0 3 - -MZ 3 1 2 - - - - - - - - - - -NB 10 1 4 1 2 - - 2 - - - - - -RB 3 1 - - 1 - - 1 - - - - - -RO 15 7 2 - - - 1 4 - 1 2 8 - -ST 2 0 - - - - - 2 - - - - - -TU 10 2 2 1 1 1 - 3 - - 0 6 - -UL 13 5 2 1 - - - 4 - 1 0 4 - -WB 4 2 1 - - - - - 1 - - - - -WZ 16 7 6 2 - - - - 1 - - - - -
TOTAL 373 157 77 17 20 1 7 84 7 3 7 95 8 3
Luxemburg TOTAL 6 4 2 0 0 0 0 0 0 0 0 0 0 0
Netherlands AW 15 8 5 - 1 - - 1 - - - - - -GR 22 9 9 - - - - 4 - - - 5 - -LB 6 2 2 1 - - - 1 - - - 12 - -MS 9 3 5 - - - - 1 - - - - - -NY 35 8 22 - - - - 5 - - - - - -RD 10 3 4 1 - - - 2 - - - - - -UT 9 4 4 - - 1 - 0 - - - - - -
TOTAL 106 37 51 2 1 1 - 14 - - 0 17 0 0
Eurotransplant, Total 674 258 218 21 21 2 8 131 9 6 8 131 9 6

79
Table 5i Survey of donor kidney exchange for pancreas/kidney & islet/kidney transplantation in 1996
1 2a 2b 4 5a 5b 5c 5d/6a 6b 6c 6d 7 8
Country Region Center Pancreas Destination/Origin Pancreas Nationalcode Kidneys Outside Same Same Local Same Same Outside Kidney Exchange
Used country country region center region country country trans- BalanceTotal Total plants
Austria Graz GA 1 1 0 0 0 0 0 -1Innsbruck IB 6 2 0 4 0 3 7 +1Upper Austria 3 3 0 0 0 0 0 0 0 -3
OL 2 2 0 0 - - - - -OW 1 1 0 0 - - - - -
TOTAL 10 6 0 4 0 3 7 -3
Belgium Bel_1 9 5 3 0 1 0 1 1 3 -6Luxemburg AN 1 0 1 0 0 0 1 1 2
LG 8 5 2 0 1 0 0 0 1Bruxelles BR 3 0 0 3 0 0 3 0Bruxelles LA 6 4 1 1 1 1 3 -3Bel_2 7 5 0 0 2 0 2 0 4 -3
GE 1 0 0 0 1 0 0 0 1LM 6 5 0 0 1 0 2 0 3
Belgium TOTAL 25 14 4 7 4 2 13 -12
Germany Bochum BB 1 0 0 1 23 9 33 +32Berlin 10 0 2 7 1 7 0 0 8 -2
BE 2 0 0 2 - - - - -BV 1 0 0 - 1 7 0 0 8EB 7 0 2 5 - - - - -
UNI-TVN 6 1 5 0 0 0 1 0 1 -5HG 1 0 1 0 0 0 1 0 1KI 2 1 1 0 - - - - -LU 3 0 3 0 - - - - -
UNI-RP 3 0 3 0 0 0 0 0 0 -26BO 2 0 2 0 - - - - -WB 1 0 1 0 - - - - -
Essen ES 4 1 2 1 0 0 1 -3Frankfurt/Gießen 4 0 3 0 1 0 6 1 8 +4
FM 2 0 2 0 0 0 0 0 0GI 2 0 1 0 1 0 6 1 8
UNI-TSA 17 1 14 1 1 1 6 0 8 -9DR 2 1 1 0 - - - - -HA 3 0 2 1 - - - - -JE 6 0 6 0 - - - - -LP 2 0 2 0 - - - - -RO 4 0 3 0 1 1 6 0 8
Heidelberg HB 1 0 1 0 0 0 0 -1Hannover HO 1 0 1 0 0 0 0 -1Köln 7 0 7 0 0 0 0 0 0 -7
KL 2 0 2 0 - - - - -KM 5 0 5 0 - - - - -
Mannheim MA 1 0 1 0 0 0 0 -1UNI-NBav 4 0 4 0 0 0 0 0 0 -4
NB 2 0 2 0 - - - - -RB 1 0 1 0 - - - - -WZ 1 0 1 0 - - - - -
UNI-SBav 21 2 1 0 18 0 7 6 31 +10MH 0 0 1 0 1ML 18 0 6 6 30
Münster MN 1 0 1 0 0 0 0 -1Marburg MR 1 0 1 0 2 1 3 +2Stuttgart/Tübingen 5 0 2 1 2 1 2 1 6 +1
ST 2 0 1 1 - - - - -TU 3 0 1 - 2 1 2 1 6
Ulm UL 4 1 0 3 1 0 4 0
TOTAL 91 6 48 37 48 18 103 +12
Netherlands Amsterdam AW 1 0 1 0 0 0 0 -1Groningen GR 4 1 0 3 1 1 5 +1Leiden LB 1 0 0 1 4 7 12 +11Maastricht MS 1 1 0 0 0 0 0 -1Nijmegen NY 5 3 2 0 0 0 0 -5Rotterdam RD 2 0 2 0 0 0 0 -2
TOTAL 14 5 5 4 5 8 17 +3
Eurotransplant, Total 140 31 57 52 57 31 140 0
*The regional cooperations, existing with regard to kidney transplantation, have been used.

80
BBalance sheet and exploitation result
of Stichting Eurotransplant
International Foundation
Balance sheetAssets 31.12.1996 31.12.1995
× Dfl. 1000 × Dfl. 1000
Short term receivables 4.461 3.935Liquid assets 5.248 5.085
9.709 9.020
Liabilities 31.12.1996 31.12.1995× Dfl. 1000 × Dfl. 1000
Equity 519 519Reserve funds 3.920 3.774Short term liabilities 5.270 4.727
9.709 9.020
Statement of income and chargesIncome 1996 1995
× Dfl. 1000 × Dfl. 1000
Registration fees a 5.700 5.393Miscellaneous b 197 331
5.897 5.724
Charges 1996 1995× Dfl. 1000 × Dfl. 1000
Salaries c 2.895 2.876General expenses d 1.306 1.362Medical expenses e 459 446Transport f 320 294Housing g 287 236Depreciation h 441 318Miscellaneous i 128 136
5.835 5.668Exploitation-balance 62 55
5.897 5.724
Accounting policiesCurrent assets and liabilitiesThese are stated at nominal value. For doubtful accounts a provision has been made.
Exploitation balanceThe exploitation balance is defined as the difference between income and charges based on the above mentioned policies.
Auditor’s reportWe have audited the financial statements of Stichting Eurotransplant International Foundation for the year ended December 31, 1996from which the summarized financial statements were derived, in accordance with relevant auditing standards. In our report datedApril 25, 1997 we expressed an unqualified opinion on the financial statements from which the summarized financial statements werederived. These financial statements are the responsibility of the Foundation’s management.
In our opinion, the accompanying summarized financial statements are consistent, in all material respects, with the financial statementsfrom which they were derived.
For a better understanding of the Foundation’s financial position and the results of its operations for the period and the scope of ouraudit, the summarized financial statements should be read in conjunction with the financial statements from which the summarizedfinancial statements were derived and our audit report thereon.
Leiden, April 25, 1997
Deloitte & Touche
Recommended