Peer Comparisons

Table of ContentsPeer Comparisons Introduction 8.1
Total Enrollment 8.3 Total Enrollment by Level 8.3 Undergraduate Enrollment 8.4 by Full- and Part-time Status 8.4 by Gender 8.5 by Ethnicity 8.5 Graduate Enrollment 8.6 by Full- and Part-time Status 8.6 by Gender 8.7 by Ethnicity 8.7 Total Degrees Awarded 8.8 by Level 8.8 by Gender 8.9 by Ethnicity 8.9 Bachelor's Degrees Awarded by Gender 8.10 by Ethnicity 8.10 by Discipline 8.11 Master's Degrees Awarded by Gender 8.12 by Ethnicity 8.12 by Discipline 8.13 Doctoral Degrees Awarded by Gender 8.14 by Ethnicity 8.14 by Discipline 8.15 First-time First-year Retention Rate 8.16 Six-year Graduation Rate 8.16 Student to Faculty Ratio 8.17 Percent of Classes with Fewer than 20 Students 8.17 Percent of Classes with 50 or more Students 8.17 First-time First-year Enrollment 8.18 by Gender 8.19 by Ethnicity 8.19 Acceptance Rate 8.20 First-time First-year Yield 8.20 SAT 25th-75th Percentile Range 8.21 Proportion of Incoming First-years in Top 10% of High School Class 8.21 Average Faculty Compensation Professors 8.22 Associate Professors 8.22 Assistant Professors 8.23 Proportion of Instructional Faculty Who are Full-time 8.23 University Endowment Funds 8.24 University Endowment Assets per FTE Student 8.24 Expenditures per FTE Student 8.25 Tuition and Fees 8.26 Tuition, Fees, Room, and Board 8.26 Full-time First-year Enrollment 8.27 Percent of Full-time First-year Students Receiving Financial Aid 8.27 Full-time First-year Students Receiving Federal Grant Aid Percent Receiving Aid 8.28 Average Amount of Federal Grant Aid Received 8.28 Full-time First-year Students Receiving State and Local Grant Aid Percent Receiving Aid 8.29 Average Amount of Aid Received 8.29 Full-time First-year Students Receiving Institutional Grant Aid Percent Receiving Aid 8.30 Average Amount of Aid Received 8.30 Full-time First-year Students Receiving Student Loan Aid Percent Receiving Aid 8.31 Average Amount of Aid Received 8.31

Peer ComparisonsData Sources:
The data used for the peer comparisons section of this book come from:
Academe - Bulletin of the American Association of University Professors (Academe)National Center for Education Statistics - Integrated Postsecondary Education Data System (IPEDS)National Association of College and University Business Officers (NACUBO)U.S. News & World Report's "America's Best Colleges 2009" (US News & World Report)
Peer Institution List:
The following list of schools was selected by executive administration for benchmarking purposes:California Institute of Technology (Cal Tech)Cornell University (Cornell)Duke University (Duke)Emory University (Emory)Georgia Institute of Technology (Georgia Tech)Massachusetts Institute of Technology (MIT)Northwestern University (Northwestern)University of Pennsylvania (Penn)Princeton University (Princeton)Rensselaer Polytechnic Institute (RPI)Rice University (Rice)Stanford University (Stanford)Washington University in St. Louis (Washington)
Ethnicity Categories:
Non-resident Alien: A person who is not a citizen or national of the United States and is in this country on a visa or temporary basis, regardless of race
Other: Includes White, Asian/Pacific Islander, and Unknown
Under-represented Minority: Includes US Citizens and Permanent Residents who self-identify race as African American/Black, American Indian/Alaskan Native, or Hispanic
Definitions:
Degree Disciplines: All degree disciplines are categorized according to their Classification of Instructional Programs (CIP) codeArchitecture, Visual, and Performing Arts: Includes Architecture and related services; visual and performing artsBusiness Management, Marketing, and Related Support Services: Includes business, management, marketing, and related support servicesComputer and Information Sciences: Includes computer and information sciences and support servicesEngineering: Includes engineering; engineering technologies/techniciansHumanities and Social Sciences: Includes area, ethnic, cultural, and gender studies; communication, journalism, and related programs; communications technologies/technicians and support services; foreign languages, literatures, and linguistics; english language and literature/letters; liberal arts and sciences, general studies and humanities; philosophy and religious studies; theology and religious vocations; psychology; social sciences; historyMathematics, Statistics, Biological and Physical Sciences: Includes biological and biomedical sciences; mathematics and statistics; physical sciences
Other Disciplines: Includes agriculture, agriculture operations, and related sciences; natural resources and conservation; personal and culinary services; education; family and consumer sciences/human sciences; legal professions and studies; library science; military technologies; multi/interdisciplinary studies; parks, recreation, leisure, and fitness studies; science technologies/technicians; security and protective services; construction trades; mechanic repair technologies/technicians; precision production; transportation and materials moving; health professions and related clinical sciencesPublic Administration and Social Services: Includes public administration and social services professions
Expenditures: Includes the following institutional expenses: Instruction, research, public service, academic support, student services, and institutional support
Faculty Compensation: Sum of salaries and benefits
8.1

Federal Grant Aid: Includes grants that were provided by federal agencies such as the U.S. Department of Education, including Title IV Pell Grants and Supplemental Educational Opportunity Grants (SEOGs). Also includes need-based and merit-based educational assistance funds and training vouchers provided from other federal agencies and/or federally-sponsored educational benefits programs, including the Veteran's Administration, Department of Labor, etc.
First-time First-year Retention Rate: The percent of first-time first-year students who return for their sophomore year
Institutional Grant Aid: Includes scholarships and fellowships that were granted and funded by the institution and/or individual departments within the institution (and are limited to students attending the institution). Also includes tuition and fee waivers granted by the institution (for which the institution is not reimbursed from another source). These would include scholarships targeted to certain groups of individuals (from a particular state or studying a certain subject) for which the institution designated the recipient; athletic scholarships; etc.
Runzheimer Indices: Indices to adjust salaries for cost of living; adjusts salaries to a standard U.S. city
SAT 25th-75th Percentile Range: The range in which the middle 50% of the first-time freshmen scored on their SATs
Six-Year Graduation Rate: The percent of first-time first-year students who graduate within six years
State/Local Grant Aid: Includes grants that were provided by your state such as Leveraging Educational Assistance Partnerships (LEAP) (formerly SSIGs). Also includes merit scholarships that were provided by your state and tuition and fee waivers for which your institution was reimbursed by a state agency. Local grants would include any local government grants, scholarships or gift-aid that are awarded directly to the student.
Student Loan Aid: Includes all Title IV subsidized and unsubsidized loans made directly to students and for which the student is the designated borrower. (Include Perkins Loans made to students.) Exclude PLUS and other loans made directly to parents and for which the parent is the designated borrower. Also includes all institutionally- and privately-sponsored loans made to students, for which the student is the designated borrower (as long as the funds pass through the financial aid office).
Student to Faculty Ratio: The total full-time equivalent (FTE) enrollment of students divided by the total full-time equivalent (FTE) of instructional faculty. For this calculation, FTE is equal to full-time headcount plus one-third part-time headcount.
Other Notes: Carnegie Mellon enrollment figures do not include Qatar enrollment per IPEDS reporting guidelines.
8.2
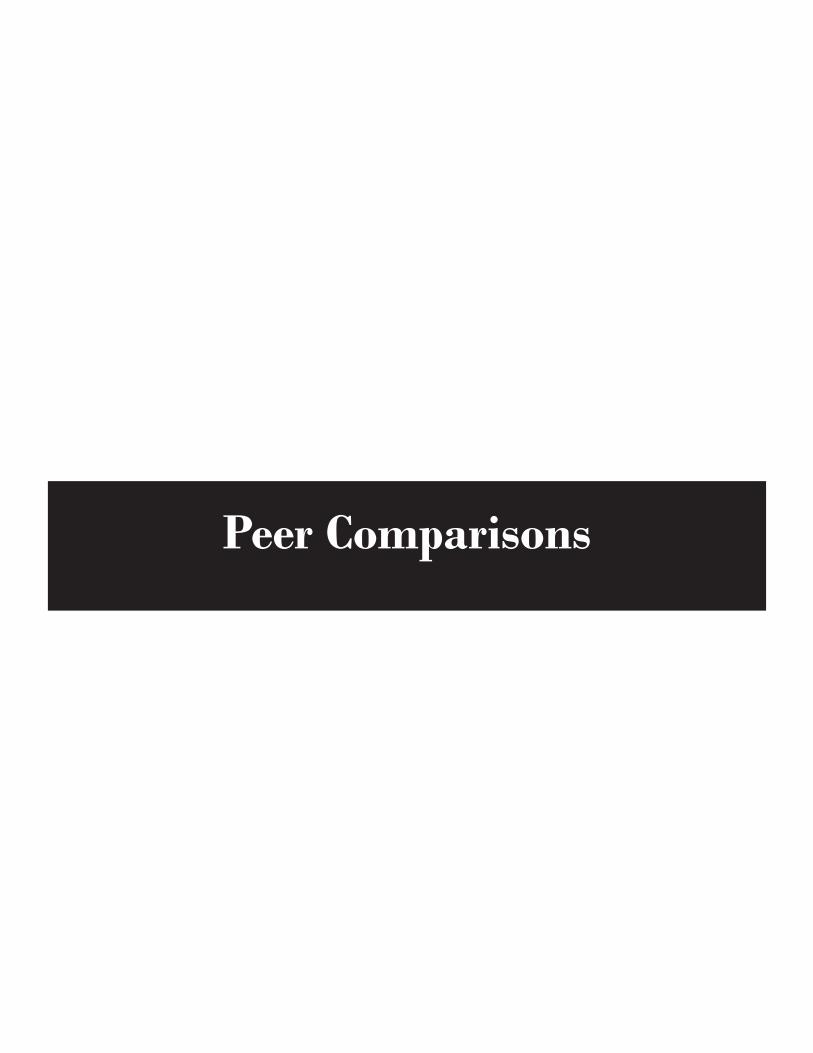
Total EnrollmentCarnegie Mellon vs. Peer Institutions
Fall 2007
2,133
10,326
19,800
13,598 12,570
18,742
10,220
19,005
23,980
7,261 6,5665,161
19,782
13,382
0
5,000
10,000
15,000
20,000
25,000
30,000
Cal Tec
h
Carneg
ie Mell
on
Cornell
Duke
Emory
Georg
ia Tec
hMIT
Northwes
tern
Penn
Prince
tonRPI
Rice
Stanford
Washington
Source: IPEDS
Total Enrollment by LevelCarnegie Mellon vs. Peer Institutions
Fall 2007
0%
20%
40%
60%
80%
100%
Cal Tec
h
Carneg
ie Mell
on
Cornell
Duke
Emory
Georg
ia Tec
hMIT
Northwes
tern
Penn
Prince
tonRPI
Rice
Stanford
Washington
% Undergraduate % First-professional % GraduateSource: IPEDS
Enrollment: 2,133 10,326 19,800 13,598 12,570 18,742 10,220 19,005 23,980 7,261 6,566 5,161 19,782 13,382
8.3

Undergraduate EnrollmentCarnegie Mellon vs. Peer Institutions
Fall 2007
913
5,682
13,510
6,394 6,719
12,565
4,172
9,261
11,877
4,845 5,164
3,017
6,5847,253
0
2,000
4,000
6,000
8,000
10,000
12,000
14,000
16,000
Cal Tec
h
Carneg
ie Mell
on
Cornell
Duke
Emory
Georg
ia Tec
hMIT
Northwes
tern
Penn
Prince
tonRPI
Rice
Stanford
Washington
Source: IPEDS
Undergraduate Enrollment by Full-time/Part-time StatusCarnegie Mellon vs. Peer Institutions
Fall 2007
0%
20%
40%
60%
80%
100%
Cal Tec
h
Carneg
ie Mell
on
Cornell
Duke
Emory
Georg
ia Tec
hMIT
Northwes
tern
Penn
Prince
tonRPI
Rice
Stanford
Washington
% Full-time % Part-timeSource: IPEDS
913 5,682 13,510 6,394 6,719 12,565 4,172 9,261 11,877 4,845 5,164 3,017 6,584 7,253Enrollment:
8.4

Undergraduate Enrollment by EthnicityCarnegie Mellon vs. Peer Institutions
Fall 2007
0%
20%
40%
60%
80%
100%
Cal Tec
h
Carneg
ie Mell
on
Cornell
Duke
Emory
Georg
ia Tec
hMIT
Northwes
tern
Penn
Prince
tonRPI
Rice
Stanford
Washington
% Under-represented Minority % Non-resident Alien % OtherSource: IPEDS
913 5,682 13,510 6,394 6,719 12,565 4,172 9,261 11,877 4,845 5,164 3,017 6,584 7,253Enrollment:
Undergraduate Enrollment by GenderCarnegie Mellon vs. Peer Institutions
Fall 2007
0%
20%
40%
60%
80%
100%
Cal Tec
h
Carneg
ie Mell
on
Cornell
Duke
Emory
Georg
ia Tec
hMIT
Northwes
tern
Penn
Prince
tonRPI
Rice
Stanford
Washington
% Men % WomenSource: IPEDS
913 5,682 13,510 6,394 6,719 12,565 4,172 9,261 11,877 4,845 5,164 3,017 6,584 7,253Enrollment:
8.5

Graduate EnrollmentCarnegie Mellon vs. Peer Institutions
Fall 2007
1,220
4,6445,375 5,517
4,159
6,177 6,048
8,294
9,730
2,4161,402
2,144
12,160
4,864
0
2,000
4,000
6,000
8,000
10,000
12,000
14,000
Cal Tec
h
Carneg
ie Mell
on
Cornell
Duke
Emory
Georg
ia Tec
hMIT
Northwes
tern
Penn
Prince
tonRPI
Rice
Stanford
Washington
Source: IPEDS
Graduate Enrollment by Full-time/Part-time StatusCarnegie Mellon vs. Peer Institutions
Fall 2007
0%
20%
40%
60%
80%
100%
Cal Tec
h
Carneg
ie Mell
on
Cornell
Duke
Emory
Georg
ia Tec
hMIT
Northwes
tern
Penn
Prince
tonRPI
Rice
Stanford
Washington
% Full-time % Part-timeSource: IPEDS
Enrollment: 1,220 4,644 5,375 5,517 4,159 6,177 6,048 8,294 9,730 2,416 1,402 2,144 12,160 4,864
8.6
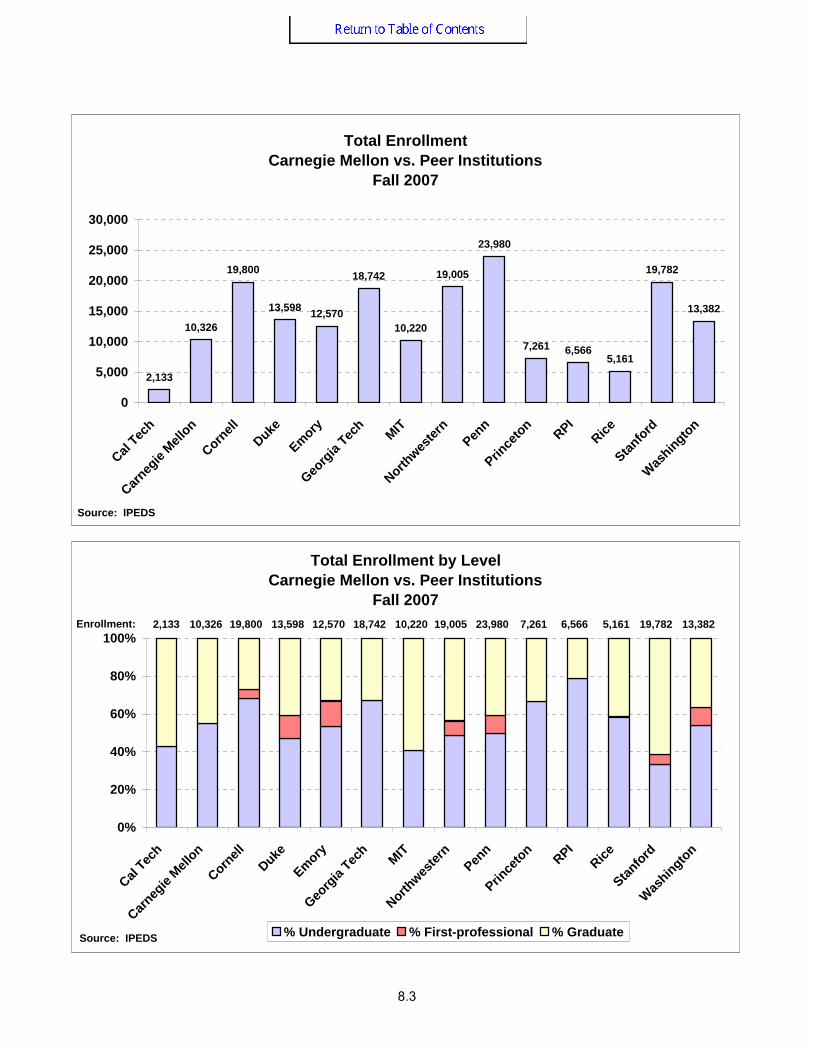
Graduate Enrollment by GenderCarnegie Mellon vs. Peer Institutions
Fall 2007
0%
20%
40%
60%
80%
100%
Cal Tec
h
Carneg
ie Mell
on
Cornell
Duke
Emory
Georg
ia Tec
hMIT
Northwes
tern
Penn
Prince
tonRPI
Rice
Stanford
Washington
% Men % WomenSource: IPEDS
1,220 4,644 5,375 5,517 4,159 6,177 6,048 8,294 9,730 2,416 1,402 2,144 12,160 4,864Enrollment:
Graduate Enrollment by EthnicityCarnegie Mellon vs. Peer Institutions
Fall 2006
0%
20%
40%
60%
80%
100%
Cal Tec
h
Carneg
ie Mell
on
Cornell
Duke
Emory
Georg
ia Tec
hMIT
Northwes
tern
Penn
Prince
tonRPI
Rice
Stanford
Washington
% Under-represented Minority % Non-resident Alien % OtherSource: IPEDS
1,220 4,644 5,375 5,517 4,159 6,177 6,048 8,294 9,730 2,416 1,402 2,144 12,160 4,864Enrollment:
8.7

Total Degrees Awarded by LevelCarnegie Mellon vs. Peer Institutions
Academic Year 2006-07
0%
20%
40%
60%
80%
100%
Cal Te
ch
Carneg
ie Mello
n
Cornell
Duke
Emory
Georg
ia Tec
hMIT
Northw
ester
nPen
n
Prince
ton Rice RPI
Stanfor
d
Washin
gton
%Bachelor %Masters %Doctoral %Other
486 2,919 5,920 3,747 3,623 4,301 3,209 5,632 6,957 1,860 1,448 1,765 4,815 3,649Degrees:
Source: IPEDS
Total Degrees AwardedCarnegie Mellon vs. Peer Institutions
Academic Year 2006-07
486
2,919
5,920
3,747 3,6264,301
3,209
5,632
6,957
1,8601,448
1,765
4,815
3,649
0
1,000
2,000
3,000
4,000
5,000
6,000
7,000
8,000
Cal Te
ch
Carneg
ie Mello
n
Cornell
Duke
Emory
Georg
ia Tec
hMIT
Northw
ester
nPen
n
Prince
ton Rice RPI
Stanfor
d
Washin
gton
Source: IPEDS
8.8

Total Degrees Awarded by GenderCarnegie Mellon vs. Peer Institutions
Academic Year 2006-07
0%
20%
40%
60%
80%
100%
Cal Te
ch
Carneg
ie Mello
n
Cornell
Duke
Emory
Georg
ia Tec
hMIT
Northw
ester
nPen
n
Prince
ton Rice RPI
Stanfor
d
Washin
gton
%Men %WomenSource: IPEDS
Degrees: 486 2,919 5,920 3,747 3,623 4,301 3,209 5,632 6,957 1,860 1,448 1,765 4,815 3,649
Total Degrees Awarded by EthnicityCarnegie Mellon vs. Peer Institutions
Academic Year 2006-07
0%
20%
40%
60%
80%
100%
Cal Te
ch
Carneg
ie Mello
n
Cornell
Duke
Emory
Georg
ia Tec
hMIT
Northw
ester
nPen
n
Prince
ton Rice RPI
Stanfor
d
Washin
gton
%Under-represented Minority %Non-resident Alien %OtherSource: IPEDS
Degrees: 486 2,919 5,920 3,747 3,623 4,301 3,209 5,632 6,957 1,860 1,448 1,765 4,815 3,649
8.9
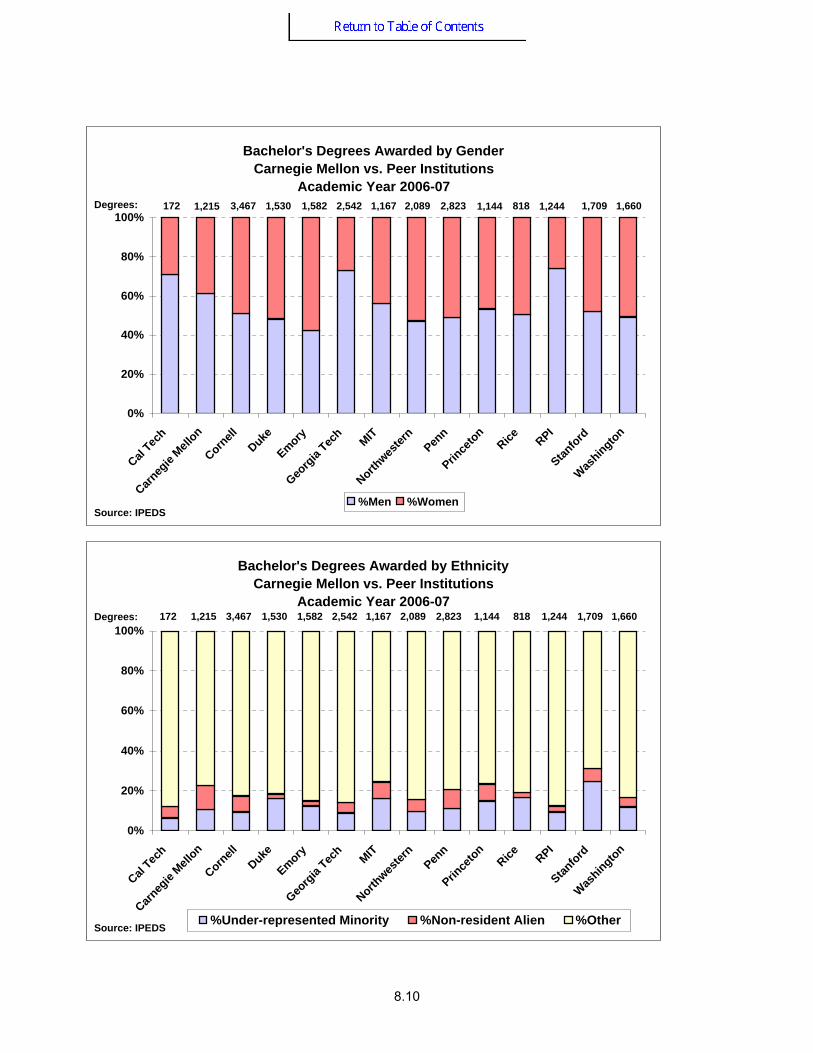
Bachelor's Degrees Awarded by GenderCarnegie Mellon vs. Peer Institutions
Academic Year 2006-07
0%
20%
40%
60%
80%
100%
Cal Te
ch
Carneg
ie Mello
n
Cornell
Duke
Emory
Georg
ia Tec
hMIT
Northw
ester
nPen
n
Prince
ton Rice RPI
Stanfor
d
Washin
gton
%Men %Women
172 1,215 3,467 1,530 1,582 2,542 1,167 2,089 2,823 1,144 818 1,244 1,709 1,660Degrees:
Source: IPEDS
Bachelor's Degrees Awarded by EthnicityCarnegie Mellon vs. Peer Institutions
Academic Year 2006-07
0%
20%
40%
60%
80%
100%
Cal Te
ch
Carneg
ie Mello
n
Cornell
Duke
Emory
Georg
ia Tec
hMIT
Northw
ester
nPen
n
Prince
ton Rice RPI
Stanfor
d
Washin
gton
%Under-represented Minority %Non-resident Alien %OtherSource: IPEDS
Degrees: 172 1,215 3,467 1,530 1,582 2,542 1,167 2,089 2,823 1,144 818 1,244 1,709 1,660
8.10

Carnegie Mellon Versus Peer Institutions A
rchi
tect
ure,
Vi
sual
, and
Pe
rfor
min
g A
rts
Engi
neer
ing
Publ
ic A
dmin
-
istr
atio
n an
d So
cial
Svc
s.
Hum
aniti
es
an
d So
cial
Sc
ienc
es
Mat
hem
atic
s1
Com
pute
r and
In
form
atio
n Sc
ienc
es
Bus
ines
s2
Oth
er
Tota
l
B
ache
lor's
Cal Tech - 31% - 6% 53% 9% - - 172
Carnegie Mellon 13% 30% 2% 16% 11% 9% 10% 8% 1,215
Cornell 6% 19% 2% 23% 16% 3% 13% 19% 3,467
Duke 3% 14% 10% 49% 17% 2% - 5% 1,530
Emory 3% - - 51% 12% - 17% 17% 1,582
Georgia Tech 6% 58% 1% 4% 7% 8% 14% 2% 2,542
MIT 3% 37% - 6% 28% 12% 8% 5% 1,167
Northwestern 12% 14% 3% 58% 8% 1% 1% 3% 2,089
Penn 3% 9% - 46% 8% - 21% 13% 2,823
Princeton 6% 15% 7% 56% 16% - - - 1,144
Rice 12% 16% - 43% 21% 2% - 6% 818
RPI 4% 55% - 5% 12% 13% 8% 3% 1,244
Stanford 3% 15% 2% 45% 17% 4% - 14% 1,709
Washington 12% 13% - 43% 10% 3% 14% 4% 1,660
1. Mathematics - Mathematics, Statistics, Biological, and Physical Sciences2. Business - Business Management, Marketing, and Related Support Services
Bachelor's Degrees Awarded by Discipline
Academic Year 2006-07
8.11
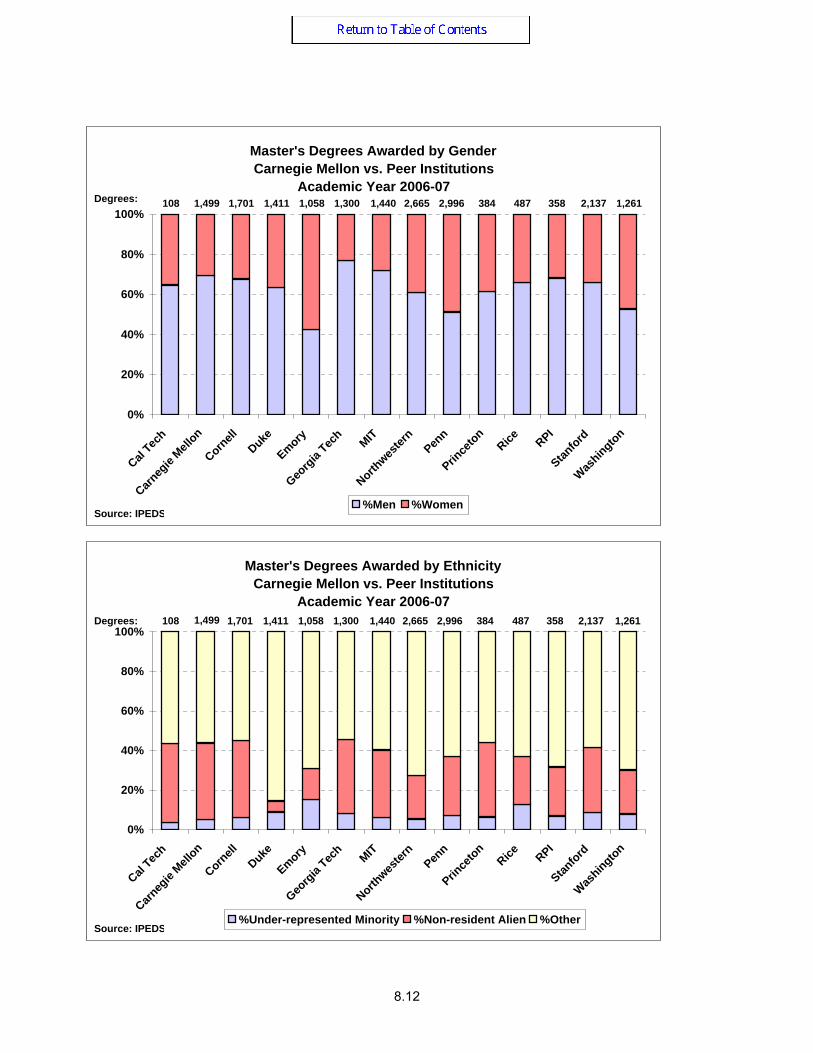
Master's Degrees Awarded by GenderCarnegie Mellon vs. Peer Institutions
Academic Year 2006-07
0%
20%
40%
60%
80%
100%
Cal Te
ch
Carneg
ie Mello
n
Cornell
Duke
Emory
Georg
ia Tec
hMIT
Northw
ester
nPen
n
Prince
ton Rice RPI
Stanfor
d
Washin
gton
%Men %Women
108 1,499 1,701 1,411 1,058 1,300 1,440 2,665 2,996 384 487 358 2,137 1,261Degrees:
Source: IPEDS
Master's Degrees Awarded by EthnicityCarnegie Mellon vs. Peer Institutions
Academic Year 2006-07
0%
20%
40%
60%
80%
100%
Cal Te
ch
Carneg
ie Mello
n
Cornell
Duke
Emory
Georg
ia Tec
hMIT
Northw
ester
nPen
n
Prince
ton Rice RPI
Stanfor
d
Washin
gton
%Under-represented Minority %Non-resident Alien %Other
Degrees:
Source: IPEDS
108 1,499 1,701 1,411 1,058 1,300 1,440 2,665 2,996 384 487 358 2,137 1,261
8.12

Arc
hite
ctur
e,
Visu
al, a
nd
Perf
orm
ing
Art
s
Engi
neer
ing
Publ
ic A
dmin
-
istr
atio
n an
d So
cial
Svc
s.
Hum
aniti
es
an
d So
cial
Sc
ienc
es
Mat
hem
atic
s1
Com
pute
r and
In
form
atio
n Sc
ienc
es
Bus
ines
s2
Oth
er
Tota
l
M
aste
r's
Cal Tech - 69% - 5% 22% 4% - 1% 108
Carnegie Mellon 9% 21% 9% 7% 4% 19% 30% 3% 1,499
Cornell 6% 27% 3% 9% 7% 7% 31% 10% 1,701
Duke - 9% 3% 14% 3% 1% 52% 18% 1,411
Emory 1% - - 9% 10% - 34% 45% 1,058
Georgia Tech 8% 52% 1% 4% 7% 12% 13% 3% 1,300
MIT 10% 42% - 4% 2% 9% 33% - 1,441
Northwestern 3% 8% 1% 17% 2% 2% 50% 16% 2,665
Penn 7% 7% 7% 10% 5% 3% 33% 28% 2,996
Princeton 8% 25% 24% 25% 14% - 4% - 384
Rice 15% 11% - 8% 17% 3% 44% 2% 487
RPI 8% 35% - 2% 8% 14% 30% 4% 358
Stanford 1% 40% - 11% 10% 7% 21% 10% 2,137
Washington 6% 14% 14% 9% 8% 6% 30% 13% 1,261
1. Mathematics - Mathematics, Statistics, Biological, and Physical Sciences2. Business - Business Management, Marketing, and Related Support Services
Master's Degrees Awarded by Discipline Carnegie Mellon Versus Peer Institutions Academic Year 2006-07
8.13

Doctoral Degrees Awarded by GenderCarnegie Mellon vs. Peer Institutions
Academic Year 2006-07
0%
20%
40%
60%
80%
100%
Cal Te
ch
Carneg
ie Mello
n
Cornell
Duke
Emory
Georg
ia Tec
hMIT
Northw
ester
nPen
n
Prince
ton Rice RPI
Stanfor
d
Washin
gton
%Men %Women
206 205 485 277 217 459 601 462 483 332 143 163 720 347Degrees:
Source: IPEDS
Doctoral Degrees Awarded by EthnicityCarnegie Mellon vs. Peer Institutions
Academic Year 2006-07
0%10%20%30%40%50%60%70%80%90%
100%
Cal Te
ch
Carneg
ie Mello
n
Cornell
Duke
Emory
Georg
ia Tec
hMIT
Northw
ester
nPen
n
Prince
ton Rice RPI
Stanfor
d
Washin
gton
%Under-represented Minority %Non-resident Alien %Other
Degrees:
Source: IPEDS
206 205 485 277 217 459 601 462 483 332 143 163 720 347
8.14

Arc
hite
ctur
e,
Visu
al, a
nd
Perf
orm
ing
Art
s
Engi
neer
ing
Publ
ic A
dmin
-
istr
atio
n an
d So
cial
Svc
s.
Hum
aniti
es
an
d So
cial
Sc
ienc
es
Mat
hem
atic
s1
Com
pute
r and
In
form
atio
n Sc
ienc
es
Bus
ines
s2
Oth
er
Tota
l
D
octo
ral
Cal Tech - 40% - 3% 50% 1% - 6% 206
Carnegie Mellon 1% 42% - 5% 18% 25% 7% 1% 205
Cornell 4% 21% - 19% 33% 4% 2% 17% 485
Duke 2% 14% - 26% 30% 3% 6% 19% 277
Emory - 5% - 40% 36% - 1% 18% 217
Georgia Tech 2% 73% 1% 1% 15% 6% 2% - 459
MIT 3% 49% - 9% 23% 7% 3% 6% 601
Northwestern 6% 21% - 23% 24% 1% 4% 21% 462
Penn 2% 10% 1% 25% 29% 4% 6% 21% 483
Princeton 4% 27% 1% 37% 31% - - - 332
Rice 3% 26% - 24% 38% 9% - - 143
RPI - 60% - 4% 18% 10% 3% 4% 163
Stanford 2% 33% - 18% 28% 4% 3% 12% 720
Washington 1% 9% 3% 12% 36% 3% 3% 34% 347
1. Mathematics - Mathematics, Statistics, Biological, and Physical Sciences2. Business - Business Management, Marketing, and Related Support Services
Doctoral Degrees Awarded by Discipline Carnegie Mellon Versus Peer Institutions Academic Year 2006-07
8.15

First-time First-year Retention RateCarnegie Mellon vs. Peer Institutions
Fall 2006 Cohort98%
94% 96% 97% 94% 92%98% 97% 98% 98%
92%97% 98% 97%
0%
20%
40%
60%
80%
100%
Cal Tec
h
Carneg
ie Mell
on
Cornell
Duke
Emory
Georg
ia Tec
hMIT
Northwes
tern
Penn
Prince
tonRPI
Rice
Stanford
Washington
Source: IPEDS
Six-year Graduation RateCarnegie Mellon vs. Peer Institutions
Fall 2001 Cohort
89% 87%92% 94%
88%78%
93% 93% 95% 95%
82%91% 95% 92%
0%
20%
40%
60%
80%
100%
Cal Tec
h
Carneg
ie Mell
on
Cornell
Duke
Emory
Georg
ia Tec
hMIT
Northwes
tern
Penn
Prince
tonRPI
Rice
Stanford
Washington
Source: US News & World Report
8.16
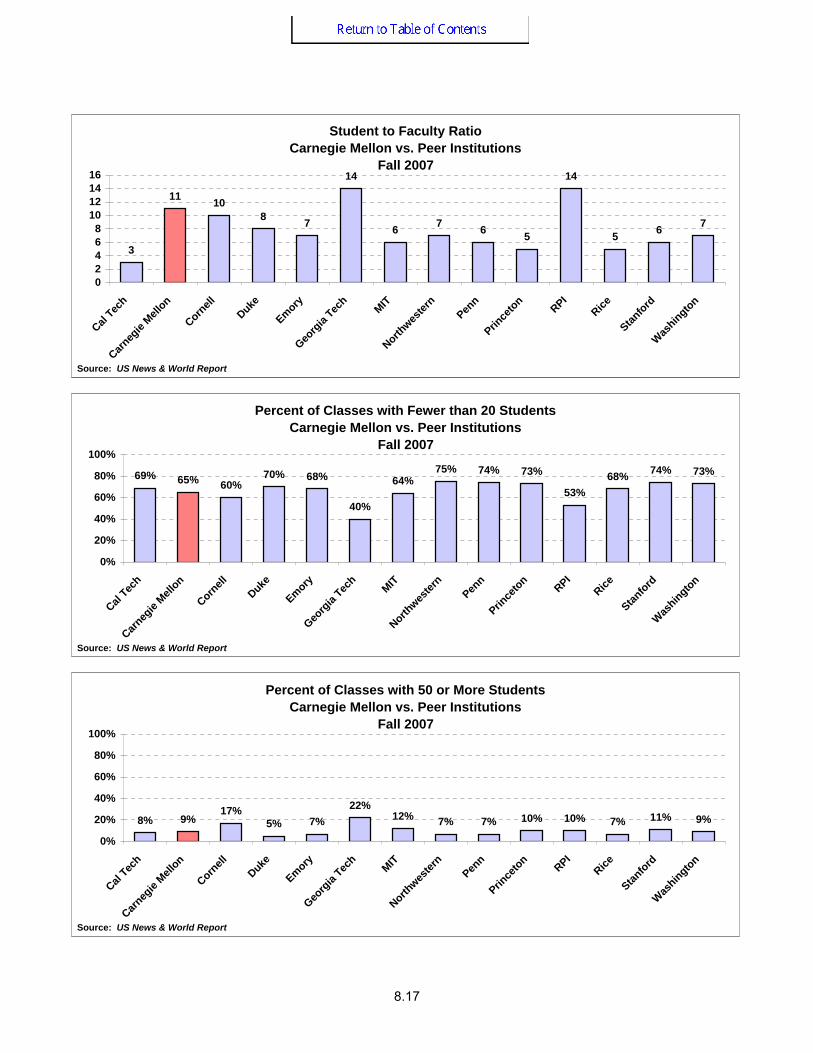
Student to Faculty RatioCarnegie Mellon vs. Peer Institutions
Fall 2007
3
11 108 7
14
6 7 6 5
14
5 6 7
02468
10121416
Cal Tec
h
Carneg
ie Mell
on
Cornell
Duke
Emory
Georg
ia Tec
hMIT
Northwes
tern
Penn
Prince
tonRPI
Rice
Stanford
Washington
Source: US News & World Report
Percent of Classes with Fewer than 20 StudentsCarnegie Mellon vs. Peer Institutions
Fall 2007
69% 65% 60%70% 68%
40%
64%75% 74% 73%
53%68% 74% 73%
0%
20%
40%
60%
80%
100%
Cal Tec
h
Carneg
ie Mell
on
Cornell
Duke
Emory
Georg
ia Tec
hMIT
Northwes
tern
Penn
Prince
tonRPI
Rice
Stanford
Washington
Source: US News & World Report
Percent of Classes with 50 or More StudentsCarnegie Mellon vs. Peer Institutions
Fall 2007
8% 9%17%
5% 7%22%
12% 7% 7% 10% 10% 7% 11% 9%
0%
20%
40%
60%
80%
100%
Cal Tec
h
Carneg
ie Mell
on
Cornell
Duke
Emory
Georg
ia Tec
hMIT
Northwes
tern
Penn
Prince
tonRPI
Rice
Stanford
Washington
Source: US News & World Report
8.17

First-time First-year EnrollmentCarnegie Mellon vs. Peer Institutions
Fall 2007
231
1,416
3,010
1,700 1,606
2,628
1,067
1,981
2,385
1,242 1,288
742
1,721
1,338
0
500
1,000
1,500
2,000
2,500
3,000
3,500
Cal Tec
h
Carneg
ie Mell
on
Cornell
Duke
Emory
Georg
ia Tec
hMIT
Northwes
tern
Penn
Prince
tonRPI
Rice
Stanford
Washington
Source: IPEDS
8.18

First-time First-year Enrollment by GenderCarnegie Mellon vs. Peer Institutions
Fall 2007
0%
20%
40%
60%
80%
100%
Cal Tec
h
Carneg
ie Mell
on
Cornell
Duke
Emory
Georg
ia Tec
hMIT
Northwes
tern
Penn
Prince
tonRPI
Rice
Stanford
Washington
% Men % WomenSource: IPEDS
Enrollment: 230 1,416 3,010 1,700 1,606 2,628 1,067 1,981 2,385 1,242 1,288 742 1,721 1,338
First-time First-year Enrollment by EthnicityCarnegie Mellon vs. Peer Institutions
Fall 2007
0%
20%
40%
60%
80%
100%
Cal Tec
h
Carneg
ie Mell
on
Cornell
Duke
Emory
Georg
ia Tec
hMIT
Northwes
tern
Penn
Prince
tonRPI
Rice
Stanford
Washington
% Under-represented Minority % Non-resident Alien % OtherSource: IPEDS
230 1,416 3,010 1,700 1,606 2,628 1,067 1,981 2,385 1,242 1,288 742 1,721 1,338Enrollment:
8.19

Acceptance RateCarnegie Mellon vs. Peer Institutions
Fall 2007
17%
28%21% 23%
32%
63%
12%
30%
16%10%
49%
25%
10%17%
0%
20%
40%
60%
80%
100%
Cal Tec
h
Carneg
ie Mell
on
Cornell
Duke
Emory
Georg
ia Tec
hMIT
Northwes
tern
Penn
Prince
tonRPI
Rice
Stanford
Washington
Source: IPEDS
First-time First-year YieldCarnegie Mellon vs. Peer Institutions
Fall 2007
38%
23%
46%41%
30%
45%
69%
38%
66% 68%
26%33%
70%
34%
0%
20%
40%
60%
80%
100%
Cal Tec
h
Carneg
ie Mell
on
Cornell
Duke
Emory
Georg
ia Tec
hMIT
Northwes
tern
Penn
Prince
tonRPI
Rice
Stanford
Washington
Source: IPEDS
8.20

SAT 25th-75th Percentile RangeCarnegie Mellon vs. Peer Institutions
Fall 2007
1000
1100
1200
1300
1400
1500
1600
0 1 2 3 4 5 6 7 8 9 10 11 12 13 14 15
Ric
e
Cal
Tec
h
Car
negi
e M
ello
n
Cor
nell
Duk
e
Emor
y
Geo
rgia
Tec
h
MIT
Nor
thw
este
rn
Penn
Prin
ceto
n
RPI
Stan
ford
Was
hing
ton
Source: US News & World Report
Proportion of Incoming First-years in Top 10% of High School ClassCarnegie Mellon vs. Peer Institutions
Fall 2007 Cohort99%
73%
87% 90% 88%
66%
97%
85%
96% 96%
64%
83%91%
95%
0%
20%
40%
60%
80%
100%
Cal Tec
h
Carneg
ie Mell
on*
Cornell
Duke
Emory*
Georg
ia Tec
hMIT
Northwes
tern
Penn
Prince
ton*RPI
Rice
Stanford
Washington
Source: US News & World Report (*Fewer than 51% of entering first-year students reporting)
8.21

Average Faculty Compensation - Professors(Compensation Adjusted Using Runzheimer Indices)
Carnegie Mellon vs. Peer InstitutionsAcademic Year 2007-08
$145
,563
$140
,990
$178
,415
$196
,397
$185
,702
$159
,414
$131
,423
$151
,007
$177
,914
$165
,374
$152
,312
$130
,962
$169
,648
$0
$50,000
$100,000
$150,000
$200,000
$250,000
Cal Tec
h
Carneg
ie Mell
on
Cornell
Duke
Emory
Georg
ia Tec
hMIT
Northwes
tern
Penn
Prince
tonRice
Stanford
Washington
Source: Academe
Average Peer Professor Compensation = $162,011
Average Faculty Compensation - Associate Professors(Compensation Adjusted Using Runzheimer Indices)
Carnegie Mellon vs. Peer InstitutionsAcademic Year 2007-08
$107
,266
$108
,240
$123
,286
$133
,248
$111
,571
$108
,622
$101
,521
$100
,038
$122
,242
$114
,814
$100
,659
$80,
384
$105
,370
$0
$20,000
$40,000
$60,000
$80,000
$100,000
$120,000
$140,000
Cal Tec
h
Carneg
ie Mell
on
Cornell
Duke
Emory
Georg
ia Tec
hMIT
Northwes
tern
Penn
Prince
tonRice
Stanford
Washington
Source: Academe
Average Peer Associate Professor Compensation = $109,085
8.22

Average Faculty Compensation - Assistant Professors(Compensation Adjusted Using Runzheimer Indices)
Carnegie Mellon vs. Peer InstitutionsAcademic Year 2007-08
$92,
383
$94,
395
$108
,088
$111
,387
$103
,215
$96,
432
$89,
939
$87,
882
$118
,886
$100
,069
$89,
267
$60,
928
$85,
030
$0
$20,000
$40,000
$60,000
$80,000
$100,000
$120,000
$140,000
Cal Tec
h
Carneg
ie Mell
on
Cornell
Duke
Emory
Georg
ia Tec
hMIT
Northwes
tern
Penn
Prince
tonRice
Stanford
Washington
Source: Academe
Average Peer Assistant Professor Compensation = $95,292
Proportion of Instructional Faculty who are Full-timeCarnegie Mellon vs. Peer Institutions
Fall 2007
98%93%
98% 97% 95%100%
90%96%
86%93% 95% 93%
99%94%
0%
20%
40%
60%
80%
100%
Cal Tec
h
Carneg
ie Mell
on
Cornell
Duke
Emory
Georg
ia Tec
hMIT
Northwes
tern
Penn
Prince
tonRPI
Rice
Stanford
Washington
Source: US News & World Report
8.23

University Endowment Funds ($000)Carnegie Mellon vs. Peer Institutions
Fiscal Year 2007
$1,8
60,0
52
$1,1
15,7
40 $5,4
24,7
33
$5,9
10,2
80
$5,5
61,7
43
$327
,520
$9,9
80,4
10
$6,5
03,2
92
$6,6
35,1
87
$15,
787,
200
$812
,996 $4
,669
,544
$17,
164,
836
$5,5
67,8
43
$0$2,000,000$4,000,000$6,000,000$8,000,000
$10,000,000$12,000,000$14,000,000$16,000,000$18,000,000$20,000,000
Cal Tec
h
Carneg
ie Mell
on
Cornell
Duke
Emory
Georg
ia Tec
hMIT
Northwes
tern
Penn
Prince
tonRPI
Rice
Stanford
Washington U
niv
Endo
wm
ent F
unds
($00
0)
Source: NACUBO
Average Peer Institution Endowment Funds ($000) = $6,631,203
University Endowment Assets per FTE Student ($000)Carnegie Mellon vs. Peer Institutions
Fiscal Year 2007
$891
$119 $2
76 $475
$458
$19
$973
$397
$317
$2,2
28
$127
$946 $1
,152
$473
$0
$500
$1,000
$1,500
$2,000
$2,500
Cal Tec
h
Carneg
ie Mell
on
Cornell
Duke
Emory
Georg
ia Tec
hMIT
Northwes
tern
Penn
Prince
tonRPI
Rice
Stanford
Washington U
nivEndo
wm
ent A
sset
s pe
r FTE
Stu
dent
($00
0)
Source: NACUBO
Average Peer Institution Endowment Assets per FTE Student ($000) = $672
8.24

Expenditures per FTE Student ($000)Carnegie Mellon vs. Peer Institutions
Fiscal Year 2007
$236
$77 $72
$128
$93
$40
$211
$74
$110 $108
$48$69
$145 $139
$0
$50
$100
$150
$200
$250
Cal Tec
h
Carneg
ie Mell
on
Cornell
Duke
Emory
Georg
ia Tec
hMIT
Northwes
tern
Penn
Prince
tonRPI
Rice
Stanford
WashingtonEx
pend
iture
s pe
r FTE
Stu
dent
($00
0)
Source: IPEDS
Average Peer Institution Expenditures per FTE Student ($000) = $113.4
8.25
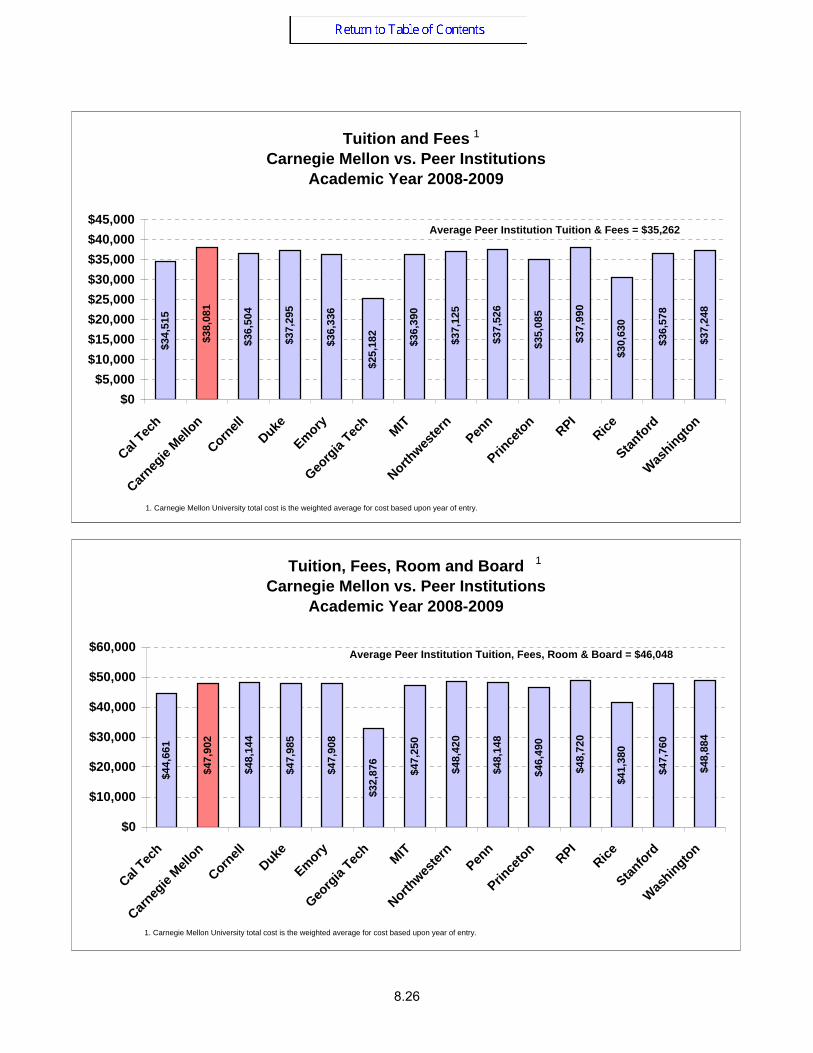
Tuition and FeesCarnegie Mellon vs. Peer Institutions
Academic Year 2008-2009$3
4,51
5
$38,
081
$36,
504
$37,
295
$36,
336
$25,
182
$36,
390
$37,
125
$37,
526
$35,
085
$37,
990
$30,
630
$36,
578
$37,
248
$0$5,000
$10,000$15,000$20,000$25,000$30,000$35,000$40,000$45,000
Cal Tec
h
Carneg
ie Mell
on
Cornell
Duke
Emory
Georg
ia Tec
hMIT
Northwes
tern
Penn
Prince
tonRPI
Rice
Stanford
Washington
Average Peer Institution Tuition & Fees = $35,262
1
1. Carnegie Mellon University total cost is the weighted average for cost based upon year of entry.
Tuition, Fees, Room and BoardCarnegie Mellon vs. Peer Institutions
Academic Year 2008-2009
$44,
661
$47,
902
$48,
144
$47,
985
$47,
908
$32,
876
$47,
250
$48,
420
$48,
148
$46,
490
$48,
720
$41,
380
$47,
760
$48,
884
$0
$10,000
$20,000
$30,000
$40,000
$50,000
$60,000
Cal Tec
h
Carneg
ie Mell
on
Cornell
Duke
Emory
Georg
ia Tec
hMIT
Northwes
tern
Penn
Prince
tonRPI
Rice
Stanford
Washington
Average Peer Institution Tuition, Fees, Room & Board = $46,048
1. Carnegie Mellon University total cost is the weighted average for cost based upon year of entry.
1
8.26

Full-time First-year EnrollmentCarnegie Mellon vs. Peer Institutions
Fall 2006 Cohort
231
1,416
3,010
1,700 1,606
2,628
1,067
1,981
2,385
1,242 1,288
742
1,721
1,338
0
500
1,000
1,500
2,000
2,500
3,000
3,500
Cal Tec
h
Carneg
ie Mell
on
Cornell
Duke
Emory
Georg
ia Tec
hMIT
Northwes
tern
Penn
Prince
tonRPI
Rice
Stanford
Washington
Source: IPEDS
Percent of Full-time First-year Students Receiving Financial AidCarnegie Mellon vs. Peer Institutions
Fall 2006 Cohort
60%65%
53%47%
64%
81% 84%
55%63%
55%
98%
61%
72%64%
-2%
19%
39%
59%
80%
100%
Cal Tec
h
Carneg
ie Mell
on
Cornell
Duke
Emory
Georg
ia Tec
hMIT
Northwes
tern
Penn
Prince
tonRPI
Rice
Stanford
Washington
Source: IPEDSSource: IPEDS
8.27

Percent of Full-time First-year StudentsReceiving Federal Grant Aid
Carnegie Mellon vs. Peer InstitutionsFall 2006 Cohort
9% 12% 12% 10% 13% 12%
24%
9% 9% 10%16%
10% 13% 10%
0%
20%
40%
60%
80%
100%
Cal Tec
h
Carneg
ie Mell
on
Cornell
Duke
Emory
Georg
ia Tec
hMIT
Northwes
tern
Penn
Prince
tonRPI
Rice
Stanford
Washington
Source: IPEDS
Average Amount of Federal Grant Aid ReceivedCarnegie Mellon vs. Peer Institutions
Fall 2006 Cohort
$6,297 $6,200
$2,903
$5,832$5,106
$3,500
$6,798$7,532
$6,522$5,974
$8,268
$5,374 $5,401
$3,901
$0$1,000$2,000$3,000$4,000$5,000$6,000$7,000$8,000$9,000
Cal Tec
h
Carneg
ie Mell
on
Cornell
Duke
Emory
Georg
ia Tec
hMIT
Northwes
tern
Penn
Prince
tonRPI
Rice
Stanford
Washington
Source: IPEDS
8.28

Percent of Full-time First-year StudentsReceiving State and Local Grant AidCarnegie Mellon vs. Peer Institutions
Fall 2006 Cohort
15%6%
17%7%
27%
61%
3% 6% 5% 6%
31%
18%
7% 7%
0%
20%
40%
60%
80%
100%
Cal Tec
h
Carneg
ie Mell
on
Cornell
Duke
Emory
Georg
ia Tec
hMIT
Northwes
tern
Penn
Prince
tonRPI
Rice
Stanford
Washington
Source: IPEDS
Average Amount of State and Local Grant Aid ReceivedCarnegie Mellon vs. Peer Institutions
Fall 2006 Cohort
$3,417 $3,365$2,819
$4,091 $3,972
$5,388
$2,270
$4,816
$3,228
$2,069 $1,788
$3,851
$9,648
$2,384
$0
$2,000
$4,000
$6,000
$8,000
$10,000
Cal Tec
h
Carneg
ie Mell
on
Cornell
Duke
Emory
Georg
ia Tec
hMIT
Northwes
tern
Penn
Prince
tonRPI
Rice
Stanford
Washington
Source: IPEDS
8.29

Percent of Full-time First-year Students Receiving Institutional Grant Aid
Carnegie Mellon vs. Peer InstitutionsFall 2006 Cohort
55% 57%
41% 43%49%
24%
63%
49%
38%
55%
98%
58%48%
55%
0%
20%
40%
60%
80%
100%
Cal Tec
h
Carneg
ie Mell
on
Cornell
Duke
Emory
Georg
ia Tec
hMIT
Northwes
tern
Penn
Prince
tonRPI
Rice
Stanford
Washington
Source: IPEDS
Average Amount of Institutional Grant Aid ReceivedCarnegie Mellon vs. Peer Institutions
Fall 2006 Cohort
$21,531
$17,437$19,653
$24,500
$20,033
$5,966
$26,532
$20,072$22,023
$26,601
$16,779$18,612
$22,691$19,735
$0
$5,000
$10,000
$15,000
$20,000
$25,000
$30,000
Cal Tec
h
Carneg
ie Mell
on
Cornell
Duke
Emory
Georg
ia Tec
hMIT
Northwes
tern
Penn
Prince
tonRPI
Rice
Stanford
Washington
Source: IPEDS
8.30

Percent of Full-time First-year Students Receiving Student Loan Aid
Carnegie Mellon vs. Peer InstitutionsFall 2006 Cohort
36%42% 39% 37% 35% 33% 37% 37%
28%
13%
49%
23% 27%32%
0%
20%
40%
60%
80%
100%
Cal Tec
h
Carneg
ie Mell
on
Cornell
Duke
Emory
Georg
ia Tec
hMIT
Northwes
tern
Penn
Prince
tonRPI
Rice
Stanford
Washington
Source: IPEDS
Average Amount of Student Loan Aid ReceivedCarnegie Mellon vs. Peer Institutions
Fall 2006 Cohort
$3,170
$6,622$7,146 $7,228
$5,124 $4,859$4,164
$4,629$4,010
$3,195
$5,819
$3,408
$4,271$4,638
$0
$1,000
$2,000
$3,000$4,000
$5,000
$6,000
$7,000
$8,000
Cal Tec
h
Carneg
ie Mell
on
Cornell
Duke
Emory
Georg
ia Tec
hMIT
Northwes
tern
Penn
Prince
tonRPI
Rice
Stanford
Washington
Source: IPEDS
8.31

Carnegie Mellon University does not discriminate and Carnegie Mellon University is required not to discriminate in admission, employment, or administration of its programs or activities on the basis of race, color, national origin, sex or handicap in violation of Title VI of the Civil Rights Act of 1964, Title IX of the Educational Amendments of 1972 and Section 504 of the Rehabilitation Act of 1973 or other federal, state, or local laws or executive orders. In addition, Carnegie Mellon University does not discriminate in admission, employment or administration of its programs on the basis of religion, creed, ancestry, belief, age, veteran status, sexual orientation or gender identity. Carnegie Mellon does not discriminate in violation of federal, state, or local laws or executive orders. However, in the judgment of the Carnegie Mellon Human Relations Commission, the Presidential Executive Order directing the Department of Defense to follow a policy of, “Don’t ask, don’t tell, don’t pursue,” excludes openly gay, lesbian and bisexual students from receiving ROTC scholarships or serving in the military. Nevertheless, all ROTC classes at Carnegie Mellon University are available to all students. Inquiries concerning application of these statements should be directed to the Provost, Carnegie Mellon University, 5000 Forbes Avenue, Pittsburgh, PA 15213, telephone 412-268-6684 or the Vice President for Campus Affairs, Carnegie Mellon University, 5000 Forbes Avenue, Pittsburgh, PA 15213, telephone 412-268-2057. Carnegie Mellon University publishes an annual campus security report describing the university's security, alcohol and drug, and sexual assault policies and containing statistics about the number and type of crimes committed on the campus during the preceding three years. You can obtain a copy by contacting the Carnegie Mellon Police Department at 412-268-2323. The security report is available through the World Wide Web at www.cmu.edu/police/. Obtain general information about Carnegie Mellon University by calling 412-268-2000.
Recommended