Final Thesis Report
Spring Thesis Project
50 Connell Drive Office Building Berkeley Heights, NJ
Submitted 4/7/09
Submitted by: Jason Salyer
Option: Construction Management
Thesis Advisor: Dr. Messner

Owner: The Connell CompanyCM: Turner ConstructionArchitect: HLW International
General Data:• 4 Story High End Office Building with Cafeteria• 185,000 Total Square Feet• Pursuing LEED Gold Certification
Mechanical Systems:• Concealed Mechanical Penthouse• 2 pipe direct return air/water system2 pipe direct return air/water system• (4) McQuay Destiny Air Handling Units• Floor by Floor VAV Heating and Cooling Units• (2) Closed Circuit Induced Draft 432 Ton Cooling Towers
Electrical/Lighting:
Architectural:• Granite Panel Facade with Curtain Wall Sections• Reflective Roof with Fully Adhered Membrane
Electrical/Lighting:• 13.2 KV Main Power Feed• (2) 15 KV Switchgears• TP‐1 Transformers Step Power from 480V to 277V• Natural Gas Powered Emergency Generator• Fluorescent lighting with multiple fixture types
Construction:• Schedule July 2007 – Jan. 2009• Clearing of a Wooded 16 Acre Site• Erected in Bays with 150 Ton Crawler Crane
Structural:• Concrete Footings and Grade Beams• Structural Steel Frame• Composite Metal Deck Floor Slabs
Jason Salyer, LEED APConstruction Management
http://www.engr.psu.edu/ae/thesis/portfolios/2009/jcs5018/
• Vertical Steel Cross Bracing

April 7, 2009 50 CONNELL DRIVE - FINAL THESIS REPORT
Jason Salyer Page 1
Table of Contents
Executive Summary…………………………………………………………………….2
Background Information
General Building Data………………………………………………….…………3
Architecture & Primary Building Systems…………………………………..……4
Site Location…………………………………………………………………..…..7
Constructions Photos……………………………………………………….……..9
Building Elevations, Sections & Plans……………………………………..……12
Analysis 1 – Prefabricated Façade………………………………………………………19
Analysis 2 – High Performance Glazing (Mechanical Breadth Imbedded)……………..27
Analysis 3 – Prefabrication (Structural Breadth Imbedded)…………………………….35
Critical Industry Issue – Reducing Operating Costs…………………………………...51
Credits/Acknowledgments……………………………………………………………..65
Appendix A – Energy Simulation……………………………………………………...A-1
Appendix B – Modular Plant Shop Drawings…………………………………………A-4
Appendix C – Modular Plant Info……………………………………………………A-17
Appendix D – Modular Plant Case Study……………………………………….……A-23
Appendix E – STAAD Report…………………………………………………..……A-27

April 7, 2009 50 CONNELL DRIVE - FINAL THESIS REPORT
Jason Salyer Page 2
Executive Summary:
The study regarding the alignment problems on the façade found that using an integrated
contractor to install both the exterior stone and glass is not a practical solution. This is
because there is no contractor in the area who specializes in this type of work and there is
a concern that if both packages were awarded to a single contractor they would
subcontract a portion of the work. This would remove the CM one step further out of
control over that work. A system re-design was not necessary because the work was due
to poor field performance. Coordination and understanding the small tolerances is key to
a successful installation of the windows.
The analysis of high performance glazing revealed that significant savings can be
achieved by upgrading the vision glass to SolarBan70XL. A computer simulation
estimates that annual energy consumption can be reduced by 9% and upfront equipment
costs can be reduced by 16%. Not only does this glass provide energy savings but its
material cost is $1.20 per square foot cheaper than the glass used on the project. This
would provide an upfront savings of nearly $25,000 for the material cost alone.
The analysis which aimed to find elements of the project that could benefit from
prefabrication had mixed findings. A study of a modular central plant estimated that it
would save about a month of schedule time to finish work in the mechanical penthouse.
However the building’s structure is not strong enough to support the system and the cost
to strengthen the structure would likely not be worth the effort. Typically these plants are
located on grade. From a design point of view the modular plant offers less control than
the 8 ACCU units that were actually used throughout the building. Since the building is
rented spaces it is possible to have unoccupied floors. The actual design allows for
energy savings by turning off the ACCU’s on these floors. However that is not possible
with a single modular plant. Maintenance is also easier on the ACCU’s. The analysis also
found that using prefabricated plumbing pipe sections in the bathrooms is not practical
because the size and number of units does not justify the cost.
Common methods to reduced operating costs that would work well for this building
include a combination of:
Energy efficient design
Energy modeling prior to construction
Use of efficient equipment & water efficient fixtures
Energy monitory
Optimizing operating set points
Taking advantage of state and federal incentives of installing efficient equipment
Continuous commissioning

April 7, 2009 50 CONNELL DRIVE - FINAL THESIS REPORT
Jason Salyer Page 3
General Building Data:
Building Name: 50 Connell Drive Office Building
Location: Berkeley Heights, NJ 07922
Occupant Name: L’Oreal USA Inc.
Occupancy: A-2 Assembly, Group B Business
Gross Square Footage: 184,564 total square feet and 170,000 square feet of office space
Total stories: 4 floors above grade
Architect: HLW International LLP
Civil/Structural Engineer: CMX Engineering (formerly known as Schoor Depalma
Engineers)
MEP Engineers: RDK Engineers
Vertical Transportation Engineers: Van Deusen Associates
LEED Consultant: Viridian Energy and Environmental
Owner: Connell Real Estate and Development Company
Construction Manager: Turner Construction is providing services for the core and shell.
Dates of Construction (start-finish): Construction began on 7/2/07 and turnover for the
tenant fit out is expected on 1/27/09. The owner is planning on having occupancy in July
of 2009.
Overall Construction Cost: Turner’s contract for the core and shell, including general conditions and fee is $38.9 Million. This number does not include the site work that the owner had done prior to Turner’s arrival. After the tenant completes the fit out of the building it is expected that the overall construction cost will be $46,200,000. Project Delivery Method: Cost Plus

April 7, 2009 50 CONNELL DRIVE - FINAL THESIS REPORT
Jason Salyer Page 4
Architecture
Design and functional components: The building is a simple design dedicated to
optimizing office space. The building footprint is rectangular. The interior layout of the
building places the restrooms, elevators, stairwells and storage areas of the building in the
central core. The outer perimeter of the building is dedicated to office space. The skin of
the building is composed of granite panels and glass curtain wall. The glass curtain wall
is nearly the full floor height. This allows for natural daylight to penetrate into the office
space which will reduce energy loads. In addition to taking advantage of reduced energy
consumption the large windows allow the occupants to have views towards the outdoors.
This results in a more enjoyable more productive working environment. The first floor
has a cafeteria for the workers. This is a functional component of architecture which
makes a convenient alternative to leaving the building for lunch. A loading dock services
the building adjacent to the cafeteria.
Zoning: The land is zoned as Commercial.
Building Envelope: The building envelope is composed of glass, concrete and stone. The
exterior wall is a panel system of granite, limestone and shop fabricated architectural pre-
cast concrete attached to a metal truss/panel system. Aluminum ribbon windows make up
glass curtain wall sections. The roof is composed of 6” concrete topping on a 1 ½” steel
deck supported by 3’ 4” open web K series steel joists. There is a fully adhered
membrane roofing system with mechanically fastened roof insulation and cover boards.
The membrane has a minimum solar reflective index of 78 to meet the strict LEED
building requirements of the project.
Primary Engineering Systems
Construction The Connell Company, through its division Connell Real Estate and Development
Company hired Turner Construction as the construction manager on their new office
building. The company develops and manages Class A commercial office buildings.
Construction began in July of 2007 and is scheduled for completion in January of 2009.
The building, 50 Connell Drive, will be comprised of four floors and a mechanical
penthouse on the roof. The finished product will be approximately 185,000 total square
feet. The building will be the newest addition to the 170 acre Connell Corporate Park and
will later be known as Connell Corporate Center VI.
The building was constructed in bays. A 150 ton crawler crane was used to place all the
structural steel. Construction of the bays began on the northeast side of the building.
From here they moved west. Once construction of the northwest side of the building was
complete the crawler crane was positioned on the southwest corner of the building and
worked it way east. A concrete pump was used to place all concrete. The project team
decided to use an atypical arrangement to finish the floors. Instead of using the traditional

April 7, 2009 50 CONNELL DRIVE - FINAL THESIS REPORT
Jason Salyer Page 5
top-down or bottom-up approach they decided to finish the floors in the following order:
2nd
→ 3rd
→1st → 4
th. The team decided that this would be the most efficient order to
follow. The team did not want to do a traditional top-down sequence because the roof
above the 4th
floor is composed entirely of bar joists. This means that in order for the 4th
floor to be ready for interior work they would need to wait for the spray on fire proofing
to be completely installed on both the bar joists and underside of the roof. The team did
not want to follow a bottom-up sequence because the 1st floor has a lot of mechanical
equipment, a kitchen and cafeteria. By jumping floors they were able to sequence
efficiently and actually managed to get ahead of schedule.
Electrical Primary electrical service is 13.2KV. Power enters the building through 15KV cables
within an underground duct bank. The building has two main switchgears. Each of the
15KV Medium Voltage switchgears has a #600 cable that carries power to an 800 amp
bus duct riser and a #400 cable that carries power to a 1000A duct riser. Once power is
carried up the building through the riser it enters the branch circuits. Heavy equipment
within the building uses 480 volt 3 phase power. There is a 15 KV dry type transformer
on each floor that steps the power down from 480V to 208Y/120V for normal office
applications. The transformers in this building are highly efficient and comply with
NEMA TP-1 standards. There are 24 panelboards throughout the building. Spectra Power
panelboards are provided for all applications over 400 amps and to accommodate
multiple branch breakers greater than 125 amps. In the event of a service failure the
building also has an emergency generator capable of producing electricity with a natural
gas driven engine. The generator has a 2900 MBH capacity. The building also has battery
powered emergency lighting.
Lighting: There is a variety of lighting fixtures in and around the building. Included are HID,
florescent, Tungsten-halogen and incandescent lamps. A 277 volt system provides power
to the fixtures. All fluorescent fixtures have electronic ballasts with high power factor.
Ballasts are instant start. General office lighting is provided by a combination of recessed
26 watt compact fluorescent 6” downlights, F32T8 lamps are used in both chain hung
1x4 fluorescent uplights and Lithonia pendant mounted 2x4 fluorescent fixtures.
Passageways are lit by recessed 32 watt compact fluorescent wall washers. The entry
lobby utilizes a combination of recessed compact fluorescent downlights and metal halide
fixtures. Cafeteria lighting is provided by a combination of recessed fluorescents, F32T8
pendant fixtures and Q35MR16 recessed halogens.
Mechanical: The building utilizes a combination air/water system with a two pipe direct return. The
majority of the mechanical equipment that services the building is located inside a
penthouse on the roof. There are a total of four McQuay Destiny air handling units that
supply air to the building. AHU-1 and AHU-2 do the bulk of the work. AHU-1 & 2 in the

April 7, 2009 50 CONNELL DRIVE - FINAL THESIS REPORT
Jason Salyer Page 6
penthouse are 100% outside air units that feed ACCU units (2 per floor). However AHU-
1 & 2 only preheat the outdoor air, they do not cool it. They are capable of supplying
15,500 CFM and 18,400 CFM with a capacity of 710 MBU and 841 MBU respectively.
The building also makes use of a smaller 2000 CFM, 180 MBU unit located in the
penthouse. This provides heating and ventilation solely for the two penthouse rooms. It
is not part of the central system. The last air handling unit is located at the loading dock.
It heats and cools the air for that area only.
Each floor has self contained heating/cooling units (ACCU’s) that are used to control the
indoor environment. Fan powered VAV terminal unit boxes, electric unit heaters and self
contained AC units are used to control the air temperature in each room. A 1739 MBU
capacity boiler located within the penthouse is used to heat the building’s water supply.
Also located on the penthouse are two Baltimore Air Coil closed circuit cooling towers,
each with a 432 ton capacity. They are of an induced draft design with vertical air
discharge. The towers use an aqueous glycol solution as the heat transfer fluid.
Structural:
The substructure of 50 Connell Drive consists of square concrete spread footings which
support the interior steel columns. Continuous strip footings support a foundation wall
along the north side of the building. The spread footings range in size from 3’x3’ and 1’
deep to 13’x13’ and 2’9” deep. The footings sit on engineered fill/undisturbed stratum
with minimum bearing capacity of 4000 psi. The SOG varies in thickness from 4” to 12”
however the majority of the ground floor slab is 6”. The mechanical room is built on a
12” SOG to support the heavy equipment. Drainage under slabs is compacted gravel. All
footings, piers, grade beams, walls and non composite slabs consist of 4000 psi normal
weight concrete. Composite slabs use 3000 psi normal weight concrete.
The superstructure for the building is a steel skeleton composed of wide flange sections.
The columns are spaced on 30’ grids throughout the building. The structural steel framing
is composed mainly of Grade 50 W21x50 girders and W16x26 beams. Lateral forces are
resisted through the use of moment resisting connections and vertical structural bracing.
Structural steel columns range in size from W14x48 to W14x132. The elevated slabs are
2 ¼” composite steel decks with 4” of normal weight concrete.

April 7, 2009 50 CONNELL DRIVE - FINAL THESIS REPORT
Jason Salyer Page 7
Building Location: Berkeley Heights, NJ

April 7, 2009 50 CONNELL DRIVE - FINAL THESIS REPORT
Jason Salyer Page 8
50 Connell Drive
Aerial Photo 3 – Site Photo

April 7, 2009 50 CONNELL DRIVE - FINAL THESIS REPORT
Jason Salyer Page 9
Construction Photos:
October 2007
December 2007

April 7, 2009 50 CONNELL DRIVE - FINAL THESIS REPORT
Jason Salyer Page 10
January 2008
February 2008

April 7, 2009 50 CONNELL DRIVE - FINAL THESIS REPORT
Jason Salyer Page 11
April 2008
June 2008

April 7, 2009 50 CONNELL DRIVE - FINAL THESIS REPORT
Jason Salyer Page 12
Building Plans, Elevations & Sections:
West Elevation
East Elevation
April 7, 2009 50 CONNELL DRIVE - FINAL THESIS REPORT
Jason Salyer Page 13
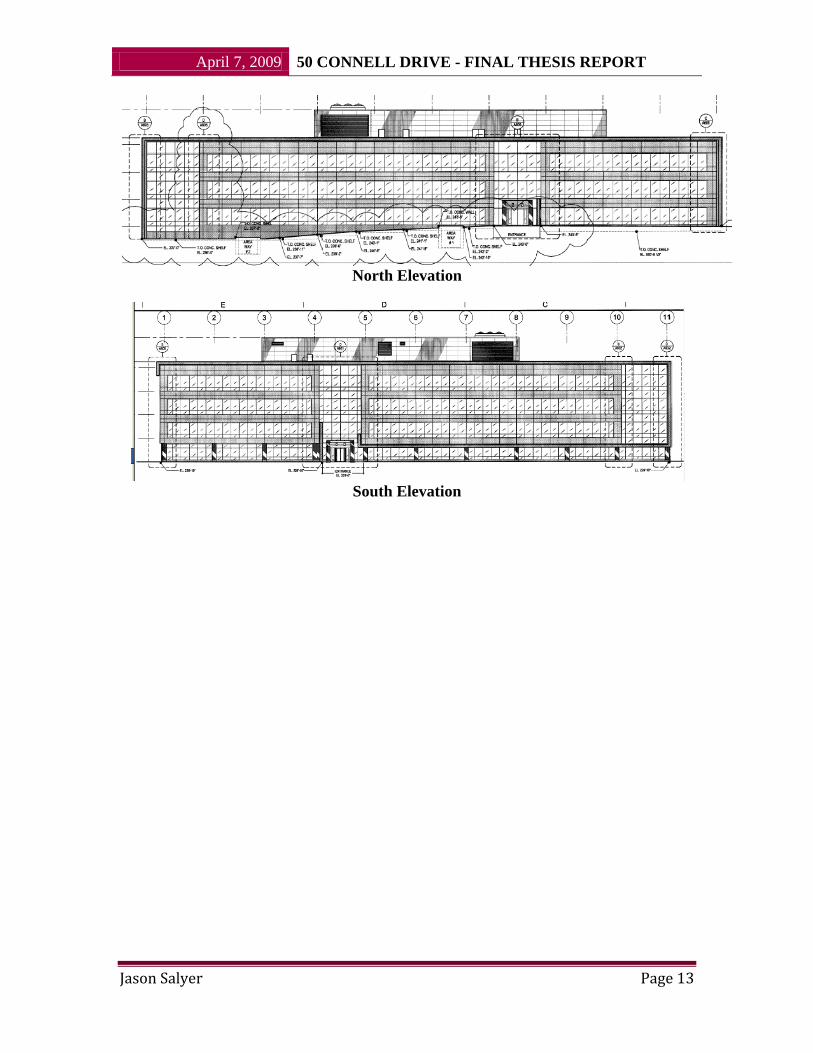
North Elevation
South Elevation

April 7, 2009 50 CONNELL DRIVE - FINAL THESIS REPORT
Jason Salyer Page 14
Exterior Wall Section at Stone Panel
Exterior Wall Section at Parapet

April 7, 2009 50 CONNELL DRIVE - FINAL THESIS REPORT
Jason Salyer Page 15
1
st Floor ‘Area A’

April 7, 2009 50 CONNELL DRIVE - FINAL THESIS REPORT
Jason Salyer Page 16
1
st Floor ‘Area B’

April 7, 2009 50 CONNELL DRIVE - FINAL THESIS REPORT
Jason Salyer Page 17
Typical Floor ‘Area A’

April 7, 2009 50 CONNELL DRIVE - FINAL THESIS REPORT
Jason Salyer Page 18
Typical Floor ‘Area B’

April 7, 2009 50 CONNELL DRIVE - FINAL THESIS REPORT
Jason Salyer Page 19
Analysis 1: Panelized Facade System
Introduction:
The project team encountered difficulties installing the façade. The goal of this analysis
was to investigate what caused these problems and determine if anything could be
learned from this situation and applied to future projects. At the time this analysis was
proposed it was unclear whether these problems were due to poor design, poor shop
drawing coordination or careless work in the field.
Background Info:
Prefabricated Stone Panels
The exterior wall is composed of three main elements: stone, glass and a few precast
concrete sections. To speed up construction time the exterior stone panels that the façade
is built from were pre-engineered and delivered to the site on pre-cast trusses. The
contractor, Atlantic Exterior Wall Systems, performed much of the work in their shop.
This resulted in a reduction of field labor. The Trainor Glass Company provided the
glazing for the curtain wall. Together the stone panels and glazing form the building’s
envelope.
The project superintendent described this system as a genius idea. However this system
did not work as well as expected. Aside from inconsistencies in the stone and poor
drawings that lacked dimensions the panels also proved to be very difficult to align
properly with respect to the glazing.
Figure 1.1 – Prefab Stone Panels
April 7, 2009 50 CONNELL DRIVE - FINAL THESIS REPORT
Jason Salyer Page 20
Unitized Curtain Wall
A unitized curtain wall was used on the project. The components of a unitized wall
system came together at the manufacturer’s facility. This facility became specialized to
configure a specific custom curtain wall. Shop components of the unitized curtainwall
included:
Glass
Insulation
Back pans
Stainless steel & aluminum panels
Extrusions
A unitized façade offers many advantages over the system that was used on the project. It
is a pre-engineered, pre-fabricated and pre-assembled curtain wall. The glazing and
framing is assembled at the factory and delivered to the site in sections. This helps to
minimize the amount of field work that is required and accelerates the assembly of the
wall. It also reduces the dependence on field weatherseals. Many manufacturers also
claim that the system has enhanced water resistance and air performance.
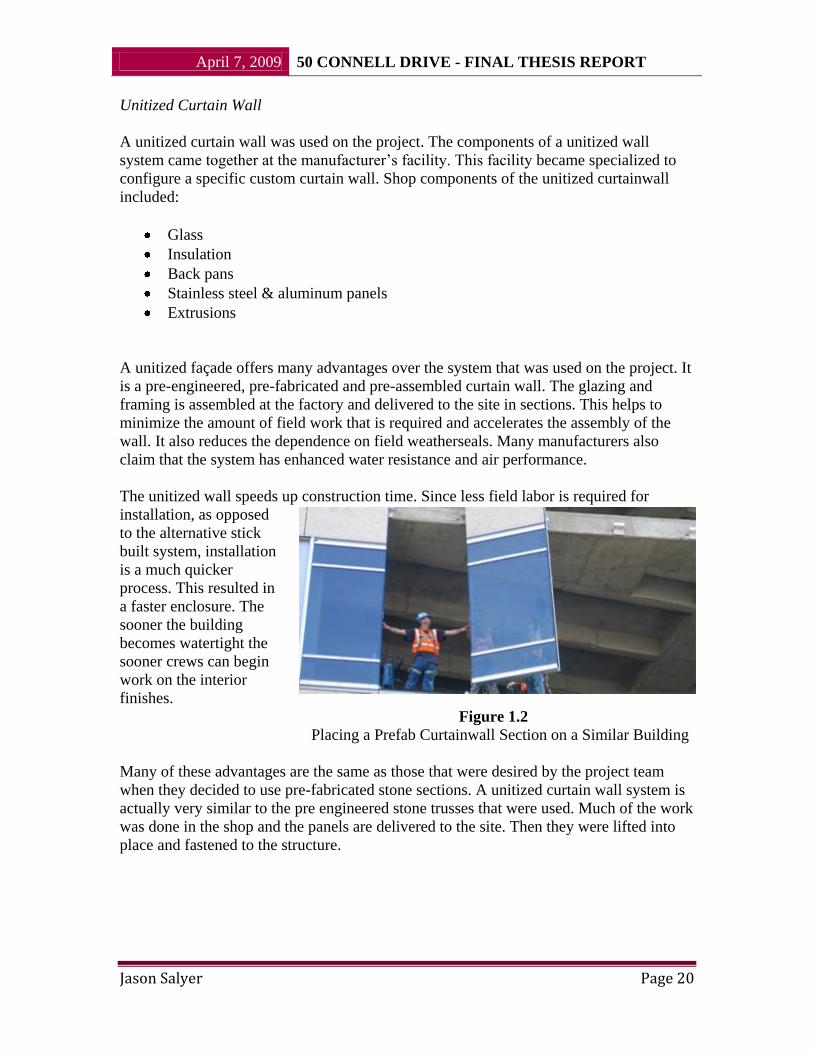
The unitized wall speeds up construction time. Since less field labor is required for
installation, as opposed
to the alternative stick
built system, installation
is a much quicker
process. This resulted in
a faster enclosure. The
sooner the building
becomes watertight the
sooner crews can begin
work on the interior
finishes.
Figure 1.2
Placing a Prefab Curtainwall Section on a Similar Building
Many of these advantages are the same as those that were desired by the project team
when they decided to use pre-fabricated stone sections. A unitized curtain wall system is
actually very similar to the pre engineered stone trusses that were used. Much of the work
was done in the shop and the panels are delivered to the site. Then they were lifted into
place and fastened to the structure.

April 7, 2009 50 CONNELL DRIVE - FINAL THESIS REPORT
Jason Salyer Page 21
Figure 1.3 - Finished West Facade
How the System Worked:
First the stone panels were installed and then
the glass crews followed. The quarry, New
England Stone, cut and drilled sinkages and
holes into the stone for anchors, fasteners,
supports, and lifting devices as needed to set the
stone securely in place. Then the quarry
delivered the cut sections of stone to the metal
truss/panel fabricator. The fabricator shaped the
beds to fit the supports. Once the truss
fabricator obtained the stone they incorporated
it into steel trusses/panels. The panels are Figure 1.4- Prefab Section on Truck
designed for small movement
when subjected to seasonal and cyclic day/night temperature ranges and when wind loads
are imposed.
The panels were delivered to the site on flat bed trucks and then hoisted by crane into
place. The panels were attached to the building by bolting them to a steel angle that had

April 7, 2009 50 CONNELL DRIVE - FINAL THESIS REPORT
Jason Salyer Page 22
been welded to the steel frame. The angles had a slotted hole that allowed for adjustment
in placement.
Once the stone panels had been installed separate crews would install the glass curtain
wall. Each piece of glass was lifted into place with a modified JLG boom lift that was
specially designed to lift the pieces with glass cups. There were 2 men in the building that
reached out with glass cups to accept each piece as it was lifted to them from the lift. The
men then installed each piece.
Installation Problems:
The stone panels were fabricated as 5’ wide sections. Each piece of glass between the
panels measured 5’x7’. There is a joint between each of these sections that should
measure ¼” wide. In some areas it was difficult to fit the sections precisely and
impossible to get ¼” joints. Some of the pieces were installed with ½” joints. This
difference may sound insignificant but these discrepancies add up quickly to create a
problem. The 300 foot long north and south façade required 60 separate panels to span
that horizontal distance. If only a handful of those panels have the incorrect joint
thickness it throws the alignment off. The tolerances are so small that there is no room for
error.
The stone and the glass were both designed as 5’ wide sections so that the vertical joint
between each piece of glass meets the vertical joints between each piece of stone. The
architect wanted it to appear as if there was one continuous joint that ran from the top of
the façade to the bottom. Refer to Figure 1.5. Turner eventually noticed that as work
proceeded the vertical joints were not lining up with one another as illustrated in Figure
1.6. As work proceeded with the window installation it was apparent that not all of the
windows would be able to fit between the stone panels.
Figure 1.5 – Desired Finish Showing Continuous Vertical Joints

April 7, 2009 50 CONNELL DRIVE - FINAL THESIS REPORT
Jason Salyer Page 23
Figure 1.6 – Illustration of Alignment Problems
Notice how the vertical joints between the stone and glass become more and more
skewed as you move down the building.
Why there were Complications:
One critical flaw with this system is that the envelope was designed as two separate
systems and delivered by two separate contractors. A high degree of precision and
coordination was required by the contractors. The joints between each piece of glass and
the stone/glass interface only measured ¼”. The glass contractor had difficulties meeting
this tolerance. Some of the pieces did not have the correct joint thickness. Many were
installed with ½” joints between each piece of glass.
The small tolerances made it difficult to install the windows. Once the granite panels
were installed the window contractor had to fit the glazing between the panels. If the
placement of just one window was slightly off then the windows would not fit correctly.
If there was more than ¼” gap between the glass/stone interface or between any two
pieces of glass the contractor would not have enough space to fit his last piece of glass.
The fact that there were two contractors involved with the installation made the process
even more difficult. A high level of coordination and precision was required by both
contractors to perform the job effectively. Typically contractors want to install their work
as quickly as possible and move on to the next project. Subcontractors may not realize
how much of an impact their work has on another subcontractor or the project as a whole.

April 7, 2009 50 CONNELL DRIVE - FINAL THESIS REPORT
Jason Salyer Page 24
As a result the quality of their work can suffer. In a situation like this one, with two
separate systems that depend on each other, if something goes wrong both contractors
deny any wrong doing and try to place the blame on the other contractor.
Impact of the Complications:
The glass panels were not fitted together properly. The vertical joints between the glass
did not align with the vertical joints between the stone as the architect desired. Every
panel that was installed improperly compounded the problem. The vertical joints on the
first few windows that were installed appeared correct but as work progressed down the
building it had become more and more noticeable that there was a problem. Later it
became clear that as a result of this misplacement the last piece of glass that sits against
the granite would not be able to fit.
The glass contractor blamed the stone contractor for the problem. He claimed the stone
panels were set improperly which resulted in the misalignment of the joints and also
made it impossible to fit all of the glass within the space. The stone contractor blamed the
glass contractor and claimed that the glass was not placed correctly. This arguing went
back and forth and work on the façade was temporarily halted until the cause of the
problem was determined. Fortunately litigation was avoided.
It was later determined that the reason the panels were not fitting correctly was because
the window contractor did not place the glass properly. Human error was to blame for the
glass being placed improperly. To solve the problem 20% of the windows had to be
removed, moved over and re-aligned. This caused delays in others areas as well.
Landscape crews were forced to delay work around the perimeter of the building until the
façade was complete.
Potential Solutions
1. Integrated Envelope Contractor:
An analysis was performed to investigate the feasibility of awarding the entire façade to a
single contractor. It was determined that this option comes with its own set of advantages
and disadvantages.
If a single contractor was responsible for the design and installation of the building’s
envelope that would provide a strong incentive for that contractor to perform quality
work. It would also eliminate the short comings of relying on two separate systems to fit
together properly. Having one subcontractor eliminates the need for coordination
between the glazing and stone contractors and also eliminates the chance of “finger
pointing” between these two parties if a problem does occur.
The first concern with this option is finding contractors who are willing and able to bid
on this package. Fortunately this project is located in a region where there is a lot of

April 7, 2009 50 CONNELL DRIVE - FINAL THESIS REPORT
Jason Salyer Page 25
construction and a lot of contractors, suppliers and manufacturers to meet those
construction needs.
Atlantic Exterior Wall Systems was the contractor who fabricated and installed the pre-
fabricated stone trusses for this project. A phone interview was conducted with the
company’s president, Joseph Farina. This interview revealed that even though the
company specialized in prefabricated panelized stone and brick truss systems they would
have bid on both the glass and stone package if they were asked to. He claims that the
company is fully capable of delivering such a system. He also believes that they would be
able to do the work more cost effectively than the method that was used on the project.
The CM has several concerns with using an envelope contractor. The concern that they
have is that the envelope contractor would subcontract one of the work packages to
another party. There are a few reasons why this is not good from a construction
manager’s perspective. This gives them less management control. For example, if the
envelope contractor specializes in stonework they may decide to subcontract the work for
the glazing. Since Turner would not hold the contract with the glazing contractor they
have little authority over them. The other concern is that this would shift the risk away
from the envelope contractor and put it on someone else. This defeats the point for using
a single contractor for the façade. If they subcontract the work then they are have reduced
their risk. This does not provide a strong incentive for the envelope contractor to perform
the work to the best of their abilities. The CM is also concerned that the envelope
contractor may hire an inexperienced subcontractor who is not qualified to perform the
work.
2. Dedicated Quality Control Management
Some people who were involved with the project believe that the problem is not due to
poor design but simply careless work in the field. A dedicated quality control manager on
the site could have caught the problem before it became a major issue.
This may have prevented the problem but it would come at a high cost. Adding a quality
control manager would have cost the CM approximately $8,000 per month.
3. Shop Drawing Coordination
Some experts that were consulted for advice on this issue believe that this problem was a
result of poor shop drawing coordination. It is to carefully review the shop drawings prior
to beginning work. Each contractor, Trainor Glass and Atlantic Exterior Wall Systems,
provided their own shop drawings for their portion of the work.
Prior to writing this report shop drawings were obtained from the contractor’s and
compared with one another. There were no obvious mistakes or coordination problems. If
the components were installed as the drawings show they would have fit into place. It

April 7, 2009 50 CONNELL DRIVE - FINAL THESIS REPORT
Jason Salyer Page 26
should be noted that the contractor’s did not want these drawings included in the report or
posted to the CPEP website for privacy reasons.
Conclusions:
After performing research on the topic it is fair to say that the problems encountered on
the exterior wall was due to poor execution in the field. It appears that a lack of shop
drawing coordination was not to blame and a system re-design is not necessary.
Using a single contractor to install the façade is not a good idea. After analyzing the
advantages and disadvantages of using an integrated contractor it has been determined
that the disadvantages outweigh the advantages. The CM is uncomfortable with the idea
and so are other construction management professionals that have been consulted. This
may have been a good solution if there was no chance of the contractor subcontracting
the work to another party. Since there is no contractor in the area that specializes in both
prefab stone panels and unitized curtainwall there is a very high likely hood that an
integrated contractor would subcontract some of the work.
Adding extra staff to the project with the sole purpose of quality control management
may have caught this problem sooner. However the cost of this option does not seem
appropriate for a project this size. The problem could have been caught just as easily with
the staff that was used on the project. This experience is a lesson learned for the CM and
now they will have a trained eye to look for similar problems on future projects.

April 7, 2009 50 CONNELL DRIVE - FINAL THESIS REPORT
Jason Salyer Page 27
Analysis 2: High Performance Building Envelope
Problem Statement:
The goal of this analysis was to determine how changes can be made to improve the
energy performance of the façade. The analysis focused specifically on glazing upgrades.
The upfront costs of these upgrades were calculated along with a life cycle cost analysis
of how long the system will take to pay for itself. Manufacturer’s data sheets were used
to obtain information on the thermal performance of different materials. This information
was simulated in a computer model to obtain information on the building’s performance.
The goal of my research is to determine how changes can be made to improve the
current design, what will the upfront cost be to implement the improved system and how
long it will take for the system to pay for itself.
Research Methods:
Research was conducted on various high performance glazings that are on the market
today. Manufacturer’s data sheets were used to obtain information regarding the thermal
properties of the glass. A schematic estimate of the building’s energy consumption was
performed by using the U.S. Department of Energy’s (DOE) 2.2 Building Energy
Analysis Simulation Tool.
Background Information: Mechanical System
The building utilizes a combination air/water system with a two pipe direct return. The
majority of the mechanical equipment that services the building is located inside a
penthouse on the roof. There are a total of four McQuay Destiny air handling units that
supply air to the building. AHU-1 and AHU-2 do the bulk of the work. AHU-1 & 2 in the
penthouse are 100% outside air units that feed ACCU units (2 per floor). However AHU-
1 & 2 only preheat the OA, they do not cool it. They are capable of supplying 15,500
CFM and 18,400 CFM with a capacity of 710 MBU and 841 MBU respectively. The
building also makes use of a smaller 2000 CFM, 180 MBU unit located in the penthouse.
This provides heating and ventilation solely for the two penthouse rooms. It is not part of
the central system. The last air handling unit is located at the loading dock. It heats and
cools the air for that area only.
Each floor has self contained heating/cooling units (ACCU’s) that are used to control the
indoor environment. Fan powered VAV terminal unit boxes, electric unit heaters and self
contained AC units are used to control the air temperature in each room. A 1739 MBU
capacity boiler located within the penthouse is used to heat the building’s water supply.
Also located on the penthouse are two Baltimore Air Coil closed circuit cooling towers,
each with a 432 ton capacity. They are of an induced draft design with vertical air
discharge. The towers use an aqueous glycol solution as the heat transfer fluid.

April 7, 2009 50 CONNELL DRIVE - FINAL THESIS REPORT
Jason Salyer Page 28
General Information
The quality of the building’s envelope has a tremendous effect on the efficiency of the
building’s systems. To optimize the envelope it is important to understand New Jersey’s
climate. New Jersey experiences very cold dry winters and very hot humid summers. As
a result of this climate type, a high value of thermal resistance is required in roofs, walls
and windows.
Much of the building’s winter heat loss comes as a result of conduction through the
curtain wall glass. Likewise, during the summer months, conduction through the glass
results in unwanted solar heat gain. In either case this puts an unwanted load on the
HVAC equipment. A low U-Value is very desirable when choosing the glazing material
that will be installed on a project.
Glazing Used on Project
The curtain wall glass on this project was manufactured by YKK AP. The product that
was used was their YCW 750 Spline Tech glazing. This glass is a 1” insulated unit. It
also provides a low-e. The U-Value measures 0.45 BTU/HR/SF/F. According to the
authors of “Green BIM” this product offers a level of thermal performance that is typical
of “market buildings” and below their recommended standard for “green buildings”. See
Table 2.1 below. This is an issue of concern because the project is required to become
LEED Gold Certified building. They recommend using a glazing with a U-Value of at
least 0.29 for LEED Gold projects.
Design Criteria Market LEED Gold LEED Platinum
Glazing %
North 60 40 40
South 60 40 40
East 60 25 20
West 60 25 20
Glazing Characteristics
U SC VLT U SC VLT U SC VLT
North 0.42 0.6 0.71 0.29 0.43 0.7 0.16 0.35 0.6
South 0.42 0.6 0.71 0.29 0.43 0.7 0.16 0.35 0.6
East 0.42 0.6 0.71 0.31 0.4 0.47 0.16 0.31 0.6
West 0.42 0.6 0.71 0.31 0.4 0.47 0.16 0.31 0.6
Insulation & Operability
Double glazed, fixed
Double glazed, operable
Triple glazed, operable
with controls
Light shelves No Yes Yes
Thermal Properties
Wall R-value R8 R25 R33
Temperature Range (F)
Cooling/RH 72 76 78
Heating/RH 72 68 68
Table 2.1

April 7, 2009 50 CONNELL DRIVE - FINAL THESIS REPORT
Jason Salyer Page 29
Glazing & thermal property recommendations
Proposed Glazing
SolarBan 70XL is a high performance
glazing that offers superior thermal
performance compared to the YCW
750 Spline Tech glazing. It is
manufactured by PPG. This glazing
has a U-Value of 0.26. This offers a
considerable improvement over the
glazing that was used on the project
and meets the recommendations for a
LEED Gold building. This glass also
allows architects to incorporate vast
areas of vision glass into a building’s
design while minimizing the load on
HVAC heating and cooling systems.
Another advantage of this glass is it
combines the clear appearance of
transparent, color-neutral glass with a Figure 2.1 Solarban70XL on a CSU Building
combination of solar control and visible
light transmittance that was previously only attainable with a tinted glass.
The owner would truly value the energy-related cost savings that SolarBan provides.
According to the manufacturer a recent study by an independent energy and
environmental research firm found that Solarban70XL glass has the potential to reduce
annual energy costs by 5 percent or more in comparison with leading Solar Control Low-
E coated glasses.
Energy Modeling:
An energy consumption simulation was conducted with the U.S. Department of Energy
(DOE) 2.2 Building Energy Analysis Simulation Tool developed at the Lawrence
Berkeley National Laboratory and Los Alamos National Laboratory. See Appendix A for
the energy report. It is recognized as the most accurate and well-documented energy
modeling tool available in the U.S.
The simulation was performed online from PPG’s website. Users are able to enter limited
information about their project. The data generated by this energy modeling program was
for comparative purposes only. It is general in nature and will vary slightly from the
actual building’s performance. An effort was made to make the simulation as reasonable
as possible.

April 7, 2009 50 CONNELL DRIVE - FINAL THESIS REPORT
Jason Salyer Page 30
Solarban70XL was modeled against various other types of glazing. It was not possible to
compare Solarban70XL to the actual glass that was used on the project, YCW 750 Spline
Tech. However the thermal properties of the various glazings are close to that of the
Spline Tech glass. Again, this analysis was for comparison purposes only and will vary
slightly from actual building performance.
Energy Modeling Assumptions:
Geometry and U Values
Floor area (sf) 270,000 (sf)
Number of stories 8 story office
Wall window to wall ratio 90%
Wall U-value 0.124
Roof U-value 0.065
Wall area 56,640 sf
Glass area 50,979
Climate
Location Philadelphia
Operating Schedules
Cooling setpoint 75 F
Heating setpoint 70 F
Standard day schedule 7 am - 6 pm weekdays
8 am - 12 pm weekends
All year
HVAC Equipment
Air Handling System VAV
Cooling plant type Centrifugal chiller
Economizer Yes
Heating plant type Hot water boiler
Service hot water Hot water boiler
Peak Internal Loads
Occupants (sf/person) 448
Lighting (W/sf) 1.3
Equipment (W/sf) 0.75
Table2.2
Assumption for energy simulation

April 7, 2009 50 CONNELL DRIVE - FINAL THESIS REPORT
Jason Salyer Page 31
Utility Rates
Electric Rates: PECO Energy Company
Monthly charge $25.00
Energy Charge:
First 100 kWh 0.2246 $/kWh
Next 50,000 kWh 0.1145 $/kWh
Next 100,000 kWh 0.0785 $/kWh
Over 150,000 kWh 0.044 $/kWh
Gas Rates: PECO Energy Company
Monthly charge $14.40
First 2,000 Therms 1.41095 $/Therm
Over 2,000 Therms 1.32434 $/Therm
Table 2.3
Utility Rates for simulation
Simulation Results:
A detailed report of the energy model simulation can be found in Appendix A The
table below summarize the results.
Glazing Type
Estimated
Operating
Expenses*
Estimated Total
Capital Cooling
HVAC Costs*
Standard Double Pane $1.60/sf $7.81/sf
Solexia Sungate 500 $1.52/sf $7.46/sf
SolarBan70XL $1.41/sf $6.34/sf
*Based on energy model with 270,000 sf building
Table 2.4
Simulation Results
Table 2.4 above shows the estimated operating expenses and equipment cost for three
types of glass. The glass used on this project, Spline Tech 750, has thermal properties
in between the Standard Double Pane and Solexia Sungate 500. It was estimated that
since it has thermal properties in between the two types of glass the cost would also
be in between the two types of glass. Table 2.5 below estimates the cost of 750
Spline Tech by taking the average of the costs from Standard Double Pane and
Solexia Sungate 500.
April 7, 2009 50 CONNELL DRIVE - FINAL THESIS REPORT
Jason Salyer Page 32
Glazing Type
Estimated
Operating
Expenses
Annual
Operating
Savings
Estimated
Total
Capital
Cooling
HVAC Costs
Initial
Capital
Cost Savings
1st Year
Savings
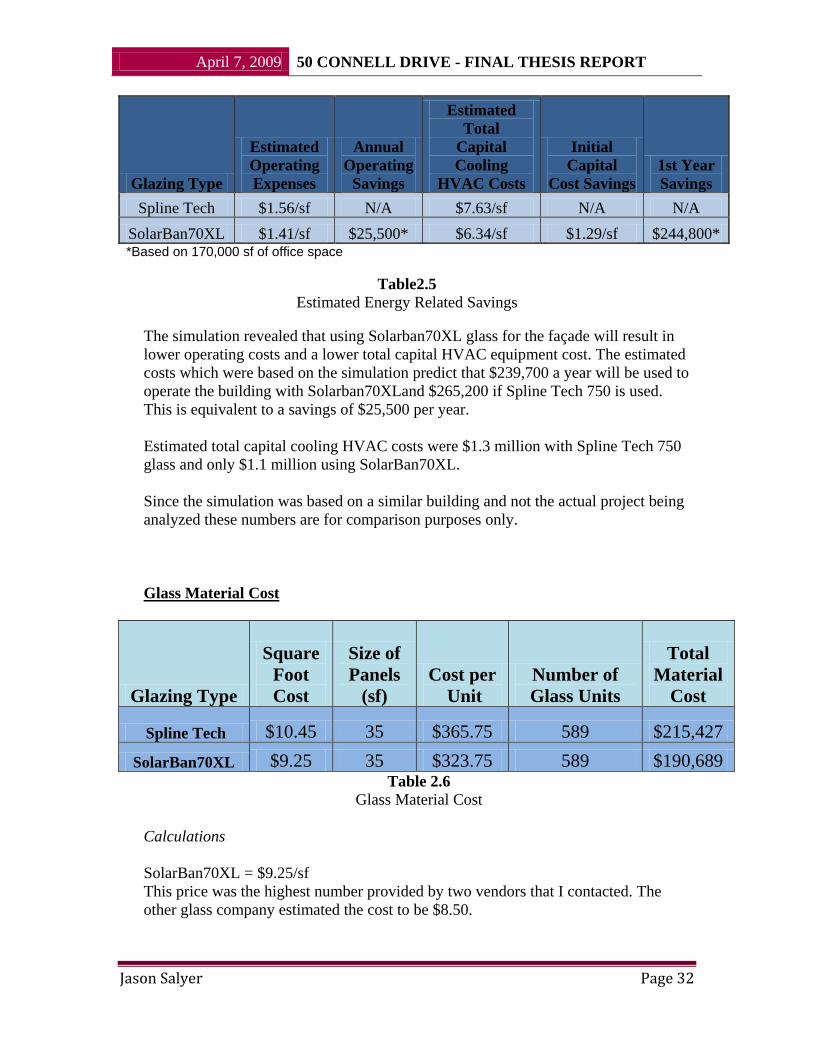
Spline Tech $1.56/sf N/A $7.63/sf N/A N/A
SolarBan70XL $1.41/sf $25,500* $6.34/sf $1.29/sf $244,800* *Based on 170,000 sf of office space
Table2.5
Estimated Energy Related Savings
The simulation revealed that using Solarban70XL glass for the façade will result in
lower operating costs and a lower total capital HVAC equipment cost. The estimated
costs which were based on the simulation predict that $239,700 a year will be used to
operate the building with Solarban70XLand $265,200 if Spline Tech 750 is used.
This is equivalent to a savings of $25,500 per year.
Estimated total capital cooling HVAC costs were $1.3 million with Spline Tech 750
glass and only $1.1 million using SolarBan70XL.
Since the simulation was based on a similar building and not the actual project being
analyzed these numbers are for comparison purposes only.
Glass Material Cost
Glazing Type
Square
Foot
Cost
Size of
Panels
(sf)
Cost per
Unit
Number of
Glass Units
Total
Material
Cost
Spline Tech $10.45 35 $365.75 589 $215,427
SolarBan70XL $9.25 35 $323.75 589 $190,689 Table 2.6
Glass Material Cost
Calculations
SolarBan70XL = $9.25/sf
This price was the highest number provided by two vendors that I contacted. The
other glass company estimated the cost to be $8.50.

April 7, 2009 50 CONNELL DRIVE - FINAL THESIS REPORT
Jason Salyer Page 33
YCW 750 Spline Tech was purchased at = $10.45/sf
Each vision glass panel = 5’ x 7’ = 35sf
Material cost for each SolarBan panel = $9.25/sf * 35sf = $323.75 per panel
Material cost for each Spline Tech panel = $10.45/sf * 35sf = $365.75 per panel
South façade = 228 units
West façade = 109 units
North façade = 153 units
East façade = 99 units
Total = 589 vision glass units
SolarBan70XL total material cost = 589 units* $323.75 /unit = $190,689
Spline Tech 750 = 589 units* $365.75/unit = $215,426
Schedule:
Figure 2.2, displayed below, shows the schedule for the glass installation.
Figure 2.2 - Schedule
Conclusions:
Side - By - Side Glass Comparison
Glazing Type
U- Value
Square Foot Cost
Cost per
Unit
Total Glass
Material Cost
Glass Material
Cost Savings
Estimated Energy
Reduction
Estimated Equipment
Cost Reduction
Spline Tech 0.45 $10.45 $365.75 $215,427 N/A N/A N/A
SolarBan70XL 0.26 $9.25 $323.75 $190,689 $24,738 9% 16%
Table 2.7
Glass Comparison

April 7, 2009 50 CONNELL DRIVE - FINAL THESIS REPORT
Jason Salyer Page 34
The findings of this analysis are summarized above in Table 2.7. Significant energy
savings can be obtained by upgrading to a high performance glazing on the façade.
With the aid of a computer simulation an estimated annual energy savings of nearly
9% can be achieved. This is consistent with the manufacturer’s (PPG) claim that the
glass will reduce operating costs by at least 5% in comparison to standard solar
control low-e glass. It also predicted a 16% reduction in first equipment costs due to
the lower load on the building. Again, these numbers are for comparison purposes
only and actual building performance would vary.
Surprisingly, the material cost for the high performance glazing, SolarBan70XL, was
lower than the cost of the glass that was actually used on the project. Using SolarBan
would save nearly $25,000 in upfront material costs for glass alone. It seems unusual
that a product of lower cost can offer such high returns. It should be noted that the
cost information that was obtained from vendors was their estimated material cost and
it is possible that the real cost may be higher if they were to bid this project.
The numbers in this analysis clearly show that the owner would save money by
upgrading to the high performance glass. This was a good analysis because the
findings show real savings.

April 7, 2009 50 CONNELL DRIVE - FINAL THESIS REPORT
Jason Salyer Page 35
Analysis 3: Prefabrication
Problem Statement:
Prefabrication is becoming more commonplace in the industry. The only part of this
building that utilized prefabrication was the panel wall system. This analysis will
determine whether there are any other building components that can benefit from
prefabrication. Benefits of standardization of parts would be measured by the schedule
and cost savings impact that it has on the project.
Systems Analyzed:
Prefab plumbing pipe
Modular central plant
Research Methods:
Research was conducted through several means. Consulting with construction experts,
contacting suppliers/contractors and online literary reviews were all used to obtain
information about these systems. I also consulted with the Turner team who ran the
project to see if they could help identify areas that would benefit from standardization.
Expected Outcome:
I expect that there can be some measurable schedule and cost savings from utilizing
standardization of parts on this project. Research has shown that highly repetitive tasks
that normally require a lot of field labor have the most potential for benefit. There is
concern that that there are not enough bathrooms in this building for prefabricated
plumbing assemblies to be economical. A modular central plant should greatly reduce
installation time since it is delivered pre-engineered and pre-assembled, complete with
chillers, pumps, cooling towers and interconnected piping.
Background Info:
Mechanical System
The building utilizes a combination air/water system with a two pipe direct return. The
majority of the mechanical equipment that services the building is located inside a
penthouse on the roof. There are several air handling units within the building. Their
total connected load is 757 tons. There are a total of four McQuay Destiny air handling
units that supply air to the building. AHU-1 and AHU-2 do the bulk of the work. They
are capable of supplying 15,500 CFM and 18,400 CFM with a capacity of 710 MBU and
841 MBU respectively. AHU-1 & 2 are in the penthouse and are 100% outside air units
that preheat the air, they do not cool it, and feed it to air cooled condensing units
(ACCU). There are two ACCU’s per floor. The building also makes use of a smaller
2000 CFM, 180 MBU unit located in the penthouse. This provides heating and

April 7, 2009 50 CONNELL DRIVE - FINAL THESIS REPORT
Jason Salyer Page 36
ventilation solely for the two penthouse rooms. It is not part of the central system. The
last air handling unit is located at the loading dock. It heats and cools the air for that area
only.
Each floor has two self contained heating/cooling units (ACCU’s) that are used to control
the indoor environment. Fan powered VAV terminal unit boxes, electric unit heaters and
self contained AC units are used to control the air temperature in each room. A 1739
MBU capacity boiler located within the penthouse is used to heat the building’s water
supply. Also located on the penthouse are two Baltimore Air Coil closed circuit cooling
towers, each with a 432 ton capacity. They are of an induced draft design with vertical
air discharge. The towers use an aqueous glycol solution as the heat transfer fluid.
Proposed System Description:
Modular Central Plant
A McQuay Modular Central Plant will be the piece of equipment examined for this
analysis. A modular central plant come pre assembled from one supplier with the chiller,
cooling tower, pumps, and interconnecting condenser water piping in one module. Their
unique modular configuration reduces site installation time. They are a low cost, highly
efficient alternative to site built plants. The McQuay Modular Central Plant is internally
controlled, and is run from a single control panel. Units are shipped to the job site for
final assembly, bypassing the need for traditional site built cooling plants. The major
advantage to this system is it reduces trade coordination costs and site assembly time.
This type of system was recently installed on the Herakles Data Center project. The entire
installation period took just one week from the time it was dropped into place, bolted,
wired and piping hooked up.
Figure3.1
Modular configuration allows easy delivery to site

April 7, 2009 50 CONNELL DRIVE - FINAL THESIS REPORT
Jason Salyer Page 37
Figure 3.2
Hoisting a Modular Central Plant into place
Figure 3.3
Crew placing a Modular Central Plant

April 7, 2009 50 CONNELL DRIVE - FINAL THESIS REPORT
Jason Salyer Page 38
Figure 3.4
Modular Central Plant with a plate in frame heat exchanger with secondary pumping
Figure 3.5
Components of a modular central plant

April 7, 2009 50 CONNELL DRIVE - FINAL THESIS REPORT
Jason Salyer Page 39
Figure 3.6
Housing of a modular central plant

April 7, 2009 50 CONNELL DRIVE - FINAL THESIS REPORT
Jason Salyer Page 40
Figure 3.7
Complete package on flatbed truck
Advantages of Modular Plant:
Installing a modular central plant has many advantages from a construction perspective.
They are summarized in Table 3.1. Since all of the components are coming from a single
supplier there is less risk that coordination problems will arise. A single source supplier
means there are also fewer chances for suppliers to fall behind schedule and not deliver
the product on time. The biggest advantage with this option is the system’s modular
design allows it to be delivered to the site on a flatbed truck in one pre-assembled unit.
This equates to dramatically reduced site assembly time. The only work that needs to be
done once it has been dropped into place and bolted is hook up the wiring and piping.

April 7, 2009 50 CONNELL DRIVE - FINAL THESIS REPORT
Jason Salyer Page 41
Less field labor is needed compared to the site built systems that were used on the
project. The owner will also appreciate the fact that the capacity of a modular unit is
easily expandable if future energy needs surpass its current capacity.
Disadvantages of Modular Plant:
Construction Concerns
One can also make an argument against using a modular central plant. There are several
disadvantages from a construction viewpoint. These are also summarized in Table 3.1. A
contractor will be concerned about lead time. This piece of equipment is a long lead item.
An order must be placed months in advance. It is not something that can be picked up
readily from the supplier because it needs to be custom designed for the project.
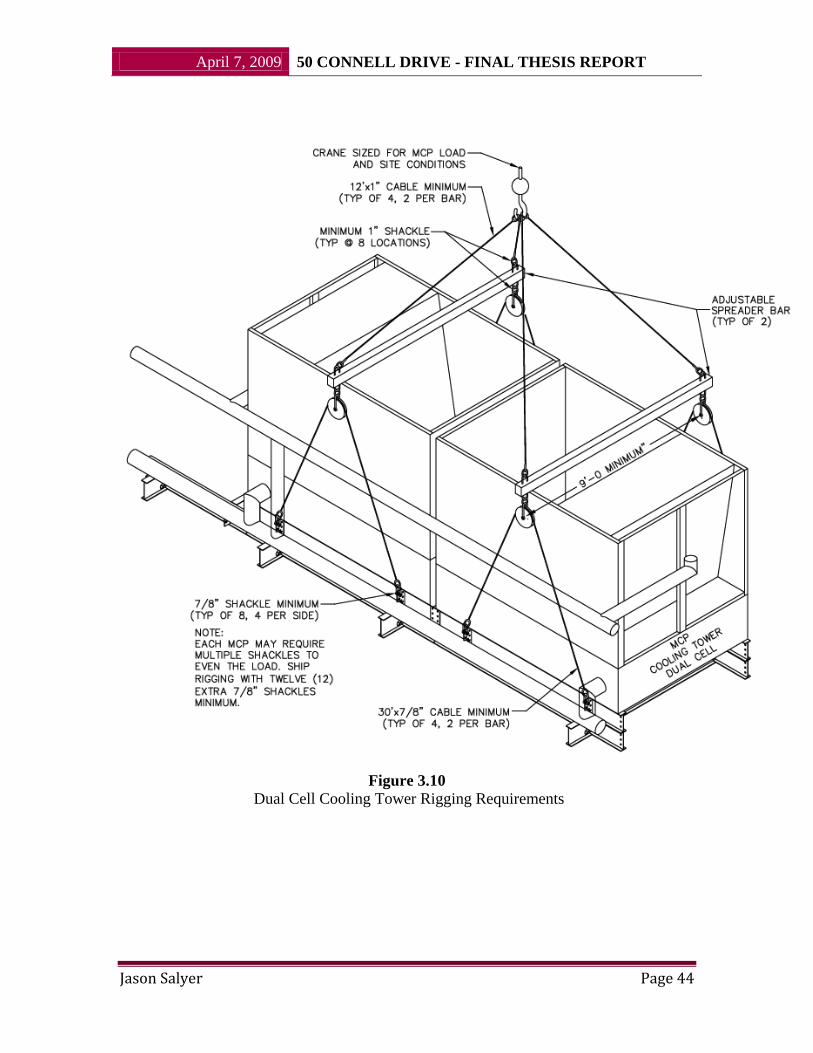
The plant is also a very heavy piece of equipment. It weighs 132,000 pounds or 66 tons.
There are two main concerns regarding its weight. It will require a crane to hoist it into
place. Riggers and rigging equipment will be needed to safely hoist the unit. See Figures
3.9 and 3.10. Multiple shackles, adjustable spreader bars and cables all must be included
for the lift.
The other major concern is that the
building’s structural system cannot
support a modular plant. A STAAD
analysis revealed that the beams which
support the floor of the mechanical
penthouse are not strong enough to
support the added weight. There would be
a considerable amount of structural costs
involved with supporting the larger
equipment.
Figure 3.8
Placing equipment on grade
An alternative to placing the equipment in the penthouse would be to locate it on grade.
See Figures 3.11 and 3.12 for a typical equipment setup. This is typical for modular
central plants. This would eliminate the need for a mechanical penthouse. However it will
likely take away from available parking space on the ground. The mechanical equipment
was placed in a penthouse because the architect did not want the equipment within view
of the public. A modular central plant located on grade would require a barrier to block it
from public view.

April 7, 2009 50 CONNELL DRIVE - FINAL THESIS REPORT
Jason Salyer Page 42
Modular Central Plant
Advantages Disadvantages
Reduced owner & contractor risk Long lead time
Single source supplier Heavy loads
Fast site assembly time Structural coordination
Reduced trade coordination Rigging & crane requirements
Less field labor required Vibration isolation
Easily expandable May need to locate on grade
Table 3.1
Construction Issues
Design Concerns
There are also design concerns that arise when considering the use of a modular plant. A
reason for not using one central unit is if the unit goes down, the entire building is
without service until the unit is fixed. A building can limp along when one of the eight
ACCU’s is not working, or is down for maintenance. This is not the case with the
proposed modular central plant. The current design allows for one unit on a floor to be
off for service while the other unit handles the entire floor. Both units running at full
speed would only be required only during peak cooling design load, so this makes
scheduled maintenance easier.
Another reason against using the modular plant is that this building is rentable space. It
is possible to have only one floor occupied, or part of one floor and another part of a
different floor. If using one central unit, it must run for occupied mode during normal
business hours. This could be a large waste of energy if the building is under-occupied. It
could also be difficult to get all the VAV boxes and fan powered boxes to work properly
if the main supply fan is slowed for the low load.

April 7, 2009 50 CONNELL DRIVE - FINAL THESIS REPORT
Jason Salyer Page 43
Figure 3.9 – Chiller/Pump Rigging Requirements
April 7, 2009 50 CONNELL DRIVE - FINAL THESIS REPORT
Jason Salyer Page 44
Figure 3.10
Dual Cell Cooling Tower Rigging Requirements

April 7, 2009 50 CONNELL DRIVE - FINAL THESIS REPORT
Jason Salyer Page 45
Figure 3.11
Elevation View of Concrete Slab Mounting
Figure 3.12
Plan View of Concrete Slab Mounting

April 7, 2009 50 CONNELL DRIVE - FINAL THESIS REPORT
Jason Salyer Page 46
Schedule Comparison:
It is estimated that the amount of time spent working on mechanical equipment in the
penthouse could have been reduced from 126 days to 89 days if a modular plant were
used. This time savings of 37 days is possible because the components of the modular
plant are pre-installed and ready to be hooked up to the system.
There are some sequencing differences between this option and traditional equipment.
Traditional equipment is put into place and then crews work to install the supporting
piping and wiring. Typically when a modular plant is used the work is done in reverse.
The piping and wiring is installed and then the modular plant is dropped into place and
hooked up. See Figure 3.13 on the next page for more details on the schedule
comparison.

April 7, 2009 50 CONNELL DRIVE - FINAL THESIS REPORT
Jason Salyer Page 47
Figure 3.13 – Schedule Comparison

April 7, 2009 50 CONNELL DRIVE - FINAL THESIS REPORT
Jason Salyer Page 48
Structural Breadth Study:
The building’s structural system was analyzed to determine whether they would be able
to support the proposed modular central plant. The analysis was performed by modeling
the structure in STAAD. See Appendix E for details. Instead of modeling the entire
building’s structural system a simplified analysis was performed. The beams that support
the slab of the mechanical penthouse were modeled with a uniform distributive load that
was equivalent to the weight of the equipment and the weight of the slab. Since
W18x35’s are used throughout the entire penthouse a single W18x35 beam with a 30 foot
span was analyzed with the distributive load to determine if it can support the load. See
Figure 3.14 for the framing plan and equipment location.
Results:
The STAAD analysis revealed that the weight of the modular plant would cause the
supporting W18x35 beams to deflect 2 inches. This deflection is greater than L/240 and
equal to L/180. The calculation assumed the equipment weight is uniform over its entire
area. However this is not actually the case. The chillers are heavier than most of the
equipment and that weight would be concentrated in a small area. The actual load on the
beam would be higher than the 1.6 Kips/ft that was used in the analysis to obtain the 2”
deflection. Sound engineering judgment can be used to reason that the beams in the
penthouse are not strong enough to support the load of the modular plant.
Figure 3.14- Location of Modular Central Plant

April 7, 2009 50 CONNELL DRIVE - FINAL THESIS REPORT
Jason Salyer Page 49
Calculations:
6” concrete slab
Concrete = 150pcf
150 pcf * .5 ft = 75 psf
75 psf * 6 ft beam spacing = 450 plf
Base Modular central plant with no add on options = 132,000 lbs = 66 tons
Modular plant dimensions (L x W) = 52’ x 23’
Central Plant = 110psf * 6 ft beam spacing = 660 plf
Live load reduction = 1.2D + 1.6L = 1.2*450plf + 1.6*660plf = 1,596plf = 1.6klf
Allowable Deflection:
L/240 = (30*12)/240 = 1.5”
L/180 = (30*12)/180 = 2”
Proposed System Description:
Plumbing Tree
A plumbing tree is a prefabricated set of drain waste, vent, and supply lines for use in
bathrooms. They are assembled in a factory and delivered to the site in sections. Each
section is placed in the building and connected to the adjacent sections and/or the
plumbing fixture. In this building it would be used to fabricate the run of pipes behind the
toilets, sinks and urinals. See Figure 3.14 below for an illustration.
Figure 3.15 – Prefab plumbing sections

April 7, 2009 50 CONNELL DRIVE - FINAL THESIS REPORT
Jason Salyer Page 50
Advantages of Plumbing Tree
The main advantage of using this method is less field labor is required. As a result it has a
faster assembly time. This allows finishing crews to enter the bathrooms earlier than they
would have been able to if the piping had been assembled on site piece by piece.
Disadvantages of Plumbing Tree
A plumbing tree is not economically feasible on all projects. The transportation costs for
a plumbing tree are higher than that of piping that is installed entirely on site. That is
because plumbing trees take up a lot of space and must be packed accordingly while
regular piping can be packed tightly onto a truck. They are most often used on projects
that have a lot of plumbing and are best used for repetitive work. Another
constructability concern that must be taken into consideration is the length of the
sections. The size of the material hoist is the limiting factor. For example a convenient
plumbing tree length for this building would be 25 feet since that is the length of the row
of toilets in the bathroom. However a 25 foot section will not fit in a 15 foot long
material hoist. There is also a lead time associated with the prefabricated sections.
Conclusions:
Modular Central Plant
The disadvantages outweigh the advantages of using a modular central plant for this
project. The central plant would require about a month less time to install but there are
major shortfalls that come with this system. The operating requirements and extra weight
are major problems. The mechanical engineers that designed the current system did a
good job and choose the correct system. Nonetheless it was worth taking a look at the
modular central plant option.
Plumbing Tree
After consulting with members of the Penn State AE faculty, an OPP manager, industry
members and my own personal literary research I have determined that the benefits of
using prefabricated plumbing on this project do not outweigh the costs. The reason this is
the case is because of the type of project this is. A four story commercial office building
has limited opportunity to use this system because there are only two bathrooms per
floor. The time saved installing the prefab sections would not justify the cost of the
material. If this building were a high rise or an apartment building with a lot of repetitive
units using prefabricated piping would be a good idea because there would be enough
work to make it economically feasible.

April 7, 2009 50 CONNELL DRIVE - FINAL THESIS REPORT
Jason Salyer Page 51
Reducing Operating Costs
Critical Industry Issue
Introduction:
This analysis will focus on different techniques that owners are using to reduce their
annual operating costs. Energy and water consumption will be the two main issues
examined. The analysis will focus on both general design practices that can be applied
broadly to the building industry and on specific practices that can applied to effectively
reduce the operating costs of 50 Connell Drive.
In recent years the operating costs of buildings has increased. This is due mainly to an
increase in energy consumption. The rise of energy consumption is due to an increasing
demand. Today’s buildings have more equipment that requires electricity than buildings
of past generations. Designers must consider the impact of computers, monitors,
appliances, copiers, printers and others. For example a modern office building may have
thousands of computers. Not only do these computers use energy to operate but they also
put out a lot of heat. This heat load raises the temperature of the indoor environment. As
a result a greater cooling load is required by the HVAC system.
Energy Efficient Design:
It is important to understand where the costs come from. The combined cooling and
heating loads of office buildings can be expected to be between 35% and 40% of the total
energy load. Conduction, the transfer of heat through matter such as the materials that
make up the envelope of the building, is responsible for much of this load. One study
found that 50-60% of the heating load is from conduction and about 30-40% of the
cooling load is a result of conduction [Green BIM, Eddy Krygiel and Bradley Nies,
2008].
A study by Eddy Krygiel and Bradley Nies, the authors of “Green BIM” has found that
some of the most common energy efficient measures include:
Building orientation
Optimized envelope
Optimized glazing
Optimized shading
Daylight dimming
Optimized lighting
Efficient equipment and fixtures
Passive solar
Natural ventilation
Optimized mechanical systems

April 7, 2009 50 CONNELL DRIVE - FINAL THESIS REPORT
Jason Salyer Page 52
Many of these items have a synergistic affect on a building’s performance. Applying just
one or two of these techniques will likely result in a relatively small increase in
performance while applying all of these strategies together will greatly reduce energy
consumption and result in a truly high performing building. Many of these design
practices take advantage of the earth’s most powerful natural resource, the sun. The sun
provides light and heat, two important resources that designers should take advantage of.
Building orientation, massing and optimized envelope, glazing, shading and lighting
combined with daylight dimming can be combined for a synergistic effect resulting in a
collectively better performance.
A quality building envelope is one of the most basic strategies for saving energy in an
office building. New Jersey experiences very cold dry winters and very hot humid
summers as shown in Figure 4.1. As a result of this climate type, a high value of thermal
resistance is required in roofs, walls and windows if owner wish to operate their building
at a set temperature and humidity
Figure 4.1 – Temperature Fluctuations of NJ
The southern exposure of a building offers a great source of solar heat gain from the sun.
To take advantage of the sun’s energy the building should be oriented to face solar south
and the building’s mass should be elongated in the east-west direction. Selecting the
proper amount of glazing, location and type of glass for the south façade the usable
daylight can be harvested. This can decrease the amount of overhead artificial light
required to light the space. By combining daylight dimmers on the south perimeter the
amount of artificial light that is used in the space can be optimized. A clear advantage of
this is less energy is required to light the space since the sun provides most of the lighting
needs. A second advantage that may be less obvious is the cooling load on the building is
actually reduced. This is because artificial lights emit heat into the indoor environment
and now the amount of heat emitted by these lights has been reduced. The amount of

April 7, 2009 50 CONNELL DRIVE - FINAL THESIS REPORT
Jason Salyer Page 53
solar light that penetrates into the space can be further controlled by introducing external
shading devices and internal light shelves. This can be particularly helpful on the
southern façade. These shades can reduce unwanted solar heat gain during the summer
months.
Each façade of the building should be treated differently with respect to glazing.
Designers must consider which direction the sunlight is coming from. The sun is very
low in the sky during the early morning and late evening hours. This makes it difficult to
control within the office space. For this reason it is good practice to place a relatively
small percentage of glazing on the east and west facades of the building. It is also
important to consider the percentage of glass used to provide daylight and the thermal
conductive resistance of the exterior wall for comfort within the space. The three
important factors to consider when choosing the type of glass is the U-value, visible light
transmittance (VLT) and solar heat gain coefficient (SHGC). These all affect the design’s
ability to permit daylight penetration which in turn affects the heating and cooling loads
within the space.
The Operator’s Role:
Operating costs can also be controlled by the building’s operators. Energy consumption
can be reduced simply by setting the thermostat slightly higher in the summer months and
slightly lower in the winter months. Typically 71 degrees is the set point for heating. A
fairly large amount of energy can be saved by setting the system to 70 degrees. Likewise
the typical set point for cooling is 73 degrees. Operators can reduce energy consumption
by operating at 76 degrees. One study found that these changes can lower a building’s
energy consumption by 8%. If more energy savings is desired consider varying the set
point temperatures even more. The same study found that energy consumption can be
reduced by 23% by heating at 66 degrees and cooling at 78 degrees. See Table 4.1 for
more detailed information on the energy savings associated with changing heating and
cooling set points.

April 7, 2009 50 CONNELL DRIVE - FINAL THESIS REPORT
Jason Salyer Page 54
Heating/Cooling Setpoint Baseline Case 1 Case 2 Case 3 Case 4 Case 5
Item 71/73 70/74 70/76 70/78 68/76 66/78
Hot Water 68.5 68.5 68.5 68.5 68.5 68.5
Lights 600.6 600.6 600.6 600.6 600.6 600.6
Misc. Equipment 549.2 549.2 549.2 549.2 549.2 549.2
Heating 1483.2 1403.9 1309.5 1262.1 1106.6 921
Cooling 331.8 312.8 266.3 223.9 257.3 221.1
Pumping 213.6 204.6 194.7 189.8 164.9 138.8
Ventilation Fans 363.8 349.4 330.8 318.2 309.9 282.6
Total MBTU/Year 3610.7 3489 3319.6 3212.3 3057 2781.8
% Energy Reduction vs Baseline 0% 3% 8% 11% 15% 23%
* Data represents 5 story, 50,000 sf office building located in Boston
Table 4.1 – Energy Savings with Different Temperature Setpoints
Water Consumption:
Paying for energy is not the only operating cost that must be considered by building
owners. Water consumption is often overlooked. Drinking water is often used for
irrigating turf grass lawns and flushing toilets. These areas offer the most potential to
reduce the overall consumption of water. Existing buildings that are older than 15 years
typically use 3.5 gallons per flush (GPF). Owners of these buildings should strongly
consider upgrading to the current standard of 1.6 GPF or less. The plumbing industry has
introduced toilet fixtures that have an average flush volume lower than the mandated 1.6
gallons per flush. New projects can take advantage of dual flush (1.6/.8 GPF), low flow
(1.2 GPF), ultra low flow (.8 GPF) or even waterless toilets. Urinals are now offered with
similar options. Currently urinals are mandated to be 1 GPF or less
Bathroom sinks can also take advantage of low flow fixtures. Infrared sensor and metered
(self closing) sink faucets save a substantial amount of water. These savings can amount
to 75% less water as compared to a standard faucet. Owners who are serious about
reducing their operating costs may favor the metered faucets over the infrared sensors.
This is because the infrared system requires hard wired power or battery power in order
to operate. The flow rate of the water through the faucet is another factor that must be
taken into consideration. Many states mandate a maximum of 2.2 GPM.
Rainwater harvesting offers an innovative solution to reduce consumption of the
domestic water supply. Rainwater can be collected from parking lots and roofs and stored
in cisterns until it is ready for use. The harvested water can be used for a variety of
applications. These applications include flushing toilets, irrigation, industrial processes
and chiller water. Not only is harvesting rainwater free but it puts less demand on the

April 7, 2009 50 CONNELL DRIVE - FINAL THESIS REPORT
Jason Salyer Page 55
municipal water supply and conserves resources. It is recommended that non potable
needs be given priority as there are filtration and cleaning costs involved. It is unlikely
that a rainwater harvesting system can create potable water more cost efficiently than the
municipal potable water supply.
Irrigation for landscaping can consume massive amounts of water. Owners should
consider planting indigenous landscaping species which do not require irrigation. If
owners really wish to use plants and turf that require irrigation, or they simply do not feel
comfortable not having control over irrigation, they should give strong consideration to
highly efficient irrigation systems or rainwater harvesting. Drip irrigation systems use
approximately 50% less water than traditional irrigation systems.
Mechanical Systems
When selecting a standard packaged air cooled mechanical unit the engineer should look
carefully at the Energy Efficiency Ratio (EER). This is a measurement of a peak rating
performance at 80 degrees indoors and 95 degrees outdoors. The engineer should also
check Integrated Part Load Value (IPLV). This measurement provides overall unit
efficiency under partial loading conditions. It is important to note that EER and IPLV
ratings are for air cooled equipment only.
Water cooled equipment is usually considered to be more efficient than its air cooled
counterparts. To take advantage of this technology the owner must be willing to invest
money in the cooling tower and pumps.
There are also factors to consider when selecting a boiler or furnace. Since these units use
heat to transfer energy it is important to consider their thermal efficiency. In most parts of
the United States natural gas is cheaper than electricity per thermal unit. In these areas
gas powered units can be used to take advantage of the energy savings.
Since heat transfer is used for boilers and furnaces there is an inherent amount of lost
energy in the form of heat. Creative engineers can capture the lost heat and use it for
other systems within the building. The heat energy that is wasted from these systems can
be exhausted to a heat exchanger for preheating the return air or water. This is a low cost
solution which results in higher total system efficiency.
On demand water heating units are becoming more commonplace in the building
industry. These units heat water as it moves through the pipes to the sinks, showers and
other fixtures. Heating the water as it is requested is much more efficient than the
traditional system which uses a storage tank that is maintained at a constant temperature.
Another advantage to the on demand heating system is that it is of small size and can be
placed near the fixture.

April 7, 2009 50 CONNELL DRIVE - FINAL THESIS REPORT
Jason Salyer Page 56
Since nearly all office buildings cannot rely solely on daylighting for task lighting it is
important to choose efficient electric lighting for the building. Typically commercial
office buildings use fluorescent lighting in the office space. Two important factors should
be considered when selecting the light fixture. The Ballast Efficiency Factor is a measure
of the ballast’s efficiency. A higher number means a more efficient ballast. Second, the
efficiency of the lamp itself, measured by efficacy, must be taken into consideration.
Recommendations for 50 Connell Drive
Many of the techniques previously mentioned have potential to reduce operating costs for
50 Connell Drive. This section will examine what areas the project can improve its
performance and highlight what was done well.
Energy Modeling:
RDK Engineers did not perform an energy model on this building. It is recommended
that computer simulations are used to evaluate a building’s energy needs. Too often
engineers rely on what was used for on a previous building of similar use and size by
these engineers. This often leads to an oversized system. Sizing the mechanical system
may be the single most important measure in reducing both upfront costs and operating
costs. Excessive on-off cycling, a common reason for oversizing the system, leads to a
rise in energy use, higher purchase cost and even shorter product life for the heating and
cooling systems. It is also extremely important to select the most efficient equipment and
provide the proper control system.
Water Reduction:
Water consumption can be reduced by replacing the standard toilets and urinals with ultra
low flush versions. All of the toilets in the building use have a standard 1.6 GPF and
urinals use the standard 1.0 GPF. Upgrading to an ultra low 0.8 GPF toilets and 0.125
GPF urinals will not only result in a substantial reduction in water consumption but will
reduce the total amount of water and sewer bills that the owner is charged by the water
company. It should be noted that water and sewer bills could be further reduced by using
waterless toilets and urinals but the owner is not interested in this technology because
they are concerned about maintenance and cleaning requirements.
It is estimated that the building will have a total of approximately 1000 occupants. If
50% of the occupants are female and each of those occupants use the toilet twice a day
that is a savings of 800 gallons of water per day. If it is assumed that males use each the
toilet and urinal once a day that is equivalent to a savings of 838 gallons per day over the
standard fixtures. The savings totals to 8190 gallons of water saved over one week and
425,880 saved annually. The New Jersey American Water Company charges a water rate
of $5.3825 per 1000 gallons and a sewage rate $3.4102 per 1000 gallons. If these rates
are applied to the reduction in water usage the building’s owner will save $3,745 per year
by upgrading to more efficient fixtures.

April 7, 2009 50 CONNELL DRIVE - FINAL THESIS REPORT
Jason Salyer Page 57
Using metered faucets with a low flow rate in the bathrooms would also be beneficial to
this project. A faucet with a 0.5 GMP flow rate would offer reduced water consumption
compared to the maximum allowable rate of 2.2 GPM. It somewhat difficult to predict
how much water will be saved since each user controls how much water they want but
some estimates put the water consumption savings at 75%. The commercial brand faucets
on the market today come with an adjustable cap that controls how long the water will
flow. This offers flexibility. In addition these faucets are now offered in a variety of
finishes and styles that can suit most any owner’s desire. As mentioned earlier, infrared
sensors are also effective for reducing water consumption but a metered faucet has less
operating costs associated with maintenance since it does not require batteries or electric
energy.
Highly efficient irrigation equipment is used on the grounds of 50 Connell Drive. This is
very good and will make a big impact in reducing water consumption and the costs that
that are charged from the water company. If the owner would like to further reduce their
water needs it is recommended that they replace any turf grass and non indigenous plant
species with plants that grow naturally in the region. Plants that grow well in that
particular climate will require less or possibly even no irrigation or fertilizers.
Air Handling Unit Upgrade:
Air handling units1 and 2 could incorporate energy recovery units with desiccant wheels.
This would make the air handlers more expensive and physically larger, but save energy.
Energy recovery will reduce the tonnage and heating load. However the air flows cannot
be reduced too much because the building will feel stuffy to the occupants.
New Jersey Energy Efficiency Program:
There is a statewide energy efficiency
program available through New Jersey’s
electric and gas utility companies. This is
known as the New Jersey Smart Start
Buildings Program. The Connell Company
has the opportunity to benefit from this
program. The Smart Start program offers
incentives for using energy efficient equipment. The program is used mainly for
improvements to existing buildings but this project is also eligible during its construction
because the area has been designated for growth in the NJ State Development and
Redevelopment Plan. These incentives offset some of the added cost to purchase
qualifying equipment which provides significant long-term energy savings. Eligible
equipment is listed below:

April 7, 2009 50 CONNELL DRIVE - FINAL THESIS REPORT
Jason Salyer Page 58
Electric Chillers
Water-cooled chillers ($12 - $170 per ton)
Air-cooled chillers ($8 - $52 per ton)
Gas Cooling
Gas absorption chillers ($185-$450 per ton)
Gas Engine-Driven Chillers (Calculated through Custom Measure Path)
Electric Unitary HVAC
Unitary AC and split systems ($73 - $92 per ton)
Air-to-air heat pumps ($73 - $92 per ton)
Water-source heat pumps ($81 per ton)
Packaged terminal AC & HP ($65 per ton)
Central DX AC Systems ($40 - $72 per ton)
Dual Enthalpy Economizer Controls ($250)
Ground Source Heat Pumps
Closed Loop & Open Loop ($370 per ton)
Gas Heating
Gas-fired boilers < 300 MBH ($300 per unit)
Gas-fired boilers ≥ 300 MBH - 1500 MBH ($1.75 per MBH)
Gas-fired boilers ≥ 1500 MBH - ≤ 4000 MBH ($1.00 per MBH)
Gas-fired boilers > 4000 MBH (Calculated through Custom Measure Path)
Gas furnaces ($300-$400 per unit)
Variable Frequency Drives
Variable air volume ($65 - $155 per hp)
Chilled-water pumps ($60 per hp)
Compressors ($5,250 to $12,500 per drive)
Natural Gas Water Heating
Gas water heaters ≤ 50 gallons ($50 per unit)
Gas-fired water heaters > 50 gallons ($1.00 - $2.00 per MBH)
Gas-fired booster water heaters ($17 - $35 per MBH)
Premium Motors
Three-phase motors ($45 - $700 per motor)

April 7, 2009 50 CONNELL DRIVE - FINAL THESIS REPORT
Jason Salyer Page 59
Prescriptive Lighting
T-5 and T-8 lamps with electronic ballast in existing facilities ($10 - $30 per
fixture, depending on quantity of lamps)
Hard-wired compact fluorescent ($25 - $30 per fixture)
Metal halide w/pulse start ($25 per fixture)
LED Exit signs ($10/$20 per fixture)
T-5 and T-8 High Bay Fixtures ($16 - $284 per fixture)
Lighting Controls
Occupancy Sensors
o Wall mounted ($20 per control)
o Remote mounted ($35 per control)
o Daylight dimmers ($25 per fixture controlled)
o Occupancy controlled hi-low fluorescent controls ($25 per fixture
controlled)
HID or Fluorescent Hi-Bay Controls
o Occupancy hi-low ($75 per fixture controlled)
o Daylight dimming ($75 per fixture controlled)
Other Equipment Incentives*
Performance Lighting ($1.00 per watt per square foot below program incentive
threshold, currently 5% more energy efficient than ASHRAE 90.1-2004 for New
Construction and Complete Renovation.)
NJ Smart Start Buildings Program:
The NJ Clean Energy Program supports solar electricity,
small wind, and sustainable biomass equipment. These
alternatives are attractive to building owners because under
this program they receive:
A 10% Federal tax credit on solar electric systems
Full exemption from NJ state sales tax on the
investment in solar electric and wind systems
Lower energy costs by offsetting supply charges
Enterprise Energy Management System:
Enterprise Energy Management System (EEMS) enables real time energy use monitoring
at one or more building locations. This is an investment that the Connell Company may

April 7, 2009 50 CONNELL DRIVE - FINAL THESIS REPORT
Jason Salyer Page 60
find this technology useful since they have 5 buildings on their property. See Figure 4.2
below. The system allows tracking and analyzing variations in electrical use over a day, a
week or a season. This information allows engineers to identify anomalies in energy
consumption.
Figure 4.2 – Connell’s Property Consists of 6 Buildings
This technology has been used successfully by many companies and institutions. Penn
State University and IBM were both studied to learn how they implemented this
technology and the cost savings they were able to achieve.
IBM hooked up meters at 20 facilities into a central data collection and display system.
Energy usage was monitored at regular 15 minute intervals. Their engineering team was
accustomed to reviewing and implementing known hardware and operating level energy
efficiency opportunities such as high-efficiency fluorescent lighting systems, time of day
building controls, variable speed fans, high-efficiency pumps, etc. However, they had no
methodology for performing ongoing optimization of building and system operations that
would utilize real electrical use. Collection of electrical use over the day provided a view
into two important factors. It revealed anomalies in energy use such as short-term
transients of high electrical use and increases in electrical use over time against a baseline
electrical use profile.
Lessons learned
This data collection system demonstrated that real-time collection and display of energy
use revealed energy-use patterns that are not seen through a review of the monthly utility
bills.

April 7, 2009 50 CONNELL DRIVE - FINAL THESIS REPORT
Jason Salyer Page 61
Two Examples
At one IBM facility a large power increase was seen between 4:00 and 8:00 and was
unexplained. An investigation revealed that for some unknown reason, an electrical boiler
was programmed to turn on at 4:00 and off again at 8:00. The boiler was serving no
useful function. Plant managers decided the boiler was not needed. The boiler was turned
off, and later removed and sold. This resulted in annual energy savings of 1,250 MWh
and $125,000 in energy expenses.
At another facility, an evaluation of the time of day data for a specific building indicated
that the electrical load was too constant over the day. An evaluation of the building’s
energy use resulted in the re-tuning of two air handling units and shutting off 544 light
fixtures. These actions resulted in a savings of over 500 MWh of electricity and $34,000
per year.
Table4.2
Typical Costs for Metering a Building

April 7, 2009 50 CONNELL DRIVE - FINAL THESIS REPORT
Jason Salyer Page 62
Figure 4.3
Components of a metering system
LEED Trends:
LEED buildings have become very popular with owners who are aiming to reduce their
operating costs. Penn State has mandated that all of its future buildings be LEED
certified. John Bechtel of OPP was able to provide details of the university’s LEED
requirements. Penn State’s LEED requirements are a good insight as to what owners view
as important. The components of PSU’s plan that impacts operating costs are briefly
outlined below.
Mandatory LEED Credits
20% Water Use Reduction
Optimize Energy Performance
Enhanced Commissioning
Outdoor Air Delivery Monitoring
Controllability of Systems: Lighting
Significant Effort LEED Credits
30% Water Use Reduction
On Site Renewable Energy

April 7, 2009 50 CONNELL DRIVE - FINAL THESIS REPORT
Jason Salyer Page 63
Continuous Commissioning:
Continuous commissioning is an ongoing process to resolve operating problems, improve
comfort, optimize energy use and identify retrofits for existing buildings. The process is
lead by an engineer. This concept has become increasingly popular among owners due to
increased energy costs. Continuous commissioning focuses on optimizing HVAC system
operation and control for existing building conditions. Unlike traditional commissioning,
continuous commissioning focuses on meeting the building’s current existing needs
rather than ensuring the system functions as originally designed.
Continuous commissioning results from 130 buildings revealed that the average utility
savings were about 20%. Payback periods were often less than two years. These results
were based on the experience of the Texas Engineering Experiment Station’s Energy
System Laboratory at Texas A & M University during the last 10 years.
The continuous commissioning process maintains long term savings by ongoing
monitoring. It improves the system reliability and building comfort by optimizing system
operation and control schedules based on actual building conditions. An engineer leads
the process and works closely with O & M staff. This translates to a higher skill level for
O & M staff. The process also reduces operating and maintenance costs.
Building that should strongly be considered for continuous commissioning have one or
more of the following criteria:
The building provides poor thermal comfort
The building consumes excessive energy
The design features of the facility’s HVAC system are not fully used
Table 4.3- Savings and Payback period by building type of 28 buildings
April 7, 2009 50 CONNELL DRIVE - FINAL THESIS REPORT
Jason Salyer Page 64
Conclusion:
There are many techniques that owners can use to fight rising operating costs. The effort
to reduce operating costs begins in the design phase and continues throughout the lifetime
of the building. These measures include but are not limited to:
Energy efficient design
Energy modeling
Efficient equipment
Energy monitory
Optimize operating set points
Taking advantage of state and federal incentives of installing efficient equipment
LEED trends
Continuous commissioning

April 7, 2009 50 CONNELL DRIVE - FINAL THESIS REPORT
Jason Salyer Page 65
Credits/Acknowledgments
This report would have been impossible to compile without the help of others. Much of
the information within this report was obtained through other people. These people
helped guide me through the thinking process and provided valuable information which
shaped the report into its final form. I would like to give special thanks to all of the
individuals listed below:
John Messner – AE Faculty
Robert Holland – AE Faculty
Kevin Parfitt – AE Faculty
David Riley – AE Faculty
Jim Faust – AE Alum
John Bechtel – Penn State OPP
Frank Simeone – Connell’s Representative
Steve Kern – Turner
Paul Angelini – Turner
Mike Squilla – Turner
Kathleen McCartney - Turner
Janet Shipton – RDK Engineers
Scott Wolf – Tri State HVAC
Joe Farina – Atlantic Exterior Wall Systems
Amy Prebil – Architectural Aluminum & Glass

Report on Energy Modeling of Select Architectural Glazings The data generated by this energy modeling program is for comparative purposes only. It is general in nature and will vary for specific buildings according to numerous variables, including building design and type, site location, occupation and utilization levels, local utility costs and more. Energy consumption simulations are based on modeling conducted with the U.S. Department of Energy (DOE) 2.2 Building Energy Analysis Simulation Tool developed at the Lawrence Berkeley National Laboratory and Los Alamos National Laboratory. It is the most accurate and well-documented energy modeling tool available in the U.S. DOE-2 calculates hour-by-hour energy consumption by the prototype facility over an entire year (8,760 hours) using hourly climate data for the location under consideration. Input into the DOE-2 Model consists of detailed descriptions of the buildings being analyzed, including the hourly scheduling of occupants, lighting, equipment and thermostat settings. The DOE-2 Model provides accurate simulation of building features such as shading, fenestration, interior building mass, envelope building mass, and the dynamic response of differing heating and air conditioning system types and controls. All energy simulation scenarios are calculated with the following data:
• Total Electric Consumption (kWh) • Total Natural Gas Consumption (therms) • Total Electric Cost ($) • Total Natural Gas Cost ($) • Total Building Energy Consumption Cost ($)
• Total Cooling HVAC Capital Cost ($) • Annual Energy Savings Using Low E Coatings ($) • Initial Capital Savings Using Low E Coatings ($) • Annual CO2 Reduction Using Low E Coatings (tons) • 40 Year CO2 Reduction Using Low E Coatings (tons)
Details on Selection Criteria 1. Glazing Type – This energy modeling program contains comparative data for eight (8) commonly specified glazing types. The
table below lists the specific glazing types along with their manufacturer-published performance characteristics (when they are used as part of a standard one-inch insulating glass unit).
Results
Glazing Electricity Gas TotalOperating
ElectricCost
TotalOperatingGas Cost
TotalOperating
Cost
Total CapitalCooling
HVAC Cost
AnnualOperating
Cost Savingsof Low E
Coatings vsDT
Initial CapitalCost Savings
of Low ECoatings vs
DT
Annual CO2Savings of
Low E vs DT
40 YearBuilding LifeCO2 Savings
of Low ECoatings vs
DT
DoublePaneTinted
4,668,441 106,206 $289,615 $142,896 $432,511 $2,107,615 $ $
Solarban60 (2)
4,357,313 87,585 $275,926 $118,215 $394,141 $1,903,811 $38,370 $203,804 266 10,642
Solarban70XL (2)
4,232,593 81,963 $270,438 $110,722 $381,160 $1,713,032 $51,351 $394,583 363 14,502
Solarban80 (2)
4,188,706 81,528 $268,506 $110,131 $378,637 $1,667,658 $53,874 $439,957 388 15,521
SolexiaSungate500 (3)
4,480,418 95,400 $281,344 $128,579 $409,923 $2,013,789 $22,588 $93,826 158 6,333
VE 2-2M(2)
4,313,646 84,398 $274,003 $113,967 $387,970 $1,786,403 $44,541 $321,212 307 12,261
Criteria: Solarban 70XL (2), 8-Story Office with Window Wall in Philadelphia

To ensure valid comparisons, this program automatically reports data on glazings that are similar in appearance to the one selected by the user. For example, when Solarban 60 glass (PPG) is chosen by the user, comparative data for Solarban 70XL glass (PPG) and VE2-2M (Viracon) are included in the report. That’s because these glazings feature a clear, color-neutral aesthetic. Tinted glazings such as Solexia glass (PPG), Solarban z50 glass (PPG) and VE1-52 (Viracon) are grouped similarly.
Figures may vary due to manufacturing tolerances. All tabulated data is based on NFRC methodology using the LBL 5.2 software. Variations from previously published data are due to minor changes in the LBL Window 5.2 software versus Version 4.1.
2. City - Energy simulations with DOE 2.2 software are based on the utility rates and weather data of the city selected. 3. Glazing Design – This DOE-2 simulation is based on a
The following chart shows the estimated total glass area for the façade of the glazing design/building selection.
Glazing Tvis Rfvis Tsol Rfsol U-Value ShadingCoefficient
(SC)
Solar HeatGain
Coefficient(SHGC)
Double Pane Tinted 0.620 0.100 0.540 0.090 0.570 0.720 0.620
Solarban 60 (2) 0.704 0.112 0.328 0.293 0.291 0.438 0.380
Solarban 70XL (2) 0.617 0.108 0.227 0.347 0.286 0.311 0.270
Solarban 80 (2) 0.470 0.330 0.200 0.380 0.290 0.280 0.240
Solarban z50 (2) 0.510 0.080 0.250 0.230 0.290 0.360 0.310
Solexia Sungate 500 (3) 0.640 0.140 0.330 0.090 0.350 0.510 0.450
VE 1-52 (2) 0.500 0.160 0.320 0.200 0.320 0.460 0.400
VE 2-2M (2) 0.600 0.090 0.240 0.100 0.290 0.360 0.310
Window Wall scenario.
Glazing Design / Building Total Wall Area (sqft) Window to Wall Ratio Total Glass Area (sqft)
Window Wall / 8 - Story Office 56,640 90% 50,976

4. Building Prototype Description and Characteristics – The characteristics for the selected building type is displayed below. These characteristics were developed in a study conducted by the Lawrence Berkley Laboratory’s Applied Science Division, based on regional and national criteria. Each building type was adjusted to be compliant with ASHRAE 90.1-1999.
Visit us on the web at www.ppgideascapes.com or call (888) - PPG IDEA


325 350 375 400 425
(Qty) 2 2 2 2 2(Tons) 650 700 750 800 850(ft x ft) 52 x 23 52 x 23 52 x 23 52 x 23 52 x 23
(ft) 17.25 17.25 17.25 17.25 18.75(ft x ft) 66 x 29 66 x 29 66 x 29 66 x 29 66 x 29
(lbs) 124,800 128,800 129,000 131,600 135,600(GPM) 1,300 1,400 1,500 1,600 1,700
(°F) 56/44 56/44 56/44 56/44 56/44(in) 8 8 8 10 10
(MCA) 903 1,002 1,039 1,071 1,261(MCA) 67 67 67 67 67
(kW/Ton) 0.731 0.758 0.737 0.716 0.768
WSC WSC WSC WSC WSCCentrifugal Centrifugal Centrifugal Centrifugal Centrifugal
(Tons) 323.1 350 375 400 425(Qty) 1 1 1 1 1
(V/Hz/P) 460/60/3 460/60/3 460/60/3 460/60/3 460/60/3(kW) 191.5 213 224.4 234.2 255.8
(RLA each) 267 298 312 325 354(Ft Hd) 10.7 12.2 13.9 9.4 10.4(Ft Hd) 7.5 8.5 11.9 10.8 12
(kW/Ton) 0.593 0.609 0.598 0.585 0.602(kW/Ton) 0.562 0.577 0.57 0.553 0.586
(Model No) AV6301 AV6301 AV6301 AV6301 AV6403Open Crossflow Open Crossflow Open Crossflow Open Crossflow Open Crossflow
(Qty) 2 2 2 2 2(V/Hz/P) 460/60/3 460/60/3 460/60/3 460/60/3 460/60/3
(Hp each) 10 10 10 10 20VFD VFD VFD VFD VFD
(Model No) 4300 4300 4300 4300 4300(Qty) 1 1 1 1 1
(GPM each) 650 700 750 800 850(Ft Hd) 75 75 75 75 75
(Hp each) 25 30 30 30 30
(Model No) 4300 4300 4300 4300 4300(Qty) 1 1 1 1 1
(GPM each) 975 1,050 1,125 1,200 1,275(Hp each) 15 20 20 20 25
(btuh) 14,400 14,400 14,400 14,400 14,400(Watts) 9,900 9,900 9,900 9,900 9,900
(V/Hz/P) 208/60/1 208/60/1 208/60/1 208/60/1 208/60/1
(Model No.) NLAP-150 NLAP-150 NLAP-150 NLAP-150 NLAP-150Bladder Bladder Bladder Bladder Bladder
(Gal) 36 36 36 36 36
12345
6789101112
Quantity
Electrical Load - 208V/60Hz/1PH (Note 6)
MCP-WSC-SCS-XXX-2GENERAL DATA
Evaporator Pressure DropCondenser Pressure DropFull Load Performance
CONDENSER WATER PUMP (Note 8)Manufacturer - Armstrong
All condenser water piping, fittings and couplings are galvanized steel, standard.
MCP SUMMARY (Note 2)Number of Modules
Floor Plan Dimensions - L x W (Note 3)Maximum Equipment HeightMinimum Clearance Dimensions - L x W (Note 4)Total Operating Weight
Condenser Water Flow
COOLING TOWER (Note 7)Manufacturer - Marley
Manufacturer - ArmstrongQuantity
Pressure External to MCPChilled Water Flow
Motor Horsepower
OPTIONAL EQUIPMENT (Note 12)
One (1) 460 volt connection per module. MCA (Minimum Circuit Ampacity) is the total 460 volt electrical load for the complete MCP, inclusive of all modules.
Motor Horsepower
PACKAGED TERMINAL A/C UNITCooling Capacity
Type
Cooling Tower performance is based on 78°F WB project design condition. Consult factory for projects with higher design conditions.
Heating CapacityElectrical
One (1) 208 volt electrical connection for all MCP modules. MCA (Minimum Circuit Ampacity) is the total 208 volt electrical load for all MCP modules.
EXPANSION TANKManufacturer - Wessels Company
Electrical load is based on Standard Chilled Water Pumps. Refer to Optional Pump Data for 460 volt electrcial loads associated with optional pump configurations.
Aceptance Volume
Consult the factory for availablity of Optional Equipment specific to each MCP.
~Seismic Construction ~Hurricane (Dade County) Construction ~LonWORKS Controls Interface ~Extended Parts and Labor Warranty ~Waterside Economizer~Stainless Steel Tower Water Basins ~Complete Tower Stainless Steel Construction ~Tower HW Basin Work Handrails, Ladders and Safety Cage~Tower Basin Filtration ~Redundant Pumps ~Secondary Chilled Water Pumps ~Heat Trace ~Air Separator ~Air and Dirt Separator~Factory Installed Chilled Water Pipe Insulation ~Factory Installed Condenser Water Pipe Insulation
NOTESMcQuay reserves the right to change data at any time. Consult your local McQuay representative for the most current information.MCP Summary includes all modules and is based on standard equipment. No optional equipment is included.Floor Plan Dimensions is the overall MCP base support steel foot print.
Pumps are split-coupled, 460V-60Hz-3P, vertical in-line type. Refer to Optional Pump Data for optional pump configurations.
Minimum Clearance Dimensions are minimum service and access requirements. Provide additional space as necessary per local code requirements.
Wall and roof panels are 2" thick, expanded polystyrene panel core with stucco embosed aluminum panel facing and an overrall R-value of 9, standard.Structural steel base, wall and roof frame are constructed of hot or cold rolled galvanized steel, standard.
Electrical
Part Load Performance (IPLV)
Type
ElectricalInput PowerCompressor Full Load Power
Motor Horsepower
CHILLERDesignationCompressor TypeActual Capacity
STANDARD CHILLED WATER PUMP (Note 8)
Starter Type
Quantity
Output Capacity
NOMINAL CAPACITY PER MODULE
Entering/Leaving Water Temperature - EWT/LWT
Number of Compressors
MCP Performance
MCP COMPONENTS PER MODULE
Chilled Water Flow
Chiller Water Pipe ConnectionElectrical Load - 480V/60Hz/3PH (Note 5)
McQuay Modular Central Plants are proudly assembled in the USA by HydroKool, LLC
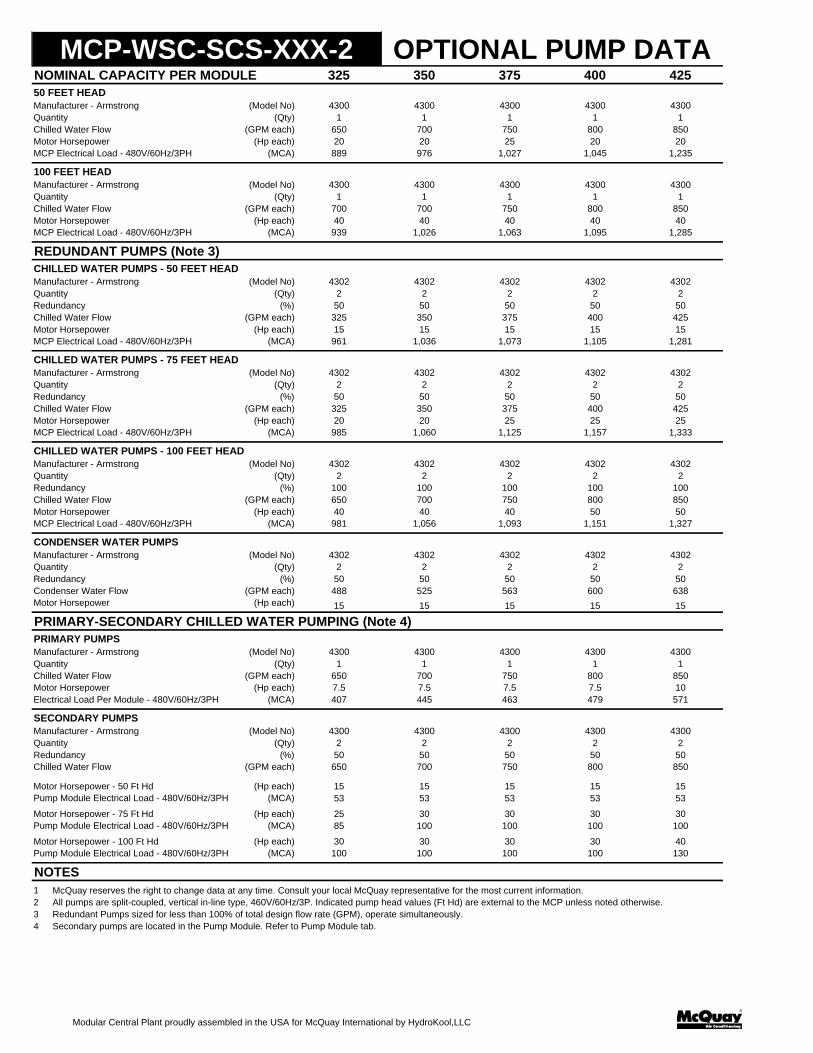
325 350 375 400 425
(Model No) 4300 4300 4300 4300 4300(Qty) 1 1 1 1 1
(GPM each) 650 700 750 800 850(Hp each) 20 20 25 20 20
(MCA) 889 976 1,027 1,045 1,235
(Model No) 4300 4300 4300 4300 4300(Qty) 1 1 1 1 1
(GPM each) 700 700 750 800 850(Hp each) 40 40 40 40 40
(MCA) 939 1,026 1,063 1,095 1,285
(Model No) 4302 4302 4302 4302 4302(Qty) 2 2 2 2 2
Redundancy (%) 50 50 50 50 50(GPM each) 325 350 375 400 425
(Hp each) 15 15 15 15 15(MCA) 961 1,036 1,073 1,105 1,281
(Model No) 4302 4302 4302 4302 4302(Qty) 2 2 2 2 2
Redundancy (%) 50 50 50 50 50(GPM each) 325 350 375 400 425
(Hp each) 20 20 25 25 25(MCA) 985 1,060 1,125 1,157 1,333
(Model No) 4302 4302 4302 4302 4302(Qty) 2 2 2 2 2
Redundancy (%) 100 100 100 100 100(GPM each) 650 700 750 800 850
(Hp each) 40 40 40 50 50(MCA) 981 1,056 1,093 1,151 1,327
CONDENSER WATER PUMPS(Model No) 4302 4302 4302 4302 4302
(Qty) 2 2 2 2 2Redundancy (%) 50 50 50 50 50
(GPM each) 488 525 563 600 638(Hp each) 15 15 15 15 15
(Model No) 4300 4300 4300 4300 4300(Qty) 1 1 1 1 1
(GPM each) 650 700 750 800 850(Hp each) 7.5 7.5 7.5 7.5 10
Electrical Load Per Module - 480V/60Hz/3PH (MCA) 407 445 463 479 571
(Model No) 4300 4300 4300 4300 4300(Qty) 2 2 2 2 2
Redundancy (%) 50 50 50 50 50(GPM each) 650 700 750 800 850
(Hp each) 15 15 15 15 15(MCA) 53 53 53 53 53
(Hp each) 25 30 30 30 30(MCA) 85 100 100 100 100
(Hp each) 30 30 30 30 40(MCA) 100 100 100 100 130
1234 Secondary pumps are located in the Pump Module. Refer to Pump Module tab.
Quantity
Quantity
Pump Module Electrical Load - 480V/60Hz/3PH
Pump Module Electrical Load - 480V/60Hz/3PH
Pump Module Electrical Load - 480V/60Hz/3PH
SECONDARY PUMPS
MCP Electrical Load - 480V/60Hz/3PH
CHILLED WATER PUMPS - 100 FEET HEAD
Manufacturer - Armstrong
Motor Horsepower
Chilled Water Flow
100 FEET HEAD
Manufacturer - Armstrong
Condenser Water Flow
CHILLED WATER PUMPS - 50 FEET HEAD
MCP Electrical Load - 480V/60Hz/3PH
Chilled Water FlowMotor Horsepower
Manufacturer - Armstrong
QuantityChilled Water Flow
Manufacturer - Armstrong
Motor Horsepower
All pumps are split-coupled, vertical in-line type, 460V/60Hz/3P. Indicated pump head values (Ft Hd) are external to the MCP unless noted otherwise.
Motor Horsepower - 75 Ft Hd
NOTESMcQuay reserves the right to change data at any time. Consult your local McQuay representative for the most current information.
OPTIONAL PUMP DATAMCP-WSC-SCS-XXX-2
Chilled Water FlowMotor Horsepower
Motor Horsepower
Manufacturer - Armstrong
Motor Horsepower
Motor Horsepower - 50 Ft Hd
Quantity
Quantity
REDUNDANT PUMPS (Note 3)
Quantity
Manufacturer - Armstrong
Motor Horsepower
Quantity
NOMINAL CAPACITY PER MODULE
Chilled Water Flow
MCP Electrical Load - 480V/60Hz/3PH
Manufacturer - Armstrong
Manufacturer - Armstrong
50 FEET HEAD
MCP Electrical Load - 480V/60Hz/3PH
Quantity
Chilled Water Flow
MCP Electrical Load - 480V/60Hz/3PH
Chilled Water Flow
Motor Horsepower - 100 Ft Hd
CHILLED WATER PUMPS - 75 FEET HEAD
Redundant Pumps sized for less than 100% of total design flow rate (GPM), operate simultaneously.
PRIMARY PUMPSPRIMARY-SECONDARY CHILLED WATER PUMPING (Note 4)
Modular Central Plant proudly assembled in the USA for McQuay International by HydroKool,LLC


~ 5 ~
; ~2 +il" ~? I D
5 14
i I
Cn
z 0 0
F 2D
m 71
TIT
FLOW AND CONTROL DIAGRA
DRAWING SCALE DATE
M NONE 02-28-08 UNLESS OTHERWISE SPECIFIED DWG NO
DO NOT SCALE DRAWING ~ c - 1 .2 JOB NUMBER

I z I 0
I F 5
9 6 p
P ~ z
-
I VI
n
r 01
P i 0 0
1 -----,--- &-*---
r 0
0 I
i I 7 :A PUMP MODULE ~ ! "
(OR MODULE A) ~ m ;O
TIT DRAWING SCALE DATE
FLOW AND CONTROL DIAGRAM NONE 02-28-08 UNLESS OTHERWISE SPECIFIED DWG NO
DO NOT SCALE DRAWING ~ c - 1 .2 JOB NUMBER

ModularCentral Plants
Engineered for flexibility and performance™
Innovative Central Plant Solutions
Mod Cent Plant Folder1e.qxd 9/4/07 1:24 AM Page 2
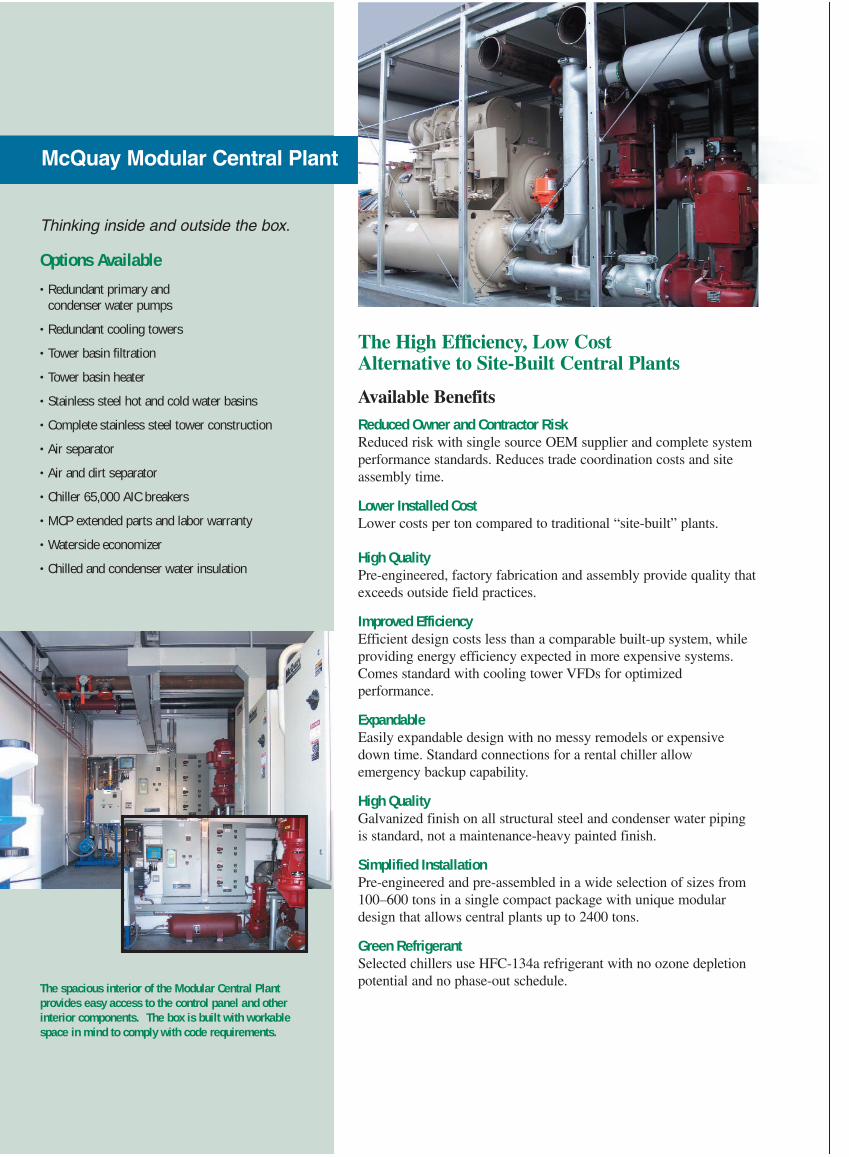
Options Available
• Redundant primary and condenser water pumps
• Redundant cooling towers
• Tower basin filtration
• Tower basin heater
• Stainless steel hot and cold water basins
• Complete stainless steel tower construction
• Air separator
• Air and dirt separator
• Chiller 65,000 AIC breakers
• MCP extended parts and labor warranty
• Waterside economizer
• Chilled and condenser water insulation
The High Efficiency, Low Cost Alternative to Site-Built Central Plants
Available BenefitsReduced Owner and Contractor RiskReduced risk with single source OEM supplier and complete systemperformance standards. Reduces trade coordination costs and siteassembly time.
Lower Installed CostLower costs per ton compared to traditional “site-built” plants.
High QualityPre-engineered, factory fabrication and assembly provide quality thatexceeds outside field practices.
Improved EfficiencyEfficient design costs less than a comparable built-up system, whileproviding energy efficiency expected in more expensive systems.Comes standard with cooling tower VFDs for optimizedperformance.
ExpandableEasily expandable design with no messy remodels or expensivedown time. Standard connections for a rental chiller allowemergency backup capability.
High QualityGalvanized finish on all structural steel and condenser water pipingis standard, not a maintenance-heavy painted finish.
Simplified InstallationPre-engineered and pre-assembled in a wide selection of sizes from100–600 tons in a single compact package with unique modulardesign that allows central plants up to 2400 tons.
Green RefrigerantSelected chillers use HFC-134a refrigerant with no ozone depletionpotential and no phase-out schedule.
Packaged Cooling SystemsMcQuay Modular Central Plant
The spacious interior of the Modular Central Plant provides easy access to the control panel and otherinterior components. The box is built with workablespace in mind to comply with code requirements.
Thinking inside and outside the box.
Mod Cent Plant Folder1e.qxd 9/4/07 1:24 AM Page 3

The Modular Central Plant (MCP) Advantage
Innovation inside…
...and outside the box
�2
�1
�2
�3
�3
�4
�5
�10
�6 �6 �6 �6
�8 �8 �8
�9
�9
�7�7
�1 Chiller—Scroll, Screw or Centrifugal.
�2 Interconnecting chilled water supply and return pipe headers.
�3 Split-coupled, in-line pump.
�4 Fully engineered, galvanized, welded, and point-loading steel structure, with seismic bracingwhere required.
�5 Removable roof with integral gutters and flashing.
�6 Removable wall panel with lifting handles.
�7 UL listed motor starter and VFD panels.
�8 Lifting and multiple-module connecting lugs.
�9 Motorized roll-up access door.
�10 Packaged terminal air-conditioner unit.
�11 Enclosure ventilation fan.
�12 Complete interconnecting hardware provided andshipped with modules.
�11
Mod Cent Plant Folder1e.qxd 9/4/07 1:24 AM Page 4

Complete with cooling tower, interconnecting condenser water piping…
...and chemical water treatment equipment
�3
�13 Cooling tower—cross flow type with stainless steelhot and cold water basins optional.
�14 Fully engineered, galvanized, welded, and point-loadingsteel structure, with seismic bracing where required.
�15 Interconnecting galvanized condenser water supplyand return piping and pipe supports.
�16 Main distribution panel with single point electrical480volt/3phase connection (one per module).
�17 Chemical treatment tanks, metering pumps,controller,coupon rack, pot feeder and containment pan skidmounted for either internal or external insulation.
�13
�14�15
�17
�15
�16�11
Mod Cent Plant Folder1e.qxd 9/4/07 1:24 AM Page 5

Innovative Central Plant Solutions
Pre-engineered and pre-assembled McQuayModular Central Plants ship for finalassembly anywhere in North America.
Mod Cent Plant Folder1e.qxd 9/4/07 1:24 AM Page 6

© 2007 McQuay International A/SP 31-235 (09/07)
(800) 432-1342www.mcquay.com
Single /Multiple/Dual Module, Water-Cooled Chiller Options
A global leader in
system solutions for
air conditioning, heating,
ventilating and refrigeration.
For more information, contact McQuay International.e-mail: [email protected]: 540-248-9207
Scroll Chiller
MCP-WGZ-SCS
Module capacity—
Single: 75 to 100 tons
Multiple: 150 to 500 tons
Magnetic BearingCentrifugal Chiller
MCP-WMC-SCS
Module capacity—
Single: 100 to 300 tons
Multiple: 200 to 1500 tons
MCP-WMC-DCS
Dual: 200 to 500 tons
Screw Chiller
MCP-WGS-SCS
Module capacity—
Single: 125 to 175 tons
Multiple: 250 to 975 tons
MCP-WGS-DCS
Dual: 250 to 350 tons
Standard Centrifugal Chiller
MCP-WSC-SCS
Module capacity—
Single: 200 to 600 tons
Multiple: 400 to 2400 tons
Mod Cent Plant Folder1e.qxd 9/4/07 1:24 AM Page 1

Positioning itself as the ultimate data center, Herakles Data of Sacramento, California, offers uninterruptible power, improved cooling and redundant internet bandwidth to its co-location customers seeking to outsource their primary or disaster recovery IT infrastructure. At a co-location data center, corporations rent specific spaces to operate their data servers, along with the servers of other companies, in a common physical location.
With all the critical servers housed in the facility generating heat, cooling is critical for the data center. “Cooling is essential to our business, in fact it’s the number two essential factor after uninterrupted power for our customers,” said Laurence Stancil, director of facilities at Herakles Data.
Herakles Data President and CEO Lou Kirchner stresses how essential cooling is to their success. “We’ve had customers come to us after leaving a previous data center because cooling was inadequate or unreliable,” Kirchner said. “And with the newer servers being more powerful and more
compact than ever, they produce even more heat. With our facility near 100% capacity, it’s critical that our cooling capacity be able to handle the heat of the newest generation of servers.”
Mission-Critical Challenge
Earlier this year Herakles Data realized that its rapid business growth meant that it had outgrown the capacity of its existing four air-cooled McQuay chillers. It now needed additional capacity that could meet the demands of its mission-critical interior space and ambient temperatures that typically reach 95 degrees during the summer. “Under California’s Title 24 standards, we couldn’t add a fifth chiller to meet our growing capacity needs, so we had
to consider alternatives outside the box,” said Stancil. “Our number one requirement in selecting a new system was speed. The new cooling system had to be installed and operating as fast as possible, with minimal interruption to our cooling requirements.”
A Pre-Engineered, Pre-Assembled Solution
Working with representatives from Norman Wright Mechanical Equipment Corporation, the McQuay representative in Sacramento, the facility team from Herakles Data evaluated alternative solutions and selected McQuay Modular Central Plants. Modular central plants are pre-engineered and pre-assembled from
CASE STUDY
Herakles Data Gains Increased Capacity and Energy Savings with “Mission Critical” Installation of McQuay Modular Central Plants
Engineered for flexibility and performance.™
Centrifugal ChillersData Center
Herakles Data’s 52,500-sq ft co-location data center in Sacramento, California.
McQuay Modular Central Plant

2
one supplier with the chiller, pumps, cooling tower and interconnected piping, and then shipped to the jobsite for final assembly. Their unique modular configuration reduces site assembly time compared to traditional “site built” cooling plants with the chiller, cooling tower, pumps and piping all coming from separate sources.
“We were comfortable going with McQuay again because we’ve had five years of excellent, reliable support from McQuay Factory Service,” Kirchner said.
Although he was also comfortable with McQuay, Stancil was initially skeptical of the modular central plant concept but the installation process made him a believer. “Our first four Modular Central Plants were dropped, bolted and wired – fully assembled – in a week. I’d compare it to changing a propeller in flight,” Stancil said. “You have to get it right the first time. And we did. Final site assembly was a very clean process – fast, easy and efficient.”
It was so fast and easy that Stancil now prefers the modular central plant concept to the traditional site-built central cooling plant. “I would never do it the old way again,” he said.
Kirchner was especially pleased that the one-week installation process resulted in zero downtime for the data center saying, “It was seamless for our customers.”
Capacity Goals Surpassed
Since June 2007, a total of six McQuay Modular Central Plants have provided chilled water to 59 computer room air conditioning units in the 52,500 square foot data center. Each of the modules consists of a 500-ton McQuay centrifugal compressor water chiller pre-engineered and pre-assembled with pumps, piping, cooling tower, control panel and associated water treatment system.
Kirchner’s original goal of increased cooling capacity to meet Herakles Data’s projected growth was not only achieved, but also surpassed. “We provide N+1 business solutions for our customers, meaning we meet their needs plus provide redundancy,” he said. “Today, however, we have surpassed that goal because we typically run only two of the four original modular central plants. That results in 2N cooling capacity today available to our data center customers.”
Inside the Herakles Data Center, the newest generation of servers housed there are more powerful and more compact than ever, producing more heat and more cooling capacity demand.
Four of the six McQuay Modular Central Plants that provide mission critical cooling for the Herakles Data Center.

�
Energy Savings a Bonus
In addition to fast-track construction and commissioning, the new McQuay central plants resulted in impressive energy savings compared to the old system. “Our old system used �,600 Kwh/ton a day; the new system uses 2,800 Kwh/ton a day for a 22% reduction in energy,” Stancil added.
That reduced energy usage earned a $50,000 rebate from the Sacramento Municipal Utility District to Herakles Data for the new system.
With the energy savings, the benefits of the McQuay Modular Central Plant extend beyond the initial benefits of the fast, easy installation. “Those energy savings were a very good
bonus,” Stancil said. “With our new modular central plants, we not only got the increased capacity that we needed, we also got significant energy savings over the life of the equipment.”
“The Only Way to Go”
Kirchner sums up the entire experience as phenomenal. “Modular central plants are a simple yet brilliant solution to today’s business requirement for consistent, quality design and zero downtime. It’s the only way to go.”
Each of the McQuay Modular Central Plants consists of a 500-ton McQuay centrifugal chiller pre-engineered with pumps, piping, cooling tower, control panel and associated water treatment system.

©2007 McQuay InternationalFor more information, contact your local McQuay Representative or call 800-4�2-1�42Visit our website at www.mcquay.com.2F-4017 (09/07)

Software licensed to PSUAE
Job Title
Client
Job No Sheet No Rev
Part
Ref
By Date Chd
File Date/Time
1
19-Mar-09
19-Mar-2009 14:00staad.std
Print Time/Date: 19/03/2009 14:11 Print Run 1 of 3STAAD.Pro for Windows Release 2006
Job Information Engineer Checked Approved
Name:Date: 19-Mar-09
Structure Type FLOOR
Number of Nodes 2 Highest Node 2Number of Elements 1 Highest Beam 1
Number of Basic Load Cases 1Number of Combination Load Cases 0
Included in this printout are data for:All The Whole Structure
Included in this printout are results for load cases:Type L/C Name
Primary 1 LOAD CASE 1
Node Displacement SummaryNode L/C X
(in)Y
(in)Z
(in)Resultant
(in)rX
(rad)rY
(rad)rZ
(rad)Max X 1 1:LOAD CASE 0.000 0.000 0.000 0.000 0.000 0.000 -0.018Min X 1 1:LOAD CASE 0.000 0.000 0.000 0.000 0.000 0.000 -0.018Max Y 1 1:LOAD CASE 0.000 0.000 0.000 0.000 0.000 0.000 -0.018Min Y 1 1:LOAD CASE 0.000 0.000 0.000 0.000 0.000 0.000 -0.018Max Z 1 1:LOAD CASE 0.000 0.000 0.000 0.000 0.000 0.000 -0.018Min Z 1 1:LOAD CASE 0.000 0.000 0.000 0.000 0.000 0.000 -0.018
Max rX 1 1:LOAD CASE 0.000 0.000 0.000 0.000 0.000 0.000 -0.018Min rX 1 1:LOAD CASE 0.000 0.000 0.000 0.000 0.000 0.000 -0.018Max rY 1 1:LOAD CASE 0.000 0.000 0.000 0.000 0.000 0.000 -0.018Min rY 1 1:LOAD CASE 0.000 0.000 0.000 0.000 0.000 0.000 -0.018Max rZ 2 1:LOAD CASE 0.000 0.000 0.000 0.000 0.000 0.000 0.018Min rZ 1 1:LOAD CASE 0.000 0.000 0.000 0.000 0.000 0.000 -0.018
Max Rst 1 1:LOAD CASE 0.000 0.000 0.000 0.000 0.000 0.000 -0.018

Software licensed to PSUAE
Job Title
Client
Job No Sheet No Rev
Part
Ref
By Date Chd
File Date/Time
2
19-Mar-09
19-Mar-2009 14:00staad.std
Print Time/Date: 19/03/2009 14:11 Print Run 2 of 3STAAD.Pro for Windows Release 2006
Beam Displacement Detail SummaryDisplacements shown in italic indicate the presence of an offset
Beam L/C d(ft)
X(in)
Y(in)
Z(in)
Resultant(in)
Max X 1 1:LOAD CASE 0.000 0.000 0.000 0.000 0.000Min X 1 1:LOAD CASE 27.000 -0.000 -0.611 0.000 0.611Max Y 1 1:LOAD CASE 0.000 0.000 0.000 0.000 0.000Min Y 1 1:LOAD CASE 15.000 -0.000 -1.961 0.000 1.961Max Z 1 1:LOAD CASE 0.000 0.000 0.000 0.000 0.000Min Z 1 1:LOAD CASE 0.000 0.000 0.000 0.000 0.000
Max Rst 1 1:LOAD CASE 15.000 -0.000 -1.961 0.000 1.961
Beam End Displacement SummaryDisplacements shown in italic indicate the presence of an offset
Beam Node L/C X(in)
Y(in)
Z(in)
Resultant(in)
Max X 1 1 1:LOAD CASE 0.000 0.000 0.000 0.000Min X 1 1 1:LOAD CASE 0.000 0.000 0.000 0.000Max Y 1 1 1:LOAD CASE 0.000 0.000 0.000 0.000Min Y 1 1 1:LOAD CASE 0.000 0.000 0.000 0.000Max Z 1 1 1:LOAD CASE 0.000 0.000 0.000 0.000Min Z 1 1 1:LOAD CASE 0.000 0.000 0.000 0.000
Max Rst 1 1 1:LOAD CASE 0.000 0.000 0.000 0.000
Beam End Force SummaryThe signs of the forces at end B of each beam have been reversed. For example: this means that the Min Fx entry gives the largest tension value for an beam.
Axial Shear Torsion BendingBeam Node L/C Fx
(kip)Fy
(kip)Fz
(kip)Mx
(kip-in)My
(kip-in)Mz
(kip-in)Max Fx 1 1 1:LOAD CASE 0.000 24.000 0.000 0.000 0.000 -0.000Min Fx 1 1 1:LOAD CASE 0.000 24.000 0.000 0.000 0.000 -0.000Max Fy 1 1 1:LOAD CASE 0.000 24.000 0.000 0.000 0.000 -0.000Min Fy 1 2 1:LOAD CASE 0.000 -24.000 0.000 0.000 0.000 -0.000Max Fz 1 1 1:LOAD CASE 0.000 24.000 0.000 0.000 0.000 -0.000Min Fz 1 1 1:LOAD CASE 0.000 24.000 0.000 0.000 0.000 -0.000Max Mx 1 1 1:LOAD CASE 0.000 24.000 0.000 0.000 0.000 -0.000Min Mx 1 1 1:LOAD CASE 0.000 24.000 0.000 0.000 0.000 -0.000Max My 1 1 1:LOAD CASE 0.000 24.000 0.000 0.000 0.000 -0.000Min My 1 1 1:LOAD CASE 0.000 24.000 0.000 0.000 0.000 -0.000Max Mz 1 1 1:LOAD CASE 0.000 24.000 0.000 0.000 0.000 -0.000Min Mz 1 1 1:LOAD CASE 0.000 24.000 0.000 0.000 0.000 -0.000

Software licensed to PSUAE
Job Title
Client
Job No Sheet No Rev
Part
Ref
By Date Chd
File Date/Time
3
19-Mar-09
19-Mar-2009 14:00staad.std
Print Time/Date: 19/03/2009 14:11 Print Run 3 of 3STAAD.Pro for Windows Release 2006
Beam Force Detail SummarySign convention as diagrams:- positive above line, negative below line except Fx where positive is compression. Distance d is given from beamend A.
Axial Shear Torsion BendingBeam L/C d
(ft)Fx
(kip)Fy
(kip)Fz
(kip)Mx
(kip-in)My
(kip-in)Mz
(kip-in)Max Fx 1 1:LOAD CASE 0.000 0.000 24.000 0.000 0.000 0.000 -0.000Min Fx 1 1:LOAD CASE 0.000 0.000 24.000 0.000 0.000 0.000 -0.000Max Fy 1 1:LOAD CASE 0.000 0.000 24.000 0.000 0.000 0.000 -0.000Min Fy 1 1:LOAD CASE 30.000 0.000 -24.000 0.000 0.000 0.000 -0.000Max Fz 1 1:LOAD CASE 0.000 0.000 24.000 0.000 0.000 0.000 -0.000Min Fz 1 1:LOAD CASE 0.000 0.000 24.000 0.000 0.000 0.000 -0.000Max Mx 1 1:LOAD CASE 0.000 0.000 24.000 0.000 0.000 0.000 -0.000Min Mx 1 1:LOAD CASE 0.000 0.000 24.000 0.000 0.000 0.000 -0.000Max My 1 1:LOAD CASE 0.000 0.000 24.000 0.000 0.000 0.000 -0.000Min My 1 1:LOAD CASE 0.000 0.000 24.000 0.000 0.000 0.000 -0.000Max Mz 1 1:LOAD CASE 0.000 0.000 24.000 0.000 0.000 0.000 -0.000Min Mz 1 1:LOAD CASE 15.000 0.000 0.000 0.000 0.000 0.000 -2.16E 3
Reaction SummaryHorizontal Vertical Horizontal Moment
Node L/C FX(kip)
FY(kip)
FZ(kip)
MX(kip-in)
MY(kip-in)
MZ(kip-in)
Max FX 1 1:LOAD CASE 0.000 24.000 0.000 0.000 0.000 0.000Min FX 1 1:LOAD CASE 0.000 24.000 0.000 0.000 0.000 0.000Max FY 1 1:LOAD CASE 0.000 24.000 0.000 0.000 0.000 0.000Min FY 1 1:LOAD CASE 0.000 24.000 0.000 0.000 0.000 0.000Max FZ 1 1:LOAD CASE 0.000 24.000 0.000 0.000 0.000 0.000Min FZ 1 1:LOAD CASE 0.000 24.000 0.000 0.000 0.000 0.000
Max MX 1 1:LOAD CASE 0.000 24.000 0.000 0.000 0.000 0.000Min MX 1 1:LOAD CASE 0.000 24.000 0.000 0.000 0.000 0.000Max MY 1 1:LOAD CASE 0.000 24.000 0.000 0.000 0.000 0.000Min MY 1 1:LOAD CASE 0.000 24.000 0.000 0.000 0.000 0.000Max MZ 1 1:LOAD CASE 0.000 24.000 0.000 0.000 0.000 0.000Min MZ 1 1:LOAD CASE 0.000 24.000 0.000 0.000 0.000 0.000
Recommended