-- ~ ~- - -- -- --- --- ~ - . - - . ~ -- - - -
c H
A p T experimental
E
R
2
EXPERIMENT At
2.0 CHEMICALS
In the present study, the following chemicals were used, whose details are given
below as follows :
2.01 Acids
The acids used in the present investigation were hydrochloric, sulphuric,
perchloric acid and deuterium chloride.
[A] Hydrochloric acid (HCI) : (Qualigens ExcelaR)
Sp. gr. 1.18 gm ml-1, 11.6 mol dm-';
[B] Sulphuric acid (H,SO 4) : (Qualigens ExcelaR)
Sp. gr. 1.83 gm ml-1, 18.0 mol dm_,;
[C] Perchloric acid (HCI04) : (Qualigens ExcelaR)
Sp. gr. 1.70 gm ml-1, 10.0 mol dm-';
[OJ Deuterium Chloride (OCI) : Procured from Bhabha Atomic Research Centre
(BARC), Mumbai (India). Isotopic purity > 95%
DCI was diluted with 0,0 to produce the solutions of required molarity.
All the acids were standardised with sodium hydroxide, which in turn was
standardised with potassium hydrogen phthalate (BDH, AnalaR)
2.02 Bases
[A] Sodium Hydroxide (NaOH) : (Qualigens ExcelaR) mol. wt. 40
(37)
Ex onmontal
[B] Potassium Hydroxide (KOH) : (Oualigens ExcelaR) mol. wt. 56.11
[C] Lith1um Hydroxide (LiOH H,O) : (S1gma) F.W. 41.96
[D) Sodium deuteroxide (NaOD) : Procured from BARC (Isotopic purity > 95%)
[E) Ammonia solution : (s.d. fine AR) sp. gr. 0.91, mol. wt. 17.03
Sodium deuteroxide was diluted with D,O to produce the solutions of required
molarity.
2.03 Solvents
[A] Water : Double distilled water was used for preparation of solutions for kinetic
studies. It was prepared by redistilling deionised water in distillation glass
assembly (BHANU) over alkaline potassium permanganate. Triple distilled water
was used for the preparation of metal complexes of hydroxamic acids and in the
study of acid-base equilibria.
[B] Deuterium Oxide (020) : Procured from BARC Mumbai (India)
Isotopic purity > 99.85%
[C] Other organic solvents : Other organic solvents used for the kinetic studies were
: 1 ,4-Dioxane (Oualigens ExcelaR), DMSO (Merck GR), DMF (BDH AR), Acetone
(Qualigens ExcelaR), Acetonitrile (Merck), Tetrahydrofuran (Merck), Methanol
(Merck HPLC). Ethanol (Qualigens ExcelaR) 2-propanol (Qualigens ExcelaR).
The above solvents were used as obtained without further purification.
2.04 Solutions
[A] Buffer solutions : pH meter was calibrated by using saturated solution of
potassium hydrogen tartarate (pH = 3.56 at 25°C), 0.05M potassium hydrogen
phthalate (pH = 4.02 at 25°C) and 0.01 M Borax (pH = 9.18 at 25°C).
(38)
Ex omnontal
[B] Ferric Chloride Solutions :
(1) Acidic :The ferric chloride solution used in the colorimetnc procedure for acidic
hydrolysis was prepared by dissolution of 44 gms of anhydrous salt (mol wt. 162.21,
Oualigenes) m 1 litre of distilled water containing 10 mi. of concentrated hydrochloric
acid to prevent ferric hydroxide formation. Solution so prepared was filtered through
ordinary filter paper.
(ii) Alkaline : Ferric chloride anhydrous (mol. wt. 162.21 Qualigenes), 44g
dissolved in 1 litre distilled water containing 100 ml concentrated hydrochloric acid, was
used for developing purple complex with hydroxamic acids for their analysis in kinetic
runs in case of alkaline hydrolysis.
2.05 Salts
Some anhydrous salts such as lithium chloride (Sigma), sodium chloride (Merck),
Potassium chloride (Qualigenes AR), Sodium bromide (Merck), Sodium perchlorate
monohydrate (Merck), Potassium sulphate (Merck) and Potassium bisulphate (Merck)
were used in the· measurement of salt effects. Each of these salts were dehydrated
before use.
2.06 Esters
Following esters were used in the preparation of dihydroxamic acids.
[A] Diethyloxalate : (Aldrich)
F.W. 146.14, b.p. 185°C, d 1.076
[B] Diethylmalonate : (Aldrich)
F.W. 160.17, b.p. 199°C, d 1.055
[C] Diethylsuccinate : (Aldrich}
F.W. 174.20, b.p. 217.7"C, d 1.047
(39)

2.07 Acid Chloride
[A] Hydroxylamme hydrochloride : (Aidnch A.C.S. reagent)
F.W. 69.49, m.p. 159°C
2.1 APPARATUS
Following apparatus were used in the experimental investigation.
2.11 Thermostat
Ex onmontal
Acidic hydrolysis as well as alkaline hydrolysis reactions were carried out in
thermostats at 35-85°C with automatic temperature control ±0.1 oc at required
temperature by a precision thermometer (0-50°C and 0-1 oooc, least-count 0.1 oc). The
temperature setting remained undisturbed throughout the course of investigation. For
low temperature CRYOSTAT (Remi CB-700) was used.
2.12 Mechanical Stirrer
(Remi motors 220 I 230 V, 50 - AC), magnetic stirrer (Remi equipments, 2 MLH)
and vacuum pump (Wiswo, RPM 5400) used for synthesis purpose. Melting point
apparatus (Tempo S.No. A 233) was used to determine melting points.
2.13 Spectrophotometer
[A] Kinetic measurements were made by the use of spectrophotometric method
using a Systronics UV-VIS 108 spectrophotometer.
[B] Unicam UV-2 300 spectrophotometer was used for UV spectra measurement to
study the Acid-Base equilibria (protonation and deprotonation behaviour) and for
metal complexation.
(40)
Ex onmental
2.14 pH-Meter :
Digital pH-meter (Systronics model 335) was used for pH measurements, pK,
determination and to observe the effect of pH on metal complexation.
2.15 Computer :
Least squares analysis were carried out on a Wipro 386 Acer Entra Pentium
Computer under MS Dos. The GW Basic language was used for preparation of
program.
2.16 Glasswares :
[A] Reaction vessels :Tubes with (B-14, B-19 and B-24) stoppers were used as flat
bottom reaction vessels.
[B] Test tubes : Elongated test tubes with wide mouth were used.
[C] Burettes : Corning burettes of 5 x 0.02 ml; 5 x 0.05 ml, 10 x 0.05 ml, 25 x 0.1
ml and 50 x 0.1 ml were used.
[D] Pipetts : Special pipettes of 0.5, 1.0, 2.0 ml were used for withdrawing aliquots
from reaction mixture.
[E] Piplip : Piplip is a device for pipetting liquids and used for transferring corrosive
and toxic liquids.
2.2 PREPRATION AND CHARACTERIZATION OF DIHYDROXAMIC ACIDS.
Three dihydroxamic acids [HOHNCO-(CH2) 0-CONHOH; n=O, oxalo
(i); n=1, malono (ii) and n=2 for succino dihydroxamic acids) have been
synthesized and characterized by m.p., elemental analysis, UV and IR spectral
data.
(41)
Ex eflmental
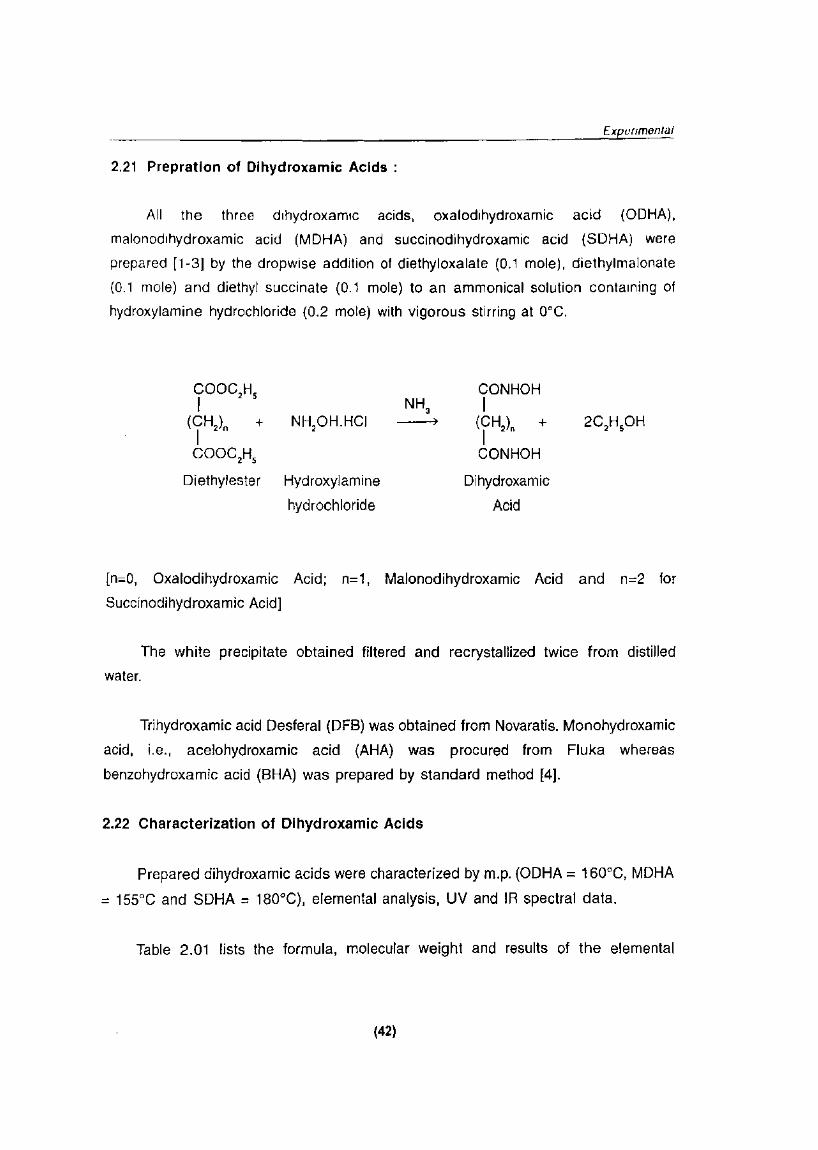
2.21 Prepratlon of Dlhydroxamic Acids :
All the three d1hydroxam1c acids, oxalodihydroxamic acid (ODHA).
malonod1hydroxamic acid (MDHA) and succinodihydroxamic acid (SDHA) were
prepared [1-3] by the dropwise addition of diethyloxalate (0.1 mole). diethylmalonate
(0.1 mole) and diethyl succinate (0.1 mole) to an ammonical solution containing of
hydroxylamine hydrochloride (0.2 mole) with vigorous stirring at ooc.
cooc,H, I
(rH,)" + NH,OH.HCI
COOC,H,
Diethylester Hydroxylamine
hydrochloride
NH3 ~
CONHOH I
(fH,), +
CONHOH
Dihydroxamic
Acid
2C,H,OH
[n=O, Oxalodihydroxamic Acid; n=l, Malonodihydroxamic Acid and n=2 for
Succinodihydroxamic Acid]
The white precipitate obtained filtered and recrystallized twice from distilled
water.
Trihydroxamic acid Desferal (DFB) was obtained from Novaratis. Monohydroxamic
acid, i.e., acelohydroxamic acid (AHA) was procured from Fluka whereas
benzohydroxamic acid (BHA) was prepared by standard method [4].
2.22 Characterization of Dihydroxamic Acids
Prepared dihydroxamic acids were characterized by m.p. (ODHA = 160"C, MDHA
= 155°C and SDHA = 180"C), elemental analysis, UV and IR spectral data.
Table 2.01 lists the formula, molecular weight and results of the elemental
(42)

Ex onmental
Table 2.01 Characterization data of prepared dlhydroxamic acids
Dihydroxamic Molecular MP Found (Calcd) %
Acid Formula 'C c H N
CONHOH C,H,N,O, 160 20.78 3.89 24.06
tONHOH (20) (3.33) (23.33}
(ODHA)
CONHOH I CH, C3H,N,04 155 25.98 4.82 20.56 I CONHOH (26.86) (4.48) (20.89)
(MDHA)
CONHOH
(tH,), C,H,N,04 180 31.94 4.87 19.42
tONHOH (32.43) (5.41) (18.92}
(SDHA)
Calculated values are given in parentheses.
(43)

rxpomnontal
analysts of the prepared dihydroxamic acids. Oxalodihydroxamic ac1d is less soluble 111
cold water but readily soluble in hot water whereas Succinodihydroxamic is highly
soluble in cold water. Thus, the solubility of dihydroxamic acid in cold water tncreases
from oxalo to succino dihydroxamic acid.
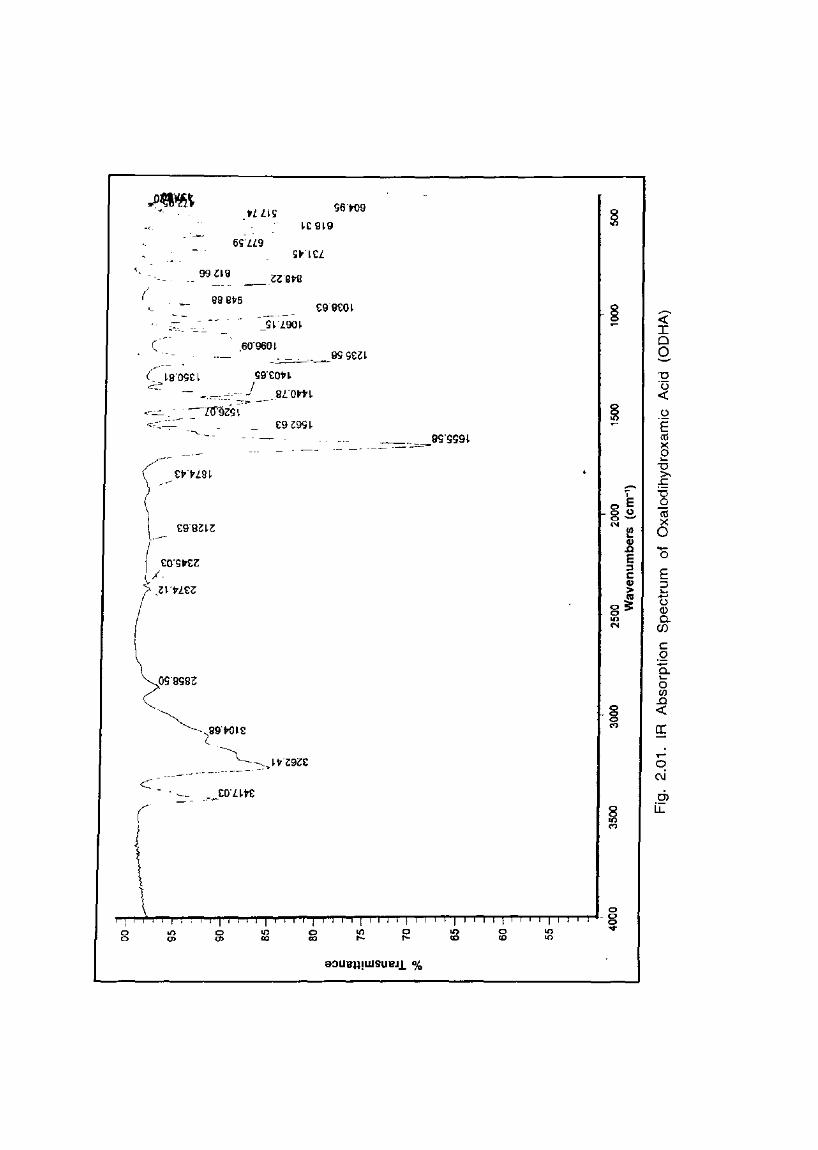
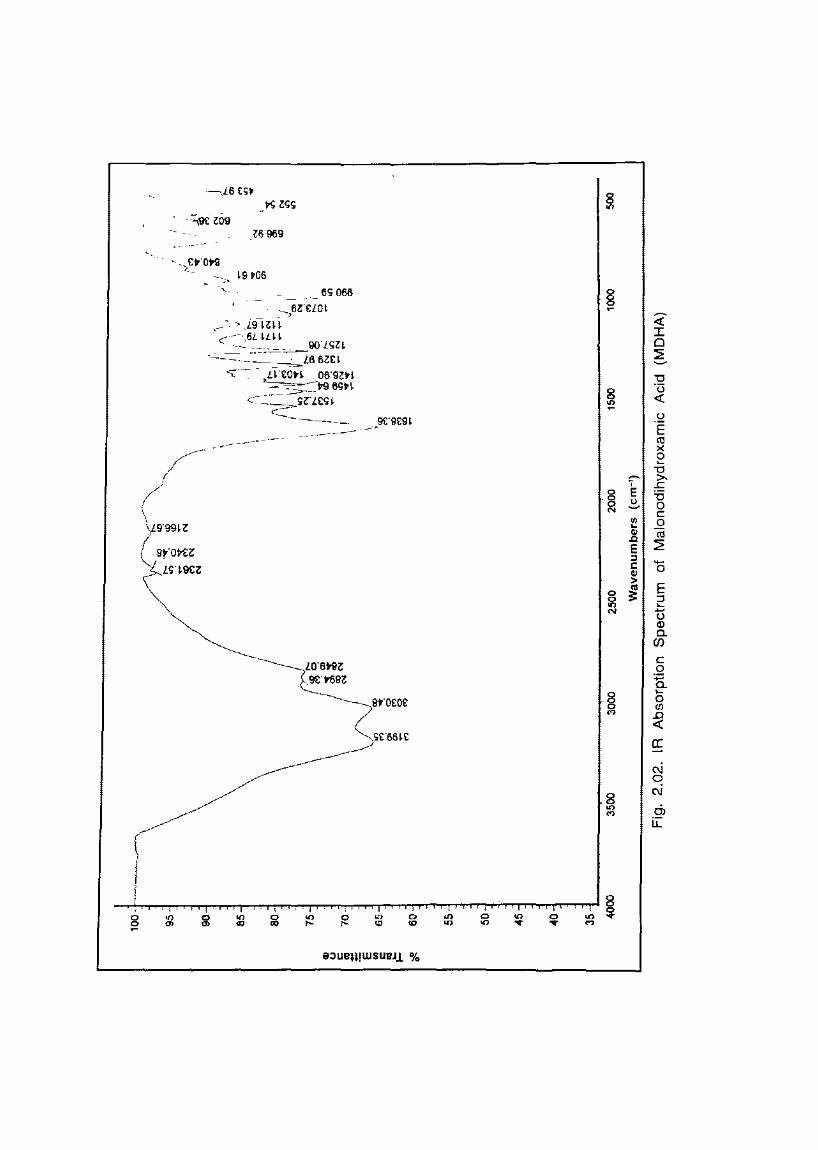
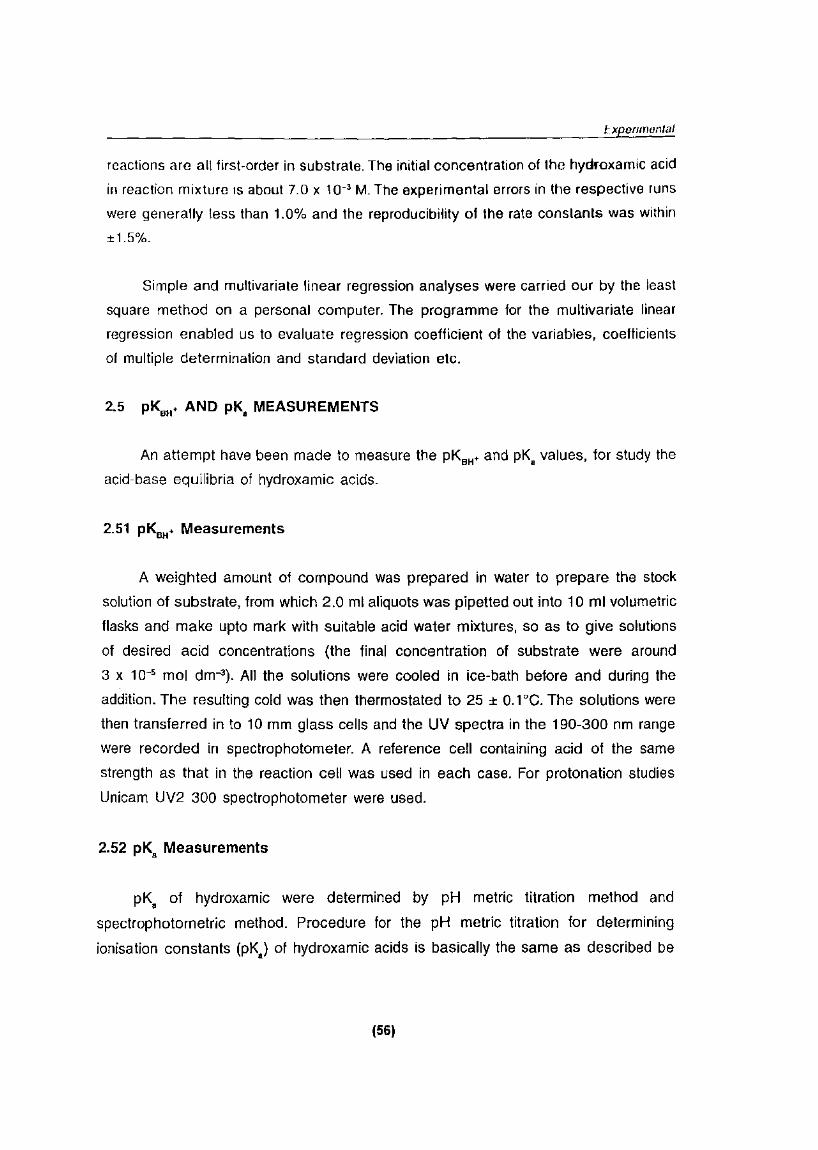
2.23 IR spectral study I Analysis
Infrared spectra of prepared dihydroxamic acids are shown in Figs. 2.01 to 2.03
and their representative data are shown in Table 2.02.
The IR spectra of hydroxamic acids and their complexes are generally very
complex though some characteristic bonds for different bonds I groups were
suggested. For example, the band around frequency 3200 em-• was assigned as the
NH valence frequency, while those observed in the 3080-3060 em-• region were
attributed to the OH vibrations and the CO valence vibrations [5-7]. The broad band
around 1610-1585 em-• observed is assigned to the ketonic carboxyl vibrations.
The most characteristic bands associated with the hydroxamic acid functional
grouping are due to C=O and 0-H stretching vibrations and these can be assigned
rather unambiguously. The N-0 and C-N stretching and 0-H deformation vibrations
were assigned with less certainty because of the nonavailability of systematic data on
the assignment of these bands in the infrared spectra of hydroxamic acids.
0-H Stretching Vibrations
In the dihydroxamic acids examined here the band due to 0-H stretching
vibrations has been assigned in the region between 3104 em-•. It is well known that the
absorption bands due to free 0-H stretching vibrations appear around
3650 em-•. The marked lowering of these bands implies the presence of strong
hydrogen bonding in these hydroxamic acids [8-12].
Vibrations in the 0--H stretching vibrations in different hydroxamic acids are
mainly due to the ability of acidic hydrogen of the hydroxyl group to form "hydrogen
bond" with electron rich atom.
(44)
tL Ll~ S6'11l9
IC 919 -~--
99ZI9
( 99 9t6 £9'9£01
-~l'L901
,60'9601 -~·.-~BS~CZI
? <. 19'0<;£1 ~9·cotl
c ~.=.cc· ) _9L'O»l
~=.-- ---zn'liis~- --
(
..-c~.:::.::- - cs zas 1 --~
~--
CHL91
£9'9ZIZ
co·svcz /.
> ,Zl'i'LCZ
a:JUB!l!WSUBJ! o/o
0 -g "'
E ::J ~
u <ll 0. (f)
c 0 :;:: 0. ~
0 (/) .0 <(
a:
~
0 N
Cl u:::
, _,Cv'OI'Il - -.,. 19 t06
__ 6S066
~ I D e. "0 '(j <(
.2 E ro X 0 ~
"0
0
8 N
~ >-' £ E '0 " 0 ~ c
L9'991Z "' 0 ~
" (ij .Q
~ E ::J -1: 0 " > E ~ ::l
~ -() Q) c.
(/)
c 0
:;::; c. ~
0
"' I:> <(
a:
C\1 0 C\1
0> u:::
aOUBII!WSUBJ! o/o

fl 1:
"' ::: ·e ., 1:
~ >!! 0
---, --------------------- -· ·--- ·---------
100h"\
J "'"'\ 99 ,..,,-- \ -o, .
n\ 98-
97
98
95-
94-
93
92
I :.,
~ "'
//~-"\
/
c,
/~ : ~ c 0> A
'I -• I, ll'l
/\ I / 1,' ~ 1 ; ', 1 r,) ~.,... ~ \ '-: v g '
(, I \ r \, I !·! I 0 1' \ I I ~I I I\'\
1'/ j,d. \ :ll . , I "'
II ~ , F,l ~:811 ~-N..,., \ N I"'-~ I, ~
\ ,' ~ ', .....
\
! I \ i ~ ~
\! ~ ~
\ Vi / ........
/ - -S1-
eo-
89
88
67-
4000 3500
' "' /t!l
~ g g
3000 2500 2000 .• WaJLenumbecs .(em-')
/ :s -' :2;
1500 1000
Fig. 2.03. IR Absorption Spectrum of Succinodihydroxamic Acid (SDHA)
/ (
M _ __.
"' 0 N ~ ~
"' :8
500
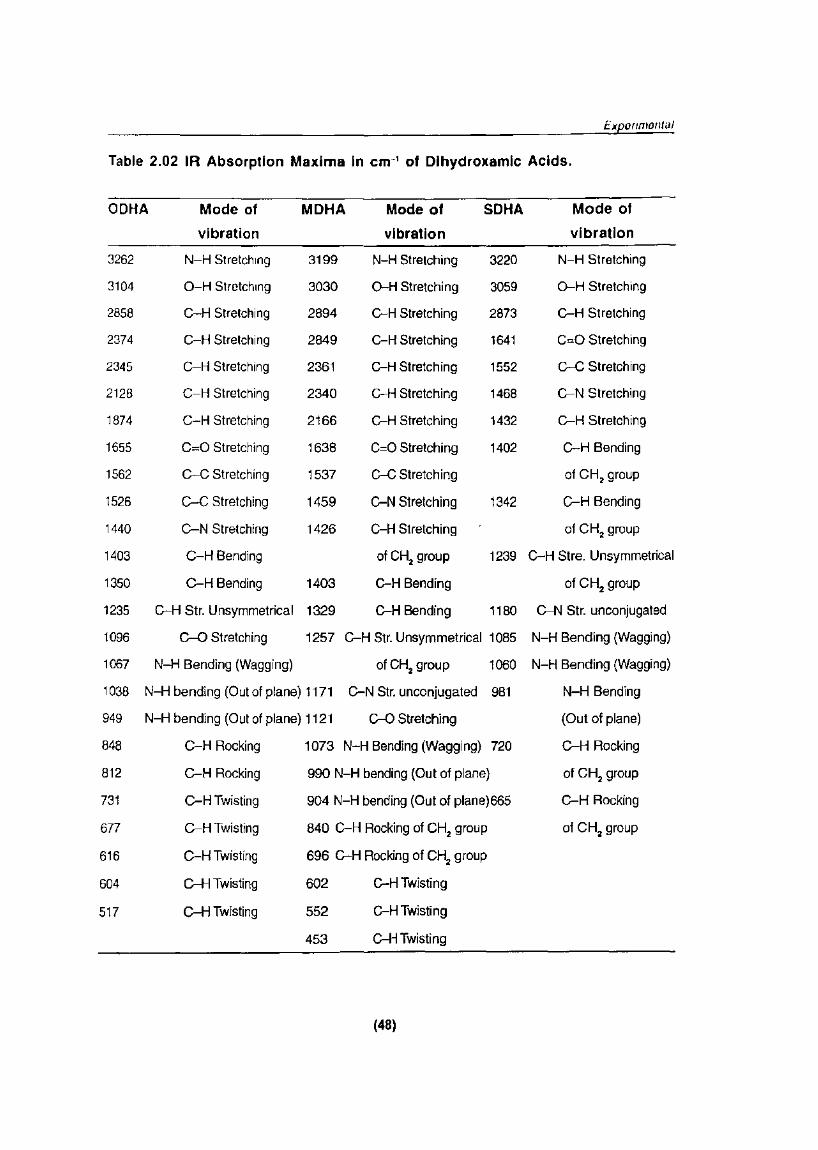
Ex onmontal
Table 2.02 IR Absorption Maxima In em-• of Dlhydroxamlc Acids.
OOHA Mode of MDHA Mode of SDHA Mode of
vibration vibration vibration
3262 N-H Stretch1ng 3199 N-H Stretching 3220 N-H Stretching
3104 0-H Stretching 3030 0-H Stretching 3059 0-H Stretching
2858 C-H Stretching 2894 C--H Stretching 2873 C-H Stretching
2374 C-H Stretching 2849 C--H Stretching 1641 C=O Stretching
2345 C-H Stretching 2361 C-H Stretching 1552 C-C Stretching
2128 C-H Stretching 2340 C-H Stretching 1468 C-N Stretching
1874 C-H Stretching 2166 C-H Stretching 1432 C-H Stretching
1655 C=O Stretching 1638 C=O Stretching 1402 C-H Bending
1562 C-C Stretching 1537 C-C Stretching of CH, group
1526 C-C Stretching 1459 C--N Stretching 1342 C-H Bending
1440 C-N Stretching 1426 C--H Stretching of CH2 group
1403 C-H Bending of CH, group 1239 C-H Stre. Unsymmetrical
1350 C-H Bending 1403 C--H Bending of CH2 group
1235 C-H Str. Unsymmetrical 1329 C--H Bending 1180 C-N Str. unconjugated
1096 C-0 Stretching 1257 C-H Str. Unsymmetrical 1085 N-H Bending (Wagging)
1067 N-H Bending (Wagging) ofCH2
group 1060 N-H Bending (Wagging)
1038 N-H bending (Out of plane) 1171 C-N Str. unconjugated 981 N-H Bending
949 N-H bending (Out of plane) 1121 C-0 Stretching (Out of plane)
848 C-H Rocking 1073 N-H Bending (Wagging) 720 C-H Rocking
812 C-H Rocking 990 N-H bending (Out of plane) of CH2 group
731 C-HTwisting 904 N-H bending (Out of plane)665 C-H Rocking
677 C-H Twisting 840 C-H Rocking of CH2
group of CH, group
616 C-HTwisting 696 C-H Rocking of CH, group
604 C-H Twisting 602 C-H Twisting
517 C-HTwisting 552 C--H Twisting
453 C-HTwisting
(48)

tx onmenlal
Thus the formation of strong hydrogen bonding causes a large shift of the 0-H
absorption band to lower frequencies, and may be ascribed to the resonance
stabilisation. A consequence of this resonance stabilisation should be to lower the force
constant of the carbon-oxygen band and is increase the contribution of single bond
form, thereby causing a fall in the frequency due to C=O stretching vibrations.
C=O Stretching Vibrations
In the N-arylhydroxamic acids examined here the C=O stretching bands are
assigned in the region between 1655 em-• and 1638. This assignment is made with
reference to the spectra of analogous compounds.
2.3 PREPRATION AND CHARACTERIZATION OF METAL COMPLEXES OF
DIHYDROXAMIC ACIDS
Metal complexes of dihydroxamic acids in solution as well as solid complexes
have been prepared and solid metal complexes were characterized by elemental
analysis and I R spectral data.
2.31 Preparation of Metal Complexes of Dihydroxamic Acids
Metal complexes of dihydroxamic acids in solution state as well as in solid state
have been studied.
To study the effect of pH on metal complexes of different hydroxamic acids, the
stock solutions of iron (Ill) ions were prepared from FeCI3.6H,O (Qualigenes) and a
known amount of 0.1 M HCI were added to prevent hydrolysis of metal ions. The final
concentrations of iron (Ill) and ligand (dihydroxamic acids) were about 5 x 10 .... M and.
2.5 x 1Q-3 M respectively. All the solutions were prepared in triple distilled water. pH
measurements were made by using Systronics digital pH meter 335. The pH of metal
complex solutions were adjusted with the help of NaOH and HCI solutions.
Spectrophotometric measurements of effect of pH on iron (Ill) complexes of different
hydroxamic acids were made with the help of Unicam UV 2 300 spectrophotometer.
(49)

Expomnontal
Sol1d metal complexes of 1ron (Ill), copper (II), nickel (II) and cobalt (II) of
dihydroxamic acids have also been prepared by the addition of 0.01 mole of
dihydroxamic acid (dissolved in 25 ml of H20) to the 0.005 mole of ferric chloride
(dissolved in 25 ml of 0.1 N HCI). A dark purple coloured complexes are obtained
whose pH were 1 to 1.6. The pH of mixed solutions were increased up to 5-7 by the
addition of 1% NaHC03
(Merck mol. wt. 84.01) solution. Mixture were stirred 2-3 hours
by magnetic stirrer and filtered, dark purple coloured complexes were obtained.
Similarly the Cu(ll), Ni(ll), Co(ll) complexes of dihydroxamic acids have been prepared.
The colour of the chelates are as follows :
Iron (Ill) - Dark purple
Copper (II) - Green
Nickel (II) - Sky blue
Cobalt (II) - Pink
All solid complexes were obtained are insoluble in water as well as in many other
organic solvents (like, DMF, Acetonitrile, CCI4 , CH,OH, acetone etc.) and they possess
very high thermal stability. These type of nature of solid metal complexes of
dihydroxamics acids can be explained by their polymeric structure [13].
2.32 Characterization of Metal Complexes of Dihydroxamic Acids
Prepared metal complexes of dihydroxamic acids were characterized by
elemental analysis, UV and IR spectral data.
Elemental analysis of some metal complexes of dihydroxamic acids are shown in
Table 2.03.
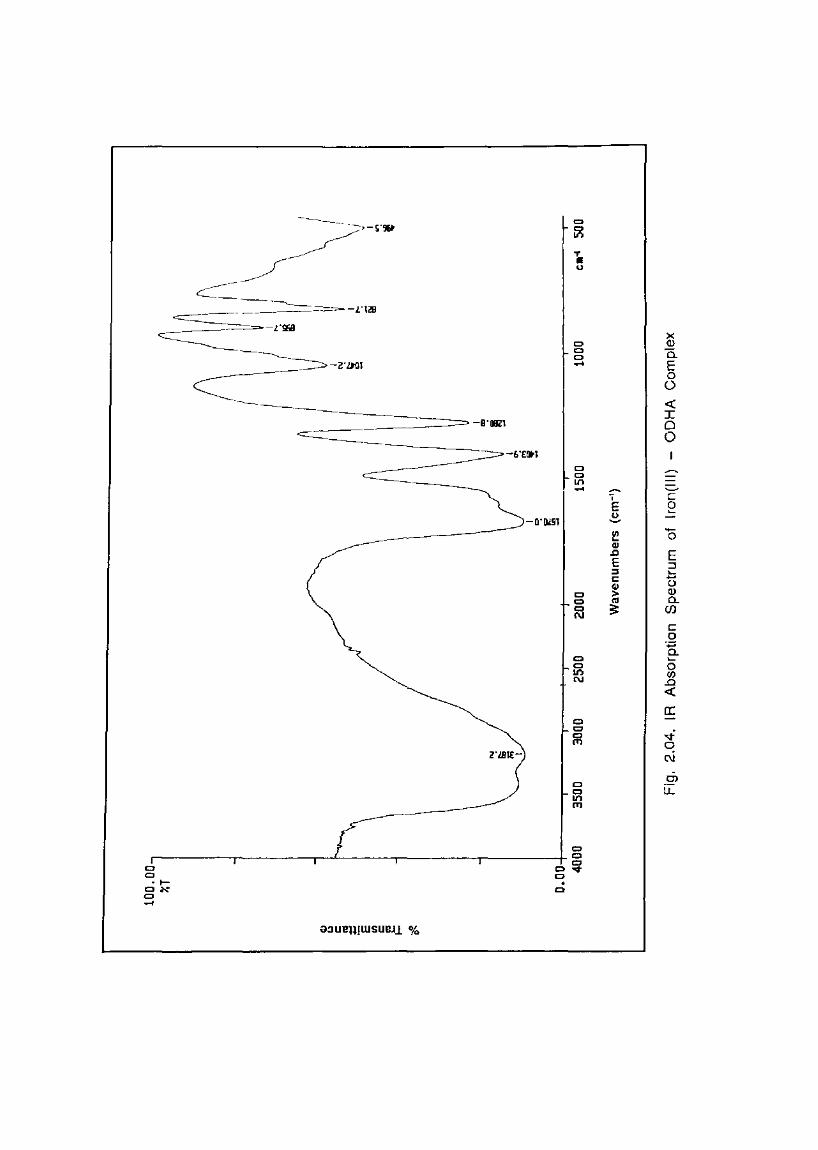
Infrared spectra of metal complexes of some dihydroxamic acids are shown in
Figs. 2.04 to 2.06 and their representative data are shown in Table 2.04.
It has been observed that the bands due to N-0 and C=O groups shift on
chelation with metal ions. The most characteristic bonds associated with the
(50)

Ex onment.1J
Table 2.03 Elemental analysis of Fe(lll) and Nl(ll) complexes of
Oxalodihydroxamlc acid.
Dihydroxamic Molecular Formula Found (Calcd) %
Acid of metal complex c H N
CONHOH Fe,C6H6N60 12 14.78 1.76 16.83
tONHOH (15.45) (1.28) (18.02)
Oxalodihydroxamic Ni,C6H6 N60 12 14.29 1.62 15.97
Acid (ODHA] (15.27) (1.27) (17.81)
Calculated values are given in parentheses.
Table 2.04 IR Absorption Maxima in em-' of some metal complexes of
Oxalodihydroxamic Acids.
Iron Mode of Nickel Mode of Copper Mode of
Complex vibration Complex vibration Complex vibration
3187 0-H Stretching 3250 0-H Stretching 3444 0-H Stretching
1670 C=O Stretching 2855 0-H Stretching 1675 C=O Stretching
1404 G-N Stretching 2375 C-H Stretching 1617 C=O Stretching
1281 G-H Stretching 2270 C-H Stretching 1487 C-N Stretching
1047 N-H Bending 1629 C=O Stretching 1412 C-H Bending
896 G-H Rocking 1452 C-H Bending 1347 C-H Bending
822 G-H Rocking 1281 C-H Bending 1300 G-H Bending
496 G-H Twisting 999 C-H Rockinig 1026 N-H Bending
866 G-H Rockinig 869 G-H Rocking
701 G-H Twisting 594 G-H Twisting
560 G-H Twisting
488 C-H Twisting
(51)
1111m11111m~ 1111111m ~~~11m 11111111 T 19007
-- 0 --.-no;• 17: ., • u
-L'129
-J.'g;a X
0 Q) 0 0.. 0
-2"1>0! ..... E 0 0 <( I
-B'IIIi!l 0 0
-6"EI»l 0 ~ 0 If) ..... ~
' c E 0 ~
~
-0'1).!9!
I!! ~
0 Q) .t:l E E ::::>
" ~
1: -Q) ()
0 > Q)
c:> ~ a.
0 (f) N
c 0
·.;::: a.
0 ~
0 0 If) (/) N .!J
<(
cr: 0 0
...t 0
"' 0 2'.!B!E- C\1
0 Cl
0 u:: If)
"'
C> 0 C>
0 C> .... 0 0
• I-ox 0 0 .....
a3UBII!WSUBJl o/o

0 0 ...... ox 0 ...
-- -6'JBi
c=:CC.-8'61& -O'lOl
----======-E'zstl
-nssz
aouemwsueJl %
Cl 0
0
C) C)
11'1
... • 0
C) C) C) ...
C) C)
11'1 ...
C)
0 0
"'
0 0 11'1
"' 0 ,0 C)
"'
0 0 11'1
"'
C)
Cl Cl ....
X Q)
0. E 0 (.)
<X: I 0 0
~
~ ~
' CD E ~
.£, .~ z
"' ~ -" 0 .c E E :I
" ::J
" ~
> -~
0 CD 0. (/)
c 0
·.;:; 0. ~
0 (/) .c <X:
a:
ll) 0 N
Ol u::

... "'
a:>uemwsueJl %
~
' E .!:!. .. ~ .. .c E " c:: .. > .. ~
X ~ a. E 0 (.)
<{ I 0 0
~
~
~
Q) a. a. 0 (.)
-0
E ::l ~ -(.) Q) a. (/)
c 0
:;::; a. ~
0
"' .0 <{
a:
<D 0 (\J
ci> u::

Ex onmontal
hydroxamic acid functional grouping are due to C=O and 0-H stretching vibration and
these can be assigned rather unambiguously. The N-0 and C-N stretching and 0-H
deformation Vibrations were assigned with less certainty because of overlapping by
several other modes of vibrations and because of the nonavailability of systematic data
on the assignment of these bands in the infrared spectra of hydroxamic acids.
Theoretically the bands due to 0-H group in free ligand disappear while bands due to
N-0, C=O and C-N shift on complex formation. Thus the infrared spectroscopic study
will help in elucidating the structure of the ligands as well as of metal complexes.
2.4 KINETIC MEASUREMENTS
For each kinetic run, two reaction vessels were used. One of these contained
appropriate volumes of acid (catalyst) and water; the other one contained the
hydroxamic acid. After thermostating for about 30 minutes the acid solution was
transferred to the reaction vessel containing hydroxamic acid. After the content of the
reaction vessel was shaken, an aliquot of the reaction mixture was withdrawn into a
10·ml volumetric flask containing 2 ml of lron(lll) chloride. A double purpose, quenching
of the reaction and colour development, was thus served. The volume of the coloured
solution was made up to 10 ml and its absorbance was measured at 500-520 nm using
a reference solution containing 2 ml of the same lron(lll) chloride in 10 ml of water. The
kinetic runs were studied generally up to two half-lives. For measuring absorbance, a
Systronics UV-VIS Spectrophotometer type 108 was used. For protonation studies a
Unicam UV2 300 spectrophotometer was used.
For a pseudo first-order reaction, a plot of log absorbance vs. twill give a straight
line of slope, - kw/ 2.303 (where kw is the pseudo first-order rate constant for the
reaction). The rates of hydrolysis were determined spectrophotometrically by following
the decrease in the characteristic absorption of the hydroxamic acid-ferric chloride
complex. As Beer's law is applicable to all the lron(lll) hydroxamic acid complexes, the
concentration of reacting species is proportional to the absorbance A. [log A ~ log (a
x)]. To obtain the rate constant kw• log (a-x) was plotted against time t; from the slope
of the plot, k, was determined. The fact that a straight line was obtained for all the plots
of (log a-x) vs. t measured in this investigation is, in itself, an indication that the
(55)
tx enmontal
reactions are all first-order in substrate. The initial concentration of the hydroxamic acid
in reaction mixture 1s about 7.0 x 10-' M. The experimental errors in the respective runs
were generally less than 1.0% and the reproducibility of the rate constants was within
±1.5%.
Simple and multivariate linear regression analyses were carried our by the least
square method on a personal computer. The programme for the multivariate linear
regression enabled us to evaluate regression coefficient of the variables, coefficients
of multiple determination and standard deviation etc.
2.5 pK8". AND pK, MEASUREMENTS
An attempt have been made to measure the pK8 ". and pK. values, for study the
acid-base equilibria of hydroxamic acids.
2.51 pK8". Measurements
A weighted amount of compound was prepared in water to prepare the stock
solution of substrate, from which 2.0 ml aliquots was pipetted out into 10 ml volumetric
flasks and make upto mark with suitable acid water mixtures, so as to give solutions
of desired acid concentrations (the final concentration of substrate were around
3 x 1 o-s mol dm-a). All the solutions were cooled in ice-bath before and during the
addition. The resulting cold was then thermostated to 25 ± 0.1 oc. The solutions were
then transferred in to 10 mm glass cells and the UV spectra in the 190-300 nm range
were recorded in spectrophotometer. A reference cell containing acid of the same
strength as that in the reaction cell was used in each case. For protonation studies
Unicam UV2 300 spectrophotometer were used.
2.52 pK. Measurements
pK. of hydroxamic were determined by pH metric titration method and
spectrophotometric method. Procedure for the pH metric titration for determining
ionisation constants (PK.) of hydroxamic acids is basically the same as described be
(56)

Ex onmontal
Albert and Sergeant [14]. Generally 0.01M solution of hydroxamic acids were titrated
against 0.1 M NaOH. The solution was thermostated. Titration was carried out by
adding 0.5 ml of 0.1 M NaOH from the microburette, to the titre solution and the steady
pH of the resultant solution were recorded each time.
The ionization ratio of monohydroxamic acid (BHA) and dihydroxamic acid
(ODHA) in aqueous sodium hydroxide has been determined using UV
spectrophotometric method [15-16]. The spectrum changes appreciably with increase
of sodium hydroxide concentrations. The ionization ratio is alkaline solutions of different
concentration was calculated by using the relation.
[A-] EHA-E
[HA] E-EA_
Ionization constant (PK.) is calculated by the use of following equation.
[A-] pK. = pH - log [HA]
2.6 PRODUCT IDENTIFICATION
Product studies were carried out in solutions identical with those used in
the kinetic measurements, except that the concentrations of the substrates employed
were higher. In moderately concentrated acids, 1.5 g of the substrate was dissolved
in 100 ml of acid and heated at 85°C using a water bath. After reactions had reached
at least 90% completion, aliquots were removed and chilled for product identification.
Hydrolysis products, i.e. oxalic, malonic and succinic acids and hydroxylamine
hydrochloride, were identified qualitatively for dihydroxamic acids. For desferal succinic
acid, acetic acid and 5-amino pentyl hydroxylamine were identified qualitatively by
usual organic tests. These products were separated by fractional crystallization and
purified by recrystallization. The UV spectra of isolated products were compared with
those of authentic samples.
(57)

Ex oomontal
REFERENCES
1. R. Choubey, A. K. Baveja and V. K. Gupta, Analyst 1984, 109, 391.
2. K. R. Pal and V. K. Gupta, Atmos, Env. 1983, 17, 1773.
3. A. K. Baveja and V. K. Gupta, Int. J. Env. Anal. Chern. 1983, 16, 67.
4. U. Priyadarshini and S. G. Tandon, Chern. Eng. Data 1967, 12, 143.
5. D. A. Brown and A. L. Roche, lnorg. Chern. 1986, 22, 2199.
6. V. A. Shenderovich, V. I. Ryabai, E. D. Krivelena, B. I. lenin, I. A. Vainshenker
and A. V. Dogadina, Zh. Ncorg. Khim. 1979, 1746.
7. D. A. Brown, D. Mckeith and W. K. Glass, lnorg. Chim. Acta, 1979, 35, 57.
8. C.N.R. Rao; "Chemical Applications of Infrared Spectroscopy", Academica
Press, 1963, p 175-191.
9. L.J. Bellamy; "The Infrared Spectra of Complex Molecules", Methues, London
1962, pp 95-98.
10. N.R. Jones and C. Sandorfy; "Techniques of Organic Chemistry", Vol. IX, Ed.,
W. West, "Chemical Applications of Spectroscopy'', Inter Science Publishers,
Inc. New York, 1956, p 487.
11. A. D. Cross; "An Introduction to Practical Infrared Spectroscopy", Butterworths
1964, p 67.
12. R. M. Silverstein and G.C. Bassler; "Spectrometric Identification of Organic
Compounds", John Wiley, New York 1964, p 61.
13. B. Hutchinson, S. Sample, L. Thompson, S. Olberickt, J. Crowder, D. H.
Eversdyk, D. Jett and J. Bostick, J. lnorg Chim. Acta, 1983, 74, 29.
14. A. Albert and E.P. Serjeant, "The Determination of Ionisation Constants",
1984, p 70.
15. J.T. Edward and I. C. Wang, Canadian Journal of Chemistry 1962, 40, 399.
16. T. J. Hannigan and W.J. Spillane, J. Chern. Sco. Perkin Trans. II, 1982, 851.
(58)
Recommended