2.7: Absolute Value Functions and 2.7: Absolute Value Functions and GraphsGraphs
Objective:
SWBAT graph an absolute value function by performing transformations on the parent function f (x) = |x|.

VocabularyVocabulary
• The function f(x) = |x| is an absolute value function.
• The highest of lowest point on the graph of an absolute value function is called the vertex.
• An axis of symmetry of the graph of a function is a vertical line that divides the graph into mirror images. – An absolute value graph has one axis of
symmetry that passes through the vertex.

• Absolute Value Function
• Vertex
• Axis of Symmetry
Absolute Value Function

Building the Absolute Value Building the Absolute Value FunctionFunction
The absolute value function is defined by f (x) = |x|.
The graph of the absolute value function is similar to the linear parent function, except it must always be positive.
4
2
-2
-4
-5 5
4
2
-2
-4
-5 5

Building the Absolute Value Building the Absolute Value FunctionFunction
The absolute value function is defined by f (x) = |x|.
So we just take the negative portion of the graph and reflect it across the x-axis making that part positive.
4
2
-2
-4
-5 5

Building the Absolute Value Building the Absolute Value FunctionFunction
The absolute value function is defined by f (x) = |x|.
This is the absolute value parent functionparent function.
4
2
-2
-4
-5 5
f x = x

Parent FunctionParent Function
• V-shape• It is symmetric about the y-axis (Axis of
Symmetry)• The vertexvertex is the minimum point on the graph

TranslationTranslation
A translationtranslation is a transformation that shifts a graph horizontally or vertically, but doesn’t change the overall shape or orientation.

TranslationTranslation
The graph of
y = |x – h| + k
is the graph of y = |x| translated h horizontal units and y vertical units.
• The new vertex is at (h, k)

Stretching and CompressionStretching and Compression
The graph of y = a|x| is graph of y = |x| vertically stretched or compressed depending on the |a|.
The value of a acts like the slope.

ReflectionReflection
The graph of y = a|x| is graph of y = |x| reflected across the x-axis.
4
2
-2
-4
-5 5
f x = x
4
2
-2
-4
-5 5
f x = - x
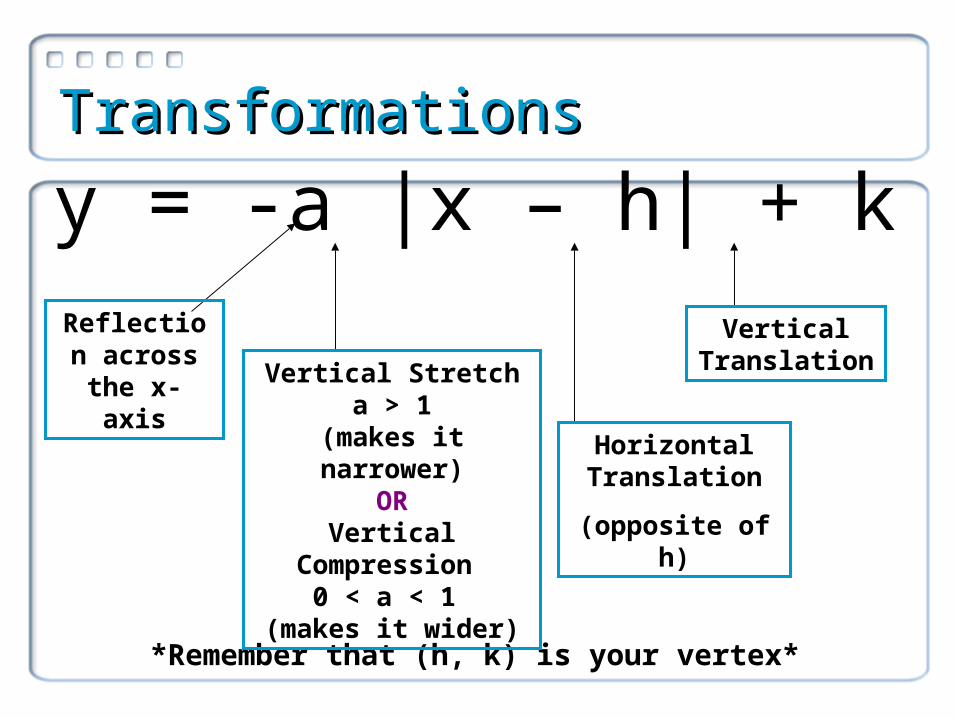
TransformationsTransformations
y = -a |x – h| + k
*Remember that (h, k) is your vertex*
Reflection across the
x-axis Vertical Stretcha > 1
(makes it narrower)
ORVertical
Compression 0 < a < 1
(makes it wider)
Horizontal Translation
(opposite of h)
Vertical Translation

Multiple TransformationsMultiple Transformations
In general, the graph of an absolute value
function of the form y = a|x – h| + k can involve translations, reflections, stretches or compressions.
To graph an absolute value function, start by identifying the vertex.

Graphing Absolute Value FunctionsGraphing Absolute Value Functions
Graphing y = a|x – h| + k is straight forward:
• Plot the vertex (h, k). (note…if +h inside that means h is negative(to the left); if – h inside that means h is positive (to the right)
• Use the a value as slope to plot more points. Remember you have to do positive and negative slope to get points on both sides of the V
• Connect the dots in a V-shape.

Example 1Example 1
Graph the following functions without making a table.
y = |x – 2| + 3 This graph will go right 2 and up 3 so from the origin go right 2 and up 3. This is the vertex (2, 3). Now from that point use the positive and negative slope (a = 1 here) to get more points.
4
2
-2
-4
-5 5
f x = x

Your turn:Your turn:
Graph the following functions without making a table.
Text book page 111 #14
y = |x - 1| + 3
Identify the vertex
Vertex ( , )
Slope =
4
2
-2
-4
-5 5
f x = x
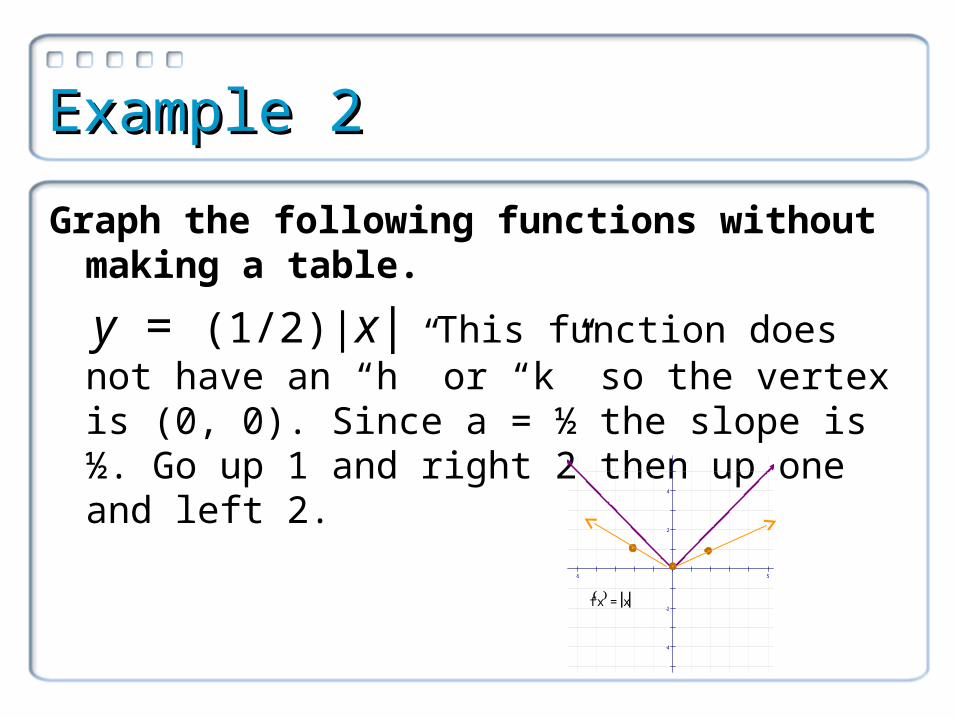
Example 2Example 2
Graph the following functions without making a table.
y = (1/2)|x| This function does not have an “h” or “k” so the vertex is (0, 0). Since a = ½ the slope is ½. Go up 1 and right 2 then up one and left 2.
4
2
-2
-4
-5 5
f x = x

Your turn:Your turn:
4
2
-2
-4
-5 5
f x = x

Example 3Example 3
Graph the following functions without making a table.
f (x) = -3|x + 1| – 2 This graph will go left 1 and down two so the vertex will be (-1, -2). Since “a” is negative the graph will open down. Since the value of “a” is 3 the slope will be 3 and -3 (just remember to go down.)
4
2
-2
-4
-5 5
f x = x
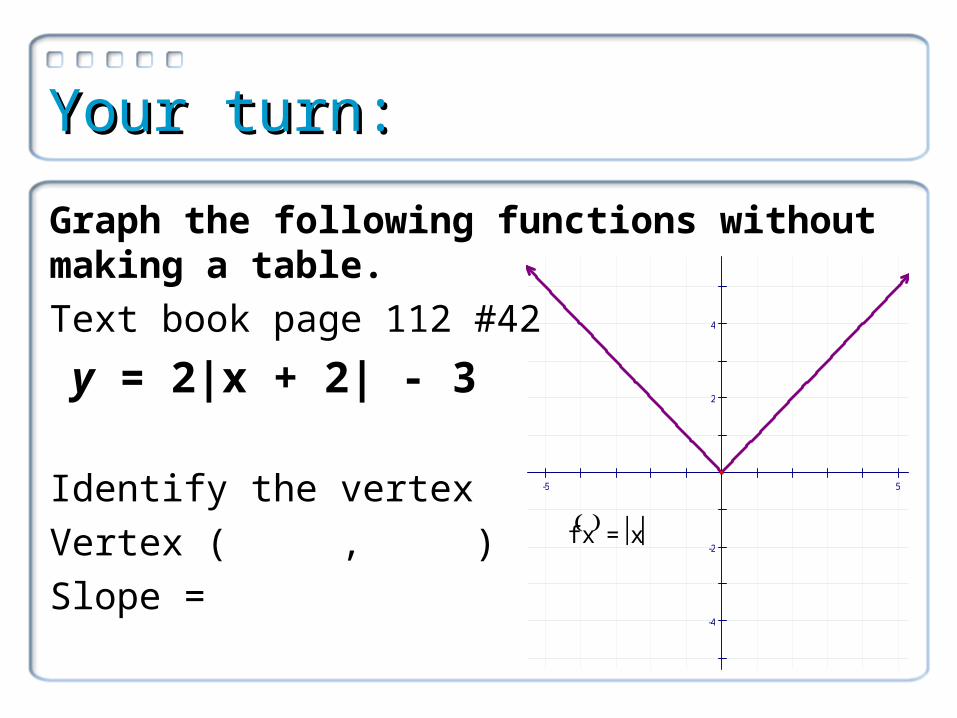
Your turn:Your turn:
Graph the following functions without making a table.
Text book page 112 #42
y = 2|x + 2| - 3
Identify the vertex
Vertex ( , )
Slope =
4
2
-2
-4
-5 5
f x = x

HOMEWORKHOMEWORK
Don’t forget to identify VERTEX first before graphing
Homework: page 111 #17-27 (odds)
Extra Challenge question
Text book page 111 #26
Recommended