Investor Presentation
August 2017
1
Proprietary and Confidential
Safe Harbor
This presentation includes forward-looking statements within the meaning of the Private Securities Litigation
Reform Act of 1995. Such statements relate to future events and expectations and involve known and unknown
risks and uncertainties. Examples of forward-looking statements include, but are not limited to, statements about
our anticipated growth and growth drivers; our future financial condition and results of operations; our future
business, financial and operating performance; our growth strategy and market outlook; our development of new
products and product features; our cost estimates and plans, including planned cost savings related to our
restructuring plan; and the success and/or market adoption of our products and solutions. We have based these
forward-looking statements on our current expectations, assumptions and projections. Our actual results or
actions may differ materially from those projected in forward-looking statements. These forward-looking
statements are subject to a number of risks, uncertainties and factors that could cause results to differ materially
as described in our filings with the Securities and Exchange Commission, including our annual report on Form 10-
K and quarterly reports on Form 10-Q. Except as may be required by law, we undertake no obligation to, and
expressly disclaim any obligation to, update or alter any forward-looking statements, whether as a result of new
information, future events, changes in assumptions or otherwise.
Financial guidance included in this presentation speak only as of the date of our last quarterly earnings press
release issued on August 8, 2017. We are not providing any financial guidance update in this presentation.
2
Please refer to the reconciliations of GAAP to Non-GAAP financial measures in the supplemental information and on the Investor Relations section of calix.com
Proprietary and Confidential
1.
2.
3.
4.
Calix at a Glance
The Coming Wave – Access rEvolution
The Rising Tide – Infrastructure Investment
Financials4.
5. Supplemental Information
Agenda
3

Calix at a Glance
4
Proprietary and Confidential
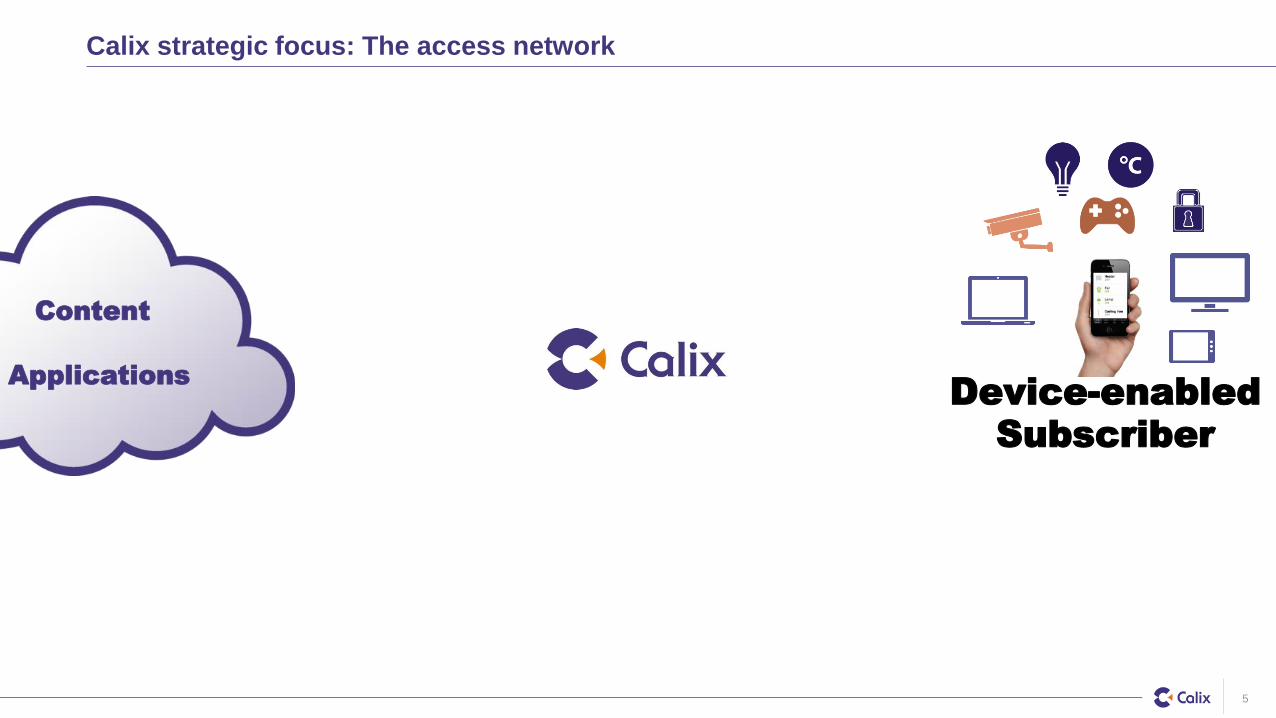
Calix strategic focus: The access network
5
Content
Applications
Device-enabled
Subscriber
Proprietary and Confidential
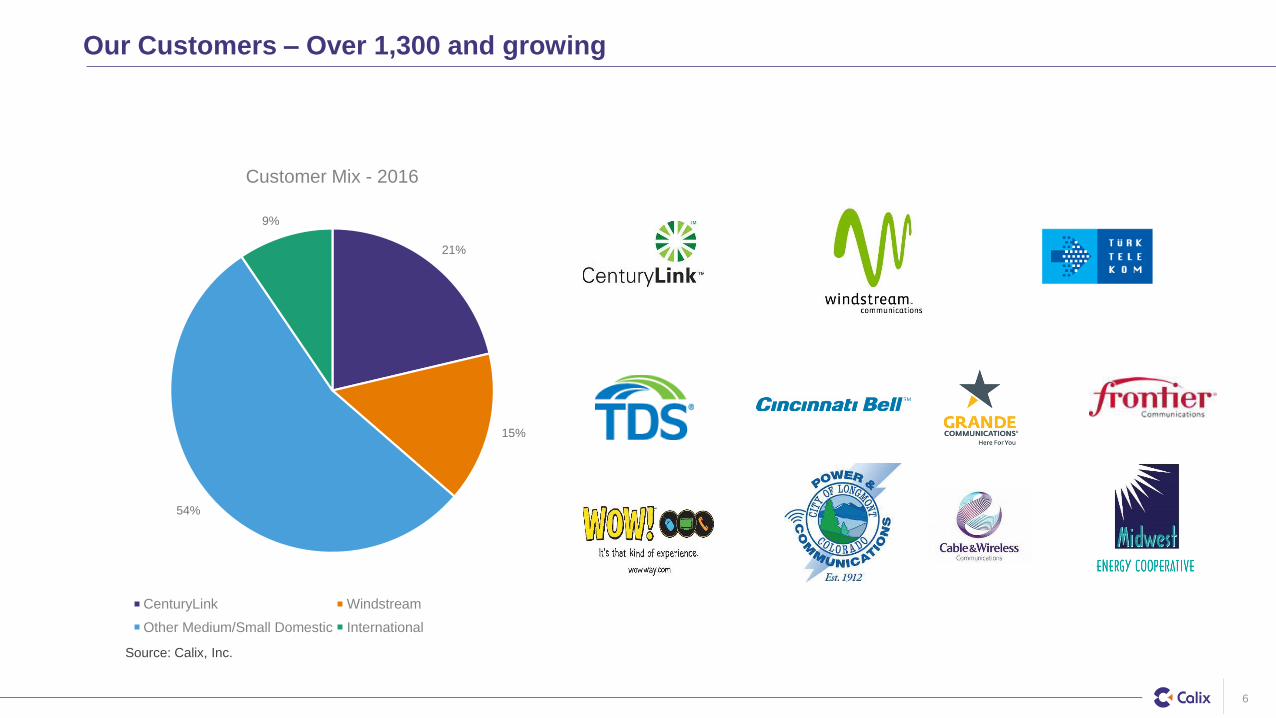
Our Customers – Over 1,300 and growing
6
21%
15%
54%
9%
Customer Mix - 2016
CenturyLink Windstream
Other Medium/Small Domestic International
Source: Calix, Inc.
Proprietary and Confidential
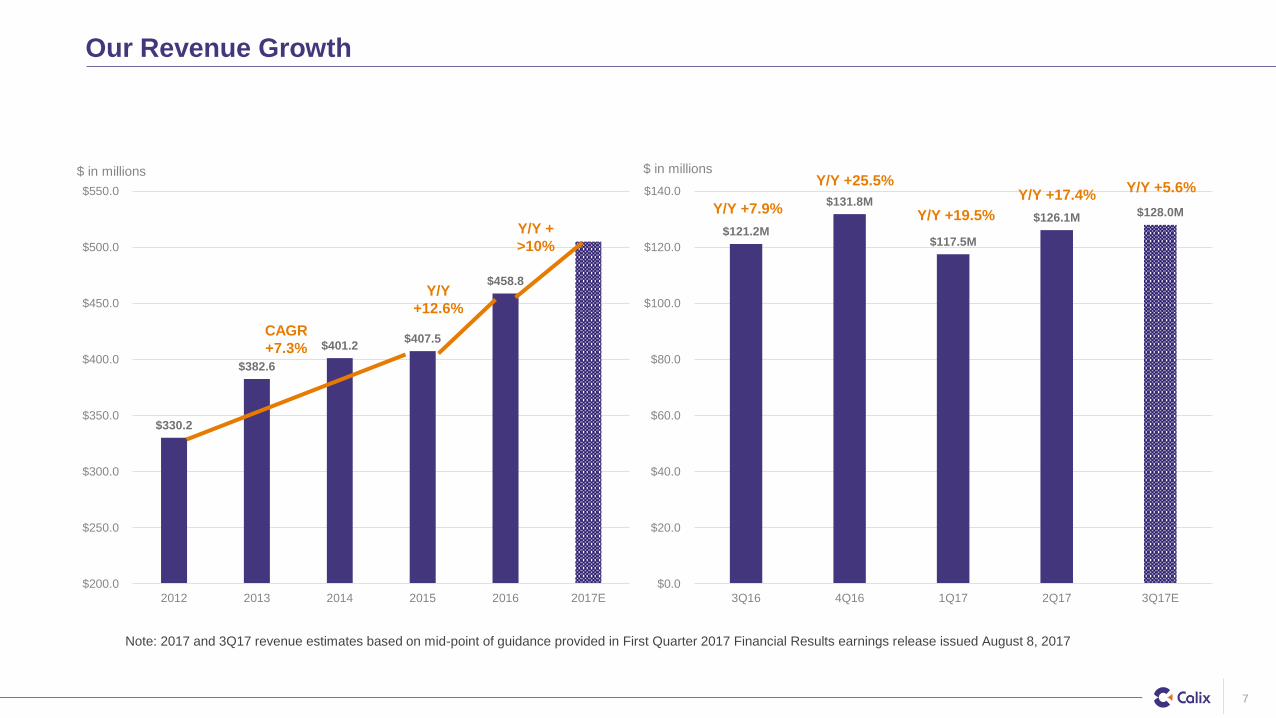
$121.2M
$131.8M
$117.5M
$126.1M $128.0M
$0.0
$20.0
$40.0
$60.0
$80.0
$100.0
$120.0
$140.0
3Q16 4Q16 1Q17 2Q17 3Q17E
$ in millions
Our Revenue Growth
7
$330.2
$382.6
$401.2 $407.5
$458.8
$200.0
$250.0
$300.0
$350.0
$400.0
$450.0
$500.0
$550.0
2012 2013 2014 2015 2016 2017E
$ in millions
CAGR
+7.3%
Y/Y
+12.6%
Y/Y +
>10%
Y/Y +17.4%Y/Y +7.9%
Note: 2017 and 3Q17 revenue estimates based on mid-point of guidance provided in First Quarter 2017 Financial Results earnings release issued August 8, 2017
Y/Y +25.5%
Y/Y +19.5%
Y/Y +5.6%

The Coming Wave
8
Proprietary and Confidential
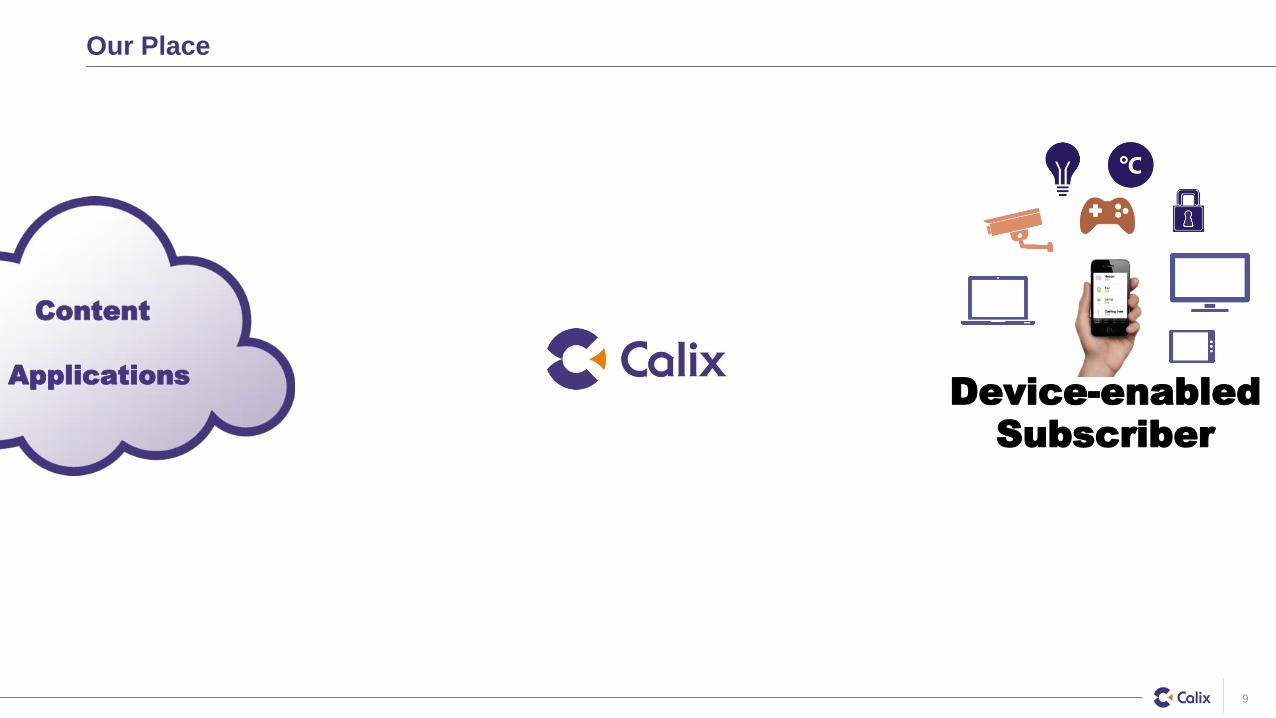
Our Place
9
Content
Applications
Device-enabled
Subscriber
Proprietary and Confidential
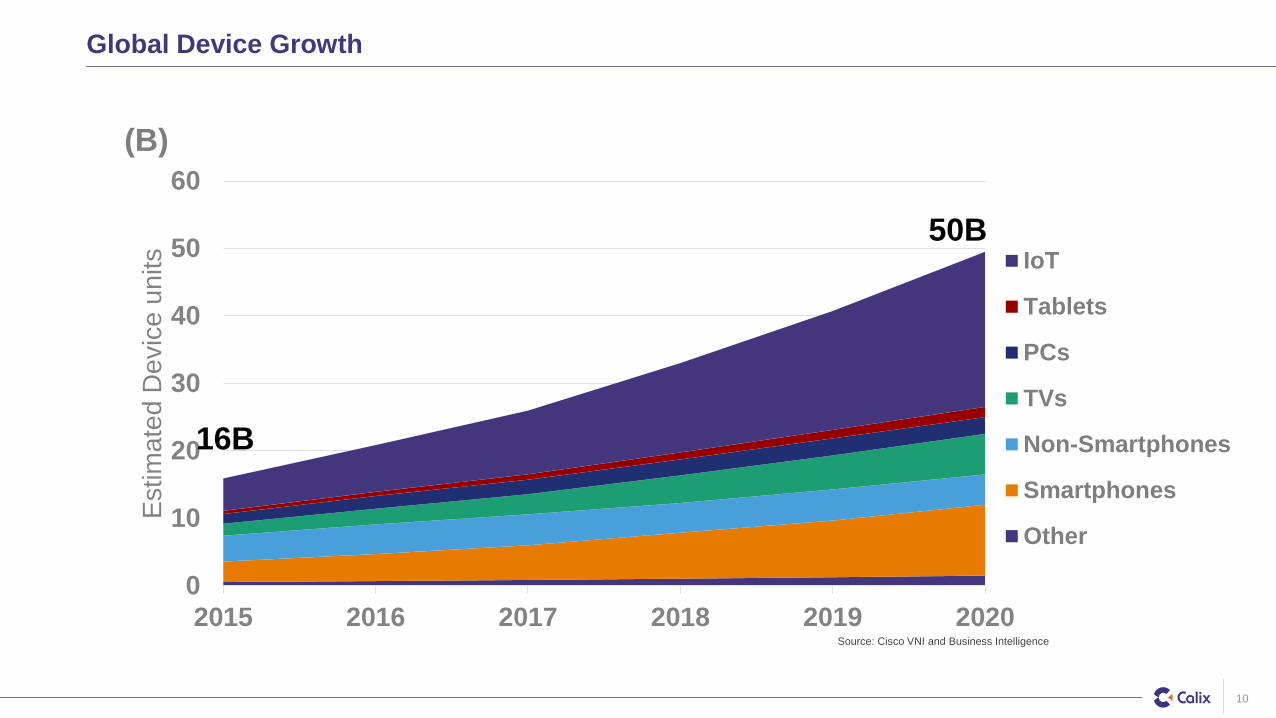
Global Device Growth
0
10
20
30
40
50
60
2015 2016 2017 2018 2019 2020
Estim
ate
d D
evic
e u
nits IoT
Tablets
PCs
TVs
Non-Smartphones
Smartphones
Other
50B
16B
(B)
Source: Cisco VNI and Business Intelligence
10
Proprietary and Confidential
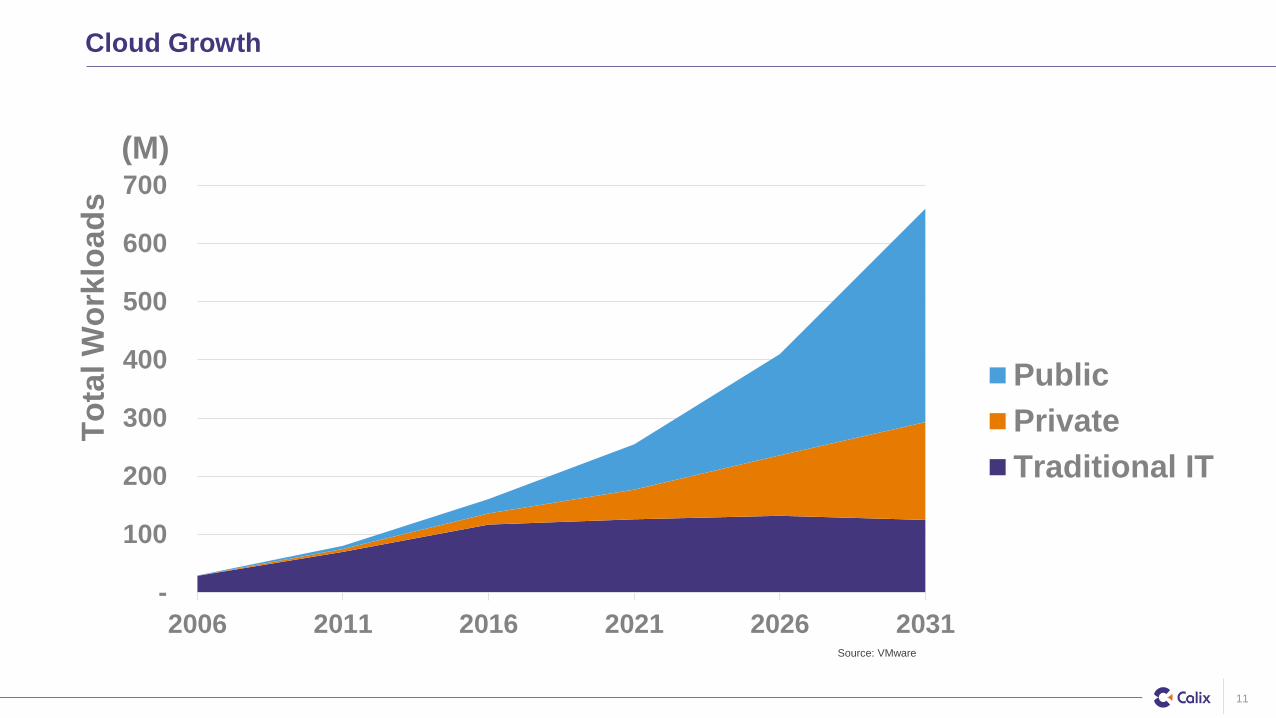
Cloud Growth
-
100
200
300
400
500
600
700
2006 2011 2016 2021 2026 2031
Public
Private
Traditional IT
To
tal W
ork
load
s
(M)
Source: VMware
11
Proprietary and Confidential
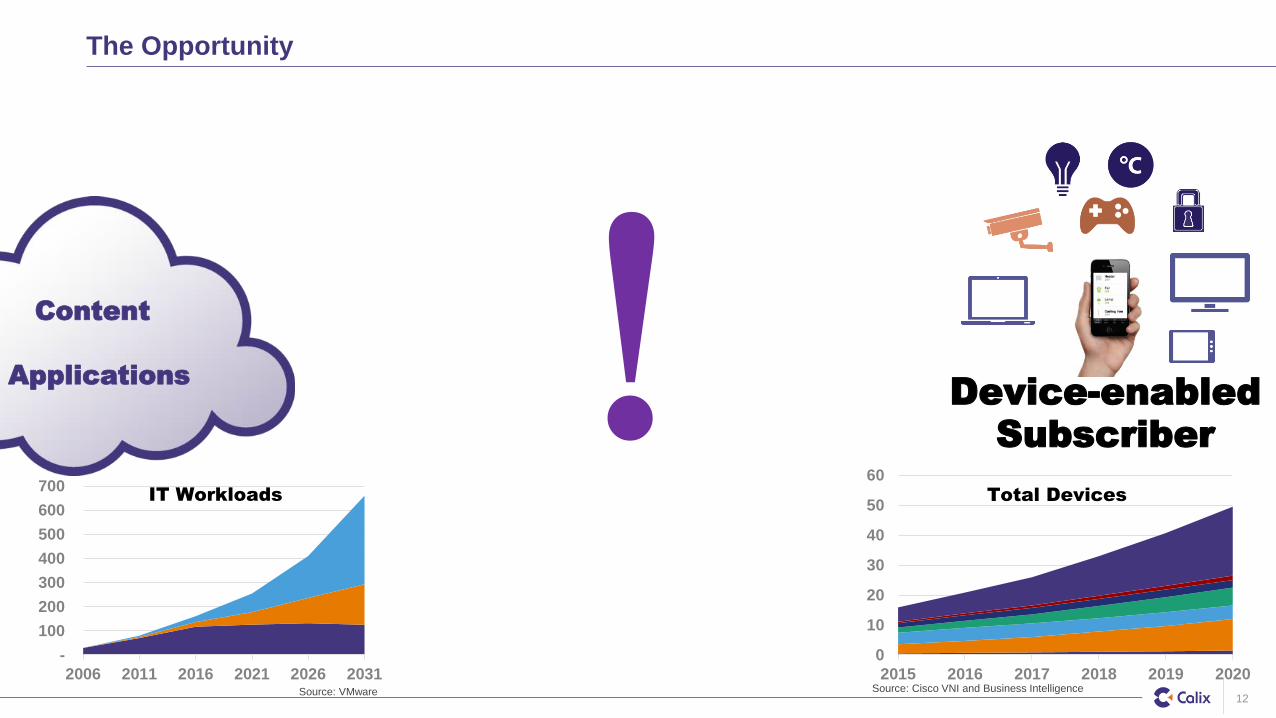
The Opportunity
12
Content
Applications
Device-enabled
Subscriber
-
100
200
300
400
500
600
700
2006 2011 2016 2021 2026 2031
0
10
20
30
40
50
60
2015 2016 2017 2018 2019 2020
IT Workloads Total Devices
Source: VMware Source: Cisco VNI and Business Intelligence
Proprietary and Confidential
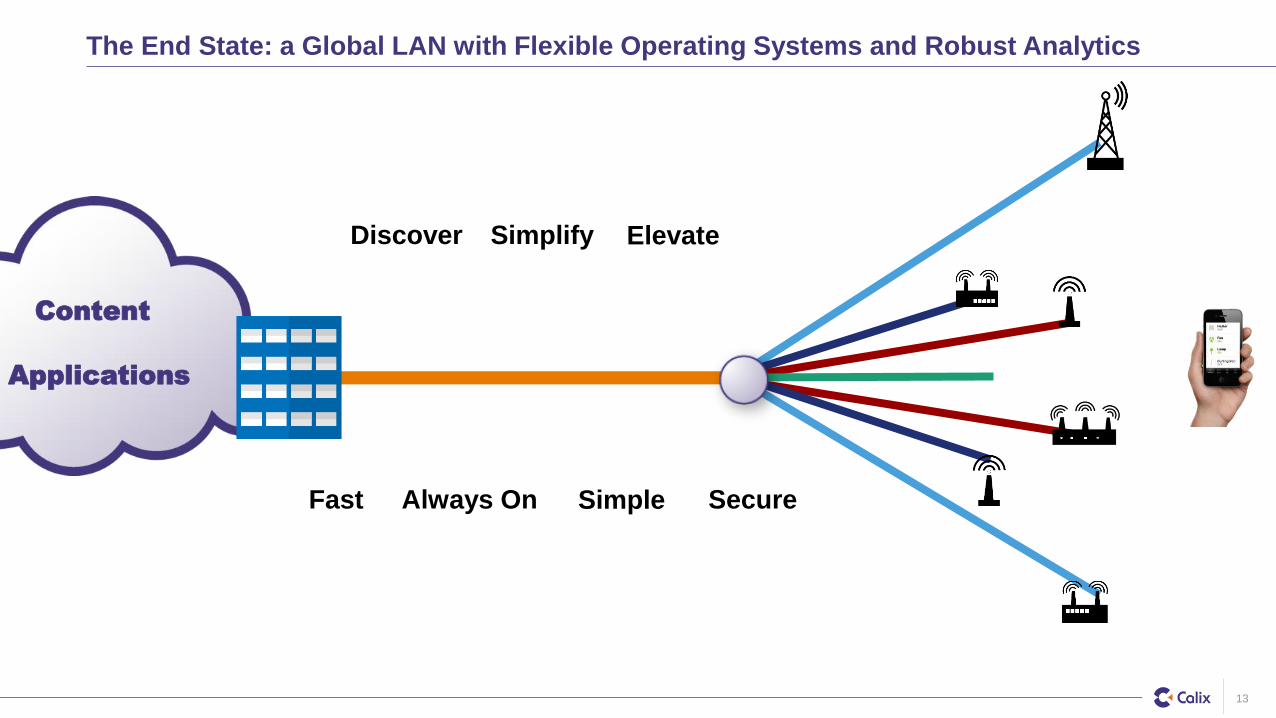
The End State: a Global LAN with Flexible Operating Systems and Robust Analytics
13
Content
Applications
SimpleAlways OnFast Secure
ElevateSimplifyDiscover
Proprietary and Confidential
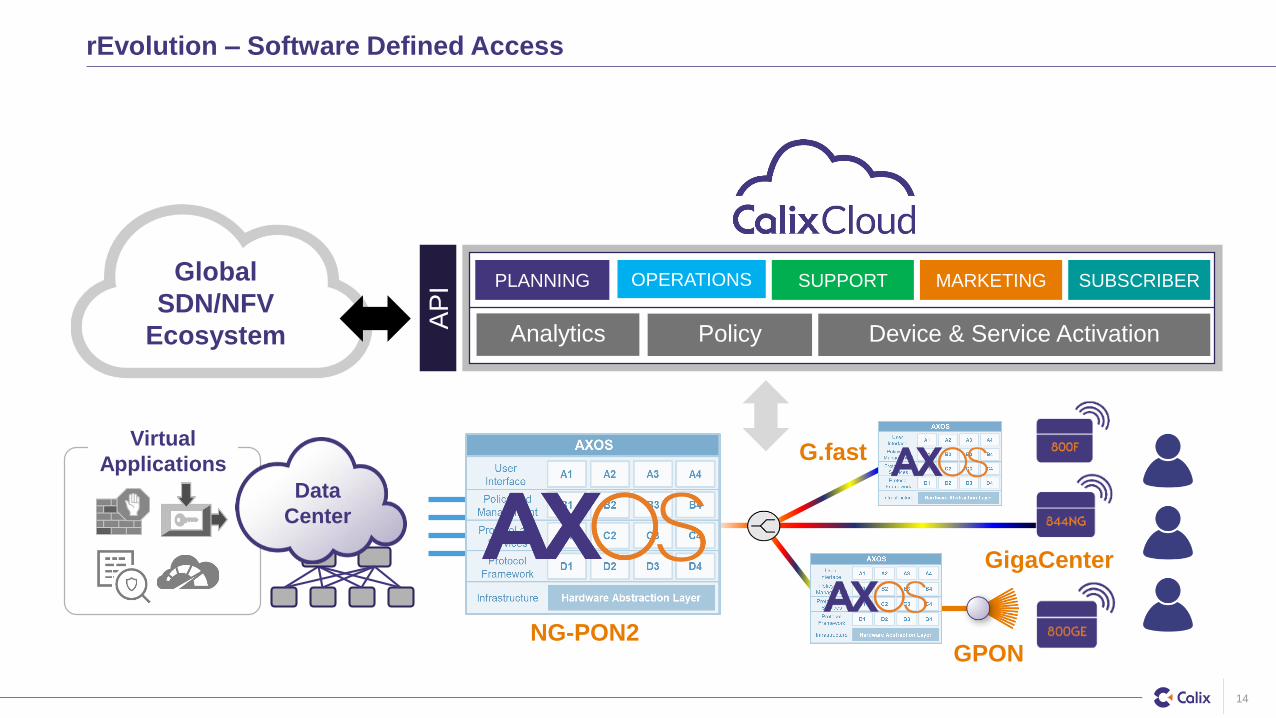
Global
SDN/NFV
Ecosystem Policy Device & Service ActivationAnalytics
AP
I PLANNING OPERATIONS SUPPORT MARKETING SUBSCRIBER
Virtual
Applications
Data
Center
G.fast
NG-PON2
GigaCenter
GPON
rEvolution – Software Defined Access
14
Proprietary and Confidential
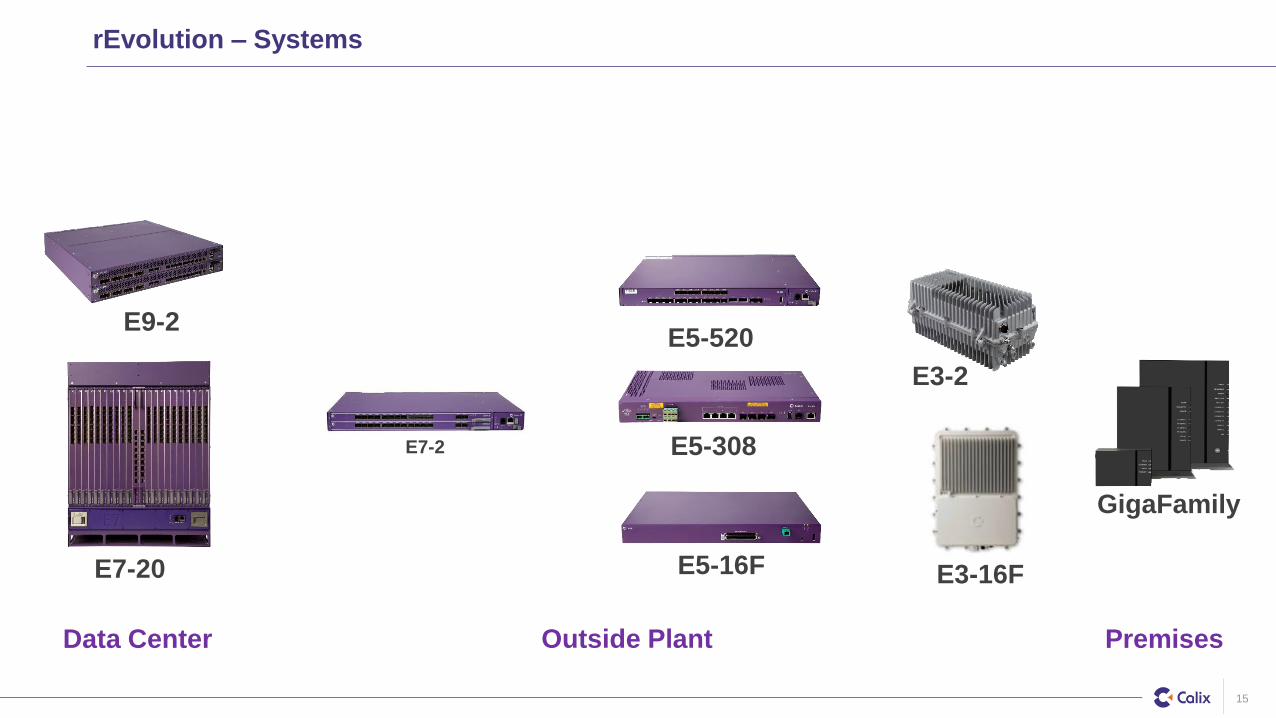
E7-2
E7-20 E3-16FE5-16F
GigaFamily
E3-2
E9-2
E5-308
E5-520
rEvolution – Systems
Data Center Outside Plant Premises
15
Proprietary and Confidential
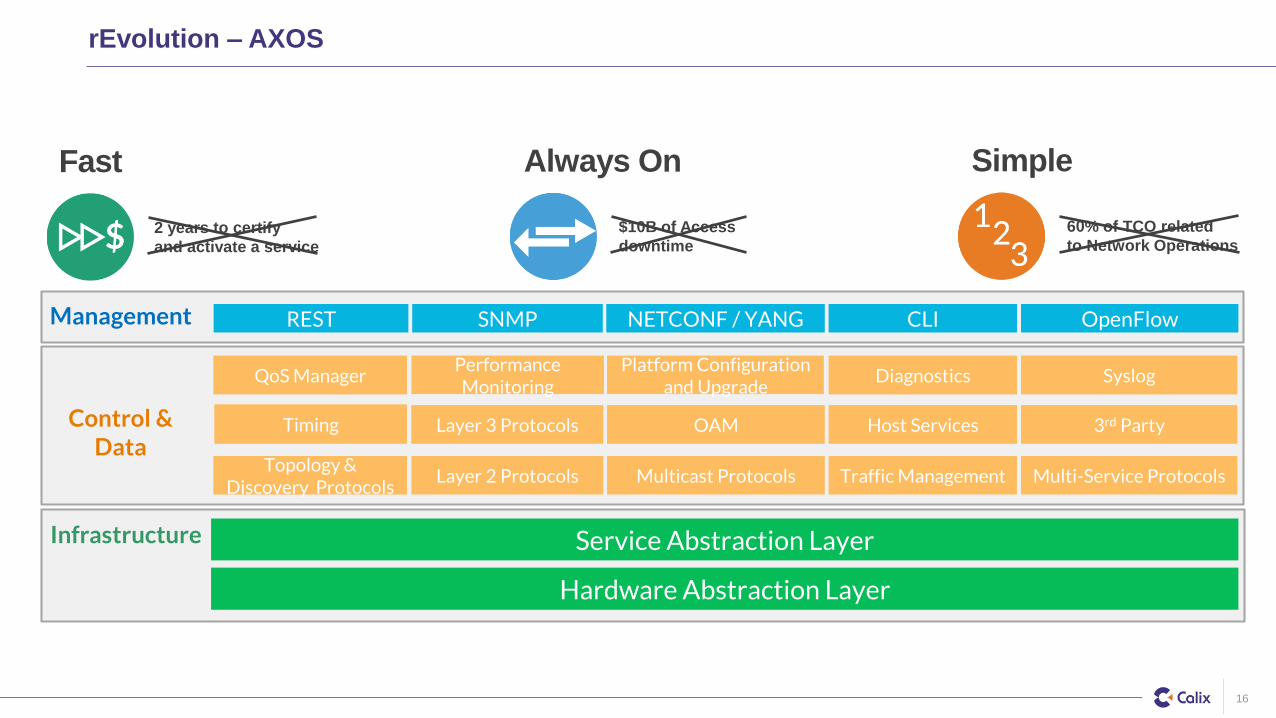
60% of TCO related
to Network Operations
SimpleAlways On
$10B of Access
downtime
Management REST SNMP NETCONF / YANG CLI OpenFlow
Infrastructure
Hardware Abstraction Layer
Service Abstraction Layer
Control & Data
Multi-Service Protocols
Layer 3 Protocols OAM Host Services 3rd Party
Topology & Discovery Protocols
Layer 2 Protocols Multicast Protocols Traffic Management
Performance Monitoring
QoS ManagerPlatform Configuration
and UpgradeDiagnostics Syslog
Timing
rEvolution – AXOS
35
Fast
2 years to certify
and activate a service
16
Proprietary and Confidential
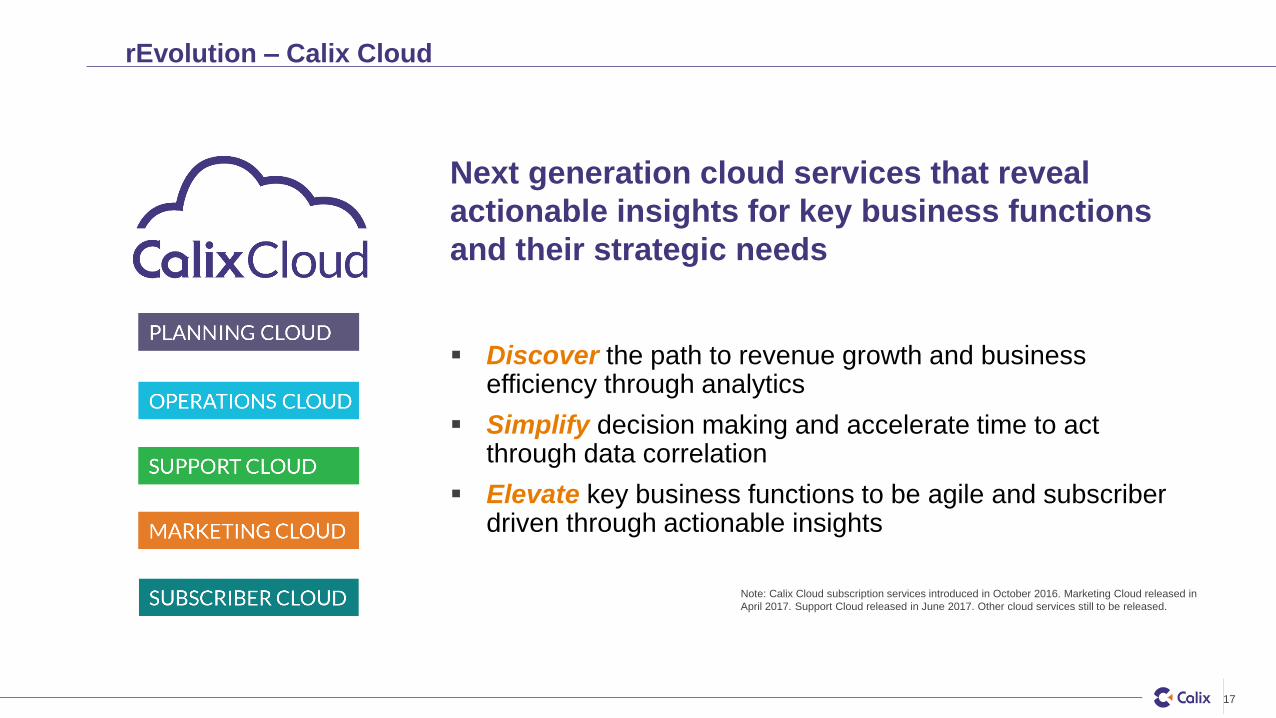
Next generation cloud services that reveal
actionable insights for key business functions
and their strategic needs
▪ Discover the path to revenue growth and business efficiency through analytics
▪ Simplify decision making and accelerate time to act through data correlation
▪ Elevate key business functions to be agile and subscriber driven through actionable insights
Note: Calix Cloud subscription services introduced in October 2016. Marketing Cloud released in
April 2017. Support Cloud released in June 2017. Other cloud services still to be released.
rEvolution – Calix Cloud
17
Proprietary and Confidential
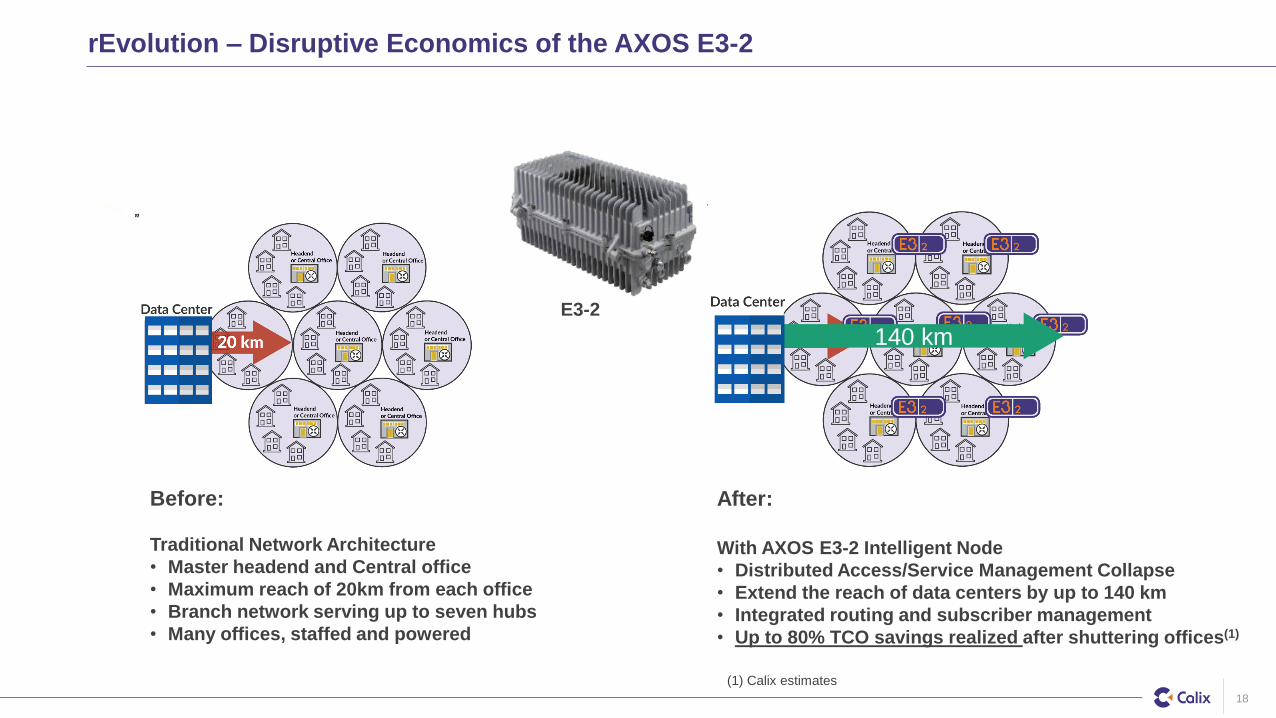
Before:
Traditional Network Architecture
• Master headend and Central office
• Maximum reach of 20km from each office
• Branch network serving up to seven hubs
• Many offices, staffed and powered
After:
With AXOS E3-2 Intelligent Node
• Distributed Access/Service Management Collapse
• Extend the reach of data centers by up to 140 km
• Integrated routing and subscriber management
• Up to 80% TCO savings realized after shuttering offices(1)
140 km
rEvolution – Disruptive Economics of the AXOS E3-2
E3-2
18
(1) Calix estimates
Proprietary and Confidential
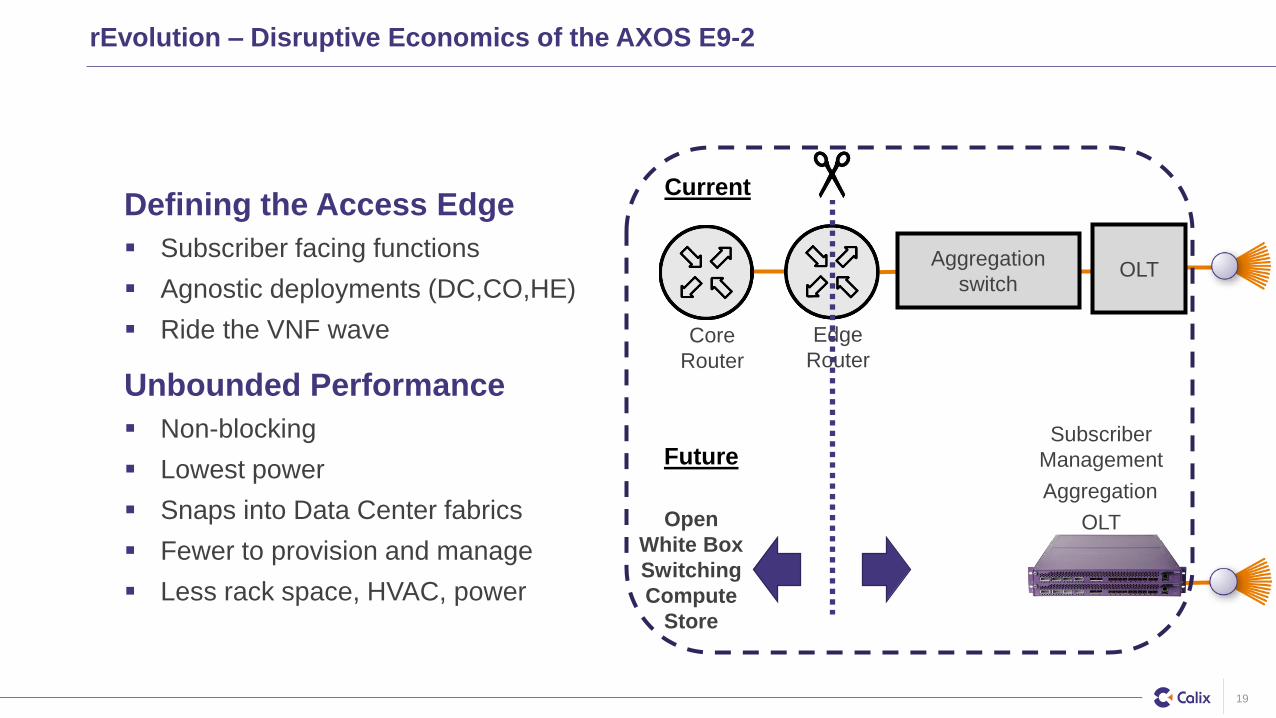
rEvolution – Disruptive Economics of the AXOS E9-2
Defining the Access Edge
▪ Subscriber facing functions
▪ Agnostic deployments (DC,CO,HE)
▪ Ride the VNF wave
Unbounded Performance
▪ Non-blocking
▪ Lowest power
▪ Snaps into Data Center fabrics
▪ Fewer to provision and manage
▪ Less rack space, HVAC, power
Aggregation
Subscriber
Management
OLT
Aggregation
switchOLT
Core
Router
Edge
Router
Open
White Box
Switching
Compute
Store
Current
Future
19

The Rising Tide
20
Proprietary and Confidential
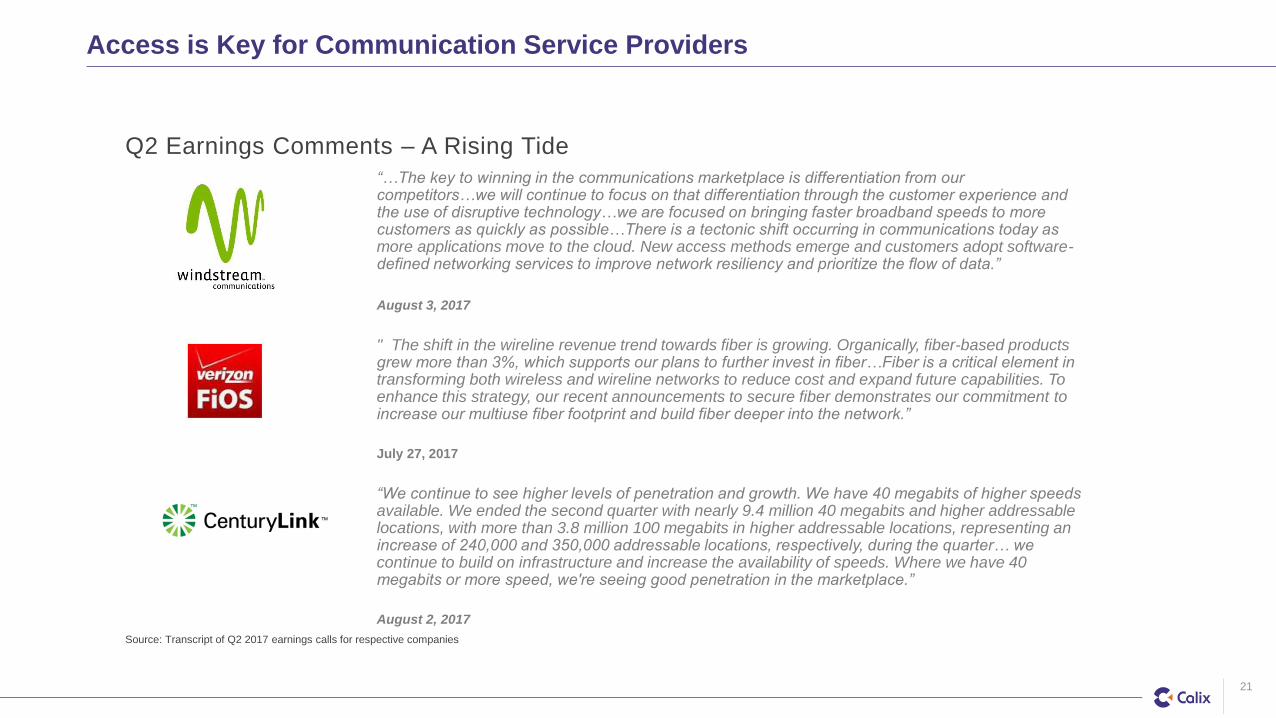
“…The key to winning in the communications marketplace is differentiation from our competitors…we will continue to focus on that differentiation through the customer experience and the use of disruptive technology…we are focused on bringing faster broadband speeds to more customers as quickly as possible…There is a tectonic shift occurring in communications today as more applications move to the cloud. New access methods emerge and customers adopt software-defined networking services to improve network resiliency and prioritize the flow of data.”
August 3, 2017
" The shift in the wireline revenue trend towards fiber is growing. Organically, fiber-based products grew more than 3%, which supports our plans to further invest in fiber…Fiber is a critical element in transforming both wireless and wireline networks to reduce cost and expand future capabilities. To enhance this strategy, our recent announcements to secure fiber demonstrates our commitment to increase our multiuse fiber footprint and build fiber deeper into the network.”
July 27, 2017
“We continue to see higher levels of penetration and growth. We have 40 megabits of higher speeds available. We ended the second quarter with nearly 9.4 million 40 megabits and higher addressable locations, with more than 3.8 million 100 megabits in higher addressable locations, representing an increase of 240,000 and 350,000 addressable locations, respectively, during the quarter… we continue to build on infrastructure and increase the availability of speeds. Where we have 40 megabits or more speed, we're seeing good penetration in the marketplace.”
August 2, 2017
Access is Key for Communication Service Providers
Q2 Earnings Comments – A Rising Tide
21
Source: Transcript of Q2 2017 earnings calls for respective companies
Proprietary and Confidential
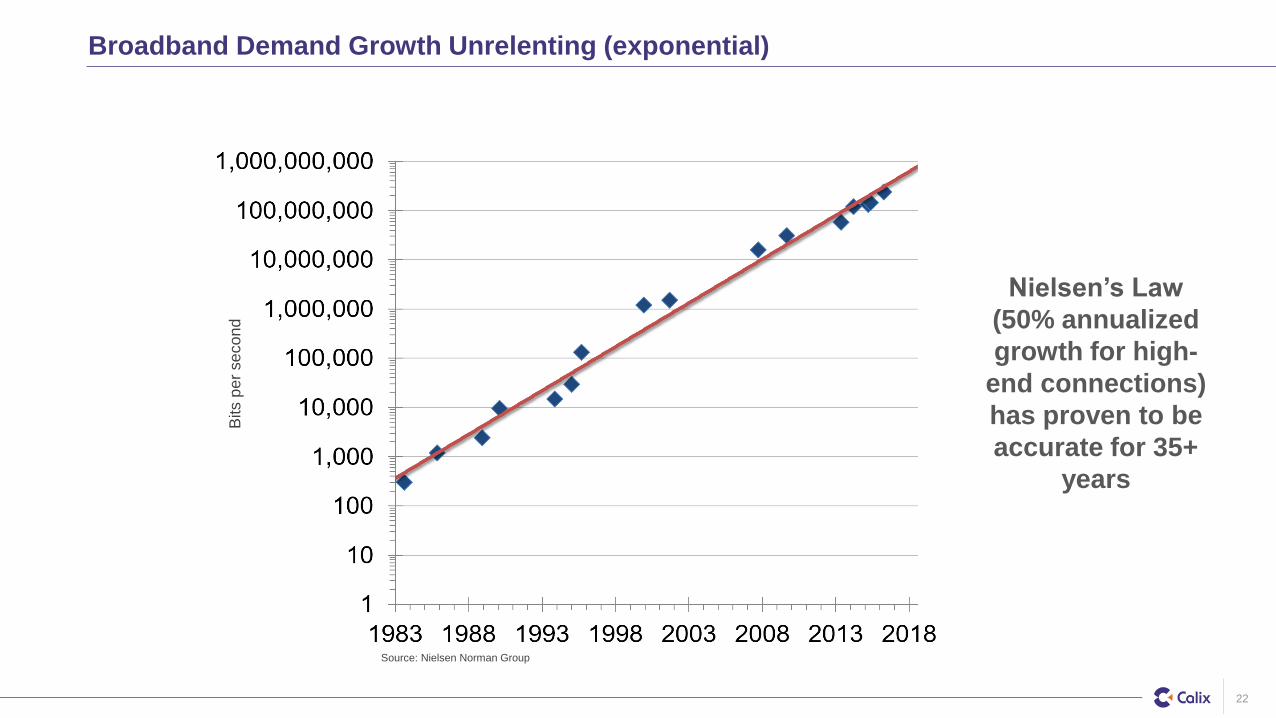
Broadband Demand Growth Unrelenting (exponential)
22
Nielsen’s Law
(50% annualized
growth for high-
end connections)
has proven to be
accurate for 35+
years
Source: Nielsen Norman Group
Bits p
er
se
co
nd
Proprietary and Confidential
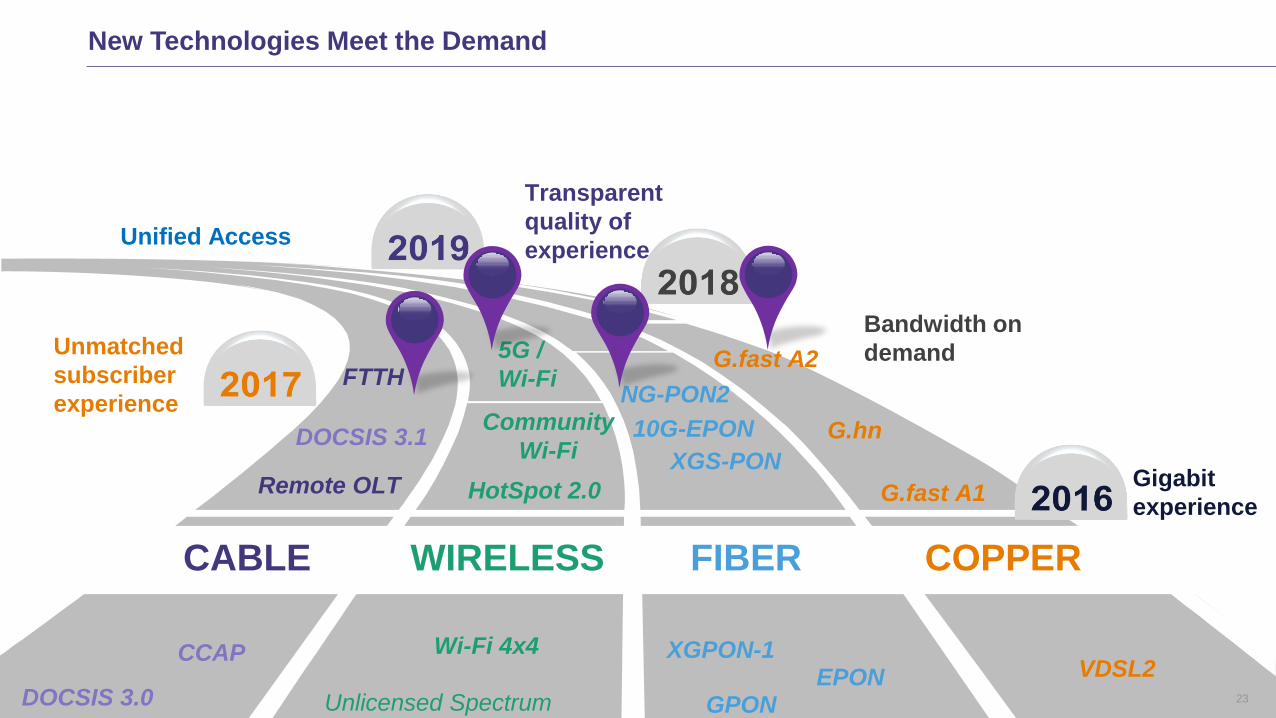
COPPERFIBERWIRELESSCABLE
Unified Access
Bandwidth on
demand
Transparent
quality of
experience
VDSL2
Unlicensed Spectrum
Wi-Fi 4x4
5G /
Wi-Fi
GPONEPON
XGPON-1
NG-PON2
DOCSIS 3.0
CCAP
G.fast A2Unmatched
subscriber
experienceG.hn
XGS-PON
Community
Wi-Fi
G.fast A1HotSpot 2.0Remote OLT
DOCSIS 3.1
FTTH
Gigabit
experience
New Technologies Meet the Demand
10G-EPON
23
Proprietary and Confidential
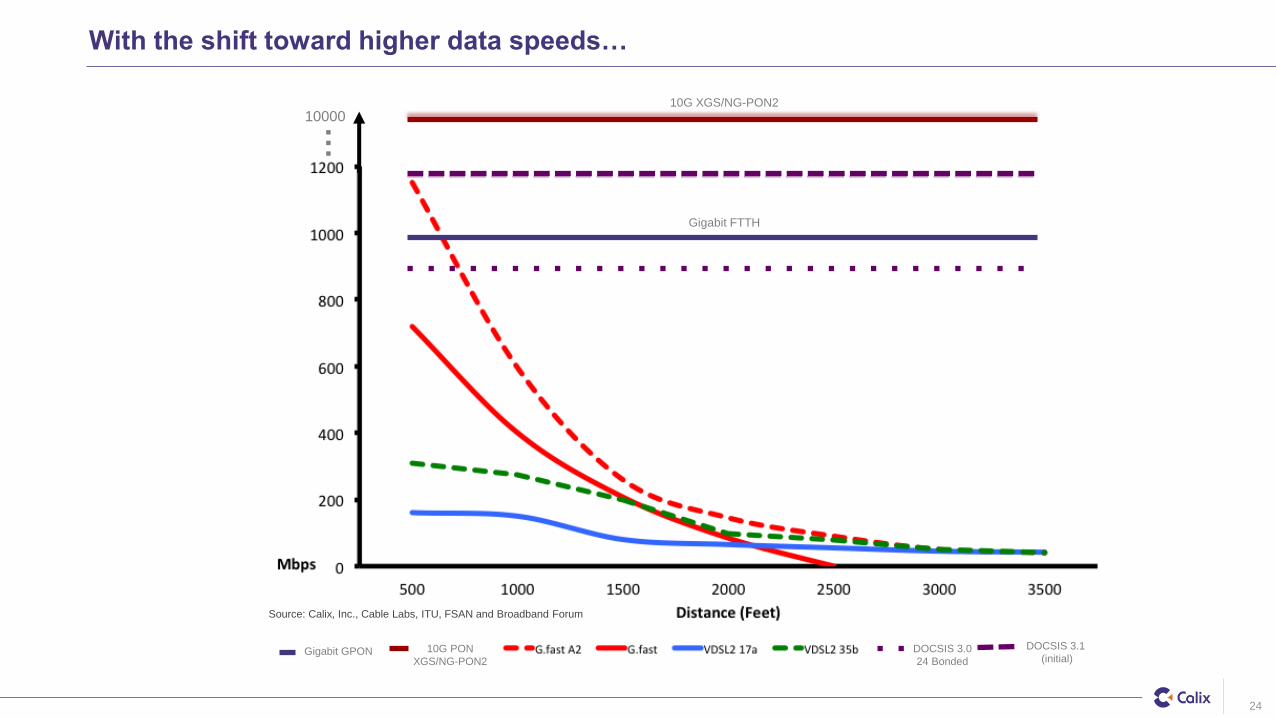
With the shift toward higher data speeds…
DOCSIS 3.0
24 BondedGigabit GPON
DOCSIS 3.1
(initial)
10000
Gigabit FTTH
10G PON
XGS/NG-PON2
…
10G XGS/NG-PON2
24
Source: Calix, Inc., Cable Labs, ITU, FSAN and Broadband Forum
Proprietary and Confidential
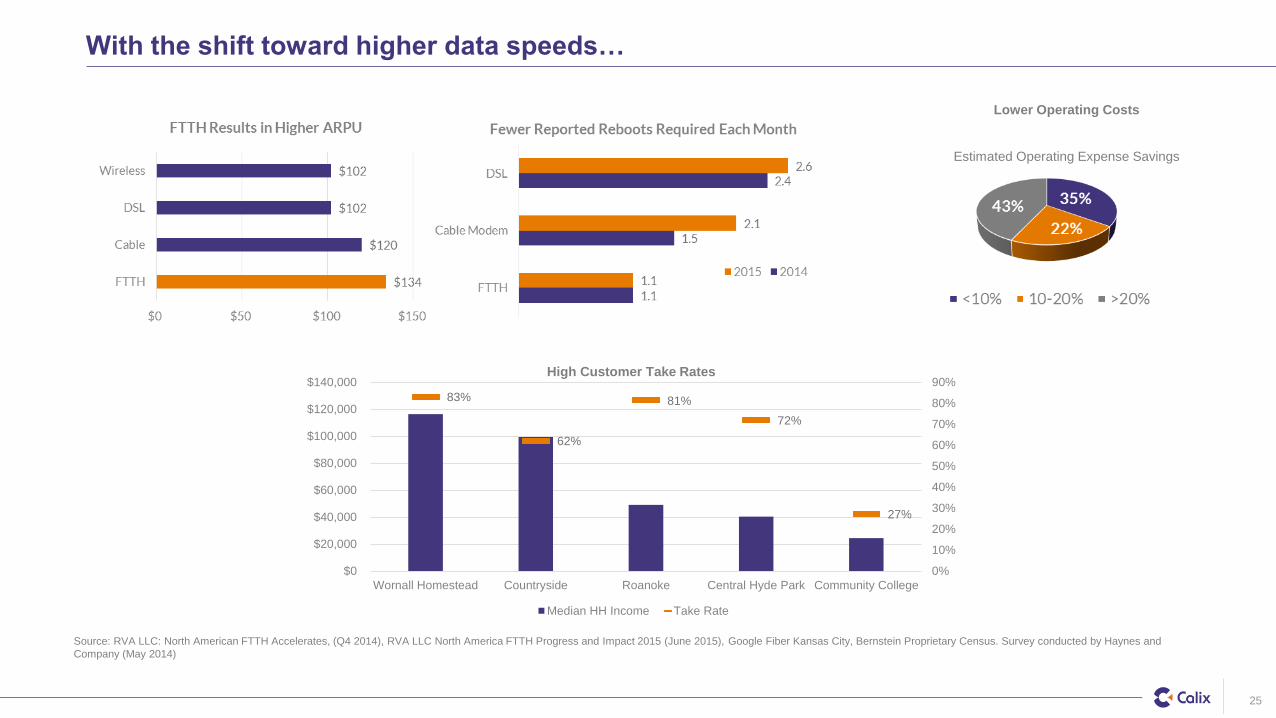
Lower Operating Costs
With the shift toward higher data speeds…
Source: RVA LLC: North American FTTH Accelerates, (Q4 2014), RVA LLC North America FTTH Progress and Impact 2015 (June 2015), Google Fiber Kansas City, Bernstein Proprietary Census. Survey conducted by Haynes and
Company (May 2014)
Estimated Operating Expense Savings
High Customer Take Rates
25
83%
62%
81%
72%
27%
0%
10%
20%
30%
40%
50%
60%
70%
80%
90%
$0
$20,000
$40,000
$60,000
$80,000
$100,000
$120,000
$140,000
Wornall Homestead Countryside Roanoke Central Hyde Park Community College
Median HH Income Take Rate
Proprietary and Confidential
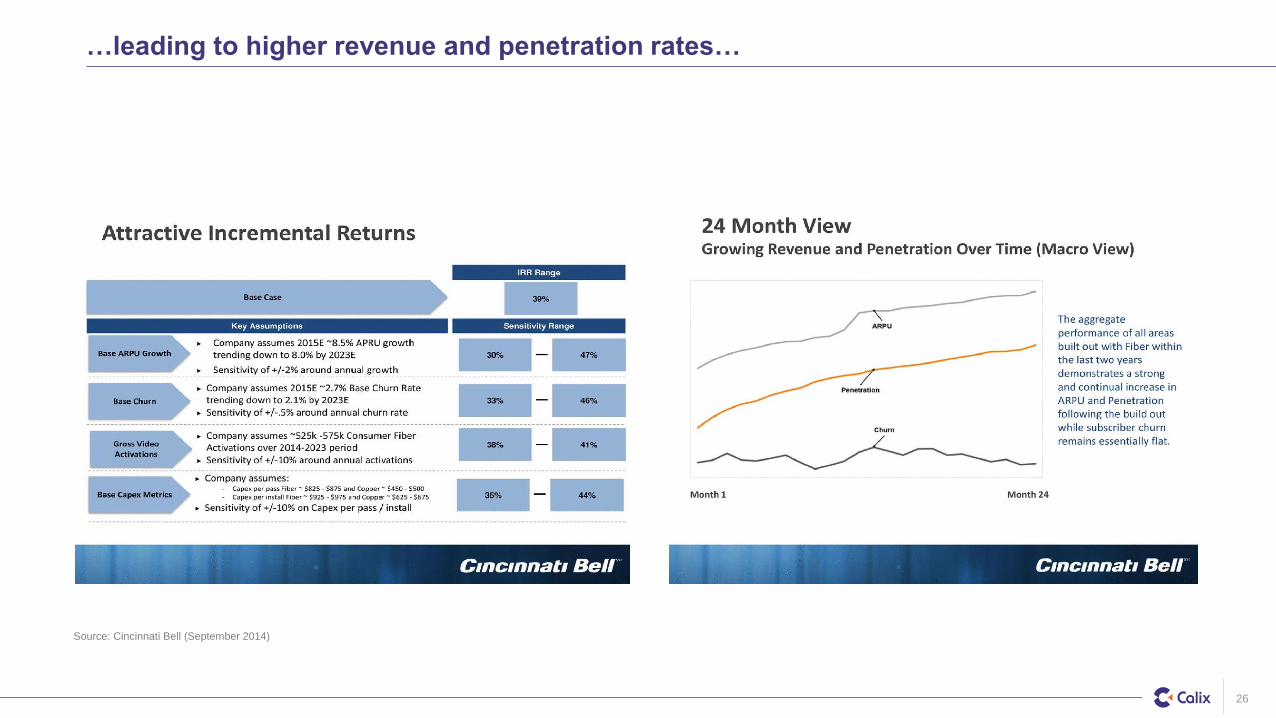
…leading to higher revenue and penetration rates…
26
Source: Cincinnati Bell (September 2014)
Proprietary and Confidential
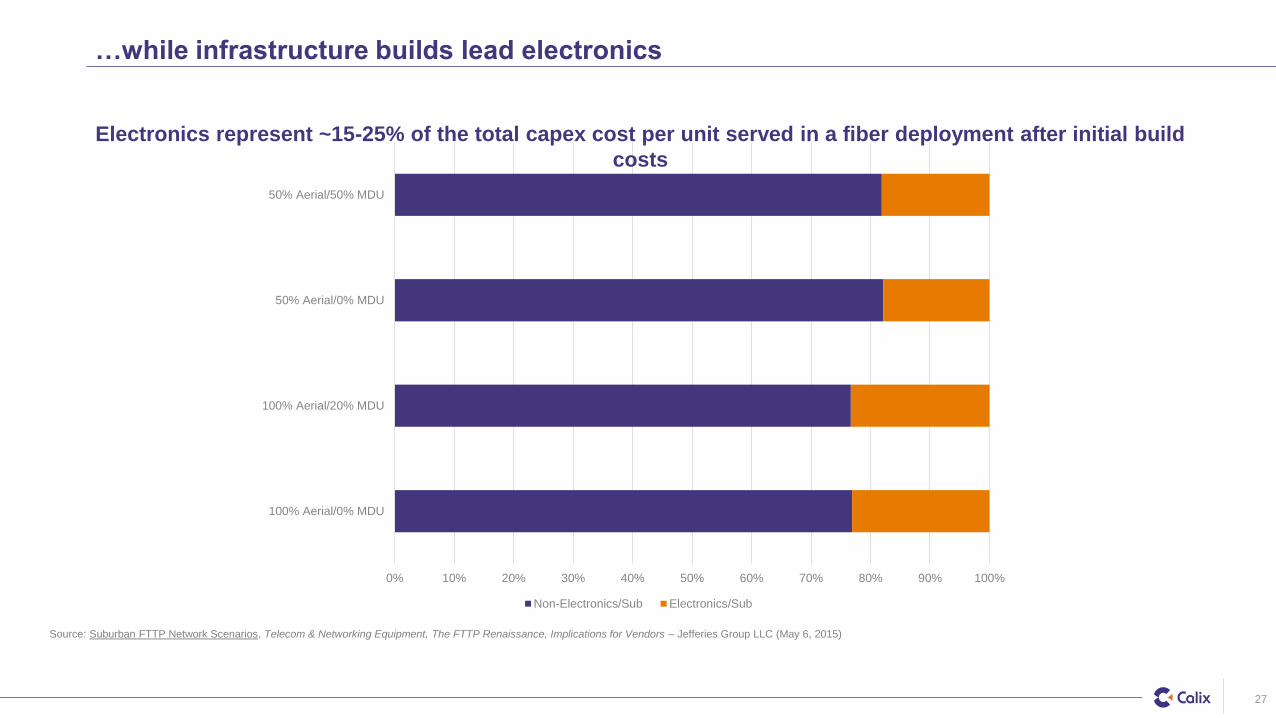
0% 10% 20% 30% 40% 50% 60% 70% 80% 90% 100%
100% Aerial/0% MDU
100% Aerial/20% MDU
50% Aerial/0% MDU
50% Aerial/50% MDU
Non-Electronics/Sub Electronics/Sub
…while infrastructure builds lead electronics
Source: Suburban FTTP Network Scenarios, Telecom & Networking Equipment, The FTTP Renaissance, Implications for Vendors – Jefferies Group LLC (May 6, 2015)
Electronics represent ~15-25% of the total capex cost per unit served in a fiber deployment after initial build
costs
27
Proprietary and Confidential
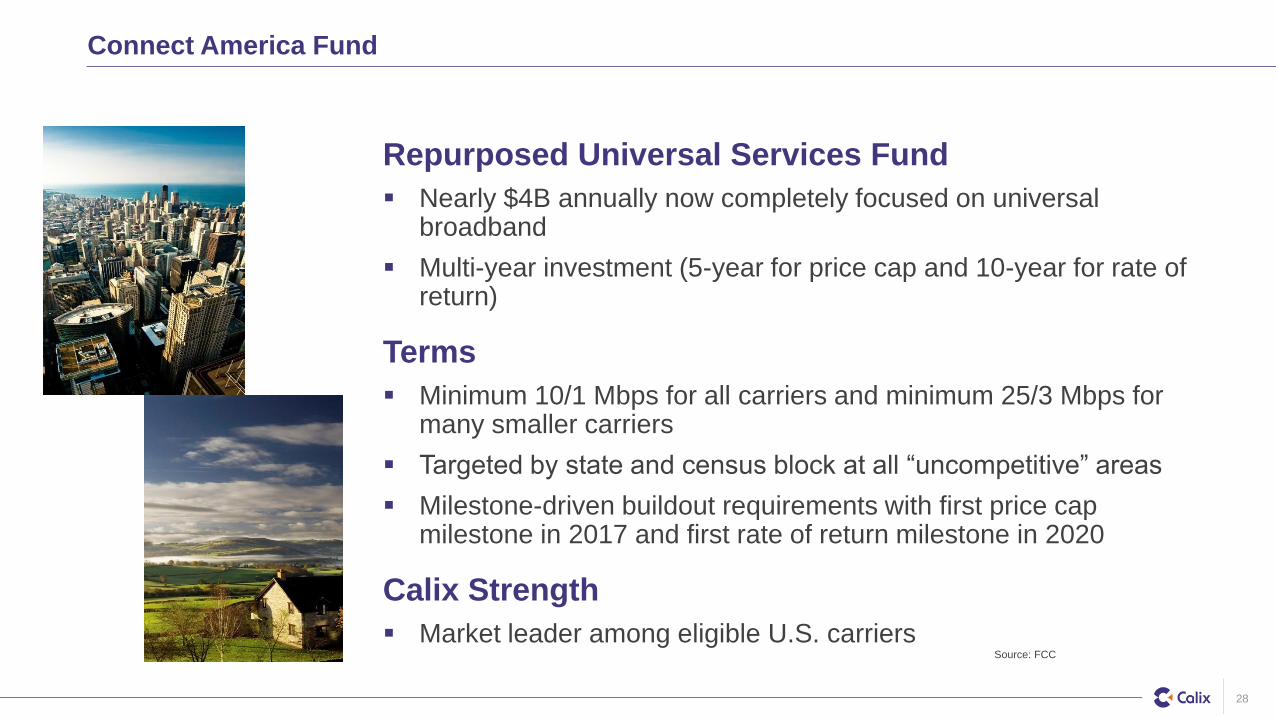
Connect America Fund
Repurposed Universal Services Fund
▪ Nearly $4B annually now completely focused on universal broadband
▪ Multi-year investment (5-year for price cap and 10-year for rate of return)
Terms
▪ Minimum 10/1 Mbps for all carriers and minimum 25/3 Mbps for many smaller carriers
▪ Targeted by state and census block at all “uncompetitive” areas
▪ Milestone-driven buildout requirements with first price cap milestone in 2017 and first rate of return milestone in 2020
Calix Strength
▪ Market leader among eligible U.S. carriers
28
Source: FCC

Financials
29
Proprietary and Confidential
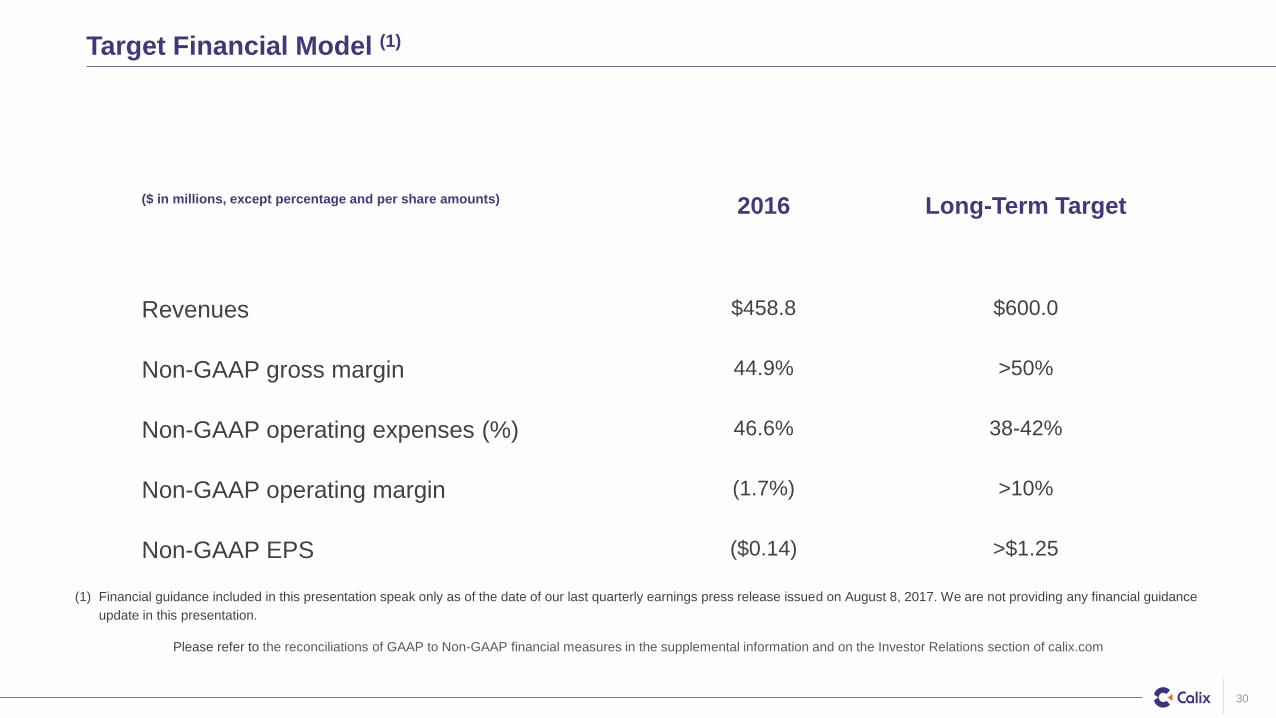
Target Financial Model (1)
($ in millions, except percentage and per share amounts) 2016 Long-Term Target
Revenues $458.8 $600.0
Non-GAAP gross margin 44.9% >50%
Non-GAAP operating expenses (%) 46.6% 38-42%
Non-GAAP operating margin (1.7%) >10%
Non-GAAP EPS ($0.14) >$1.25
30
Please refer to the reconciliations of GAAP to Non-GAAP financial measures in the supplemental information and on the Investor Relations section of calix.com
(1) Financial guidance included in this presentation speak only as of the date of our last quarterly earnings press release issued on August 8, 2017. We are not providing any financial guidance
update in this presentation.
Proprietary and Confidential
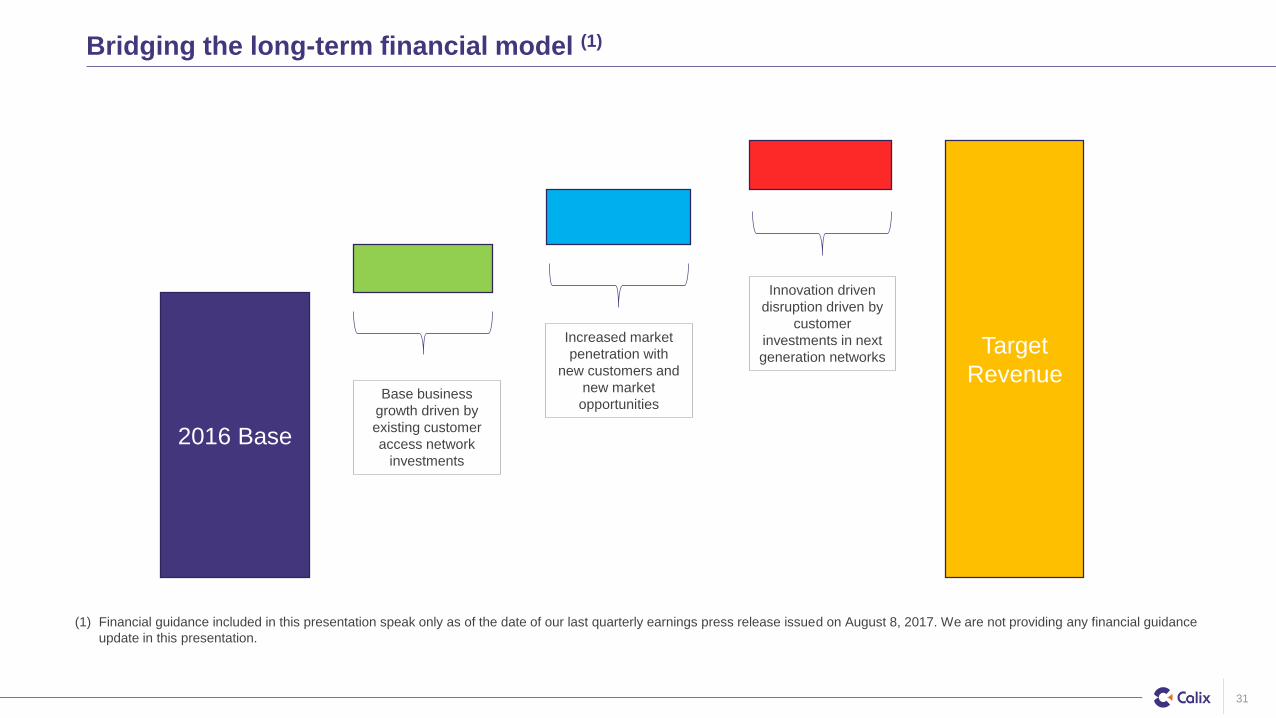
Bridging the long-term financial model (1)
2016 Base
Target
RevenueBase business
growth driven by
existing customer
access network
investments
Increased market
penetration with
new customers and
new market
opportunities
Innovation driven
disruption driven by
customer
investments in next
generation networks
31
(1) Financial guidance included in this presentation speak only as of the date of our last quarterly earnings press release issued on August 8, 2017. We are not providing any financial guidance
update in this presentation.
Proprietary and Confidential
Q2 2017 Highlights
Record second quarter revenue with growth of +17% y/y
Product revenue growth of +7% y/y and service revenue growth of +158% y/y
Higher than anticipated cost to complete previously-awarded projects impacted service margin
Key Calix innovations launched led by enhancements to AXOS and Calix Cloud with initial deployments to customers throughout the remainder of 2017
32
Proprietary and Confidential
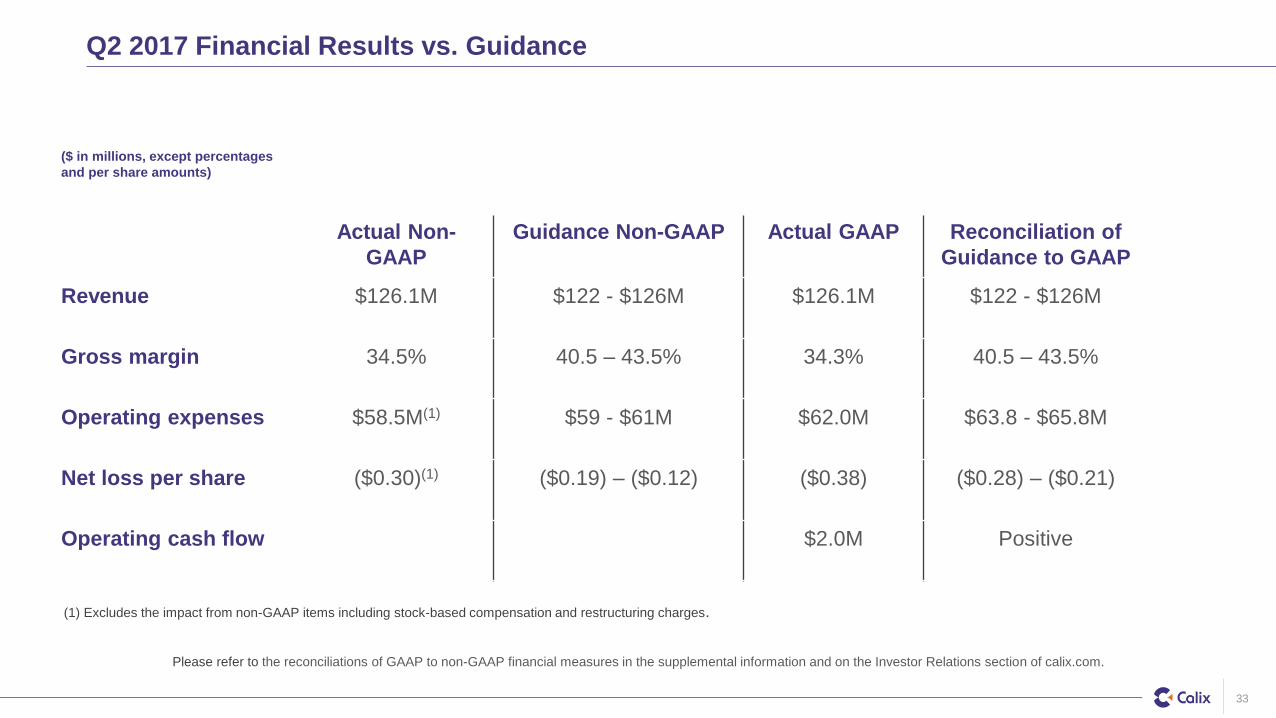
Q2 2017 Financial Results vs. Guidance
33
Please refer to the reconciliations of GAAP to non-GAAP financial measures in the supplemental information and on the Investor Relations section of calix.com.
($ in millions, except percentages
and per share amounts)
Actual Non-
GAAP
Guidance Non-GAAP Actual GAAP Reconciliation of
Guidance to GAAP
Revenue $126.1M $122 - $126M $126.1M $122 - $126M
Gross margin 34.5% 40.5 – 43.5% 34.3% 40.5 – 43.5%
Operating expenses $58.5M(1) $59 - $61M $62.0M $63.8 - $65.8M
Net loss per share ($0.30)(1) ($0.19) – ($0.12) ($0.38) ($0.28) – ($0.21)
Operating cash flow $2.0M Positive
(1) Excludes the impact from non-GAAP items including stock-based compensation and restructuring charges.
Proprietary and Confidential
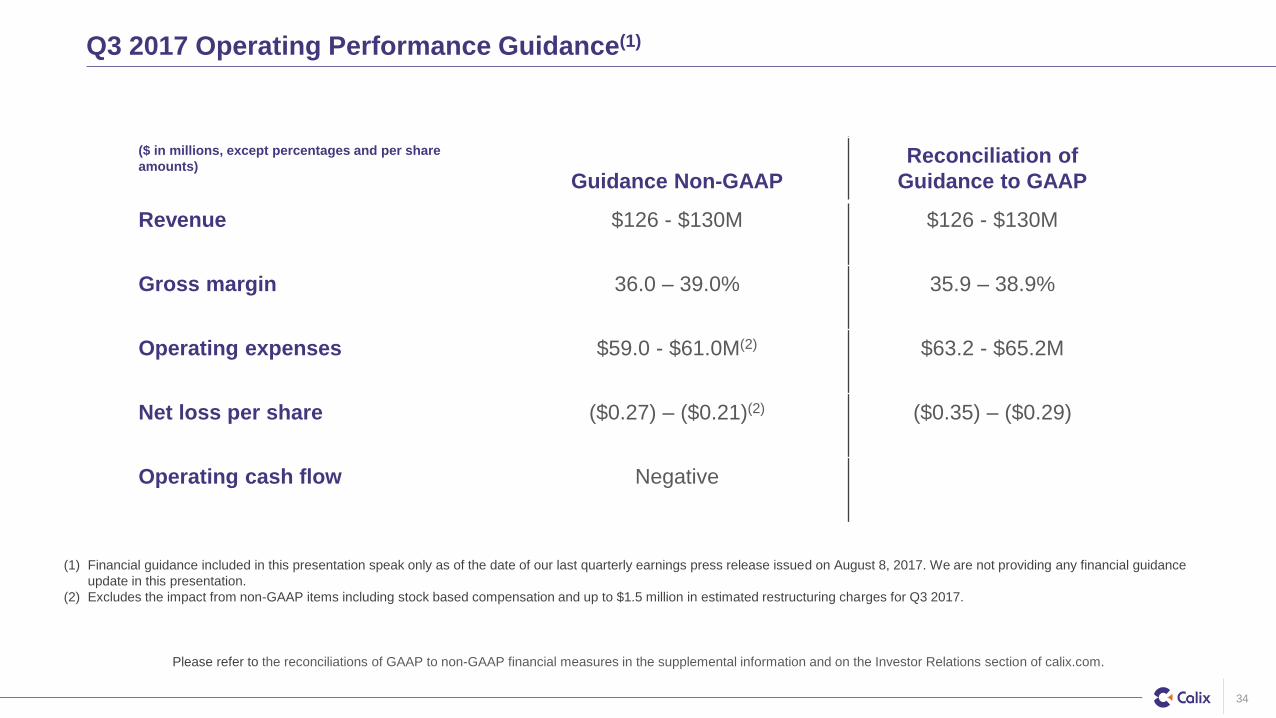
Q3 2017 Operating Performance Guidance(1)
34
($ in millions, except percentages and per share
amounts)
Guidance Non-GAAP
Reconciliation of
Guidance to GAAP
Revenue $126 - $130M $126 - $130M
Gross margin 36.0 – 39.0% 35.9 – 38.9%
Operating expenses $59.0 - $61.0M(2) $63.2 - $65.2M
Net loss per share ($0.27) – ($0.21)(2) ($0.35) – ($0.29)
Operating cash flow Negative
Please refer to the reconciliations of GAAP to non-GAAP financial measures in the supplemental information and on the Investor Relations section of calix.com.
(1) Financial guidance included in this presentation speak only as of the date of our last quarterly earnings press release issued on August 8, 2017. We are not providing any financial guidance
update in this presentation.
(2) Excludes the impact from non-GAAP items including stock based compensation and up to $1.5 million in estimated restructuring charges for Q3 2017.
Proprietary and Confidential
2017 Full Year Operating Performance Guidance(1)
At least 10% year over year revenue growth
Higher non-GAAP net loss than reported in 2016(2)
35
Please refer to the reconciliations of GAAP to non-GAAP financial measures in the supplemental information and on the Investor Relations section of calix.com.
(1) Financial guidance included in this presentation speak only as of the date of our last quarterly earnings press release issued on August 8, 2017. We are not providing any financial guidance
update in this presentation.
(2) Excludes the impact from non-GAAP items including stock based compensation and up to $1.5 million in estimated restructuring charges for Q3 2017.

Q&A
36
Proprietary and Confidential
Additional Information
Additional information available at http://investor-relations.calix.com/
• Stock Information
• News & Financial Information
• Events & Presentations
• Leadership & Governance
• Investor Resources
37

Supplemental Information
38
Proprietary and Confidential
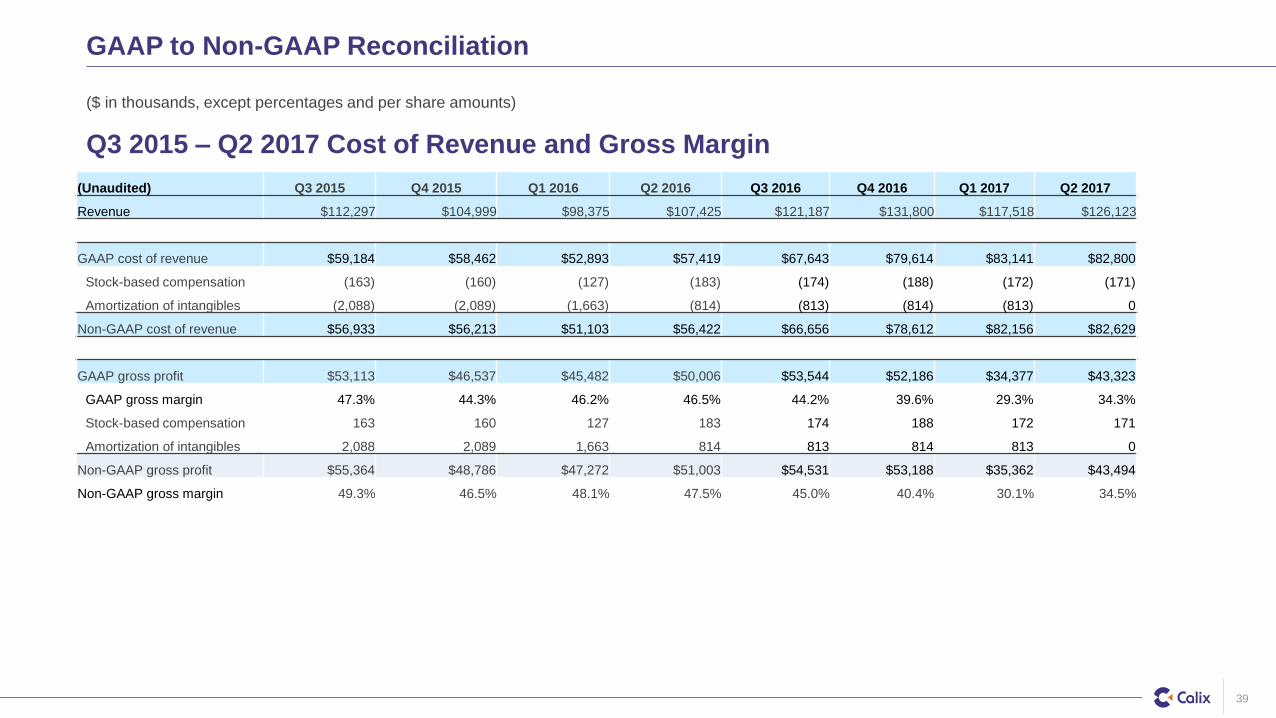
GAAP to Non-GAAP Reconciliation
39
(Unaudited) Q3 2015 Q4 2015 Q1 2016 Q2 2016 Q3 2016 Q4 2016 Q1 2017 Q2 2017
Revenue $112,297 $104,999 $98,375 $107,425 $121,187 $131,800 $117,518 $126,123
GAAP cost of revenue $59,184 $58,462 $52,893 $57,419 $67,643 $79,614 $83,141 $82,800
Stock-based compensation (163) (160) (127) (183) (174) (188) (172) (171)
Amortization of intangibles (2,088) (2,089) (1,663) (814) (813) (814) (813) 0
Non-GAAP cost of revenue $56,933 $56,213 $51,103 $56,422 $66,656 $78,612 $82,156 $82,629
GAAP gross profit $53,113 $46,537 $45,482 $50,006 $53,544 $52,186 $34,377 $43,323
GAAP gross margin 47.3% 44.3% 46.2% 46.5% 44.2% 39.6% 29.3% 34.3%
Stock-based compensation 163 160 127 183 174 188 172 171
Amortization of intangibles 2,088 2,089 1,663 814 813 814 813 0
Non-GAAP gross profit $55,364 $48,786 $47,272 $51,003 $54,531 $53,188 $35,362 $43,494
Non-GAAP gross margin 49.3% 46.5% 48.1% 47.5% 45.0% 40.4% 30.1% 34.5%
Q3 2015 – Q2 2017 Cost of Revenue and Gross Margin
($ in thousands, except percentages and per share amounts)
Proprietary and Confidential
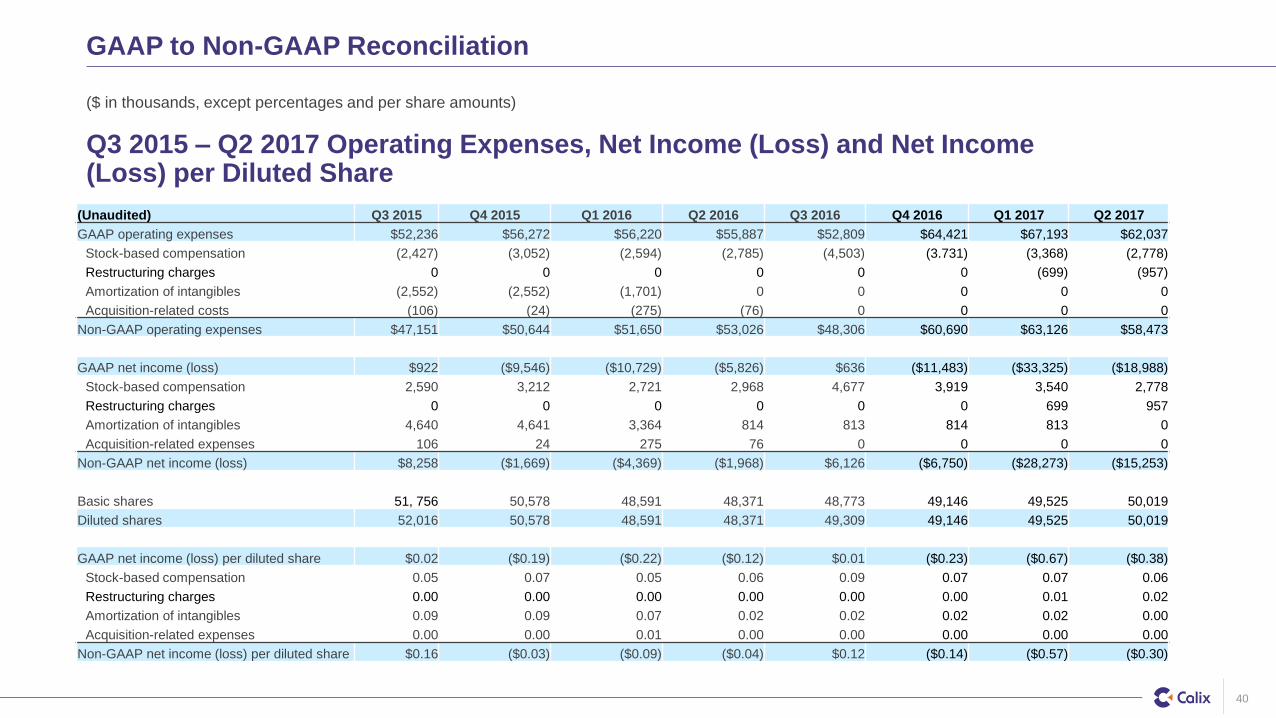
GAAP to Non-GAAP Reconciliation
40
(Unaudited) Q3 2015 Q4 2015 Q1 2016 Q2 2016 Q3 2016 Q4 2016 Q1 2017 Q2 2017
GAAP operating expenses $52,236 $56,272 $56,220 $55,887 $52,809 $64,421 $67,193 $62,037
Stock-based compensation (2,427) (3,052) (2,594) (2,785) (4,503) (3.731) (3,368) (2,778)
Restructuring charges 0 0 0 0 0 0 (699) (957)
Amortization of intangibles (2,552) (2,552) (1,701) 0 0 0 0 0
Acquisition-related costs (106) (24) (275) (76) 0 0 0 0
Non-GAAP operating expenses $47,151 $50,644 $51,650 $53,026 $48,306 $60,690 $63,126 $58,473
GAAP net income (loss) $922 ($9,546) ($10,729) ($5,826) $636 ($11,483) ($33,325) ($18,988)
Stock-based compensation 2,590 3,212 2,721 2,968 4,677 3,919 3,540 2,778
Restructuring charges 0 0 0 0 0 0 699 957
Amortization of intangibles 4,640 4,641 3,364 814 813 814 813 0
Acquisition-related expenses 106 24 275 76 0 0 0 0
Non-GAAP net income (loss) $8,258 ($1,669) ($4,369) ($1,968) $6,126 ($6,750) ($28,273) ($15,253)
Basic shares 51, 756 50,578 48,591 48,371 48,773 49,146 49,525 50,019
Diluted shares 52,016 50,578 48,591 48,371 49,309 49,146 49,525 50,019
GAAP net income (loss) per diluted share $0.02 ($0.19) ($0.22) ($0.12) $0.01 ($0.23) ($0.67) ($0.38)
Stock-based compensation 0.05 0.07 0.05 0.06 0.09 0.07 0.07 0.06
Restructuring charges 0.00 0.00 0.00 0.00 0.00 0.00 0.01 0.02
Amortization of intangibles 0.09 0.09 0.07 0.02 0.02 0.02 0.02 0.00
Acquisition-related expenses 0.00 0.00 0.01 0.00 0.00 0.00 0.00 0.00
Non-GAAP net income (loss) per diluted share $0.16 ($0.03) ($0.09) ($0.04) $0.12 ($0.14) ($0.57) ($0.30)
Q3 2015 – Q2 2017 Operating Expenses, Net Income (Loss) and Net Income (Loss) per Diluted Share
($ in thousands, except percentages and per share amounts)
Proprietary and Confidential
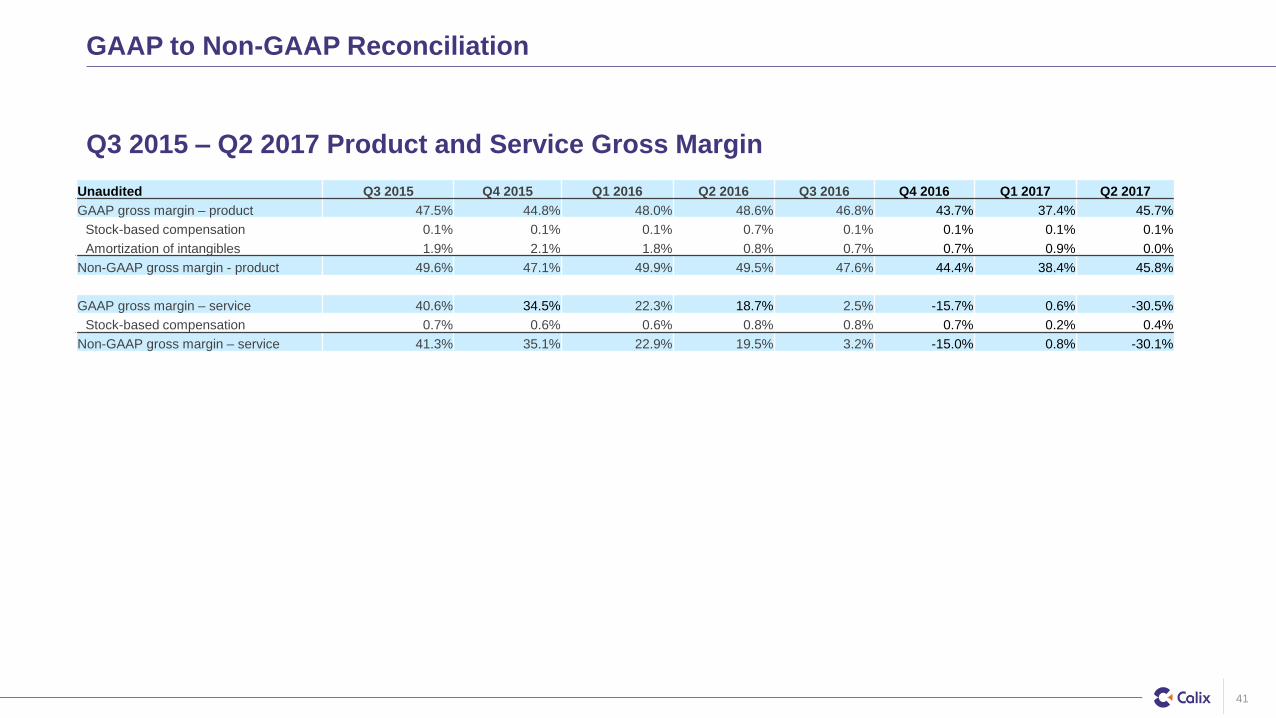
Unaudited Q3 2015 Q4 2015 Q1 2016 Q2 2016 Q3 2016 Q4 2016 Q1 2017 Q2 2017
GAAP gross margin – product 47.5% 44.8% 48.0% 48.6% 46.8% 43.7% 37.4% 45.7%
Stock-based compensation 0.1% 0.1% 0.1% 0.7% 0.1% 0.1% 0.1% 0.1%
Amortization of intangibles 1.9% 2.1% 1.8% 0.8% 0.7% 0.7% 0.9% 0.0%
Non-GAAP gross margin - product 49.6% 47.1% 49.9% 49.5% 47.6% 44.4% 38.4% 45.8%
GAAP gross margin – service 40.6% 34.5% 22.3% 18.7% 2.5% -15.7% 0.6% -30.5%
Stock-based compensation 0.7% 0.6% 0.6% 0.8% 0.8% 0.7% 0.2% 0.4%
Non-GAAP gross margin – service 41.3% 35.1% 22.9% 19.5% 3.2% -15.0% 0.8% -30.1%
GAAP to Non-GAAP Reconciliation
41
Q3 2015 – Q2 2017 Product and Service Gross Margin
Proprietary and Confidential
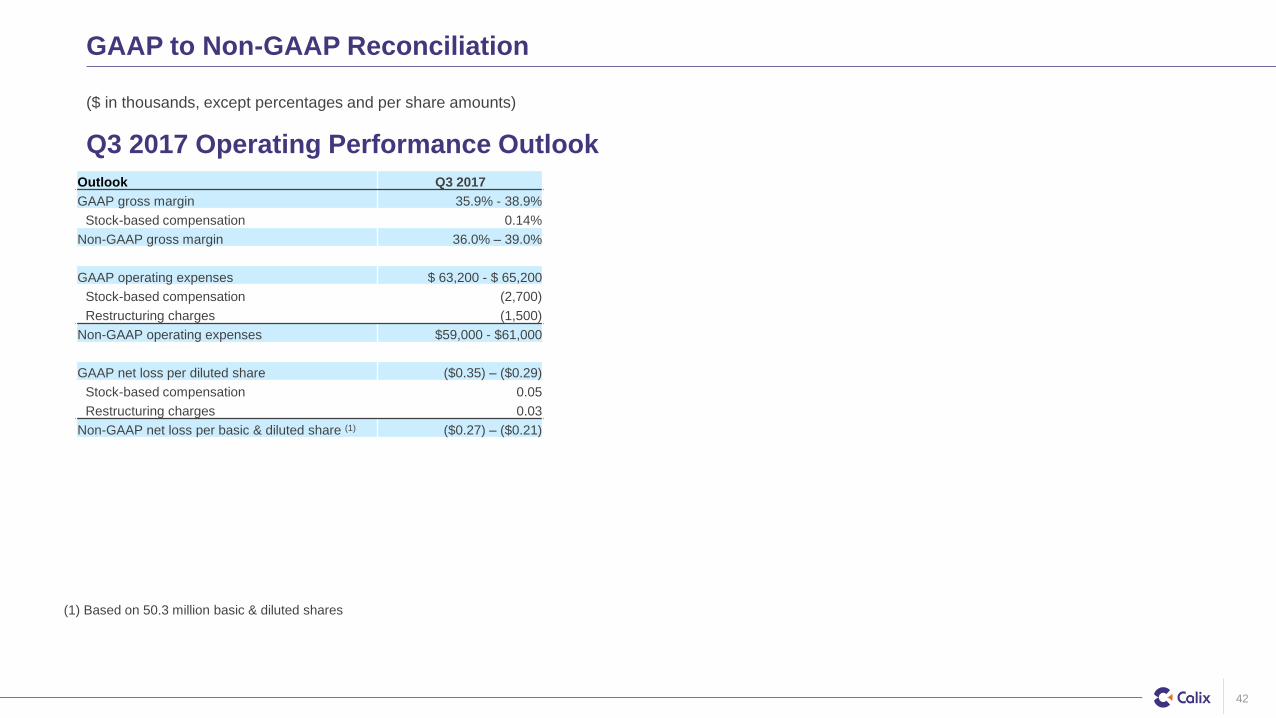
Outlook Q3 2017
GAAP gross margin 35.9% - 38.9%
Stock-based compensation 0.14%
Non-GAAP gross margin 36.0% – 39.0%
GAAP operating expenses $ 63,200 - $ 65,200
Stock-based compensation (2,700)
Restructuring charges (1,500)
Non-GAAP operating expenses $59,000 - $61,000
GAAP net loss per diluted share ($0.35) – ($0.29)
Stock-based compensation 0.05
Restructuring charges 0.03
Non-GAAP net loss per basic & diluted share (1) ($0.27) – ($0.21)
GAAP to Non-GAAP Reconciliation
42
Q3 2017 Operating Performance Outlook
(1) Based on 50.3 million basic & diluted shares
($ in thousands, except percentages and per share amounts)
Proprietary and Confidential
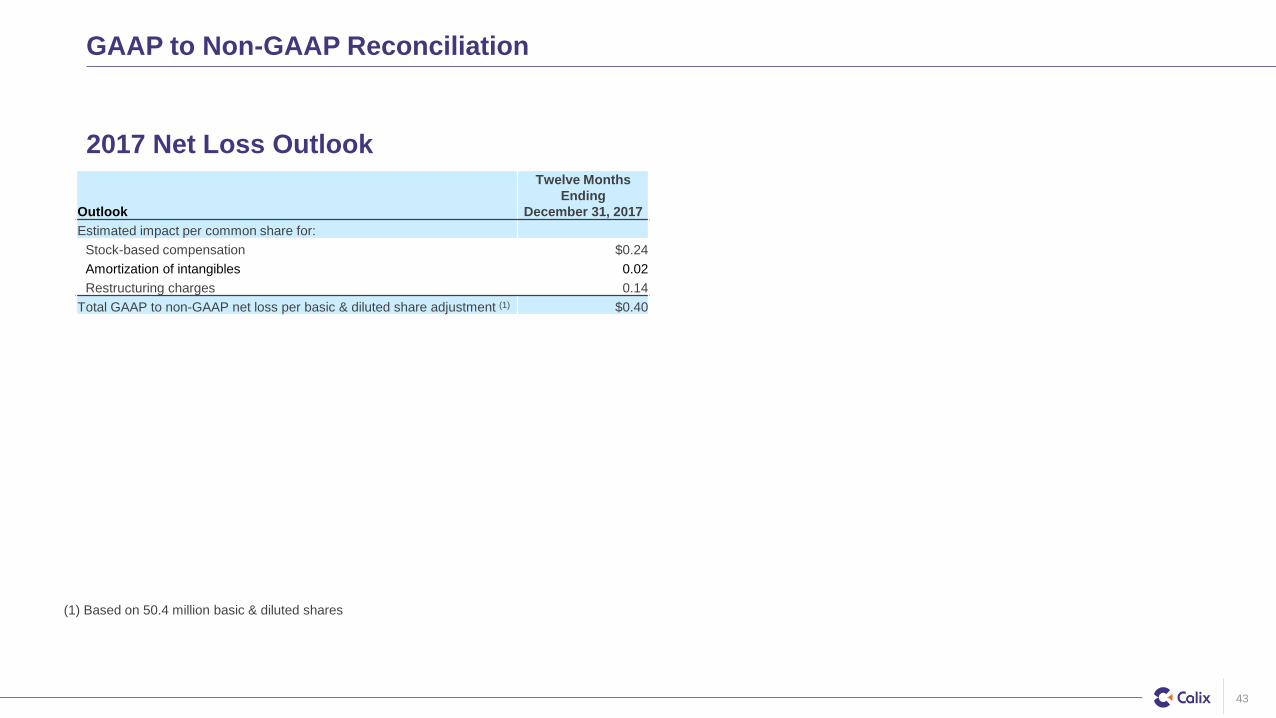
Outlook
Twelve Months
Ending
December 31, 2017
Estimated impact per common share for:
Stock-based compensation $0.24
Amortization of intangibles 0.02
Restructuring charges 0.14
Total GAAP to non-GAAP net loss per basic & diluted share adjustment (1) $0.40
GAAP to Non-GAAP Reconciliation
43
2017 Net Loss Outlook
(1) Based on 50.4 million basic & diluted shares
Recommended